
Spatial Disparity of Visitors Changes during Particulate Matter Warning Using Big Data Focused on Seoul, Korea

Abstract
:1. Introduction
2. Literature Review
3. Materials and Methods
3.1. Research Sites and Research Scope
3.2. Using Big Data of the de Facto Population to Identify Visitor Activity
3.3. Days with High PM Concentrations and Control Days
3.4. Spatial Analysis and Logistic Regression Model
4. Results
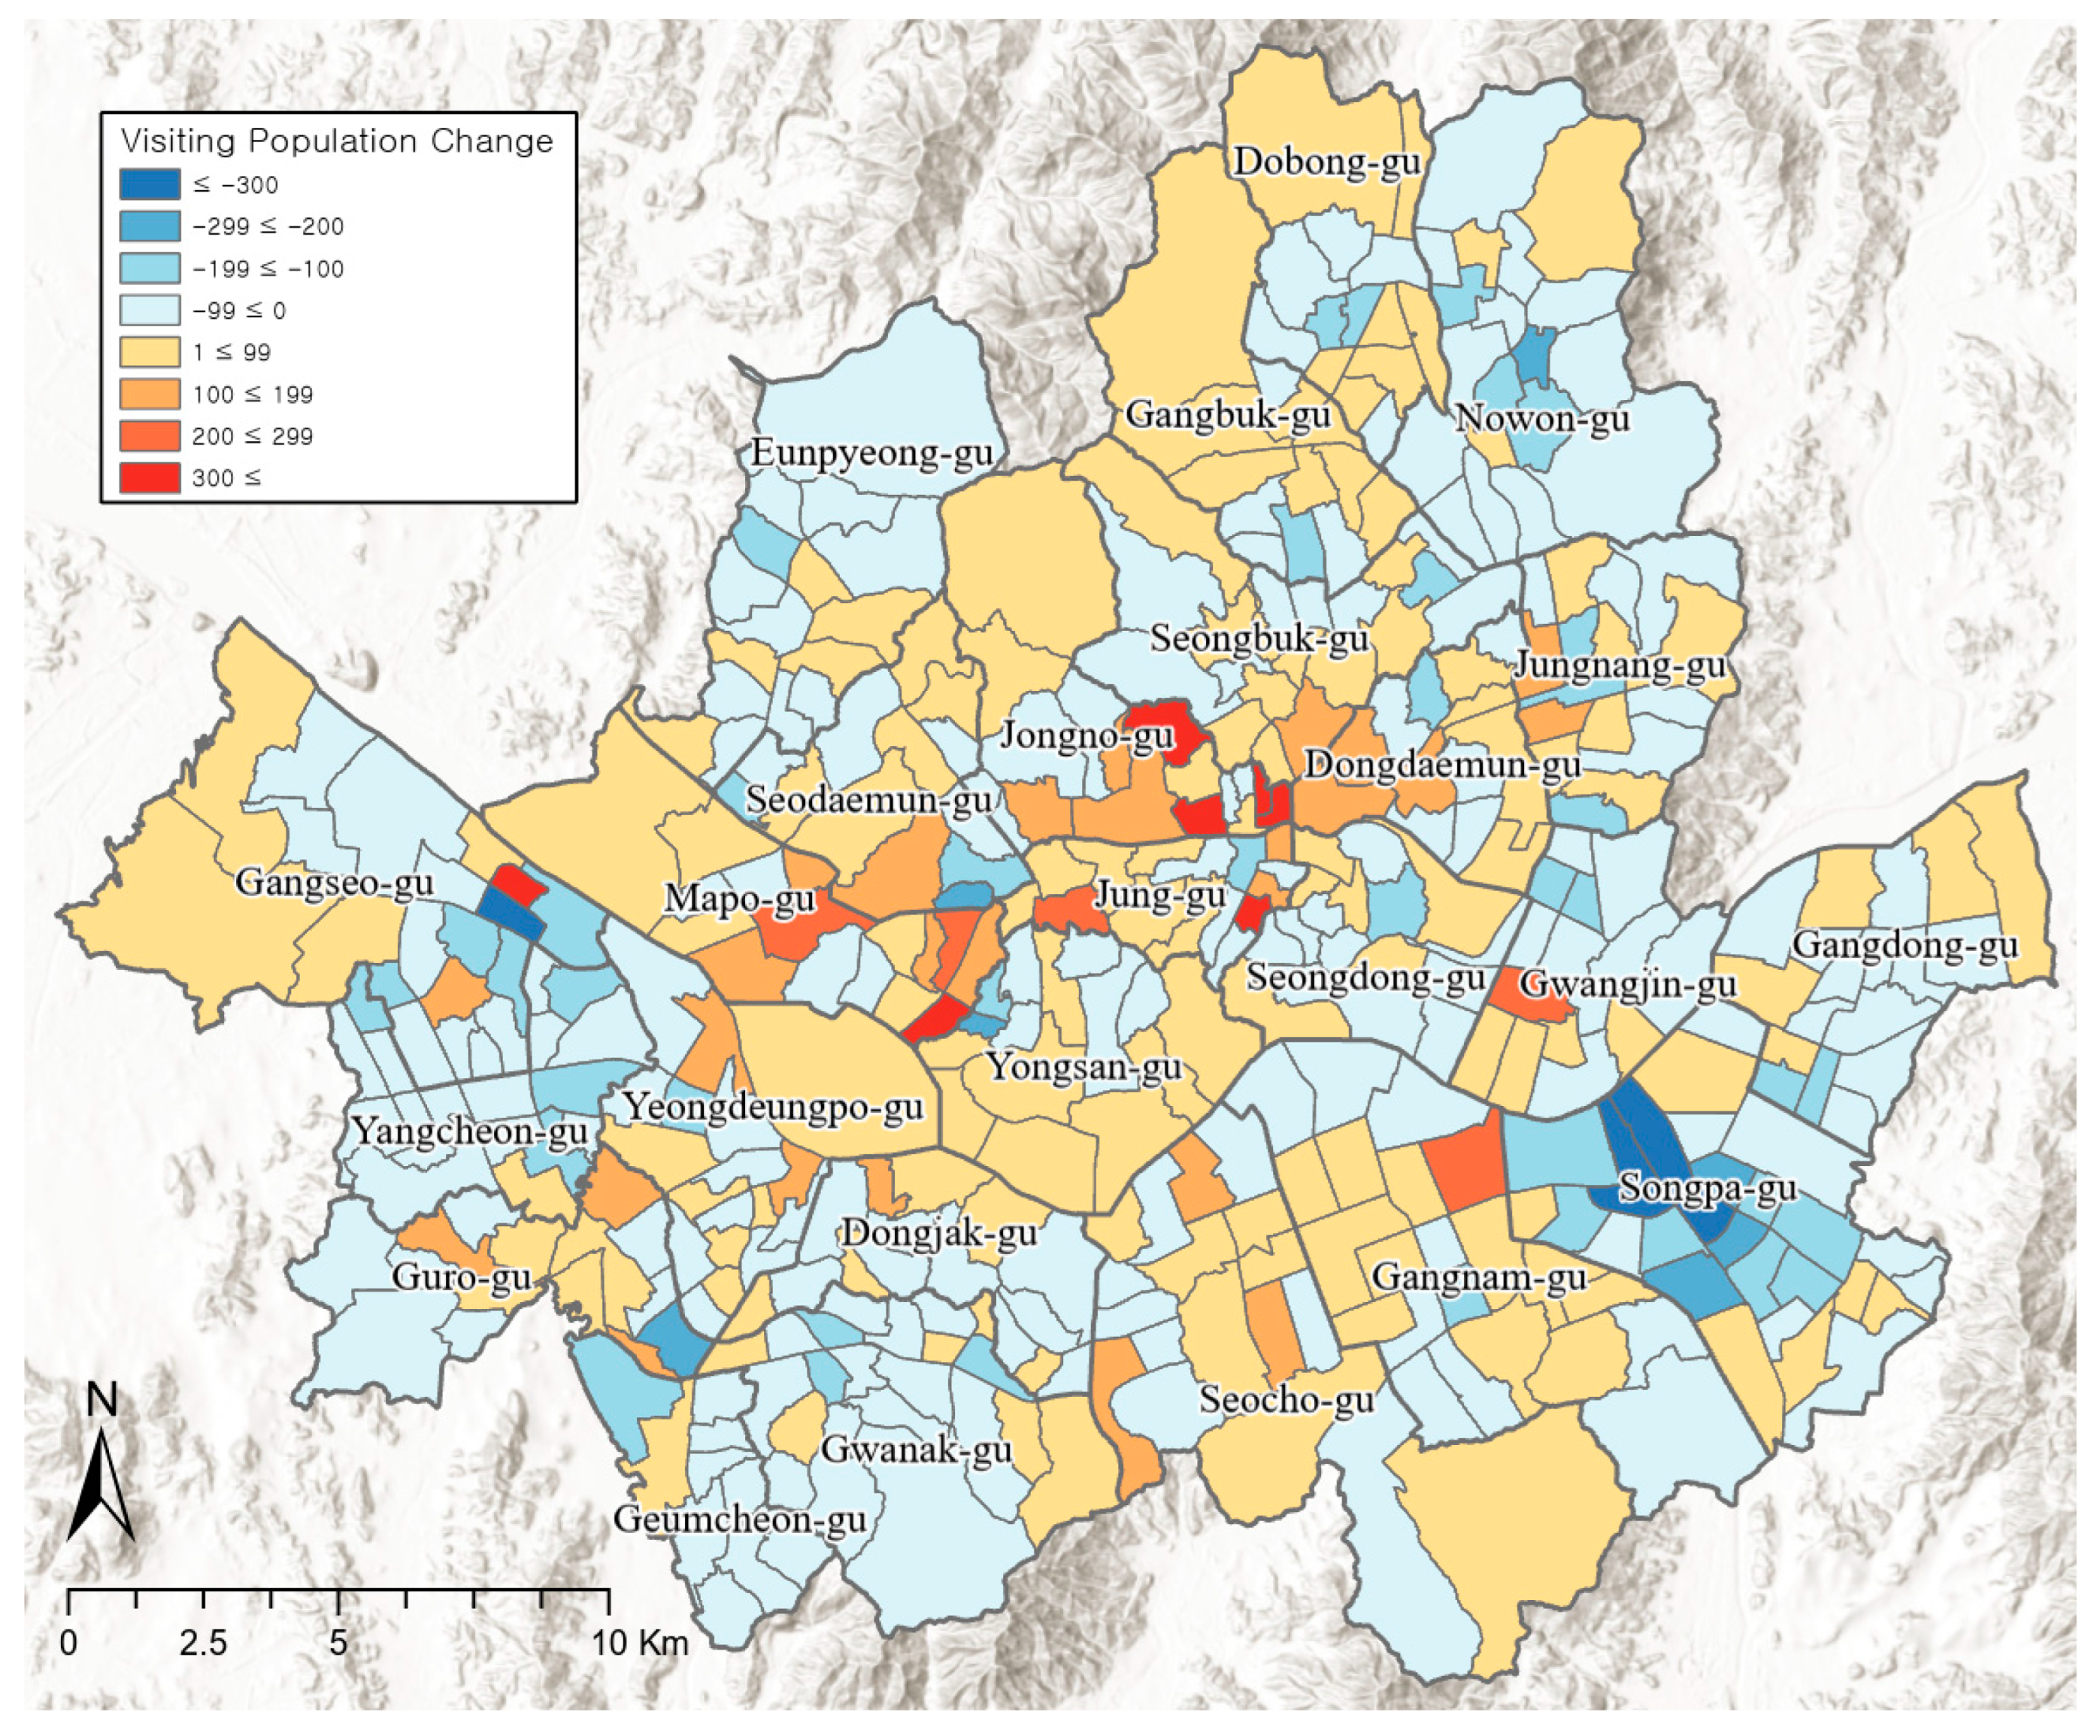
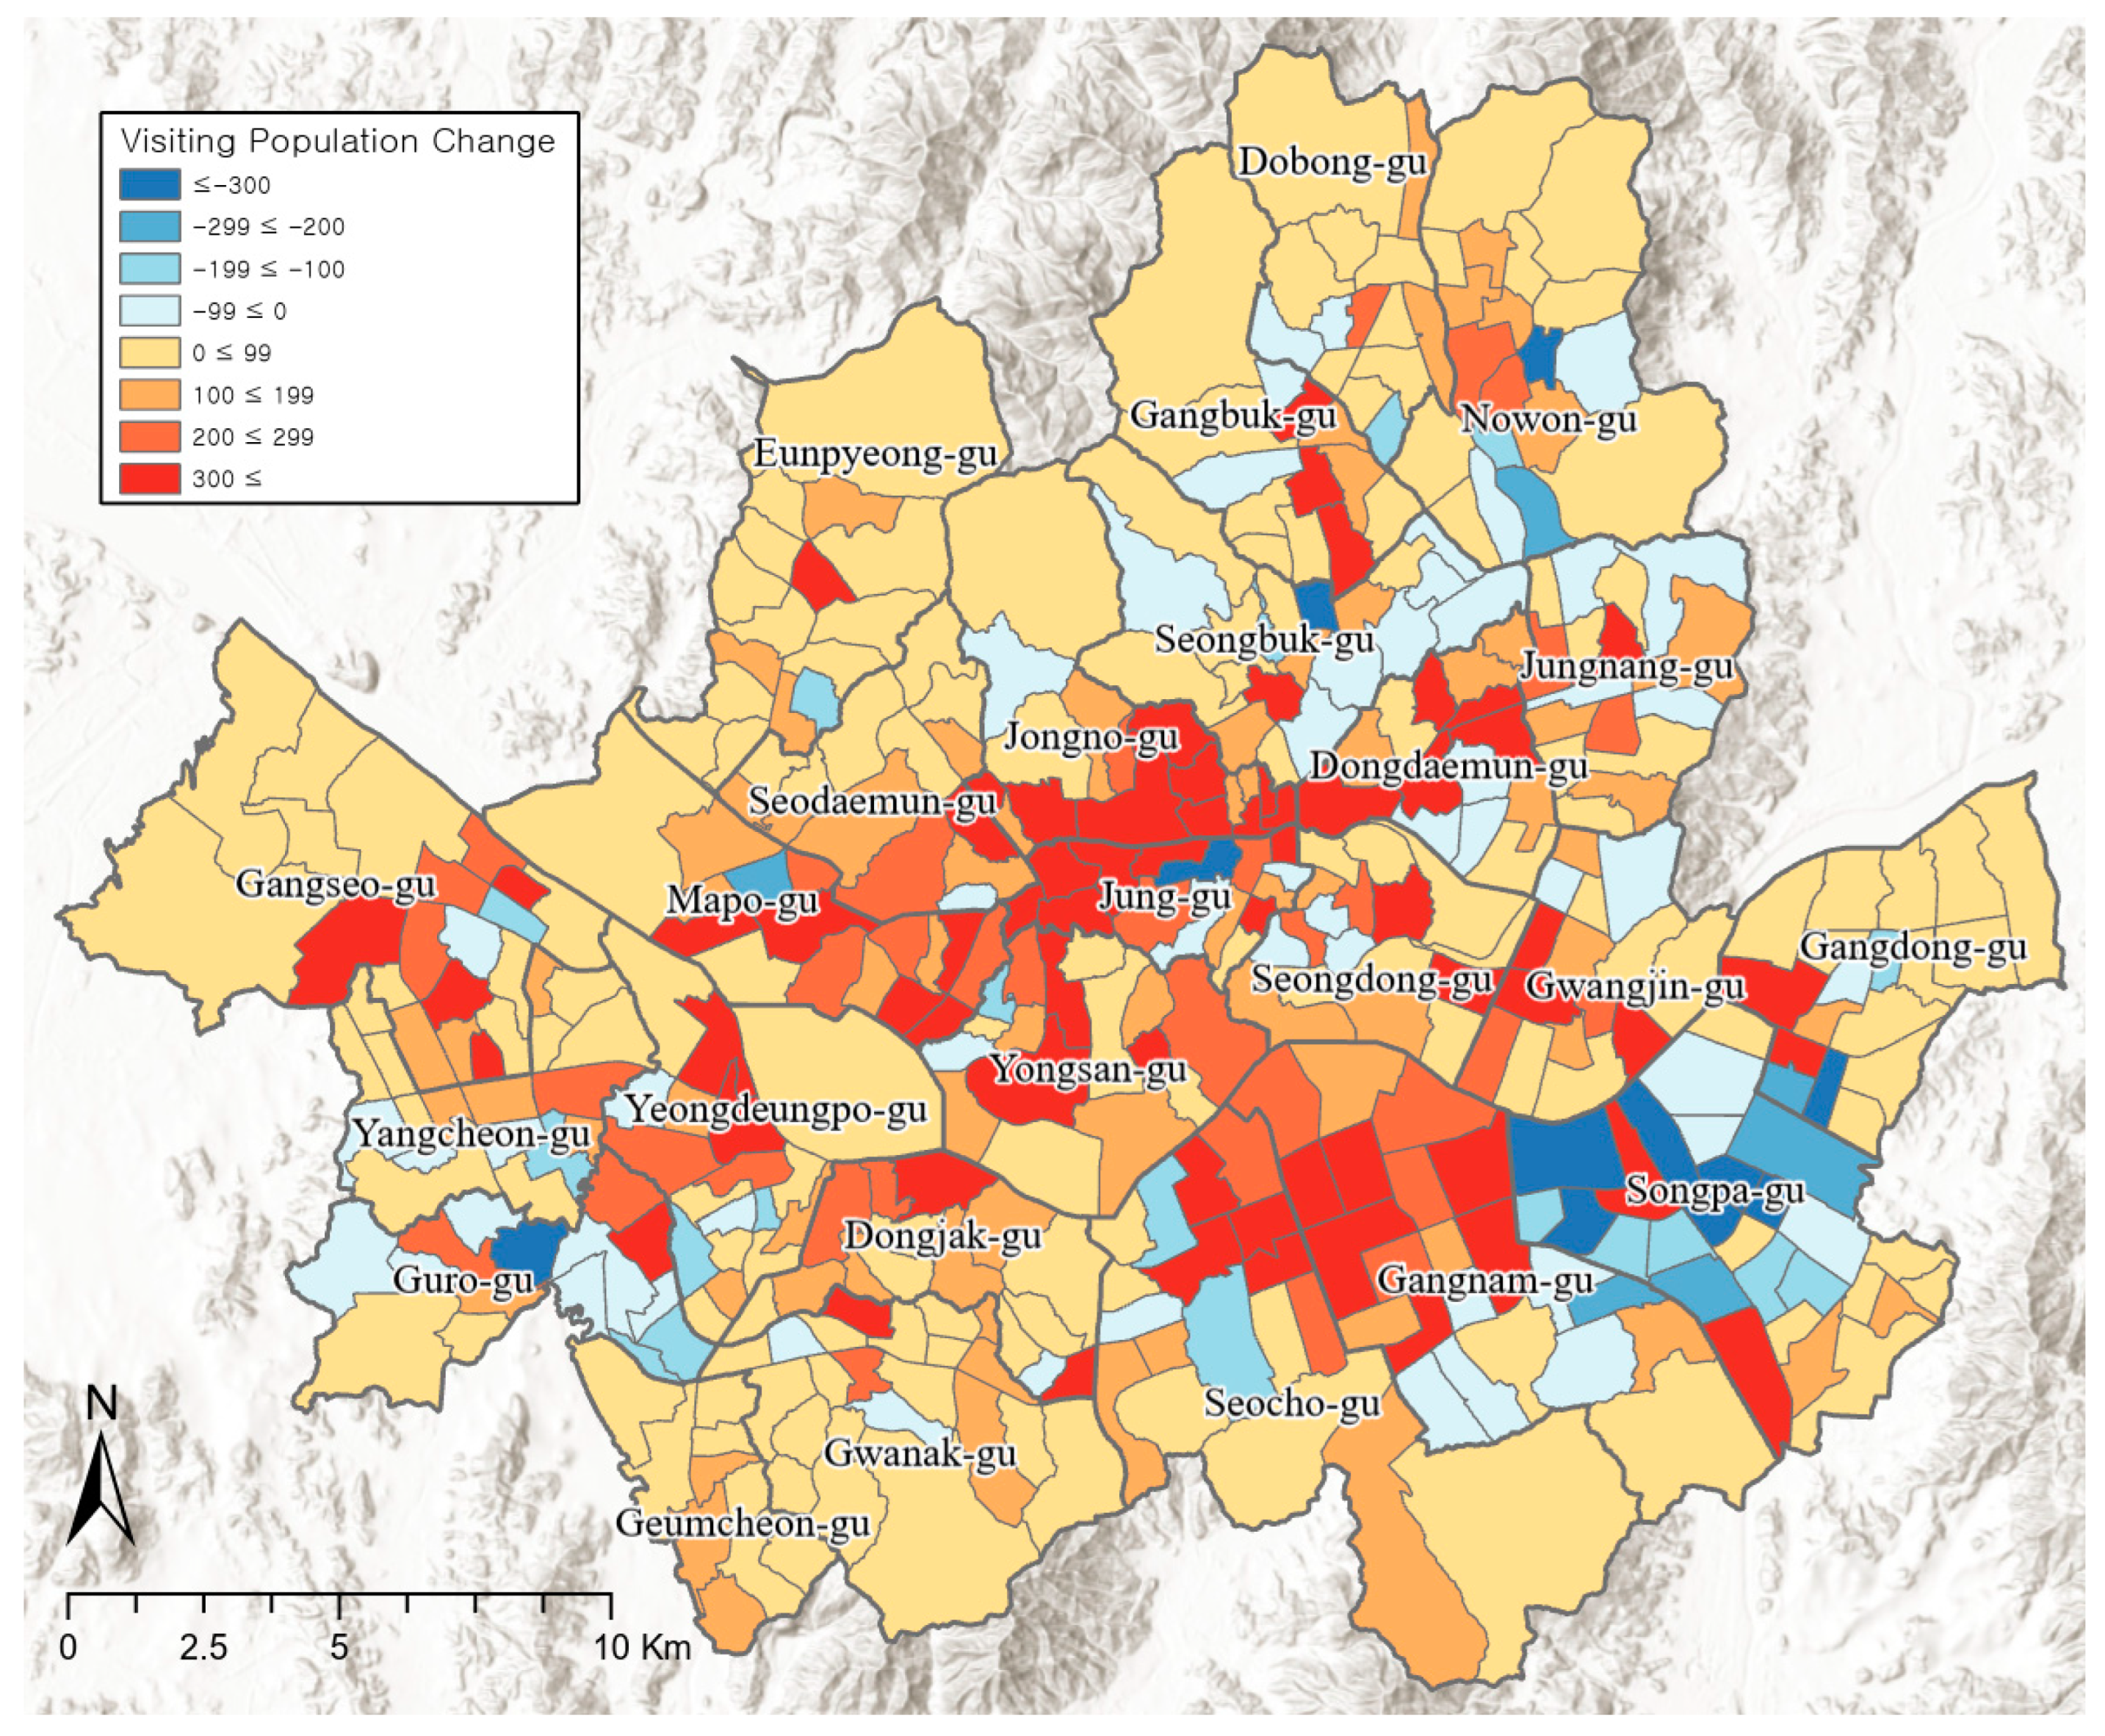
4.1. Changes in Visiting Population during High PM Concentrations
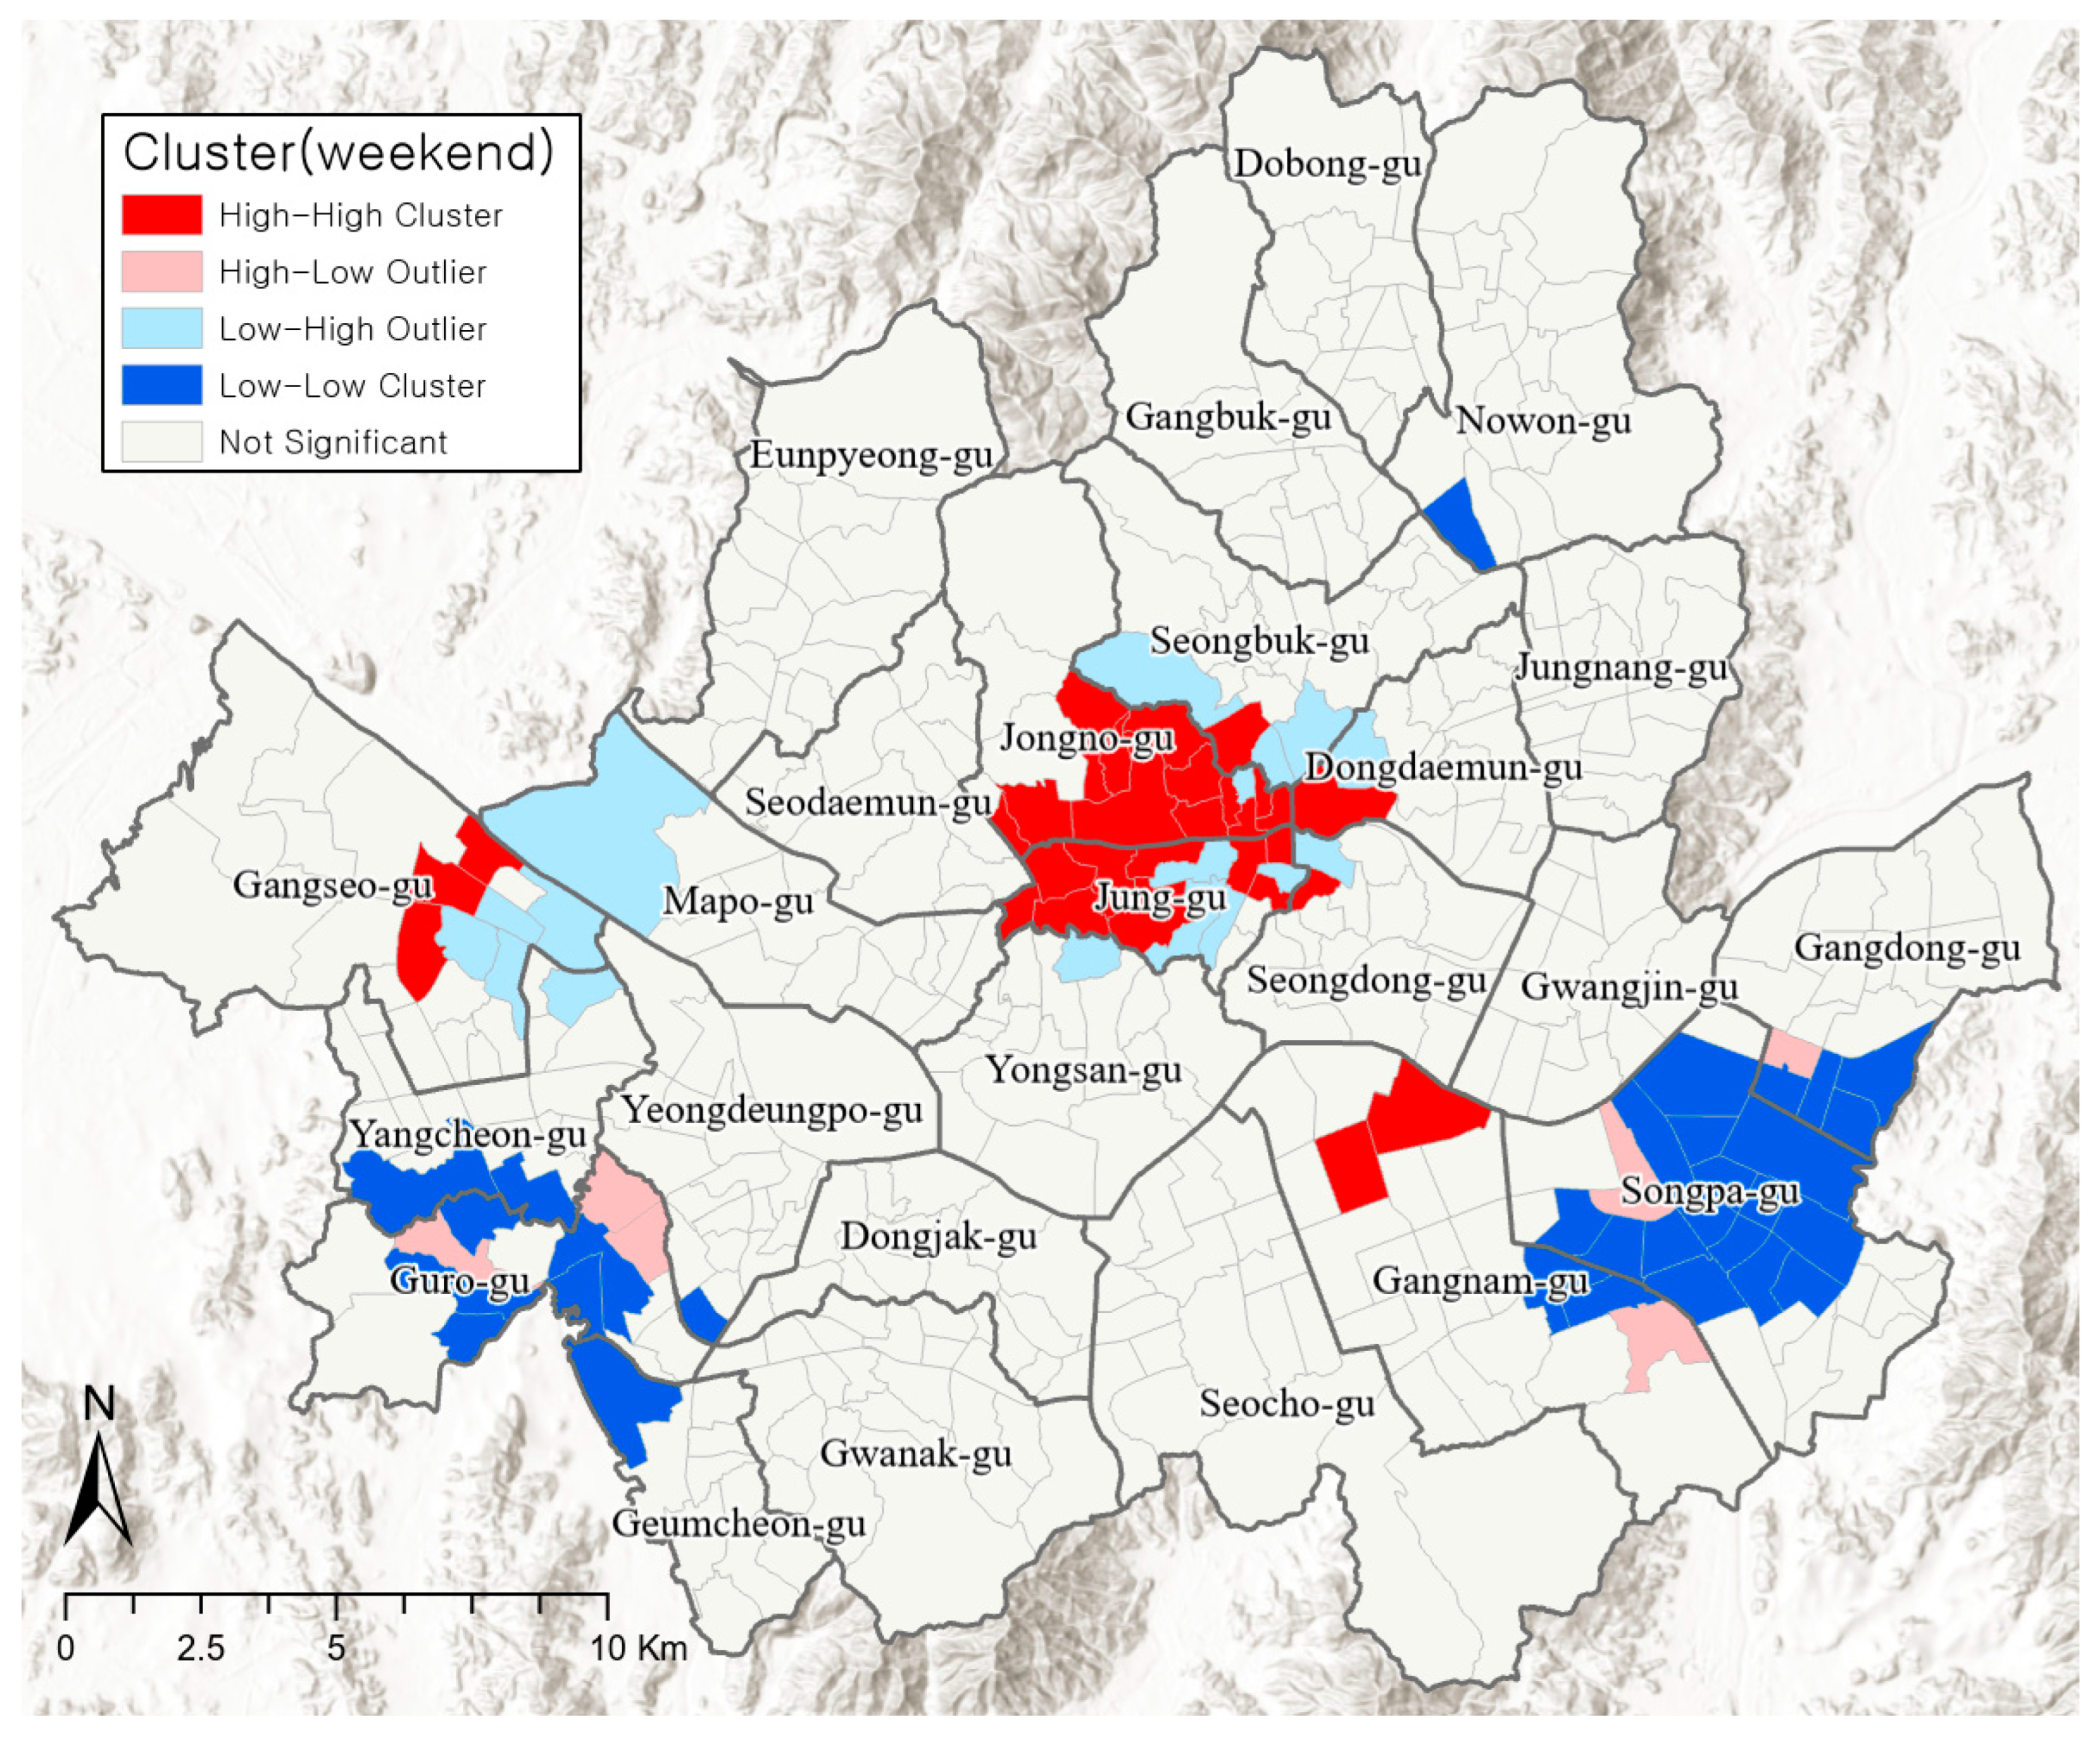
4.2. Spatial Pattern of Visiting Population Changes in High PM Concentrations
4.3. Analysis of Factors Affecting Clusters Showing Visiting Population Changes
5. Discussion and Conclusions
Author Contributions
Funding
Institutional Review Board Statement
Informed Consent Statement
Data Availability Statement
Conflicts of Interest
References
- Ahn, S.E.; Jun, H.C. KEI Focus 2018 National Environmental Awareness Survey; Korea Environment Institute: Yeongi-gun, Korea, 2018. [Google Scholar]
- Lee, S.B. Research Trends on the Effects of Fine Dust on the Human Body; View: Brain Research Imaging Center: Plymouth, UK, 2019. [Google Scholar]
- Um, Y.S.; Oh, H.N. Health risks from particulate matters (PM10) and averting behavior: Evidence from the reduction of outdoor leisure activities. Korean J. Econ. Stud. 2019, 67, 39–70. [Google Scholar]
- Yan, L.; Duarte, F.; Wang, D.; Zheng, S.; Ratti, C. Exploring the effect of air pollution on social activity in China using geotagged social media check-in data. Cities 2019, 91, 116–125. [Google Scholar] [CrossRef]
- Guo, C.; Bo, Y.; Chan, T.; Zhang, Z.; Lin, C.; Tam, T.; Lau, A.K.; Chang, L.; Hoek, G.; Lao, X.Q. Does fine particulate matter (PM2.5) affect the benefits of habitual physical activity on lung function in adults: A longitudinal cohort study. BMC Med. 2020, 18, 134. [Google Scholar] [CrossRef] [PubMed]
- Kang, H.; Suh, H.; Yu, J. Does air pollution affect consumption behavior? Evidence from Korean Retail Sales. Asian Econ. J. 2019, 33, 235–251. [Google Scholar] [CrossRef]
- Kim, Y.L. Data-driven approach to characterize urban vitality: How spatiotemporal context dynamically defines Seoul’s nighttime. Int. J. Geogr. Inf. Sci. 2020, 34, 1235–1256. [Google Scholar] [CrossRef]
- De Nadai, M.; Staiano, J.; Larcher, R.; Sebe, N.; Quercia, D.; Lepri, B. The death and life of great Italian cities: A mobile phone data perspective. In Proceedings of the 25th International Conference on World Wide Web, Montreal, QC, Canada, 11–15 May 2016; International World Wide Web Conferences Steering Committee: Geneva, Switzerland, 2016; pp. 413–423. [Google Scholar]
- Sung, H.G.; Lee, S.G.; Cheon, S.H. Operationalizing Jane Jacobs’s urban design theory: Empirical verification from the great City of Seoul, Korea. J. Plan. Educ. Res. 2015, 35, 117–130. [Google Scholar] [CrossRef]
- Yue, Y.; Zhuang, Y.; Yeh, A.G.; Xie, J.; Ma, C.; Li, Q. Measurements of POI-based mixed use and their relationships with neighbourhood vibrancy. Int. J. Geogr. Inf. Sci. 2017, 31, 658–675. [Google Scholar] [CrossRef] [Green Version]
- Lynch, K. A Theory of Good City Form; MIT Press: Cambridge, MA, USA, 1981. [Google Scholar]
- Gehl, J. Life between Buildings: Using Public Space; Island Press: Washington, DC, USA, 2003. [Google Scholar]
- Jacobs, J. The Death and Life of Great American Cities; Vintage Books: New York, NY, USA, 1961. [Google Scholar]
- Lu, S.; Shi, C.; Yang, X. Impacts of Built Environment on Urban Vitality: Regression Analyses of Beijing and Chengdu, China. Int. J. Environ. Res. Public Health 2019, 16, 4592. [Google Scholar] [CrossRef] [Green Version]
- Im, H.N.; Lee, S.G.; Choi, C.G. Empirical Analysis of the Relationship between Land Use Mix and Pedestrian Volume in Seoul, Korea. JKPA 2016, 51, 21–38. [Google Scholar] [CrossRef]
- Tainio, M.; Andersen, J.Z.; Nieuwenhuijsen, M.J.; Hu, L.; de Nazelle, A.; An, R.; Garcia, L.; Goenka, S.; Zapata-Diomedi, B.; Bull, F.; et al. Air pollution, physical activity and health: A mapping review of the evidence. Environ. Int. 2021, 147, 105954. [Google Scholar] [CrossRef]
- Kim, S.J.; Park, H.R.; Lee, J.S. Effects of Perceived Air Pollution on the Negative Emotion, Physical Symptoms and Future Perspectives. J. Korea Conv. Soc. 2020, 11, 287–298. [Google Scholar]
- Gerking, S.; Stanley, L.R. An Economic Analysis of Air Pollution and Health: The Case of St. Louis. Rev. Econ. Stat. 1986, 68, 115–121. [Google Scholar] [CrossRef]
- Chen, D.R.; Lin, Y.C. Social identity, perceived urban neighborhood quality, and physical inactivity: A comparison study of China, Taiwan, and South Korea. Health Place 2016, 41, 1–10. [Google Scholar] [CrossRef] [PubMed]
- Lee, H.Y.; Kim, N.J. The Impact of Fine Particular Matter Risk Perception on the Outdoor Behavior of Recreationists: An Application of the Extended Theory of Planned Behavior. JTS 2017, 41, 27–44. [Google Scholar]
- Roberts, J.D.; Voss, J.D.; Knight, B. The Association of Ambient Air Pollution and Physical Inactivity in The United States. PLoS ONE 2014, 9, e90143. [Google Scholar]
- Wen, X.J.; Balluz, L.S.; Shire, J.D.; Mokdad, A.H.; Kohl, H.W. Association of self-reported leisure-time physical inactivity with particulate matter 2.5 air pollution. J. Environ. Health 2009, 72, 40–45. [Google Scholar]
- Alahmari, A.D.; Mackay, A.; Patel, A.; Kowlessar, B.S.; Singh, R.; Brill, S.; Allinson, J.; Wedzicha, J.; Donaldson, G. Influence of weather and atmospheric pollution on physical activity in patients with COPD. Resp. Res. 2015, 16, 71. [Google Scholar] [CrossRef] [Green Version]
- Kang, S.W.; Lee, D.H.; Jang, K.B.; Jin, D.Y.; Hong, H.U.; Han, K.J.; Kim, J.H.; Kang, S.A.; Kim, D.Y. Big Data Analysis: Application to Environmental Research and Service; Korea Environment Institute: Yeongi-gun, Korea, 2018. [Google Scholar]
- Ki, D.H.; Lee, S.G. Analysis on the Relationship between the Fine Dust Concentration and Subway Ridership for the Evaluation of Fine Dust Response Policies. JKPA 2019, 54, 79–93. [Google Scholar] [CrossRef]
- Chen, B.; Song, Y.; Jiang, T.; Chen, Z.; Huang, B.; Xu, B. Real-Time Estimation of Population Exposure to PM2.5 Using Mobile- and Station-Based Big Data. Int. J. Environ. Res. Public Health 2018, 15, 573. [Google Scholar] [CrossRef] [Green Version]
- Abdullah, S.; Ismail, M.; Ahmed, A.N.; Mansor, W.N.W. Big data analytics and artificial intelligence in air pollution studies for the prediction of particulate matter concentration. In Proceedings of the 3rd International Conference on Telecommunications and Communication Engineering, Tokyo, Japan, 9–12 November 2019; pp. 90–94. [Google Scholar]
- Lim, Y.B.; Aliyu, I.; Lim, C.G. Air pollution matter prediction using recurrent neural networks with sequential data. In Proceedings of the 2019 3rd International Conference on Intelligent Systems, Metaheuristics & Swarm Intelligence, Malé, Maldives, 23–24 March 2019; pp. 40–44. [Google Scholar]
- Apte, J.S.; Messier, K.P.; Gani, S.; Brauer, M.; Kirchstetter, T.W.; Lunden, M.M.; Hamburg, S.P. High-resolution air pollution mapping with Google street view cars: Exploiting big data. Environ. Sci. Technol. 2017, 51, 6999–7008. [Google Scholar] [CrossRef]
- Kang, G.K.; Gao, J.Z.; Chiao, S.; Lu, S.; Xie, G. Air quality prediction: Big data and machine learning approaches. Int. J. Environ. Sci. Dev. 2018, 9, 8–16. [Google Scholar] [CrossRef] [Green Version]
- Yang, C.; Zhan, Q.; Zhang, J.; Liu, H.; Fan, Z. Quantifying the relationship between natural and socioeconomic factors and with fine particulate matter (pm2.5) pollution by integrating remote sensing and geospatial big data. Int. Arch. Photogramm. Remote Sens. Spat. Inf. Sci. 2018, 42, 77–82. [Google Scholar] [CrossRef] [Green Version]
- Song, J.; Song, T.M. Social big-data analysis of particulate matter, health, and society. Int. J. Environ. Res. Public Health 2019, 16, 3607. [Google Scholar] [CrossRef] [Green Version]
- Chen, X.; Shao, S.; Tian, Z.; Xie, Z.; Yin, P. Impacts of air pollution and its spatial spillover effect on public health based on China’s big data sample. J. Clean. Prod. 2017, 142, 915–925. [Google Scholar] [CrossRef]
- Soeul Solution. The Statistic of Seoul. 2021. Available online: https://seoulsolution.kr/ko/seoul–stats (accessed on 1 April 2021).
- Ministry of Environment. Clean Air Conservation Act. Act No. 17326; Ministry of Environment: New Delhi, India, 2020.
- Anselin, L. Local indicators of spatial association—LISA. Geogr. Anal. 1995, 27, 93–115. [Google Scholar] [CrossRef]
- Lee, H.Y.; No, S.C. Advanced Statistical Analysis; Munu: Goyang-si, Korea, 2013. [Google Scholar]
- Jin, J.H.; Seong, B.C. Analysis of the differences in living population changes and regional responses by COVID-19 outbreak in Seoul. KJAS 2020, 33, 697–712. [Google Scholar]
- Frank, L.D.; Andersen, M.A.; Schmid, T.L. Obesity relationship with community design. Physical activity and time spent in cars. Am. J. Prev. Med. 2004, 27, 87–96. [Google Scholar] [CrossRef]
- Lee, Y.J.; Choi, M.S. Determinants of the Elderly’s Spatio-temporal Concentration—Using bigdata of de facto population of Seoul. Seoul Stud. 2018, 19, 149–168. [Google Scholar]
- Im, H.N.; Seong, E.Y.; Choi, C.G. Relationship Between Diversity of Commercial Store and Street Vitality—By District Types in Seoul. J. Urban. Des. Inst. Korea 2017, 18, 37–49. [Google Scholar] [CrossRef]
- Jang, J.Y.; Choi, S.T.; Lee, H.S.; Kim, S.J.; Choo, S.H. A comparison analysis of factors to affect pedestrian volumes by land-use type using Seoul Pedestrian Survey data. J. Korea Inst. Intell. Transp. Syst. 2015, 14, 39–53. [Google Scholar] [CrossRef]
- Frank, L.D.; Engelke, P.O. The Built Environment and Human Activity Patterns: Exploring the Impacts of Urban Form on Public Health. J. Plan. Lit. 2001, 16, 202–218. [Google Scholar] [CrossRef]
- Han, S.K.; Lee, H.Y. Characteristics of the Time-based Public Transportation Travel Flows and the Pull Factors of Travel Destinations of the Elderly in the Seoul Metropolitan Area. Seoul Stud. 2015, 16, 183–201. [Google Scholar]
- Witten, K.; Pearce, J.; Day, P. Neighbourhood Destination Accessibility Index: A GIS Tool for Measuring Infrastructure Support for Neighbourhood Physical Activity. Environ. Plan. A 2011, 43, 205–223. [Google Scholar] [CrossRef]
- Cerin, E.; Nathan, A.; Van Cauwenberg, J.; Barnett, D.W.; Barnett, A. The neighbourhood physical environment and active travel in older adults: A systematic review and meta-analysis. Int. J. Behav. Nutr. Phys. Act. 2017, 14, 15. [Google Scholar] [CrossRef] [PubMed] [Green Version]
- Noordzij, J.M.; Beenackers, M.A.; Groeniger, J.O.; Timmermans, E.J.; Motoc, I.; Huisman, M.; van Lenthe, F.J. Land use mix and physical activity in middle-aged and older adults: A longitudinal study examining changes in land use mix in two Dutch cohorts. Int. J. Behav. Nutr. Phys. Act. 2021, 18, 29. [Google Scholar] [CrossRef]
- Kärmeniemi, M.; Lankila, T.; Ikäheimo, T.; Puhakka, S.; Niemelä, M.; Jämsä, T.; Korpelainen, R. Residential relocation trajectories and neighborhood density, mixed land use and access networks as predictors of walking and bicycling in the Northern Finland Birth Cohort 1966. Int. J. Behav. Nutr. Phys. Act. 2019, 16, 88. [Google Scholar] [CrossRef] [PubMed] [Green Version]
- Kim, E.J.; Won, J.W.; Kim, J.Y. Is Seoul walkable? Assessing a walkability score and examining its relationship with pedestrian satisfaction in Seoul, Korea. Sustainability 2019, 11, 6915. [Google Scholar] [CrossRef] [Green Version]
- Seoul Metropolitan Government. 2030 Seoul Plan. 2014. Available online: https://urban.seoul.go.kr/view/html/PMNU2020000000 (accessed on 1 June 2021).


| Classification | Weekdays | Weekends | |
|---|---|---|---|
| Days with high PM concentrations (warning days) | November 6, November 7, November 27, November 28, December 21, January 14, January 15, January 23, February 7, February 22, February 25, February 28, March 4, March 5, March 6, March 7, March 12, March 20, March 21, March 27, March 28, April 5, April 22, April 23 | December 22, December 23, January 5, January 12, January 13, January 19, January 20, February 23, February 24, March 2, March 3 | |
| Excluded | Days with fresh snow cover | December 13, February 1, February 15, February 19 | November 24, December 16, February 16 |
| Public holidays | December 25, January 1, February 4–6, March 1 | - | |
| Classification | Variable | Description | Source | |
|---|---|---|---|---|
| Dependent variable | Hotspot = 1, Cold spot = 0 | Hotspot: cluster of regions showing an increase in the visiting population when there are high PM concentrations Cold spot: cluster of regions showing a decrease in the visiting population when there are high PM concentrations | Derived from this study, based on the visiting population of the de facto population (SKT) data | |
| Independent variable | Land use | Residential use | Area ratio of residential facilities | Building space information by use (Ministry of Land, Infrastructure, and Transport) |
| Commercial use | Area ratio of commercial facilities | |||
| Business use | Area ratio of business facilities | |||
| Industrial use | Area ratio of industrial facilities | |||
| Land use mix | (Quasi-residential district +commercial district)/(Area of residential + commercial + industrial districts) | Land-use planning spatial data (Ministry of Land, Infrastructure, and Transport) | ||
| Public transport accessibility | Bus accessibility | Number of bus stops per unit area | Seoul bus-stop location information (Seoul) | |
| Subway accessibility | Number of subway stations per unit area | Road-name address digital map (Ministry of the Interior and Safety) | ||
| Pedestrian environment | Length of pedestrian path | Length of pedestrian path per unit area | Sidewalk/walkway (National Geographic Information Institute) | |
| Walk Score | Walkability index | [49] | ||
| Living infrastructure | Park area ratio | (Park area/total area) × 100 | Land-use zoning data/national land planning and spatial facilities/building space data (Ministry of Land, Infrastructure, and Transport) | |
| Schools | Number of facilities per unit area | |||
| Hospitals | Number of facilities per unit area | |||
| Welfare facilities | Number of facilities per unit area | |||
| Market | Number of facilities per unit area | |||
| Public facilities | Number of facilities per unit area |
| Weekday | Average Hourly Visiting Population Density on Days with High PM Concentrations | Average Hourly Visiting Population Density on Days without High PM Concentrations |
|---|---|---|
| Mean | 4804.94 | 4871.65 |
| Standard deviation | 3195.98 | 3203.82 |
| N | 424 | 424 |
| t | −6.12 | |
| p value | 0.000 | |
| Weekend | Average Hourly Visiting Population Density on Days with High PM Concentrations | Average Hourly Visiting Population Density on Days without High PM Concentrations |
|---|---|---|
| Mean | 5752.57 | 5608.10 |
| Standard deviation | 3851.90 | 3706.68 |
| N | 424 | 424 |
| t | 6.333 | |
| p value | 0.000 | |
| Variable | B | S.E. | Wald | Degree of Freedom | p-Value | Exp(B) | |
|---|---|---|---|---|---|---|---|
| Land use | Residential use | −0.130 | 0.079 | 2.746 | 1 | 0.097 * | 0.878 |
| Commercial use | 0.138 | 0.179 | 0.593 | 1 | 0.441 | 1.148 | |
| Business use | −0.415 | 0.518 | 0.642 | 1 | 0.423 | 0.660 | |
| Industrial use | −0.538 | 1.051 | 0.262 | 1 | 0.609 | 0.584 | |
| Land use mix | 0.016 | 0.023 | 0.520 | 1 | 0.471 | 1.016 | |
| Public transport accessibility | Bus accessibility | 0.063 | 0.036 | 3.146 | 1 | 0.076 * | 1.065 |
| Subway accessibility | 0.067 | 0.132 | 0.258 | 1 | 0.612 | 1.069 | |
| Pedestrian environment | Length of pedestrian path | 0.001 | 0.000 | 4.084 | 1 | 0.043 ** | 1.001 |
| Walk Score | −0.057 | 0.058 | 0.990 | 1 | 0.320 | 0.944 | |
| Living infrastructure | Park area ratio | −0.025 | 0.024 | 1.119 | 1 | 0.290 | 0.975 |
| Number of schools | −0.039 | 0.048 | 0.643 | 1 | 0.423 | 0.962 | |
| Number of hospitals | 0.436 | 0.232 | 3.527 | 1 | 0.060 * | 1.547 | |
| Number of welfare facilities | −0.167 | 0.167 | 1.003 | 1 | 0.317 | 0.846 | |
| Number of markets | 0.124 | 0.141 | 0.776 | 1 | 0.378 | 1.132 | |
| Number of public facilities | 0.210 | 0.619 | 0.115 | 1 | 0.734 | 1.234 | |
| Constant term | 4.073 | 3.368 | 1.463 | 1 | 0.226 | 58.747 | |
| Variable | B | S.E. | Wald | Degree of Freedom | p-Value | Exp(B) | |
|---|---|---|---|---|---|---|---|
| Land use | Residential use | −0.156 | 0.069 | 5.082 | 1 | 0.024 ** | 0.855 |
| Commercial use | 0.227 | 0.176 | 1.659 | 1 | 0.098 * | 1.255 | |
| Ratio of business areas | 0.174 | 0.373 | 0.217 | 1 | 0.641 | 1.190 | |
| Industrial use | −5.301 | 2.577 | 4.232 | 1 | 0.040 ** | 0.055 | |
| Land use mix | 0.034 | 0.035 | 0.973 | 1 | 0.324 | 1.035 | |
| Public transport accessibility | Bus accessibility | 0.054 | 0.033 | 2.738 | 1 | 0.098 * | 1.056 |
| Subway accessibility | 0.125 | 0.121 | 1.068 | 1 | 0.301 | 1.134 | |
| Pedestrian environment | Length of pedestrian path | 0.003 | 0.000 | 5.234 | 1 | 0.022 ** | 1.002 |
| Walk Score | 0.126 | 0.060 | 4.478 | 1 | 0.034 ** | 1.135 | |
| Living infrastructure | Park area ratio | 0.028 | 0.027 | 1.108 | 1 | 0.292 | 1.029 |
| Number of schools | 0.004 | 0.041 | 0.010 | 1 | 0.921 | 1.004 | |
| Number of hospitals | −0.037 | 0.213 | 0.031 | 1 | 0.861 | 0.963 | |
| Number of welfare facilities | −0.163 | 0.157 | 1.084 | 1 | 0.298 | 0.849 | |
| Number of markets | 0.035 | 0.152 | 0.054 | 1 | 0.817 | 1.036 | |
| Number of public facilities | 0.074 | 0.471 | 0.025 | 1 | 0.875 | 1.077 | |
| Constant term | −8.514 | 3.460 | 6.054 | 1 | 0.014 | 0.000 | |
Publisher’s Note: MDPI stays neutral with regard to jurisdictional claims in published maps and institutional affiliations. |
© 2022 by the authors. Licensee MDPI, Basel, Switzerland. This article is an open access article distributed under the terms and conditions of the Creative Commons Attribution (CC BY) license (https://creativecommons.org/licenses/by/4.0/).
Share and Cite
Lee, S.-H.; Kang, J.E. Spatial Disparity of Visitors Changes during Particulate Matter Warning Using Big Data Focused on Seoul, Korea. Int. J. Environ. Res. Public Health 2022, 19, 6478. https://doi.org/10.3390/ijerph19116478
Lee S-H, Kang JE. Spatial Disparity of Visitors Changes during Particulate Matter Warning Using Big Data Focused on Seoul, Korea. International Journal of Environmental Research and Public Health. 2022; 19(11):6478. https://doi.org/10.3390/ijerph19116478
Chicago/Turabian StyleLee, Sang-Hyeok, and Jung Eun Kang. 2022. "Spatial Disparity of Visitors Changes during Particulate Matter Warning Using Big Data Focused on Seoul, Korea" International Journal of Environmental Research and Public Health 19, no. 11: 6478. https://doi.org/10.3390/ijerph19116478
APA StyleLee, S.-H., & Kang, J. E. (2022). Spatial Disparity of Visitors Changes during Particulate Matter Warning Using Big Data Focused on Seoul, Korea. International Journal of Environmental Research and Public Health, 19(11), 6478. https://doi.org/10.3390/ijerph19116478