Review

The Economic Costs of Childhood Disability: A Literature Review

by
Ahmed Ramadan Shokry Shahat
1,* and
Giulia Greco
2
1
Quality and Accreditation Directorate, Ministry of Health, Sulaibikhat 13001, Kuwait
2
Department of Global Health and Development, London School of Hygiene and Tropical Medicine, Keppel Street, London WC1E 7HT, UK
*
Author to whom correspondence should be addressed.
Int. J. Environ. Res. Public Health 2021, 18(7), 3531; https://doi.org/10.3390/ijerph18073531
Submission received: 29 January 2021 / Revised: 19 March 2021 / Accepted: 24 March 2021 / Published: 29 March 2021
(This article belongs to the Special Issue New Challenges and Crucial Topics for 2030 Public Health)

Abstract

:
Background: This literature review investigates the economic costs of childhood disability analysing methodologies used and summarizing the burden worldwide comparing developed and developing countries. Methods: Four electronic databases were searched. Studies were categorised according to country, perspective, methods of costing, disability category, and time horizon. Annual costs were converted to 2019 current US dollars then compared to the country’s per capita current health expenditure (CHE) and gross domestic product (GDP). Results: Of 2468 references identified, 20 were included in the review. Annual burden of childhood disability ranged ≈$450–69,500 worldwide. Childhood disability imposes a heavy economic burden on families, health systems, and societies. The reason for the wide range of costs is the variability in perspective, costs included, methods, and disability type. Conclusion: The annual societal costs for one disabled child could be up to the country’s GDP per capita. The burden is heavier on households in developing countries as most of the costs are paid out-of-pocket leading to impoverishment of the whole family. Efforts should be directed to avoid preventable childhood disabilities and to support disabled children and their households to make them more independent and increase their productivity. More studies from developing countries are needed.

1. Introduction

Around one billion (15% of the world population) have some level of disability according to the World Health Organization (WHO) and World Bank [1,2]. There is currently no reliable estimate for the number of disabled children around the world [3,4]; however, estimates vary between 0.4–12.7% [5]. This is partly due to differences in defining disability. The more accepted approach in defining disability is the “bio-psycho-social model” which defines disability not only based on the individual’s health condition, but rather the interaction between the health condition and contextual factors (environmental/personal) [1].
Research shows an association between poverty and disability [6,7,8,9] but the relationship is complex and moves in both directions. A disabled child has less access to schooling and lower probability of continuing to higher education which means less human capital accumulation leading to unemployment or lower paid jobs and inevitably leading to chronic poverty [1,10,11,12]. Childhood disability can also impoverish the household because of direct extra costs of caring for the disabled child (e.g., healthcare, wheelchair, child care) and indirect costs (e.g., job loss to care for the child or having to work part-time/ flexible hours) [6,13,14,15,16,17]. On the other hand, poverty is a risk factor for childhood disability. Poor nutrition and water sanitation, unsafe antenatal care, and high prevalence of preventable diseases and accidents among less advantaged individuals increases the risk of childhood and adult disability especially in developing countries [3,13]. There is also a big disparity between evidence arising from developed versus developing countries regarding the association between poverty and disability [1,3,6,10].
Cost of illness studies have been published since the late 1950s. Reference [18] in 1967, Dorothy Rice, proposed a model for cost of illness that differentiates direct and indirect costs [19]. The choice of what costs to include, in the present and in the future, is subject to debate [20]. The perspective of the costing study (patient/household, health system, or society) plays an important role in what costs to include or exclude from the analysis. Recent efforts have been made to provide guidelines for healthcare costing studies. The most notable is the “Reference Case for Estimating the Costs of Global Health Services and Interventions” by the Global Health Cost Consortium (GHCC) launched in 2016. The reference case aims at improving consistency and transparency of methods, assumptions, and reporting [21].
Previous reviews discussed the costs of disability in children [22,23,24] but none could calculate figures due to lack of consistency in methods for defining disability and estimation of costs. To the best of our knowledge, no reviews have compared developed vs. developing countries.
This research intends to be the first to study the costs of childhood disabilities comparing country, perspective, methods of costing, disability category, and time horizon. Beside reporting costs, we analyse the methodologies used in different studies for calculating cost of illness and their relevance to the setting and perspective. We also compared annual costs to the current health expenditure per capita and to the GDP per capita to show the magnitude of the burden.
The aim of this work is to investigate the costs of childhood disability in developed and developing countries through a literature review. The objectives are:
  • To identify costs of childhood disability from selected references and categorize them according to setting, type of disability, perspective, and time horizon.
  • To quantify the burden of disability on the health system and society by comparing the cost to current health expenditure (CHE) per capita and gross domestic product (GDP) per capita.
To provide critical qualitative comparison between developed and developing countries.

2. Materials and Methods

A literature review was conducted largely following Preferred Reporting Items for Systematic Reviews and Meta-Analysis (PRISMA) guidelines [25,26]. Only one researcher performed the initial search, selection of articles, and critical appraisal (AS). All previous steps were then revised, corrected, and approved by the second researcher (GG). However, the two researchers did not perform the evaluation independently hence it is considered a literature review not a systematic review.
Literature was searched for the key terms of cost, child, and disability. Alternative search terms were also used for each key word. Selecting the search terms for disability was challenging as there is a wide range of medical conditions which may cause disability. In this review, we used keywords general to the concept of disability. In addition, we searched for three of the most common medical conditions causing childhood disability; cerebral palsy (CP), autism spectrum disorders (ASD), and Down syndrome (DS). These medical conditions were selected because they almost always occur/manifest in childhood, cause considerable disability, and have long survival so the costs can be followed for a longer time.
Inclusion criteria were: peer reviewed journal articles, from 1980 onwards, in the English language only, estimating any type of economic costs of children (up to the age of 18), with any type of disability.
Countries were categorised as developed or developing. All high-income countries were considered “developed”, all low-and-middle-income countries (LMIC) were considered “developing”. Ranking of countries’ income levels was taken from the latest World Bank country and lending group ranking [27].

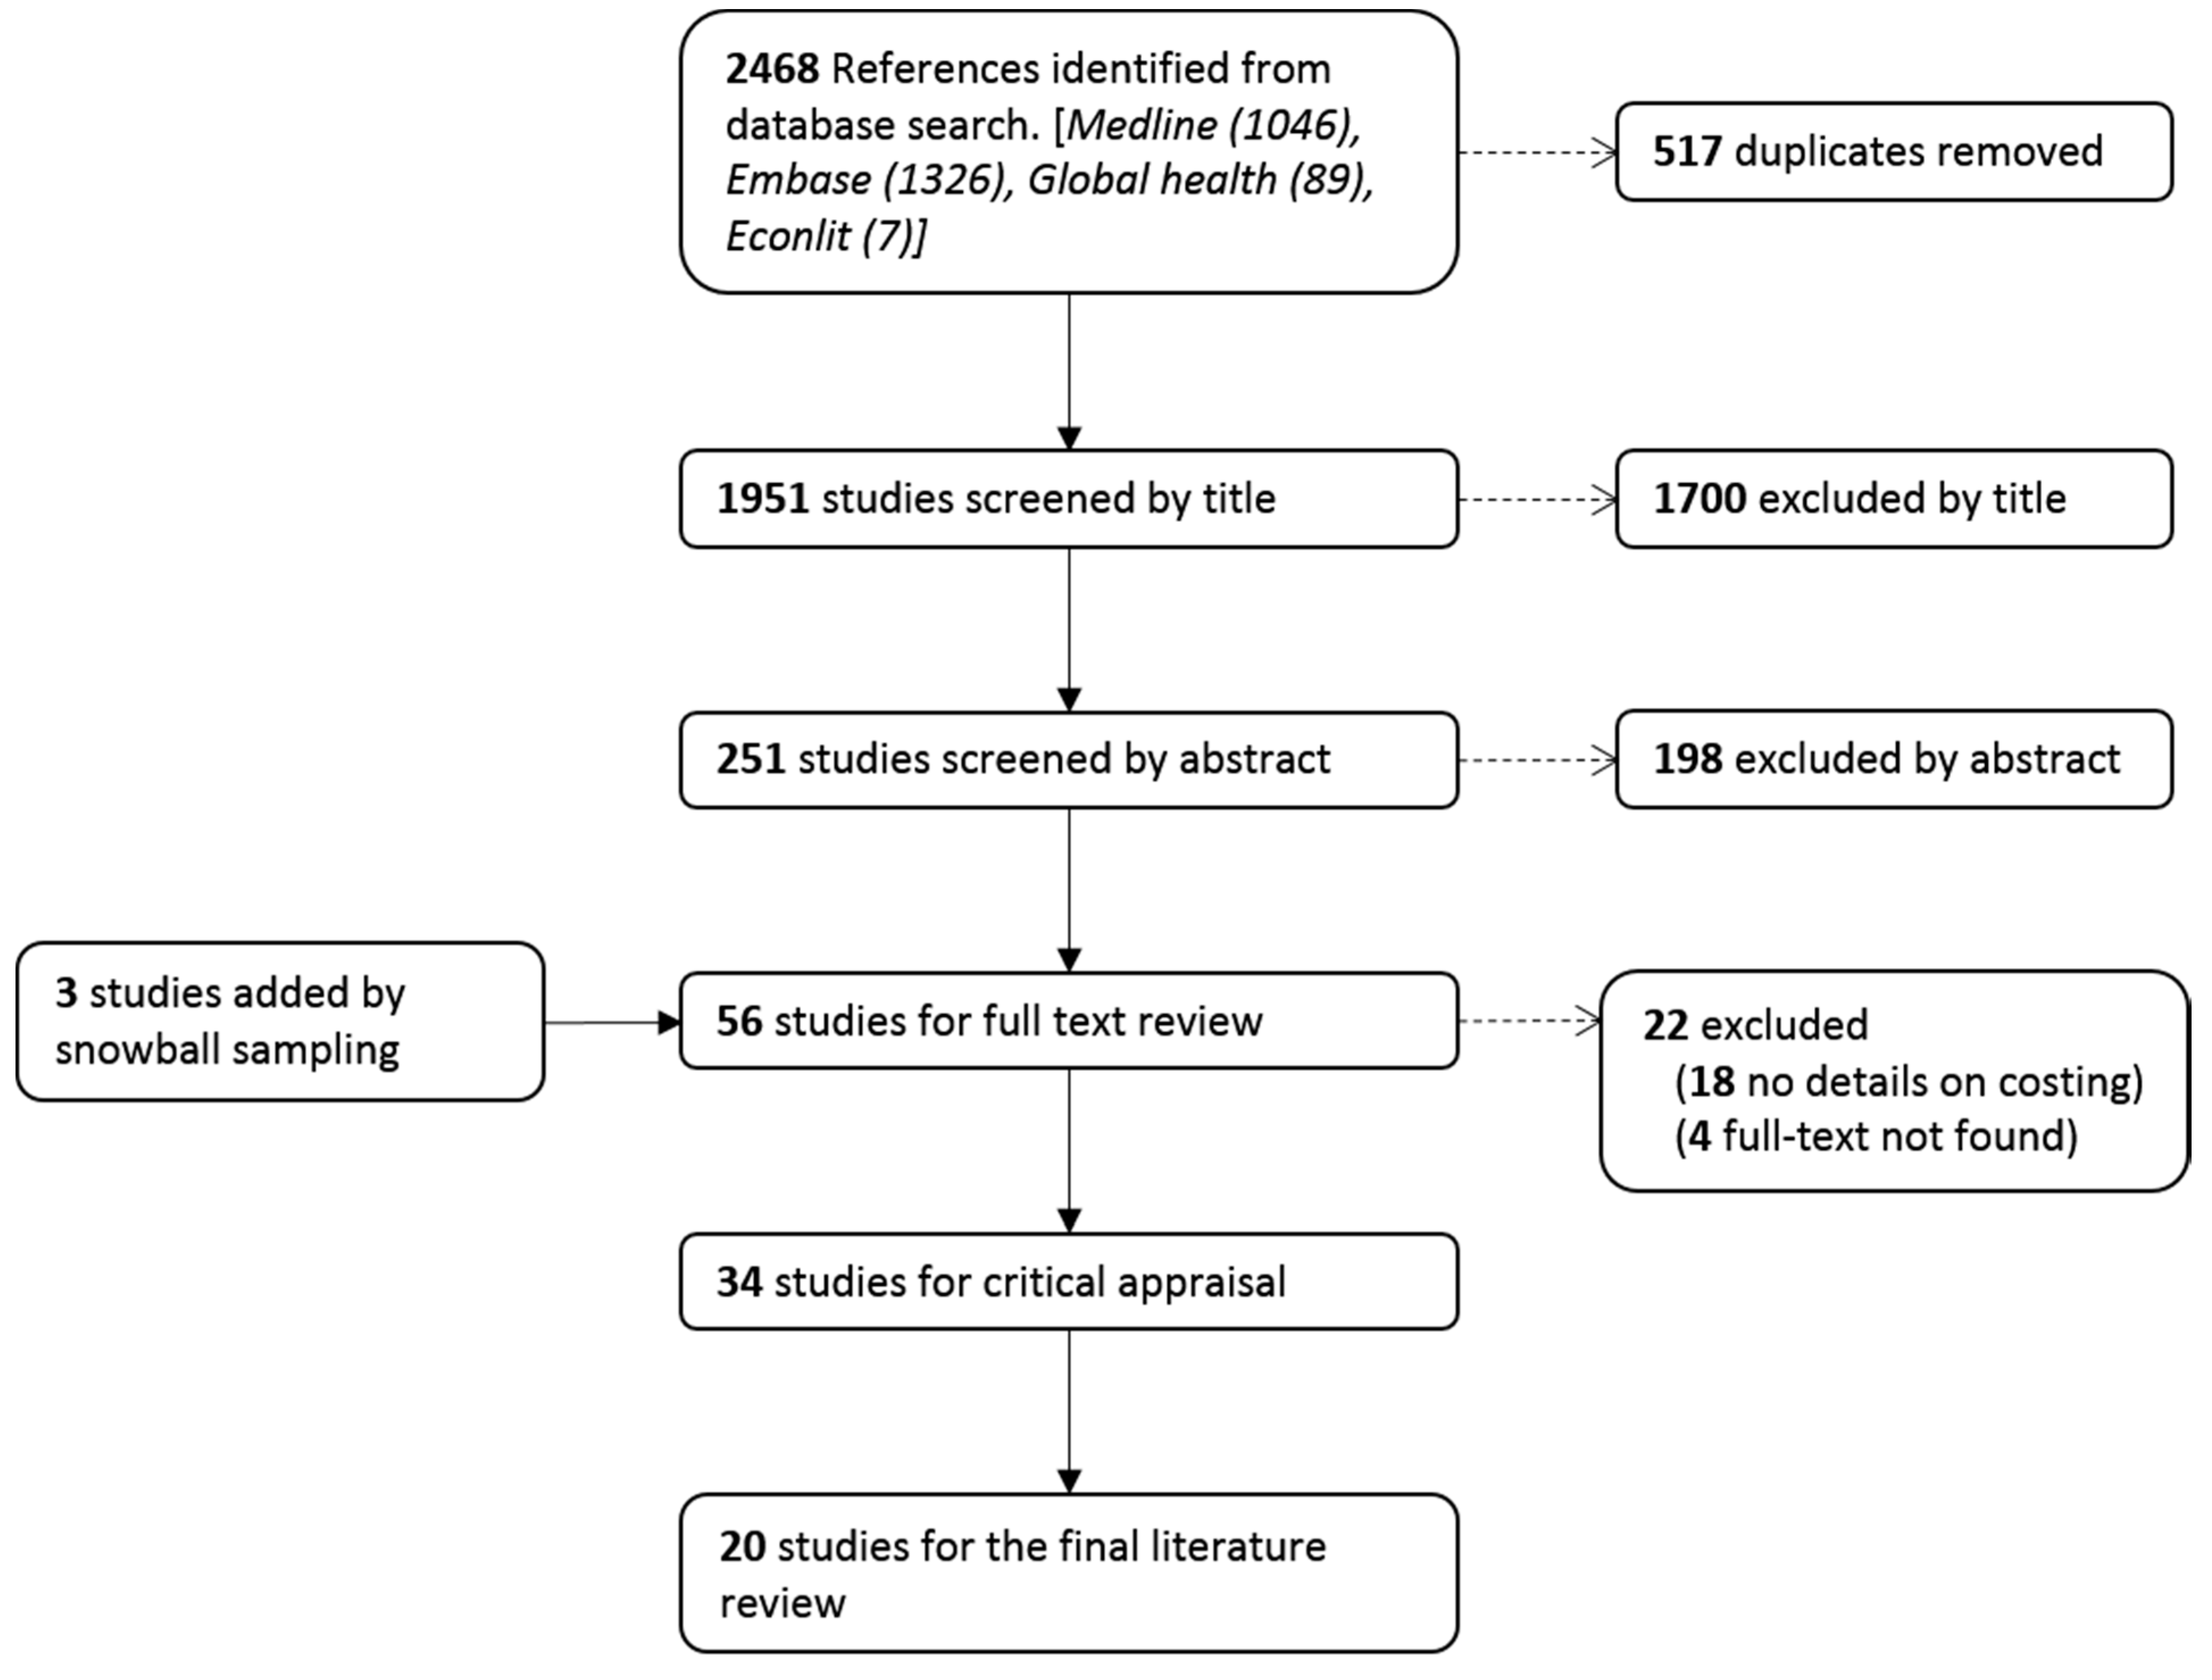
2.1. Searching Strategy and Databases

The databases Medline, Embase, EconLit, and Global Health were searched. Alternative search strategies were also used through snowball sampling [28] where the search strategy evolves based on the relevant literature identified through the initial electronic search. This included searching reference lists, hand searching relevant journals and author searching. Details of the search strategies on the four databases is available in Appendix A,Appendix B,Appendix C,Appendix D.

2.2. Identifying Relevant Literature

The searching and sifting process was performed largely following PRISMA guidelines [26]. The results of electronic database searches were uploaded and managed using Mendeley reference management software and duplicates were removed. Titles were screened against inclusion criteria. After exclusion of irrelevant titles, abstracts of the remaining references were screened again. The full text of the remaining references was retrieved, and critical appraisal of their quality was performed. At this stage, more full text articles were included through snowball sampling while some studies were excluded because full text could not be found.

2.3. Data Extraction

A data extraction form was designed using google-docs. The form had two sections, one for data extraction and another for the critical appraisal questions. Data were then exported into an excel file for analysis. The form can be viewed at https://forms.gle/ntoEivcgT5xN7Agd9 (accessed on 13 July 2019).

2.4. Categorizing Costs

Types of costs were categorised into the following:
  • Direct-medical: costs for diagnosis, treatment, managing complications of the condition causing the disability.
  • Direct non-medical: includes special education, rehabilitation, and transportation costs.
  • Indirect non-medical: productivity loss and time lost by parents due to caring for the disabled child.
  • Future related: medical costs related to the condition causing disability that happen in the future years.
  • Future unrelated: includes future productivity loss by the disabled children and their caregivers.

2.5. Critical Appraisal

A modification of the 10-point checklist by Drummond et al. [29] was used to evaluate the quality of the articles. The checklist was originally designed to critically appraise economic evaluation studies, hence rephrasing and excluding some questions was necessary. The modified checklist contained 20 yes/no questions. All questions were given equal weight. Studies scoring yes in more than 75% of the applicable questions were considered to have a low risk of bias, whereas, those scoring (50–75%) a moderate risk of bias, and studies scoring less than 50% a high risk of bias.
When an item is partially met it was considered (yes). However, all items were reviewed again by the second researcher (GG) and discussed to reach a final decision on assigning the question a yes/no answer. The critical appraisal tool is available in Appendix E.

2.6. Synthesis of Evidence

Qualitative comparison was made between studies by categorising and analysing them according to the following items:
Country (name, developed/developing)
Perspective (household, health system, or societal perspective)
Methods of costing
Disability category (types of disability/medical condition)
Time horizon
The data extraction table is available in Appendix F.
For quantitative comparison, annual costs reported in the studies were compared to the CHE per capita of the country obtained from the latest estimates published by the WHO in 2016 [30] and then the figures were inflated to 2019 US$. Comparison was also made with GDP per capita for the country obtained from the International Monetary Fund (IMF) projections for GDP published in the World Economic Outlook Database in April 2019 [31]. Lifetime costs were transformed to annual costs by dividing the lifetime costs by the number of years reported in the study model. The ratios of the annual costs to CHE and GDP were displayed as percentages in the results table. The ratios were displayed in a scatterplot after they were transformed to natural logs to minimize the scale and make it easier for display. This means that the midline (zero) corresponds to 100%, i.e., the estimated cost is equal to the CHE/GDP per capita. All the data point to the right of the midline (positive) are multiples of the CHE/GDP per capita i.e., the costs are more than CHE/GDP per capita. Any data points to the left of the midline (negative) are fractions of the CHE/GDP per capita i.e., the costs are less than the CHE/GDP per capita. The studies were arranged chronologically from oldest (bottom) to newest (top) to show if there was a trend over time. A different colour was given to data points for each of the three perspectives (the household, the health system, and the societal). A different shape was given to data points to differentiate annual costs reported in the original studies from annual costs that we estimated from the lifetime costs. As some studies estimated separate costs for more than one type of disability, each data point on the scatter plot represents a cost estimate rather than a study.

2.7. Summarizing Results and Currency Conversion

For comparability, all results were displayed in 2019 US dollars (US$). Costs from the original studies were first inflated to 2019 local currency values using local currency inflation rate from consumer price index of the international monetary fund [32]. Costs in currencies other than US$ were then converted to 2019 US$ using the exchange rate of the base year (July 2019 conversion rate).
Costs were reported as average (mean) cost whenever possible. If both mean and median are reported; the mean was chosen. Because the 95% confidence interval was not available in all studies, it was not reported in our results. Costs were rounded and presented as approximate figures (≈) to emphasize the idea that these costs need to be compared categorically rather than statistically. However, the actual (non-rounded) estimates are presented in the results table.

3. Results

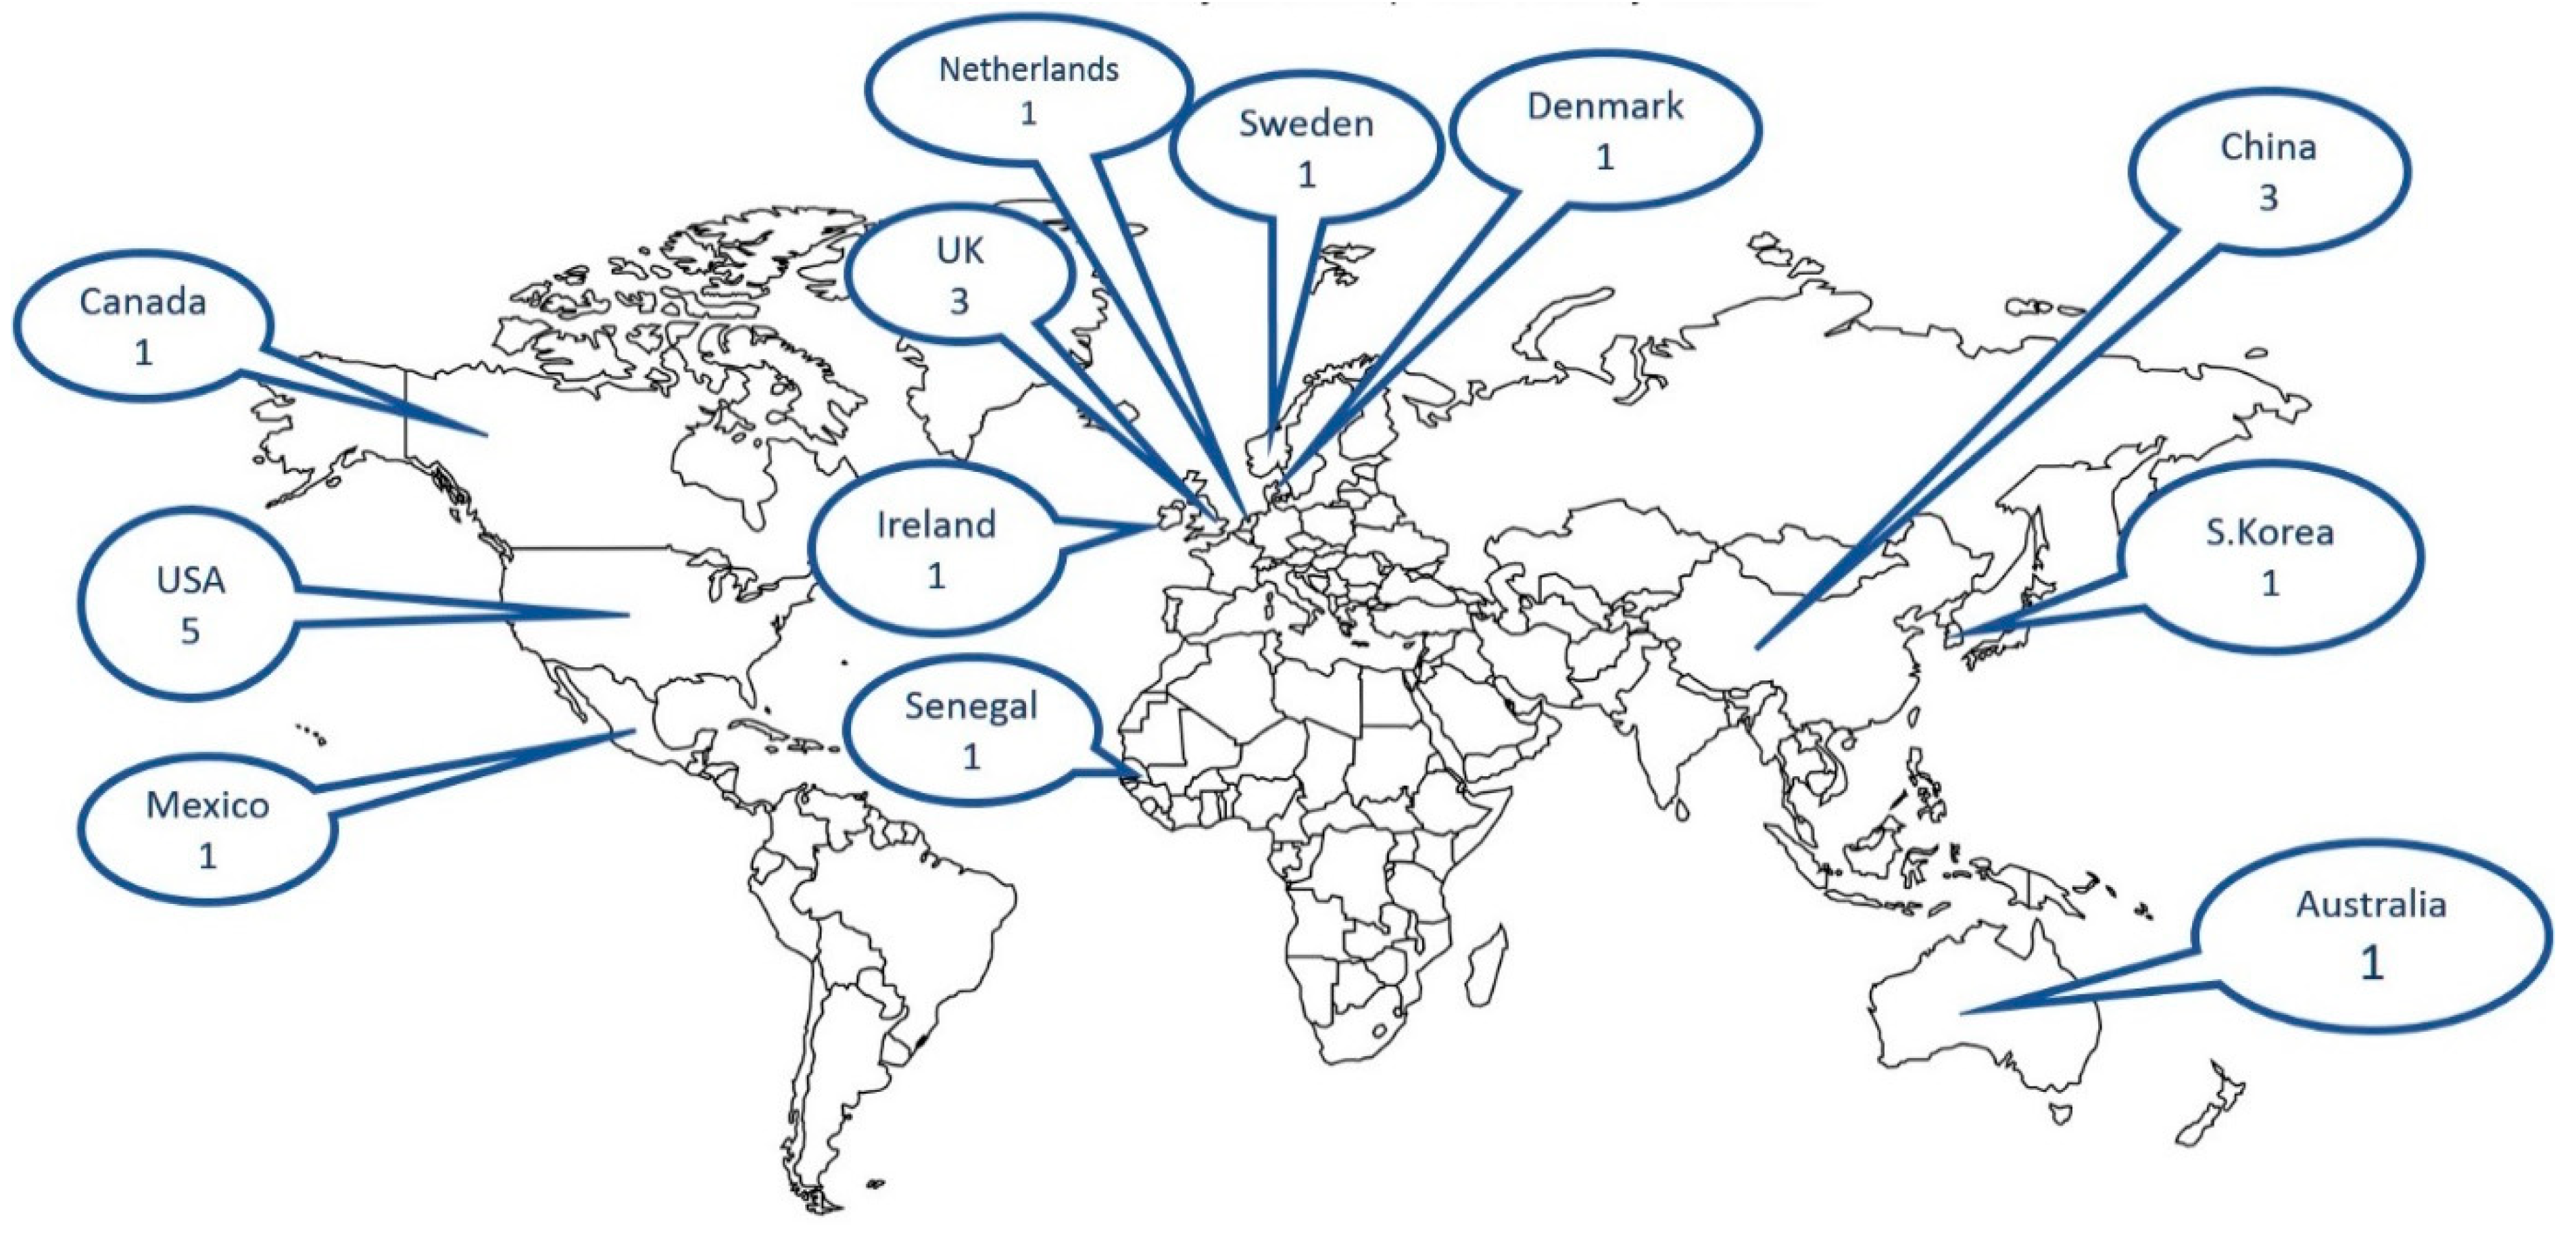
3.1. Finding Relevant Studies

The initial literature search identified 2468 references. After removal of 517 duplicates, the titles of the remaining 1951 references were screened. Of these, 251 were retained for abstract review applying the inclusion and exclusion criteria. After revising the abstracts, 53 references were selected for full text review and a further three were found through snowball sampling. The critical appraisal tool was applied to 34 studies, 17 were found to have low risk of bias and were, therefore, included in this review. Only two studies from this group were from a developing country. Fourteen studies had moderate risk of bias and were, therefore, excluded. We exceptionally included three studies from the moderate risk of bias group as they were from developing countries, so they were needed for the sake of comparison. All studies with high risk of bias were excluded (n = 3). This resulted in 20 studies that were included in the final analysis. Details of the sifting process are shown in Figure 1.

3.2. Summary of the Results

The annual costs of childhood disability reported in the studies ranged ≈$450–69,500. In developing countries, the costs ranged ≈$500–7500 while in developed countries it ranged ≈$450–69,500.
The lifetime costs ranged ≈$41,000–4,300,00 worldwide. In developing countries, costs ranged ≈$41,000–91,000 while in developed countries the range was ≈$32,000–4,300,000.
The 20 studies were spread across 12 countries in five continents. The majority (n = 15) were set in developed countries. Figure 2 shows the distribution of the reviewed studies over the world map.
Regarding type of disability; six studies estimated the costs of disability in general or reported the costs of more than one category of disability. Six studies focused on the costs of autism spectrum disorders (ASD), four on cerebral palsy (CP), and three on Down syndrome (DS). Only one study estimated the costs of disability as a sequel of meningitis.
Regarding study perspective; the societal perspective was considered in 10 studies, the household perspective in six, while four studies were from the health system perspective.
Regarding time horizon; more than half of the studies (n = 12) reported the annual costs, whereas six estimated the lifetime costs. The study by Solmi et al. [33] was the only one to report weekly extra costs. Barrett et al. [34] reported costs over a six-month period. Kageleiry et al. [35] presented the aggregate costs for the whole childhood period (0–18 years) which was difficult to break down into annual costs but could, nevertheless, be compared to lifetime costs regarding the methodology.
A summary of the findings from the 21 studies is presented in Table 1.

General Methodological Findings

The definition of disability varied between the reviewed studies. The majority of the studies (n = 14) identified disabled children based on a confirmed diagnosis of a medical condition, whereas only three studies used a definition that follows the bio-psycho-social model. Three studies were not clear on the method of defining disability.
The perspective of the analysis was determinant in the choice of study methods and the types of cost included. The societal perspective was more commonly used in developed countries. Nine out of 15 of the studies from developed countries focused on the societal perspective, five were from the health system perspective and only one was from the household perspective. In fact, seven out of eight studies from European Union (EU) countries were from a societal perspective. In developing countries, four out of five studies were from the household perspective, only one from the societal perspective and none from the health system perspective.
The most frequently measured costs were direct medical and direct non-medical costs which were estimated in 17 and 16 studies, respectively. Indirect non-medical costs were estimated in 11 studies, future-related (medical) costs in six, and future unrelated costs in only five studies.
Whenever the method of estimating indirect non-medical costs is explicitly mentioned it was the human capital approach. The only exception in developed countries was the novel use of compensating variation method by Solmi et al. [33] The friction cost method was not used in any of the reviewed studies and was not found in any of the 34 studies included in the critical appraisal. Two studies from developing countries estimated productivity loss by directly asking parents on their estimation of income forgone rather than the standard estimation through the human capital approach method [36,37].

3.3. Lifetime Cost Studies

The lifetime costs ranged ≈$41,000–4,300,00 this corresponds to annual costs of ≈$450–69,500. Six studies estimated lifetime costs of disability. These studies were included even though cost estimation continued into adulthood because it is a long-term consequence of disability acquired at birth or during childhood. Four of the studies were from the societal perspective, one from the health system perspective, and one from the household perspective.
The method of estimation of lifetime costs was similar in the six studies; the incidence/prevalence of the condition is estimated, then average costs at each age band till the end of life expectancy is estimated. This estimate is then used to model the lifetime costs for a hypothetical person (or cohort) who acquires the condition at the base year and dies at the end of life expectancy. Therefore, we considered lifetime costs studies to be model-based studies to differentiate them from other studies which estimate annual costs in real-time in the current year(s) i.e., survey-based.
Discounting was used for future costs (ranging 3–5%) in all the lifetime studies. Sensitivity analysis to account for uncertainty around the measures estimated in the study was used in five of the six studies.
The study by Griffiths et al. [36] on lifetime costs of meningitis sequelae in children in Senegal was the only one from a developing country and was the only study to be truncated at the age of 30 years, while the remaining five studies were from developed countries and truncated at an age not far from the average life expectancy of the population.
The six studies focused on a single disease or a group of very similar disorders; three on CP, two on ASD, and one on meningitis sequelae. Regarding data sources, two studies pooled data from different studies to estimate the average costs, [38,39] two used national register data, [40,41] and two estimated costs based on parents’ reported expenditures and healthcare utilization [36,42].

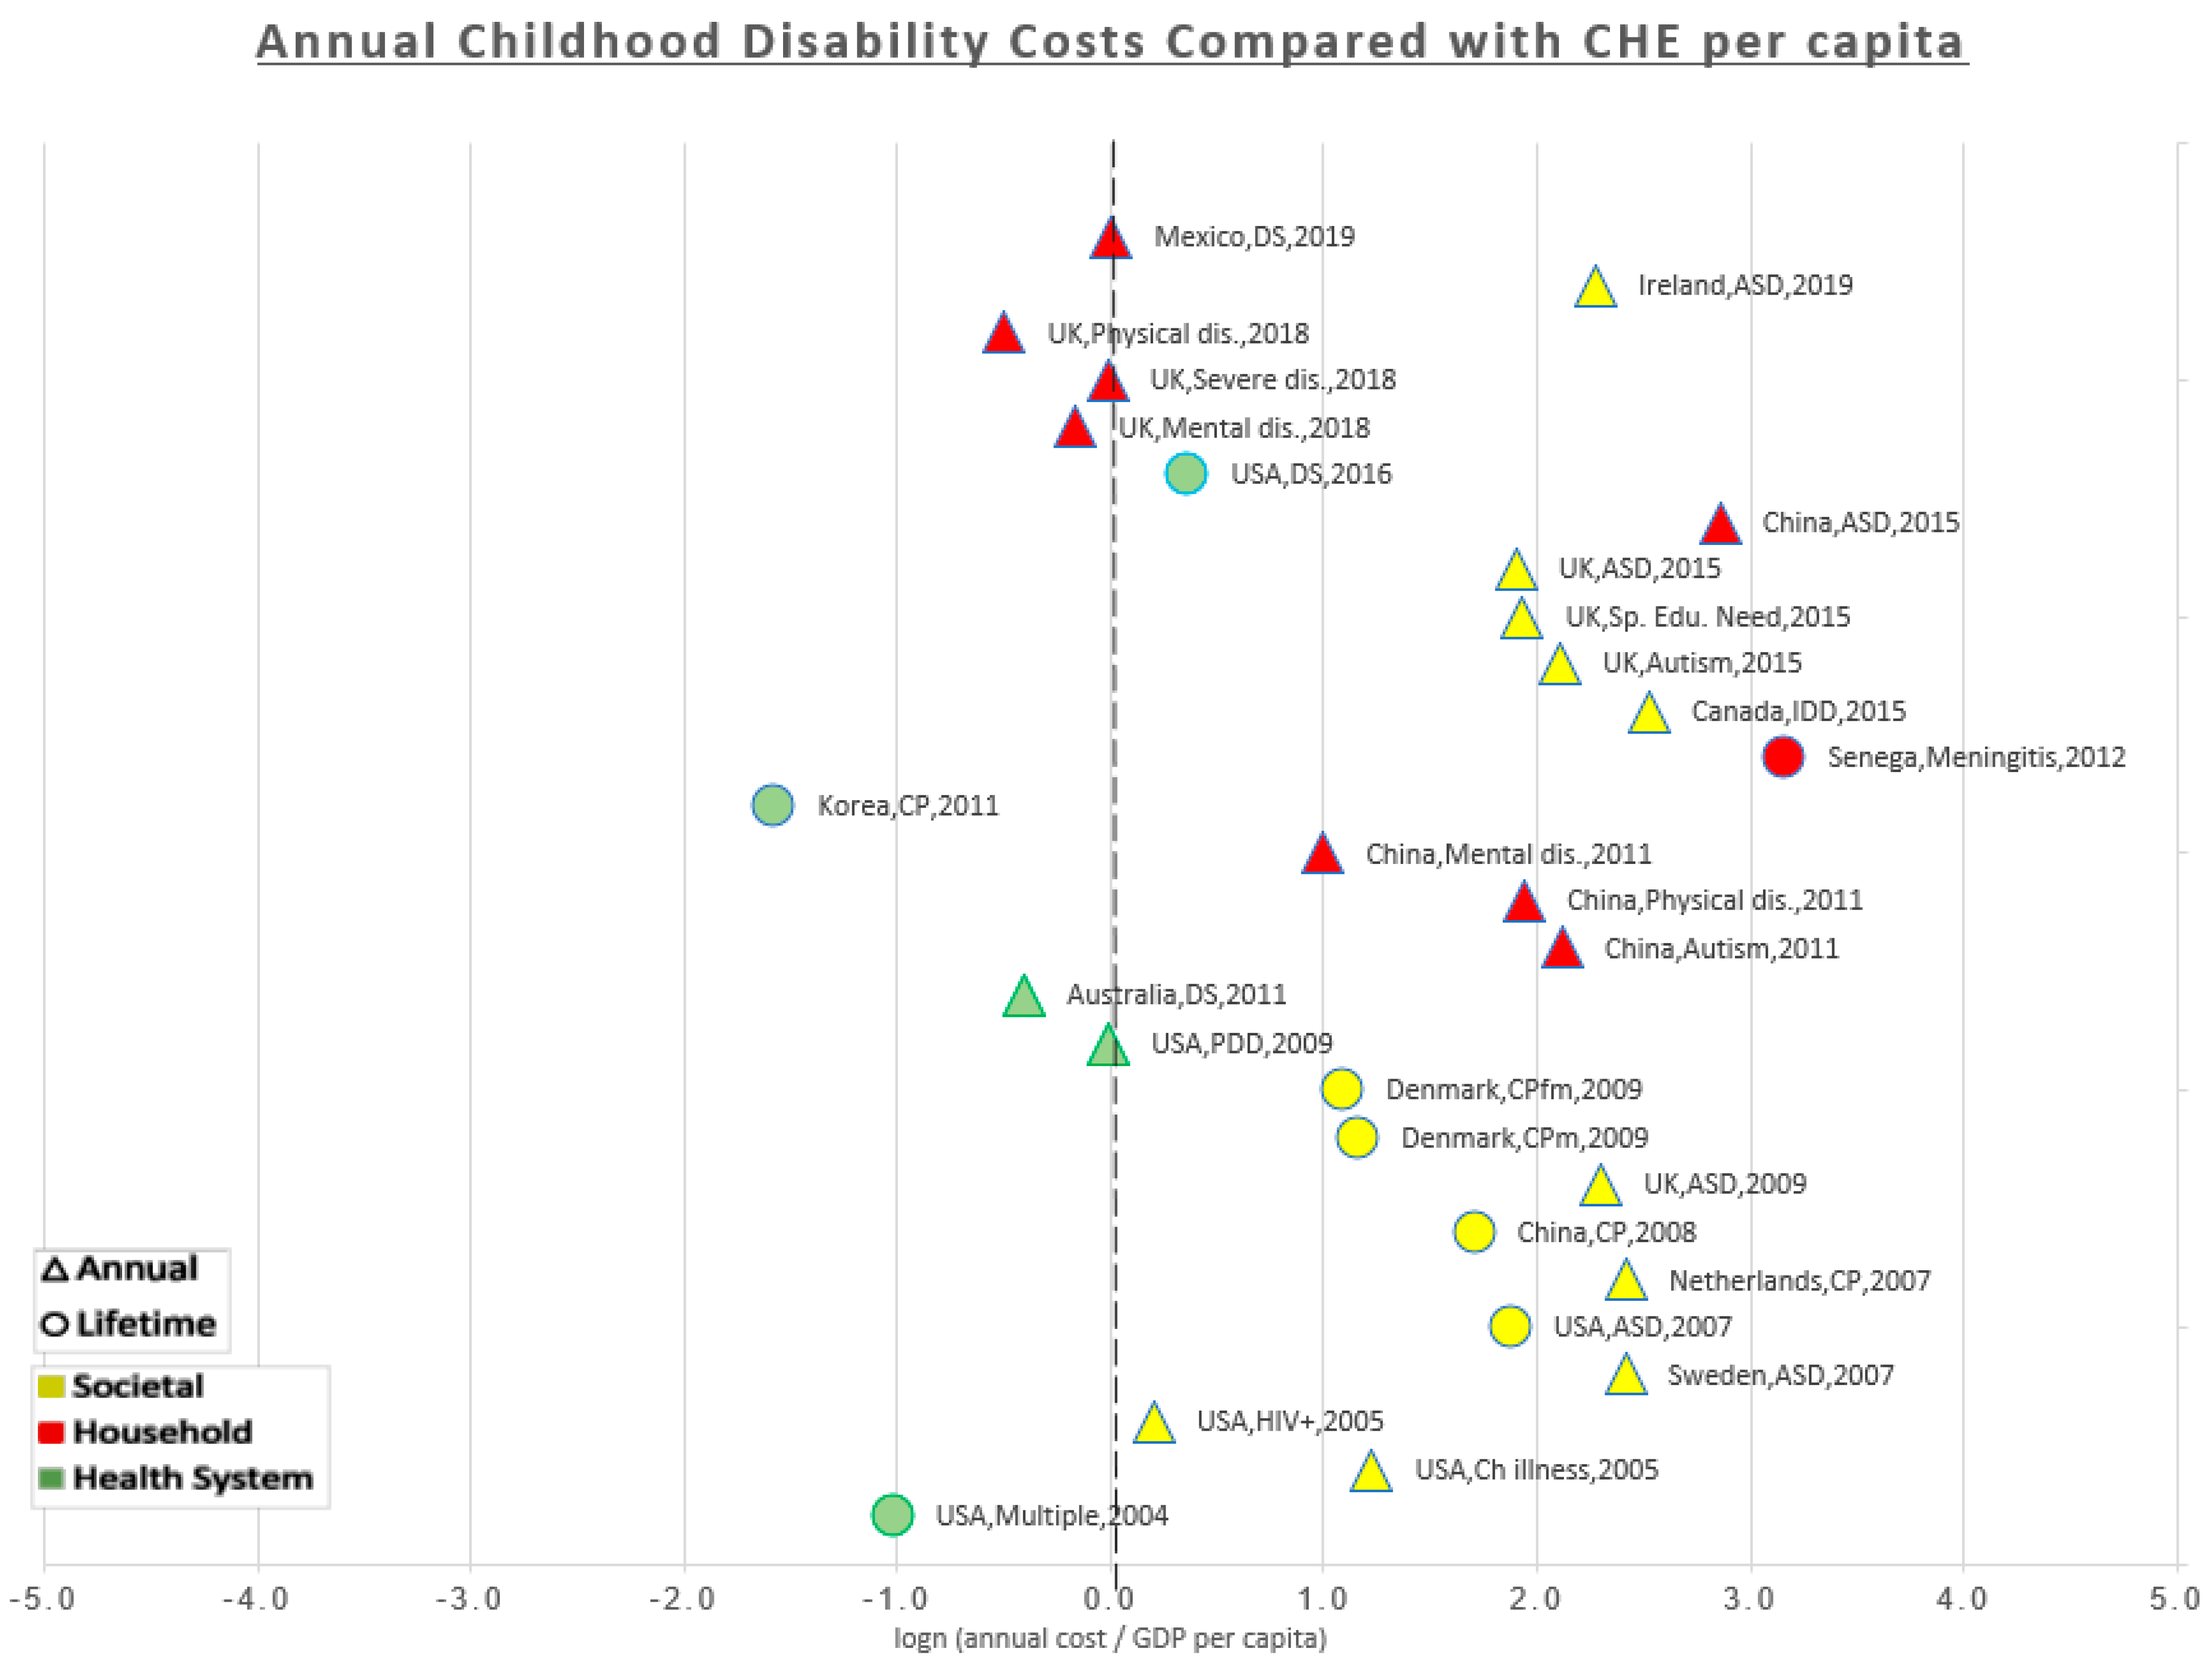
3.4. Magnitude of the Burden

It was not possible to compare the studies quantitatively because of methodological differences. However, we attempted to estimate the ratios of annual costs to their country’s own per capita CHE and GPD and display it graphically in a scatter plot. This plot would allow the reader to visualise results in a comparable way and show the general differences between countries and between perspectives. On the scatterplot, annual costs estimated through survey-based methods were given a different shape (triangle) to differentiate them from annual costs that we estimated from the reported lifetime costs studies model-based method (circle).
Figure 3 is a scatterplot that shows the ratio of each estimated cost to the country’s CHE per capita. All the costs estimated from the societal perspective (yellow) were to the right of the midline, i.e., higher than CHE per capita. From the household perspective (red), costs estimated in China and Senegal were higher than CHE per capita, costs from Mexico were equal to CHE per capita, and costs from the UK were equal or less than CHE per capita. From the health system perspective (green), costs were generally lower compared to the other perspectives. Costs estimated in Korea and Australia were lower than CHE per capita. Three cost estimates from the USA in the years 2004, 2011, and 2016 were lower than, equal, and higher than the CHE per capita respectively. This may indicate a trend of rising healthcare costs in the USA; however, type of disability and methods could be major confounding factors.
Figure 4 is a scatterplot that shows the ratio of each estimated cost to the country’s GDP per capita. All costs estimated from the health system (green) and the household perspective (red) were lower than their country’s GDP per capita. From the societal perspective (yellow), costs estimated in the UK, the Netherlands, Canada, Sweden, and one USA study were equal or more than GDP per capita, while the other costs estimated from the societal perspective in Ireland, USA, China, Denmark, and some UK studies were lower than one GDP per capita.

4. Discussion

All reviewed studies concluded that there is a substantial economic burden attributed to childhood disability regardless of the study perspective or setting. The household of the disabled child bears a heavy economic burden. This is either in the form of out-of-pocket (OOP) expenditures, or opportunity costs due to productivity time lost caring for the disabled child. This is true even in countries with public coverage of health, education, and social services. This economic burden is shared by the family of the disabled child, public health services, and the society. The share of each party is variable depending on the health and welfare system in the study setting. In developing countries, much of the burden is on the household in the form of OOP expenditures and lost productivity. In Mexico, Martınez-Valverde et al. found that 33% of families with DS children had catastrophic expenses and 46% of the families had to borrow money to pay for medical expenses [48].
In developed countries, part of the burden is shifted to the public services (e.g., health, special education, and disability benefits) but there is still a substantial burden on the families. In the UK, an additional annual amount of ≈$4200 is needed for the families of a severely disabled child to have the same living standard of their matched families without a disabled child [33,53].

4.1. Definition of Disability

The WHO report on disability recommended the bio-psycho-social model for defining disability as an interaction between the physical condition and the environment [1]. This was only used in three of the 20 reviewed studies while the majority used confirmed clinical diagnosis of a certain disease as the indication of disability. However, this may be biased because the literature search was done in databases which focus primarily on medical rather than social research.
The definition of disability varies globally, even within some countries there is no consensus on the national definition which explains why different studies produce different prevalence rates for the same population. In the USA, Newacheck et al. demonstrated that the prevalence of childhood disability may range from 7.3% to 30% depending on the definition of disability used [49]. Thus, it is important for researchers to use uniform definitions for disability to allow results to be comparable and be more relevant and informative for planning and budgeting of services.

4.2. Human Capital vs. Friction Cost

Valuing indirect costs, especially childcare time and lost productivity, has been an issue of much debate. As they are less straightforward to measure and more complicated to explain for decision makers, researchers have used different methods to estimate these costs. Among 11 studies that considered indirect non-medical costs, the human capital approach was the most common method. Although theoretically it may be superior to the human capital approach, the friction cost method was never used in any of the reviewed studies. This may be due to the limited use of the friction cost method in healthcare literature and that its costs are not readily available [20]. We suggest also that the human capital approach could be easier to present and explain to decision makers and the public.
Three studies used alternative methods. A British study used propensity score matching and compensating variation method which calculates ”the amount of additional income a family with a disabled child would require to achieve the same living standards as a similar family without a disabled child” [53]. In a Senegalese study on effects of meningococcal meningitis, the opportunity cost of time lost by parents’ due to their child’s illness was reported and valued by the parents [36]. This approach was suggested by the researchers to be more suitable to LMIC settings. A similar approach was used in China, where parents replied to open questions such as “How much total income do you expect that all family members would have earned in the past year if your child did not have the disease?” [37].
The use of compensating variation is promising and could provide good evidence for evaluating the effectiveness of disability benefits in the country as it estimates the amount needed to fill the gap in standard of living between families with/without a disabled child. However, it can not be used to estimate societal cost as the focus here is the household.
We would still recommend the use of human capital approach as it is the most commonly used method and would make results comparable to other studies.

4.3. Societal vs. Household vs. Health System Perspective

The perspective may be the most determinant factor in a costing study as it would dictate what costs to include/exclude, where to collect the data from, and who is the audience of the study. No perspective can be claimed to be superior to others, it depends on the context. Careful analysis of the health system of the country of the study and the target audience should lead to the selection of the most suitable perspective.
In EU countries, disabled children can receive good quality of public healthcare, special education, and social services at no or very minimal costs. This explains why most studies in EU countries focus on the social perspective as most of the disability burden falls on public services. In this context, the household perspective would underestimate the negative effects of disability because a considerable part of the burden is shifted from the family to the social welfare network.
The healthcare system in the USA differs from that in Europe as there is no single national or social health insurance in the USA. Disabled children can receive healthcare through Medicaid, private insurance, or could even have no healthcare coverage at all. Because of the variable and more complex health system in the USA, different studies adopt different perspectives to cover all viewpoints. Three out of five American studies focused on the health system perspective. This reflects the growing concern by the healthcare payers (public or private) about the rising healthcare costs in the USA.
In developing countries, public services are of lower quality and limited coverage leading to higher reliance on private providers. This leads to significant OOP costs for the families. This explains why four out of five studies from developing countries focused on the household perspective while it was used in only one out of 15 studies in developed countries. Limited expertise in costing in developing countries, poor documentation, and unavailability of sources of cost data may also be factors deterring researchers in those countries from taking a wider perspective.
It was very difficult to aggregate the methods used into meaningful categories for several reasons. The methods used to calculate each cost category were variable, but what made it even more challenging is that many studies lacked the level of detail needed for such analysis. We have included in Appendix F some more details from the studies on their methods.

4.4. Developed vs. Developing

Studies originating from developing countries were fewer in number and were generally of lower quality compared to studies from developed countries. Out of 34 studies included in full-text critical appraisal, eight were from developing countries, and only two had low risk of bias. Studies from developing countries focused more on the household and OOP expenses. The health system perspective was never used in studies from developing countries. This may indicate lack of interest from decision makers in this kind of studies and may also indicate the difficulty in collection of health system costs in these sittings.
Methods in studies from developing countries were less explicit especially in describing sources of each cost component and how it was calculated. Costs were generally lower in developing countries, annual costs ranged ≈$500–7500 while in developed countries they were ≈$2600–69,000. This may be partly because the cost of healthcare is lower in these countries and partly due to methodological differences (e.g., fewer costs included).
The estimation of lifetime societal costs of CP in two studies, one in China (≈$91,000) [42] and another in Denmark (≈$1.2–1.3 million) [40], shows a huge difference. Although both studies used the same perspective, the Danish study relied on national register data (including all patients registered since the 1960s) and was very explicit on details of costs included, sources of costs, and how they were calculated. The Chinese study was based on interviews with 319 parents of CP children to ask about utilization and expenditure related to their child disability as well as productivity loss. Less details were offered in the Chinese study on how each cost component was calculated. This may partly explain why both studies came to very different numbers that cannot simply be attributed to differences in healthcare costs or wage rates.
This shows that the choice of the most suitable method may vary between countries as it should account for differences in health systems (what services are covered by insurance or public services and what services are paid by the families), and should also account for the availability of data and their quality. The lack of availability of reliable population-level cost data in developing countries makes the results of the studies less accurate and less generalizable. This highlights the need for guidelines that set standards for conducting and reporting cost studies which allows them to be compared across time and countries. The guideline should be comprehensive yet flexible to be adapted to context and setting. A notable effort in this field was undertaken by the Global Health Cost Consortium (GHCC) in the Reference Case for Estimating the Costs of Global Health Services and Interventions that “adopts a “comply or justify” approach, which allows the analyst to adapt to the specific requirements of the costing exercise, but introduces the condition that judgments about methods choices are made explicitly and transparently” [21].

4.5. Mean vs. Median

Cost data in healthcare are typically positively skewed (right tailed). This is because a few patients (very severe or complicated cases) use significantly more resources than the rest which increases the mean cost. Therefore, the median is statistically more appropriate to describe cost data and non-parametric techniques are more appropriate for analysis. Nevertheless, decision makers are interested in average (mean) cost not the median [29] because average cost is what they would use in budgeting. Different statistical techniques have been used for presenting the cost results in mean costs including bootstrapping and using the gamma distribution [29,54].
Most reviewed studies reported the mean cost. One study reported both mean and median cost, [45] allowing readers interested in the expected cost for an individual patient to know the median while presenting the mean for decision makers who are more interested in average cost for the population. In this review, we assumed that mean costs are more relevant in describing the burden on the health system and society. Thus, the mean costs were reported in this review whenever available.
We recommend that the ideal practice would be reporting both mean and median costs. If the mean is used, care should be taken to use the appropriate statistical techniques to allow performing parametric analysis on cost data.

4.6. How Significant Is the Burden?

Comparing costs to CHE and GDP was used to show the extent of the burden. Taking the UK as an example; the amount of extra costs that a family of a disabled child bear annually (≈$2600–4200) [33] is comparable to the CHE per capita (61–98%). From the societal perspective, the annual costs of one disability case (ASD) [38] is equal to the country’s GDP per capita. In other words, the society loses one GDP per capita annually for each disabled child. A similar conclusion can be reached if we compare the annual societal costs to the GDP per capita in the Netherlands [50] (108%), Canada [47] (129%), and Sweden [44] (130%). In the Netherlands, Hoving et al. estimated that the annual societal costs of one CP child is 11 times CHE per capita [50].
A significant proportion of this burden falls on the families, even in countries with very good public services. In Canada, Genereaux et al. estimated that even with widely available public healthcare and social services, the governmental benefits compensated for less than 6% of OOP expenses that the family of a disabled child face [47].
In developing countries, the burden is even heavier and a significant proportion of it falls on the families. In Mexico, the OOP expenditures incurred by the disabled (DS) child’s family is equal to the county’s CHE per capita [48]. In China, the household expenses were found to be two to eight times the CHE per capita (for mental disability and autism respectively) [52], while according to another study, ASD costs could be up to 17 times CHE per capita (75% of the GDP per capita) [37]. This considerable burden on the households explains why many families fall into poverty and incur catastrophic health expenditures as a result of having a disabled child. This shows how significant the burden of childhood disability but also hints at the potential savings from prevention programs.

4.7. Strengths and Limitations

This study is the first to analyse in detail the methods of estimating childhood disability costs differentiating between methods according to perspective, time horizon, type of disability, and country income level.
This review however had some limitations. The heterogeneity of methods did not allow costs to be summarized and compared statistically in a meta-analysis. Time constrains lead to limiting database searches to only four databases. As only one researcher was performing the review, it was not possible to have two independent researchers to select studies according to inclusion criteria.
Search terms used to search the term “disability” included some general synonyms of the term “disability” and terms for some specific medical conditions. However, the terms used for specific medical condition was not a comprehensive list. It only included some of the most common childhood conditions causing disability, while some other conditions (e.g., hearing-impairment and visual-impairment) were not included.
Only five studies from developing countries were included in this review. This was due to the limited number of available studies and their lower quality. Only two studies from developing countries had a low risk of bias according to our critical appraisal. However, a further three studies, who had moderate risk of bias, were included in our review to allow comparison between developed and developing countries.

4.8. Recommendations for Policy Makers

Policy makers should look at childhood disability from a wider perspective and consider the effects beyond the health system to appreciate the full picture and avoid underestimation of the economic burden. This is important when making investment decisions and weighing costs and benefits.
Governments should be encouraged to finance programs that are proven effective in preventing avoidable disabilities. Providing facilities and personnel to ensure safer deliveries, especially in rural areas, can significantly decrease the number of CP cases caused by antenatal complications. A facility/program for safe delivery in a developing country can prevent hundreds of traumatic CP cases and save considerable potential lifelong costs of their disability. Some medications to prevent premature delivery are also promising in reducing CP because of prematurity. Amniocentesis for detection of DS and counselling for positive mothers should be provided by public facilities. Early diagnosis, rehabilitation, special education programs, and inclusion in the labor market are effective in improving the outcome of ASD cases. Investing in these interventions with the target of making autistic children more independent and to qualify them to enter the labor market will significantly reduce the lifetime costs of their disability. The same can be concluded for interventions, equipment, and programs to help children with hearing, visual, or physical impairment to overcome their disability and reduce the burden on their family and society. The cost of providing cochlear implants for hearing-impaired children at a young age to make them pursue almost normal academic achievement cannot be compared to the cost of living with lifelong permanent hearing impairment if the operation is delayed. Cochlear implantation is a relatively expensive operation, but the annual loss of one GDP per capita is much more costly to society. This is the argument that should be presented to policy makers to persuade them to take a more societal and long-term viewpoint when making a decision to pay for an immunization program, rehabilitation facility, safe labor initiative or subsidising prosthetics.
Policies in developing countries should aim—beside prevention programs—to reduce the economic burden on the families by providing/subsidising services that the families must pay OOP. Special subsidised insurance schemes and arrangements can be made to allow the children to receive services from private providers if they are not available in public facilities.
Donor organizations should be aware of the magnitude of the economic burden and the potential for preventing it. They should be encouraged to fund programs and services that reduce the OOP expenses by the households to prevent catastrophic expenditure.
Legislation should be passed to encourage employers to allow more disabled persons to enter the labor market.

4.9. Need for Further Research

More research is needed on the cost-effectiveness of interventions and prevention programs for childhood disabilities especially in developing countries. The cost of illness studies like those included in this review can be used as inputs in such cost-effectiveness studies.
More cost of disability studies in developing countries are needed. These studies need to include more details on how costs are calculated and become more explicit in their methodology. A societal perspective should be adopted to show the extent of the burden beyond the family and the health system.
Studies to establish the relation between poverty and disability in developing countries are also needed.

5. Conclusions

All reviewed studies on the cost of childhood disability—despite their methodological heterogeneity—have reached the conclusion that childhood disability causes a considerable burden on family, health system, and society. Childhood disability could be costing societies up to one GDP per capita annually for each disabled child.
This study could not combine the estimated costs into one measure because the studies were not uniform in the costs they included, sources of costs, and methods of calculation. In addition, perspective, study setting, time horizon, and type of disability are all variables that affect which costs are included and how they are calculated. However, standardizing the way we evaluated these costs in relation to the country’s CHE and GDP allowed us to display the results in a graphical way to allow better understanding of the global picture of the burden of childhood disability. Societies in developed countries pay high costs because of childhood disabilities, and families in developing countries are forced below the poverty line by spending most of their income on their disabled child.
Policy makers should be made aware of the heavy consequences of childhood disability, and search for efficient ways to mitigate these effects. Interventions that have already proven effective in preventing disability should be adopted to prevent the occurrence of disability altogether. For non-preventable disabilities; policy makers must ensure the provision of healthcare, special education, and social services for disabled children and their families to alleviate some of the burden on them and allow them to enter the workforce and be more productive. Providing these services, besides being a moral and ethical obligation on more-abled members of society, is reflected positively in the economy by decreasing the societal costs of disabled children and increasing their household productivity.
Research from developing countries is low in quantity and quality. Researchers in developing countries are required to produce more evidence and be clear on details of methods used and how costs were calculated. Careful analysis of the context and the health system of the study setting is essential to reach the correct decisions regarding the perspective of the study and what costs to include. Economic evaluation of prevention programs and therapeutic interventions is needed to highlight potential savings by preventing childhood disabilities or modifying their effect.

Author Contributions

Conceptualization, A.R.S.S. and G.G.; methodology, A.R.S.S.; software, A.R.S.S.; validation, G.G.; formal analysis, A.R.S.S.; resources, A.R.S.S.; data curation, A.R.S.S.; writing—original draft preparation, A.R.S.S.; writing—review and editing, G.G.; visualization, A.R.S.S.; supervision, G.G.; project administration, A.R.S.S. All authors have read and agreed to the published version of the manuscript.

Funding

This research received no external funding.

Institutional Review Board Statement

Not applicable.

Informed Consent Statement

Not applicable.

Data Availability Statement

This is a literature review; data is contained within the article.

Conflicts of Interest

The authors declare no conflict of interest.

Appendix A. Search Strategy for OVID Medline Database

Ovid MEDLINE(R) and Epub Ahead of Print, In-Process and Other Non-Indexed Citations, Daily and Versions(R) <1946 to 03 July 2019>
  • (cost* adj5 (economic or illness or sickness or disease* or care or direct or indirect)).mp. [mp=title, abstract, original title, name of substance word, subject heading word, floating sub-heading word, keyword heading word, organism supplementary concept word, protocol supplementary concept word, rare disease supplementary concept word, unique identifier, synonyms] (127447)
  • exp “cost of illness”/ or exp healthcare costs/ (82347)
  • 1 or 2 (146362)
  • (disable* or disabilit* handicap* or impairment* paralys* paralyz*).mp. [mp=title, abstract, original title, nameof substance word, subject heading word, floating sub-heading word, keyword heading word, organism supplementary concept word, protocol supplementary concept word, rare disease supplementary concept word, unique identifier, synonyms] (77792)
  • exp Disabled Persons/ (62208)
  • cerebral palsy.mp. [mp=title, abstract, original title, name of substance word, subject heading word, floating sub-heading word, keyword heading word, organism supplementary concept word, protocol supplementary concept word, rare disease supplementary concept word, unique identifier, synonyms] (26008)
  • exp cerebral palsy/ (19602)
  • (down* syndrome or mongolism or trisomy?21).mp. [mp=title, abstract, original title, name of substance word, subject heading word, floating sub-heading word, keyword heading word, organism supplementary concept word, protocol supplementary concept word, rare disease supplementary concept word, unique identifier, synonyms] (29343)
  • exp down syndrome/ (23636)
  • autis*.mp. [mp=title, abstract, original title, name of substance word, subject heading word, floating sub-heading word, keyword heading word, organism supplementary concept word, protocol supplementary concept word, rare disease supplementary concept word, unique identifier, synonyms] (46566)
  • exp Autistic Disorder/ or exp Autism Spectrum Disorder/ (26617)
  • 4 or 5 or 6 or 7 or 8 or 9 or 10 or 11 (187674)
  • (child* or boy* or girl* or adolescent* or infant* or pediatric* or paediatric or (schoolage* or (school adj1 age*)) or (preschool* or (pre adj1 school*))).mp. [mp=title, abstract, original title, name of substance word, subject heading word, floating sub-heading word, keyword heading word, organism supplementary concept word, protocol supplementary concept word, rare disease supplementary concept word, unique identifier, synonyms] (3934927)
  • exp child/ or exp Disabled Children/ or exp Child Health Services/ (1841396)
  • 13 or 14 (3935165)
  • 3 and 12 and 15 (1121)
  • limit 16 to (english language and yr=“1980 -Current”) (1046)

Appendix B. Search Strategy for OVID Embase Database

Embase Classic+Embase <1947 to 2019 July 03>
  • (cost* adj5 (economic or illness or sickness or disease* or care or direct or indirect)).mp. [mp=title, abstract, heading word, drug trade name, original title, device manufacturer, drug manufacturer, device trade name, keyword, floating subheading word, candidate term word] (284046)
  • exp “cost of illness”/ or exp health care costs/ (291451)
  • 1 or 2 (370332)
  • (disable* or disabilit* handicap* or impairment* paralys* paralyz*).mp. [mp=title, abstract, heading word, drug trade name, original title, device manufacturer, drug manufacturer, device trade name, keyword, floating subheading word, candidate term word] (63633)
  • exp Disabled Persons/ (57465)
  • cerebral palsy.mp. [mp=title, abstract, heading word, drug trade name, original title, device manufacturer, drug manufacturer, device trade name, keyword, floating subheading word, candidate term word] (41772)
  • exp cerebral palsy/ (38329)
  • (down* syndrome or mongolism or trisomy?21).mp. [mp=title, abstract, heading word, drug trade name, original title, device manufacturer, drug manufacturer, device trade name, keyword, floating subheading word, candidate term word] (40125)
  • exp down syndrome/ (36240)
  • autis*.mp. [mp=title, abstract, heading word, drug trade name, original title, device manufacturer, drug manufacturer, device trade name, keyword, floating subheading word, candidate term word] (69358)
  • exp Autistic Disorder/ or exp Autism Spectrum Disorder/ (63878)
  • 4 or 5 or 6 or 7 or 8 or 9 or 10 or 11 (230190)
  • (child* or boy* or girl* or adolescent* or infant* or pediatric* or paediatric or (schoolage* or (school adj1 age*)) or (preschool* or (pre adj1 school*))).mp. [mp=title, abstract, heading word, drug trade name, original title, device manufacturer, drug manufacturer, device trade name, keyword, floating subheading word, candidate term word] (4146231)
  • exp child/ or exp Disabled Children/ or exp Child Health Services/ (2909761)
  • 13 or 14 (4427076)
  • 3 and 12 and 15 (1415)
  • limit 16 to (english language and yr=“1980-Current”) (1326)

Appendix C. Search Strategy for OVID Econlit Database

Econlit <1886 to June 27, 2019>
  • (disable* or disabilit* handicap* or impairment* paralys* paralyz*).mp. [mp=heading words, abstract, title, country as subject] (1187)
  • cerebral palsy.mp. [mp=heading words, abstract, title, country as subject] (9)
  • (down* syndrome or mongolism or trisomy?21).mp. [mp=heading words, abstract, title, country as subject] (10)
  • autis*.mp. [mp=heading words, abstract, title, country as subject] (70)
  • (child* or boy* or girl* or adolescent* or infant* or pediatric* or paediatric or (schoolage* or (school adj1 age*)) or (preschool* or (pre adj1 school*))).mp. [mp=heading words, abstract, title, country as subject] (39334)
  • (cost* or burden*).mp. [mp=heading words, abstract, title, country as subject] (191228)
  • 1 or 2 or 3 or 4 (1268)
  • 5 and 6 and 7 (44)
  • limit 8 to (yr=“1980-Current” and english) (42)

Appendix D. Search Strategy for OVID Global Health Database

Global Health <1910 to 2019 Week 26>
  • (cost* adj5 (economic or illness or sickness or disease* or care or direct or indirect)).mp. [mp=abstract, title, original title, broad terms, heading words, identifiers, cabicodes] (24319)
  • exp “cost of illness”/ or exp health care costs/ (11630)
  • estimated costs/ or health care costs/ or costs/ or social costs/ or unit costs/ or specific costs/ or total costs/ (26116)
  • exp “cost analysis”/ or exp costs/ or exp “cost effectiveness analysis”/ (30831)
  • 1 or 2 or 3 or 4 (38096)
  • (disable* or disabilit* handicap* or impairment* paralys* paralyz*).mp. [mp=abstract, title, original title, broad terms, heading words, identifiers, cabicodes] (6019)
  • exp Disabled Persons/ (4887)
  • cerebral palsy.mp. [mp=abstract, title, original title, broad terms, heading words, identifiers, cabicodes] (1407)
  • exp cerebral palsy/ (1061)
  • (down* syndrome or mongolism or trisomy?21).mp. [mp=abstract, title, original title, broad terms, heading words, identifiers, cabicodes] (1981)
  • autis*.mp. [mp=abstract, title, original title, broad terms, heading words, identifiers, cabicodes] (2467)
  • disabilities.sh. (7353)
  • exp disabilities/ or exp people with disabilities/ (11117)
  • cerebral palsy.sh. (1061)
  • exp autism/ (1831)
  • Down’s syndrome.sh. (1623)
  • 6 or 7 or 8 or 9 or 10 or 11 or 12 or 13 or 14 or 15 or 16 (18089)
  • (child* or boy* or girl* or adolescent* or infant* or pediatric* or paediatric or (schoolage* or (school adj1 age*)) or (preschool* or (pre adj1 school*))).mp. [mp=abstract, title, original title, broad terms, heading words, identifiers, cabicodes] (530913)
  • exp children/ (339666)
  • 18 or 19 (530913)
  • 5 and 17 and 20 (108)
  • limit 21 to (english language and yr=“1980-Current”) (89)

Appendix E

Table A1. Checklist Used for Critical Appraisal.
YesNoN/A
Was a well-defined question posed in answerable form?
  • Did the study examine costs of the service(s) or programme(s)?
2.
Did the study involve a comparison group?
3.
Was a viewpoint for the analysis stated and was the study placed in any particular decision-making context?
4.
Were the patient population and any relevant subgroups adequately defined?
Were all the important and relevant costs identified?
5.
Was the range wide enough for the research question at hand?
6.
Did it cover all relevant viewpoints? (Possible viewpoints include the community or social viewpoint, and those of patients and third-party payers. Other viewpoints may also be relevant depending upon the particular analysis.)
7.
Were the capital costs, as well as operating costs, included?
Were costs measured accurately in appropriate physical units (e.g., hours of nursing time, number of physician visits, lost work-days)?
8.
Were any of the identified items omitted from measurement? If so, does this mean that they carried no weight in the subsequent analysis?
9.
Were there any special circumstances (e.g., joint use of resources) that made measurement difficult? Were these circumstances handled appropriately?
Were the costs valued credibly?
10.
Were the sources of all values clearly identified? (Possible sources include market values, patient or client preferences and views, policy-makers’ views and health professionals’ judgements)?
11.
Were market values employed for changes involving resources gained or depleted?
12.
Where market values were absent (e.g., volunteer labour), or market values did not reflect actual values (such as clinic space donated at a reduced rate), were adjustments made to approximate market values?
Were costs adjusted for differential timing?
13.
Were costs that occur in the future ‘discounted’ to their present values?
14.
Was there any justification given for the discount rate used?
Was uncertainty in the estimates of costs adequately characterized?
15.
If patient-level data on costs available, were appropriate statistical analyses performed?
16.
Were the conclusions of the study sensitive to the uncertainty in the results, as quantified by the statistical analysis?
17.
Was heterogeneity of the patient population recognized, for example by presenting study results for relevant subgroups?
Did the presentation and discussion of study results include all issues of concern to users?
18.
Were the results compared with those of others who have investigated the same question? If so, were allowances made for potential differences in study methodology?
19.
Did the study discuss the generalisability of the results to other settings and patient/client groups?
20.
Were the implications of uncertainty for decision-making, including the need for future research, explored?

Appendix F

Table A2. Data Extraction.
Author and SettingResearch QuestionPerspective and Time HorizonMedical Condition Method of Disability DefinitionMethod(s) of Calculating CostSummary of the Main Findings/2019 DollarsComments
Francesca Solmi [33], 2018, UK, Developedto quantify the cost of mental and physical disability in childhood and adolescence to families in the UKhousehold, weeklymultipleDisability Discrimination Act definitionCompensating Variation Annual additional costs to households with a mentally disabled child ≈$3600, for severely disabled child ≈$4200 and for physically disabled children ≈$2600New approach for estimating burden of disability
Martin Knapp [38], 2009, UK, Developedto estimate the societal costs of Autism Spectrum Disorders (ASDs) in the UK by combining national datasocietal, lifetimeASDConfirmed diagnosis of Autism or Pervasive Developmental Disorder (PDD) from a variety of tests and instruments in the original studiesmodular approach from several sources to obtain nationally representative data
cost per individual: service use data from recent studies
lost productivity: estimated from national estimates of average weekly wage for full-time employees at April 2005 (£431)
Average annual total cost of supporting a child with ASDs ≈$42,500
Lifetime costs of a child with ASD and intellectual disability ≈$2 million
Michael L. Ganz [39], 2007, USA, DevelopedTo estimate lifetime incremental societal costs of autism in the United Statessocietal, lifetimeASDmultiple sources(A prevalence-based cohort) cross-sectional cost data from different age groups were used to create prevalence-based cost estimates that approximate incidence-based estimates
Direct medical and non-medical costs: obtained from the literature.
Indirect costs: computed using human capital approach.
Costs were projected across the life span, and discounted, then incremental age-specific costs were computed
The lifetime per capita incremental societal cost of autism is ≈$4.3 million
Leslie S. Wilson [43], 2005, USA, Developedcompare types, amounts, and costs of care provided toHuman Immune deficiency Virus HIV-positive children and chronically ill children, using healthy children to control for basic care needssocietal, annualmultipleNot clearHuman capital approachMarket replacement method to calculate the value of lost opportunityAnnual costs for homecare for chronically ill child ≈$36,000 and for HIV positive child ≈$13,000
Informal caregiving represents a substantial economic value to society
Provides good details on estimating opportunity costs
Marie Kruse [40], 2009, Denmark, Developedto quantify the average societal costs of Cerebral Palsy (CP) per individual over a lifetime in Denmarksocietal, lifetimeCPCP cases registered in the National registryQuantified health care, productivity, and social care costs by means of register-based data, in a cross-sectional perspective.
Data for CP cases were linked to the information of national registers by the unique personal identifier, allowing identification of costs attributable to CP.
Productivity loss estimated by human capital approach
Social care costs: estimated from published information on average costs per user, and validated by a group of experts.
The lifetime costs of CP were fo males ≈$1.35 million and females ≈$1.25 millionhigh social care costs and productivity costs associated with CP
Healthcare costs are only 7% of total lifetime societal costs
Good details on methods of calculating each type of cost.
The unique personal identifier used in all Danish registers allows comprehensive register linkages and vast analysis opportunities.
Krister Jarbrink [44], 2007, Sweden, Developedto describe and evaluate the societal costs of ASD for children living in a Swedish municipalitysocietal, annualASDConfirmed diagnosis of ASDData collected from service use and combined with unit costsproductivity loss, by human capital approach (lost hour of work was valued using the average gross wage)
The unit cost for valuation of losses in time for unpaid work and leisure time was set to 35 percent of the average gross wage
Additional annual societal cost due to ASD ≈$69,000
Main cost drivers are the community support services and schooling
very good methodology for estimating societal costs
mall sample size
Elizabeth A. Geelhoed [45], 2011, Australia, DevelopedTo assess the direct annual health care costs for children and adolescents with Down syndrome (DS) in Western Australiahealth system, annualDSchildren/young adults registered in Disability Services Commission with DSResource items: from survey reported by the family, computed to units per year, and costed according to the unit price
Medical costs: from the Medical Benefit ScheduleHome and community care services: from the Disability Services Commission
Hospital admission costs: mean bed day costMedications: Schedule of Pharmaceutical Benefits
Complementary medicines, non-durable health-related products, and therapeutic devices: based on expenditure provided by the parents
The total mean annual health care costs across all age groups was ≈$3600, with a median of ≈$1500Overall, costs decrease with age with most costs in the first two years of lifeGood details of how the cost of each item was calculated
Costs presented in both meanto represent the total cost burden, and median to represent expected cost for an individual
Aine Roddy [46], 2019, Ireland, DevelopedEstimate the societal cost of childhood ASDs and explain the variation in costs between state and family Out-Of-Pocket (OOP) expendituresocietal, annualASDfrom autism organizations database and social media!Data collected through an online survey to parentsA bottom-up prevalence based cost-of-illness methodology adopting a societal perspective
Resources consumed: multiplied by unit costs then summed to produce individual aggregate costs
Parental OOP expenditure: only attributable to ASD
Informal care costs: only for parents who gave up employment because of their child’s condition using a human capital approachbased on the industrial wage per hour
Annual average family OOP costs for ASD case ≈$33,500
Annual average state expenditure per ASD child ≈$16,500
good details on costing methods, systematic
NO control group /low response rate /convenience sample, may not representative
Bin Wang [42], 2008, China, DevelopingMeasure the economic burden of CP in China and its societal impactsocietal, lifetimeCPConfirmed CP diagnostic documentation from a secondary or tertiary hospitalEstimates were obtained from interviewing caregivers of individuals with CP
Human capital approach for indirect cost
Incidence approach rather than prevalenceservice demand rather than need
Average lifetime economic burden of a new CP case born in China in 2003 ≈$91,000
Indirect (productivity) costs are responsible for 93% of total economic loss, and direct healthcare and developmental costs make up 3% each
sample bias is likely as they only recruited 319 patients (all admitted in hospitals) because there is no registry
Dallas Genereaux [47], 2015, Canada, Developedestimate OOP costs to parents, and the non-health system costs to society, of raising a child with intellectual developmental disorder (IDD)societal, annualmultipleConfirmed diagnosis of IDD of unknown causeDirectly reported costs: taken at face value
Opportunity costs: by human capital approach (market-replacement method based on job classification)
Non-hospital therapies: cost per encounter method using labor-market wages for the position
Non-parent volunteered care: labor market average rate
Income loss by parents: hourly wage or yearly income based on their current or most recent job
Median annual parental costs of caring for an IDD child ≈$37,000
Median annual non-health system societal costs ≈$23,000
Main parental cost drivers = income loss and care giving time
Main societal cost driver = special educationParental and societal costs increase with IDD severity
Parental costs are not adequately compensated by government
Very nuanced description of how each cost was estimated
Small sample size, no comparison group
Silvia Martınez-Valverde [48], 2019, Mexico, DevelopingInvestigate the burden of OOP household expenditures and time spent on care by families responsible for children with DShousehold, annualDSConfirmed diagnosis of DS in the outpatient clinic of the genetics departmentCross-sectional analysis based on survey of families of DS childrenTotal OOP expenditures = medical care and transportation for one year
Available household expenditures = total household expenditures—the cost of food and housing
Catastrophic expenditures = if total OOP on medical care and transportation >30% of available household expenditures
67% of the households with children with DS were within the lower four deciles (I–IV) of expenses, indicating a limited ability to pay for medical services.
Yearly OOP expenditures for a child with DS represented 27% of the available household expenditure, which is equivalent to ≈$500
33% of families with DS children had catastrophic expenses
46% of the families had to borrow money to pay for medical expenses
Highlight differences in the health system between developed vs developing countries where the family pays a lot of OOP
Paul W. Newacheck [49], 2004, USA, DevelopedTo examine health care utilization and expenditure patterns for children with disabilitieshealth system, annualmultipleBio-psycho-social approachnot clear if self-reported or from insurance claims!children with disabilities had much higher health care expenditures ≈$3800 than non-disabled ≈$676
and higher OOP expenditures
Low-income families are especially vulnerable to burdensome OOP
M A Hoving [50], 2007, Netherlands, DevelopedEstimate and categorize the expenditures for children with intractable spastic CPsocietal, annualCPDiagnosis with intractable spastic CPBottom-up, disease specific, prevalence-based cost-of-illness studyFrom a societal perspective, mean annual costs were ≈$57,000 more than 11 times the CHE per capita
95% of costs are outside the medical care sector
The societal costs are 71% paid by the health insurers, 24% by the government, 5% by the families
Andrew Kageleiry [35], 2016, USA, DevelopedTo estimate incremental medical costs for DS children, up to the age of 18 years in the USAhealth system, 0-18 yearsDSInternational Classification of Diseases, Ninth revision, Clinical Modification (ICD-9-CM) diagnosis of DSClaim database was used to conduct retrospective cohort study
OOP expenses: from claims data (co-pay and co-insurance)
The observation period for each individual was split into clinically relevant age categories
Average total incremental medical costs for a privately insured DS child from birth till 18 years of age ≈$275,000 of which ≈$20,000 are OOP expenses incurred by the familyOnly direct OOP not including premium and not including education, transportation.
very narrow scope
Moon Seok Park [41], 2011, South Korea, Developedlifetime healthcare costs attributable to cerebral palsy in S. Korea health system, lifetimeCPCP diagnosis by Korean Standard Disease Classification CodesMedical cost data attributable to CP was retrieved from claims data of the national health insurance according to the disease classification codes
CP
The attributable lifetime medical cost of CP in South Korea was ≈$32,000, which is 1.8 times the basic lifetime medical cost of the general populationLifetime cost calculated only from health system perspective but no direct non-medical cost / no OOP / no indirect costs or lost productivity
Narrow scope for lifetime
Barbara Barrett [34], 2015, UK, DevelopedUtilization and costs for: adolescents with autistic disorder, adolescents with other ASDs, adolescents with other special educational needs and typically developing adolescentssocietal, 6 monthsASDClinically diagnosed ASD according to ICD-10Resource use data: self-reported via interview of parents
Total costs: multiply each resource used by unit costs of public services in UK
Costs per individual were highest in the autistic disorder group (≈$35,100), followed by the special educational needs group (≈$29,500), the broader autism spectrum disorder group (≈$28,500) and the typically developing group (≈$9500)STRENGTH: There is comparison group/highlights significant cost of educational services in ASD
WEAKNESS: no indirect family cost, no OOP costs calculated
Chun-Zi Peng [51], 2009, USA, DevelopedTo estimate healthcare utilization rates and cost of care for children with pervasive developmental disorders (PDD)health system, annualmultipleChildren with PPD diagnosis by ICD-9Costs were calculated by summing the claim charges.Average annual medical cost for children with PDD ≈$10,500, eight times that of normal childrenClaims analysis with only direct healthcare data not including OOP/education/other non-medical related expenditures/no societal cost
Ulla K. Griffiths [36], 2012, Senegal, Developingestimate the costs of meningitis sequelae in children in
Senegal from the perspective of households
household, lifetimeBacterial meningitis“sequela” was defined according to the 2006 Global Burden of Disease projectSelf-reported by caregivers even for lostproductivity i.e., income foregone (more appropriate to low-income settings than the human capital or the friction cost approach)Lifetime cost of meningitis sequelae (≈$41,000) is approximately 26 times higher
than the mean cost of treating an acute meningitis episode
The first study that has assessed the costs of meningitis sequelae from the perspective of households in a low-income setting.
Nina Xiong [52], 2011, China, DevelopingTo estimate family costs of raising autistic, physically disabled, or mentally disabled childrenhousehold, annualmultipleNot clearFormula: the raising burden of children with disability = [(the income per person per year of family of normal children—that of family of disabled children) + (the cost per person per year of disabled children—that of normal children)—(the economic assistance per family per year of disabled children—assistance of normal children)]Annual average raising burden of children with autism ≈$3600,
physical disability ≈$3000,
mental disability ≈$1200
Jian-Jun Ou [37], 2015, China, Developingevaluate the employment and financial burdens of families with ASD-diagnosed pre-schoolershousehold, annualASDdiagnosed with ASD in a local hospitalA questionnaire with open questions:
(How much total income do you expect that all family members would have earned in the past year if your child did not have the disease?)
(What were the total educational expenses of the ASD or OD child in your household over the past year, including general/special school education, extracurricular practice, related books/materials, and so on?)
The average loss of annual income associated with having a child with ASD was ≈$7500, compared with ≈$3500 for families of OD childrenOpportunity cost is measured through parents’ reporting rather than the typical human capital method

References

  1. World Health Organisation; World Bank. World report on disability. Lancet 2011, 377. Available online: http://www.larchetoronto.org/wordpress/wp-content/uploads/2012/01/launch-of-World-Report-on-Disability-Jan-27-121.pdf (accessed on 10 July 2019). [CrossRef]
  2. WHO. WHO Disability and Health Fact Sheet. 2018. Available online: https://www.who.int/news-room/fact-sheets/detail/disability-and-health (accessed on 29 October 2018).
  3. World Health Organization; UNICEF. Early Childhood Development & Disability: A Discussion Paper; WHO Press: Geneva, Switzerland, 2012; pp. 1–36. [Google Scholar]
  4. Cappa, C.; Petrowski, N.; Njelesani, J. Navigating the landscape of child disability measurement: A review of available data collection instruments. Alter 2015, 9, 317–330. [Google Scholar] [CrossRef]
  5. Maulik, P.K.; Darmstadt, G.L. Childhood Disability in Low- and Middle-Income Countries: Overview of Screening, Prevention, Services, Legislation, and Epidemiology. Pediatrics 2007, 120, S1–S55. [Google Scholar] [CrossRef] [Green Version]
  6. Mitra, S.; Posarac, A.; Vick, B. Disability and Poverty in Developing Countries: A Multidimensional Study. World Dev. 2013, 41, 1–18. [Google Scholar] [CrossRef]
  7. Porterfield, S.L.; Tracey, C. Disentangling the Dynamics of Family Poverty and Child Disability: Does Disability Come First? Center for Social Development: Saint Louis, MO, USA, 2003. [Google Scholar]
  8. Dávila Quintana, C.D.; Malo, M.A. Poverty dynamics and disability: An empirical exercise using the European community household panel. J. Soc. Econ. 2012, 41, 350–359. [Google Scholar] [CrossRef]
  9. Yeo, R.; Moore, K. Including Disabled People in Poverty Reduction Work: “Nothing About Us, Without Us ”. World Dev. 2003, 31, 571–590. [Google Scholar] [CrossRef]
  10. Mizunoya, S.; Mitra, S.; Yamasaki, I. Disability and school attendance in 15 low- and middle-income countries. World Dev. 2018, 104, 388–403. [Google Scholar] [CrossRef]
  11. Filmer, D. Disability, Poverty, And Schooling in Developing Countries: Results from 14 Household Surveys. World Bank Econ. Rev. 2008, 22, 141–163. [Google Scholar] [CrossRef] [Green Version]
  12. Ali, Z.; Zulfiqar, A. Economics of Disability in Bangladesh; Shiree Working Paper No. 29; EEP/Shiree: Dhaka, Bangladesh, 2015; p. 16. [Google Scholar]
  13. Mont, D. Childhood Disability and Poverty. SSRN Electron. J. 2019. [Google Scholar] [CrossRef]
  14. Mont, D.; Cappa, C.; Chetri, N.B.; Dorji, C.; Hingst, G.; Khan, N. Poverty, Maternal Education and Child Disability: Evidence from Bhutan. Disabil. Int. Dev. 2013, 3, 13–20. Available online: www.zbdw.de (accessed on 11 July 2019).
  15. Hakim, G.; Jaganjac, N. A Note on Disability Issues in the Middle East and North Africa; The World Bank: Washington, DC, USA, 2005. [Google Scholar]
  16. Banks, L.M.; Polack, S. The Economic Costs of Exclusion and Gains of Inclusion of People with Disabilities: Evidence from Low and Middle Income Countries; International Centre for Evidence in Disability: London, UK, 2014. [Google Scholar]
  17. Mitra, S.; Palmer, M.; Kim, H.; Mont, D.; Groce, N. Extra costs of living with a disability: A review and agenda for research. Disabil. Health J. 2017, 10, 475–484. [Google Scholar] [CrossRef]
  18. Ettaro, L.; Songer, T.J.; Zhang, P.; Engelgau, M.M. Cost-of-Illness Studies in Diabetes Mellitus. PharmacoEconomics 2004, 22, 149–164. [Google Scholar] [CrossRef]
  19. Rice, D.P. Estimating the cost of illness. Am. J. Public Health Nations Health 1967, 57, 424–440. [Google Scholar] [CrossRef]
  20. Fox-Rushby, J.; Cairns, J. Economic Evaluation; McGraw-Hill Education: Berkshire, UK, 2005. [Google Scholar]
  21. Vassall, A.; Sweeney, S.; Kahn, J.G.; Gomez, G.; Bollinger, L.; Marseille, E.; Herzel, B.; Plosky, W.D.; Cunnama, L.; Sinanovic, E.; et al. Reference Case for Estimating the Costs of Global Health Services and Interventions; Global Health Cost Consortium: Washington, DC, USA, 2017. [Google Scholar]
  22. Stabile, M.; Allin, S. The Economic Costs of Childhood Disability. Future Child. 2012, 22, 65–96. [Google Scholar] [CrossRef] [PubMed]
  23. Beecham, J. Annual Research Review: Child and adolescent mental health interventions: A review of progress in economic studies across different disorders. J. Child Psychol. Psychiatry 2014, 55, 714–732. [Google Scholar] [CrossRef] [PubMed] [Green Version]
  24. Anderson, D.; Dumont, S.; Jacobs, P.; Azzaria, L. The Personal Costs of Caring for a Child with a Disability: A Review of the Literature. Public Health Rep. 2007, 122, 3–16. [Google Scholar] [CrossRef] [PubMed]
  25. Siddaway, A.P.; Wood, A.M.; Hedges, L.V. How to Do a Systematic Review: A Best Practice Guide for Conducting and Reporting Narrative Reviews, Meta-Analyses, and Meta-Syntheses. Annu. Rev. Psychol. 2019, 70, 747–770. [Google Scholar] [CrossRef] [PubMed]
  26. Moher, D. Preferred Reporting Items for Systematic Reviews and Meta-Analyses: The PRISMA Statement. Ann. Intern. Med. 2009, 151, 264. [Google Scholar] [CrossRef] [Green Version]
  27. World Bank. World Bank Country and Lending Groups. Available online: https://datahelpdesk.worldbank.org/knowledgebase/articles/906519-world-bank-country-and-lending-groups (accessed on 4 August 2020).
  28. Aveyard, H. Doing a Literature Review in Health and Social Care: A Practical Guide, 3rd ed.; Open University Press: Maidenhead, UK, 2014. [Google Scholar]
  29. Drummond, M.F.; Sculpher, M.J.; Claxton, K.; Stoddart, G.L.; Torrance, G.W. Methods for the Economic Evaluation of Health Care Programmes, 4th ed.; Oxford University Press: Oxford, UK, 2015. [Google Scholar]
  30. World Health Organization. Global Health Expenditure Database. 2019. Available online: https://apps.who.int/nha/database/ViewData/Indicators/en (accessed on 20 September 2019).
  31. International Monetary Fund. World Economic Outlook Database. 2018. Available online: https://www.imf.org/external/pubs/ft/weo/2018/02/weodata/weoselgr.aspx (accessed on 9 February 2019).
  32. International Monetary Fund. Consumer Price Index—Сopy of By Country—IMF Data [Internet]. Available online: http://data.imf.org/?sk=4FFB52B2-3653-409A-B471-D47B46D904B5&sId=1485878802128 (accessed on 19 August 2019).
  33. Solmi, F.; Melnychuk, M.; Morris, S. The cost of mental and physical health disability in childhood and adolescence to families in the UK: Findings from a repeated cross-sectional survey using propensity score matching. BMJ Open 2018, 8, e018729. [Google Scholar] [CrossRef]
  34. Barrett, B.; Mosweu, I.; Jones, C.R.; Charman, T.; Baird, G.; Simonoff, E.; Pickles, A.; Happé, F.; Byford, S. Comparing service use and costs among adolescents with autism spectrum disorders, special needs and typical development. Autism 2015, 19, 562–569. [Google Scholar] [CrossRef] [Green Version]
  35. Kageleiry, A.; Samuelson, D.; Duh, M.S.; Lefebvre, P.; Campbell, J.; Skotko, B.G. Out-of-pocket medical costs and third-party healthcare costs for children with Down syndrome. Am. J. Med. Genet. Part A 2017, 173, 627–637. [Google Scholar] [CrossRef] [PubMed]
  36. Griffiths, U.K.; Dieye, Y.; Fleming, J.; Hajjeh, R.; Edmond, K. Costs of Meningitis Sequelae in Children in Dakar, Senegal. Pediatric Infect. Dis. J. 2012, 31, e189–e195. [Google Scholar] [CrossRef] [PubMed]
  37. Ou, J.-J.; Shi, L.-J.; Xun, G.-L.; Chen, C.; Wu, R.-R.; Luo, X.-R.; Zhang, F.-Y.; Zhao, J.-P. Employment and financial burden of families with preschool children diagnosed with autism spectrum disorders in urban China: Results from a descriptive study. BMC Psychiatry 2015, 15, 3. [Google Scholar] [CrossRef] [PubMed] [Green Version]
  38. Knapp, M.; Romeo, R.; Beecham, J. Economic cost of autism in the UK. Autism 2009, 13, 317–336. [Google Scholar] [CrossRef] [PubMed]
  39. Ganz, M.L. The Lifetime Distribution of the Incremental Societal Costs of Autism. Arch. Pediatric Adolesc. Med. 2007, 161, 343–349. [Google Scholar] [CrossRef] [PubMed] [Green Version]
  40. Kruse, M.; Michelsen, S.I.; Flachs, E.M.; Brønnum-Hansen, H.; Madsen, M.; Uldall, P. Lifetime costs of cerebral palsy. Dev. Med. Child Neurol. 2009, 51, 622–628. [Google Scholar] [CrossRef] [PubMed]
  41. Park, M.S.; Kim, S.J.; Chung, C.Y.; Kwon, D.G.; Choi, I.H.; Lee, K.M. Prevalence and lifetime healthcare cost of cerebral palsy in South Korea. Health Policy 2011, 100, 234–238. [Google Scholar] [CrossRef] [PubMed]
  42. Wang, B.; Chen, Y.; Zhang, J.; Li, J.; Guo, Y.; Hailey, D. A preliminary study into the economic burden of cerebral palsy in China. Health Policy 2008, 87, 223–234. [Google Scholar] [CrossRef]
  43. Wilson, L.S.; Moskowitz, J.T.; Acree, M.; Heyman, M.B.; Harmatz, P.; Ferrando, S.J.; Folkman, S. The Economic Burden of Home Care for Children with HIV and Other Chronic Illnesses. Am. J. Public Health 2005, 95, 1445–1452. [Google Scholar] [CrossRef] [PubMed]
  44. Järbrink, K. The economic consequences of autistic spectrum disorder among children in a Swedish municipality. Autism 2007, 11, 453–463. [Google Scholar] [CrossRef]
  45. Geelhoed, E.A.; Bebbington, A.; Bower, C.; Deshpande, A.; Leonard, H. Direct Health Care Costs of Children and Adolescents with Down Syndrome. J. Pediatrics 2011, 159, 541–545. [Google Scholar] [CrossRef] [PubMed] [Green Version]
  46. Roddy, A.; O’Neill, C. The economic costs and its predictors for childhood autism spectrum disorders in Ireland: How is the burden distributed? Autism 2019, 23, 1106–1118. [Google Scholar] [CrossRef] [Green Version]
  47. Genereaux, D.; Van Karnebeek, C.D.; Birch, P.H. Costs of caring for children with an intellectual developmental disorder. Disabil. Health J. 2015, 8, 646–651. [Google Scholar] [CrossRef] [PubMed]
  48. Martínez-Valverde, S.; Salinas-Escudero, G.; García-Delgado, C.; Garduño-Espinosa, J.; Morán-Barroso, V.F.; Granados-García, V.; Tiro-Sánchez, M.T.; Toledano-Toledano, F.; Aldaz-Rodríguez, M.V. Out-of-pocket expenditures and care time for children with Down Syndrome: A single-hospital study in Mexico City. PLoS ONE 2019, 14, e0208076. [Google Scholar] [CrossRef] [PubMed]
  49. Newacheck, P.W.; Inkelas, M.; Kim, S.E. Health services use and health care expenditures for children with disabilities. Pediatrics 2004, 114, 79–85. [Google Scholar] [CrossRef] [PubMed] [Green Version]
  50. Hoving, M.; Evers, S.M.; Ament, A.; Van Raak, E.; Vles, J. Intractable spastic cerebral palsy in children: A Dutch cost of illness study. Dev. Med. Child Neurol. 2007, 49, 397–398. [Google Scholar] [CrossRef]
  51. Peng, C.-Z.; Hatlestad, P.; Klug, M.G.; Kerbeshian, J.; Burd, L. Health Care Costs and Utilization Rates for Children with Pervasive Developmental Disorders in North Dakota from 1998 to 2004: Impact on Medicaid. J. Child Neurol. 2009, 24, 140–147. [Google Scholar] [CrossRef]
  52. Xiong, N.; Yang, L.; Yu, Y.; Hou, J.; Li, J.; Li, Y.; Liu, H.; Zhang, Y.; Jiao, Z. Investigation of raising burden of children with autism, physical disability and mental disability in China. Res. Dev. Disabil. 2011, 32, 306–311. [Google Scholar] [CrossRef]
  53. Melnychuk, M.; Solmi, F.; Morris, S. Using compensating variation to measure the costs of child disability in the UK. Eur. J. Health Econ. 2018, 19, 419–433. [Google Scholar] [CrossRef] [PubMed] [Green Version]
  54. Mihaylova, B.; Briggs, A.; O’Hagan, A.; Thompson, S.G. Review of statistical methods for analysing healthcare resources and costs. Health Econ. 2010, 20, 897–916. [Google Scholar] [CrossRef] [PubMed]
Figure 1. Literature selection process.
Ijerph 18 03531 g001
Figure 2. Geographical distribution of the review studies This is a royalty free image, ©Copyright J. Bruce Jones 2019 www.mapsfordesign (accessed on 26 August 2019).
Ijerph 18 03531 g002
Figure 3. Annual childhood disability costs compared with CHE per capita. Care must be taken not to simply compare the costs from different studies as there are considerable methodological differences between them, this graph is just a way of summarizing these differences.
Ijerph 18 03531 g003
Figure 4. Annual childhood disability costs compared with GDP per capita. Care must be taken not to simply compare the costs from different studies as there are considerable methodological differences between them, this graph is just a way of summarizing these differences.
Ijerph 18 03531 g004
Table 1. Results of the literature review on costs of childhood disability.
First Author and Year of PublicationSettingPerspectiveTime HorizonMedical Condition Costs in 2019 US$CHE per Capita 2019 US$ (% of Estimated Costs) *GDP per Capita 2019 US$ (% of Estimated Costs) **
Solmi [33], 2018UK, DevelopedHouseholdWeeklyMentally DisabledAnnual 36254267 (85%)42,310 (9%)
Severely DisabledAnnual 4200 4267 (98%)42,310 (10%)
Physically DisabledAnnual 26004267 (61%)42,310 (6%)
Knapp [38], 2009UK, DevelopedSocietalLifetimeASDLifetime 2,060,060
Annual 42,5394267 (997%)42,310 (101%)
Ganz [39], 2007USA, DevelopedSocietalLifetimeASDLifetime 4,345,600
Annual 69,53010,640 (653%)64,767 (107%)
Wilson [43], 2005 USA, DevelopedSocietalAnnualChronically illAnnual 36,31010,640 (341%)64,767 (56%)
HIV positiveAnnual 13,03910,640 (123%)64,767 (20%)
Kruse [40], 2009Denmark, DevelopedSocietalLifetimeCPLifetime
1,344,340 men
1,250,550 women
Annual
19,205 men
17,865 women
6000
(320%)
(298%)
59,999
(32%)
(30%)
Jarbrink [44], 2007Sweden, DevelopedSocietalAnnualASDAnnual 68,8636156 (1119%)53,004 (130%)
Geelhoed [45], 2011Australia, DevelopedHealth systemAnnualDSAnnual 36025393 (67%)55,421 (6%)
Roddy [46], 2019Ireland, DevelopedSocietalAnnualASDAnnual 49,8675130 (972%)76,911 (65%)
Wang [42], 2008China, DevelopingSocietalLifetimeCPLifetime 91,046
Annual 2365429 (551%)10,153 (23%)
Genereaux [47], 2015Canada, DevelopedSocietalAnnualIDDAnnual 60,0594806 (1250%) 46,419 (129%)
Martınez-Valverde [48], 2019Mexico, DevelopingHouseholdAnnualDSAnnual 501498 (101%)9858 (5%)
Newacheck [49], 2004USA, DevelopedHealth systemAnnualMultipleAnnual 383310,640 (36%)64,767 (6%)
Hoving [50], 2007 Netherlands, DevelopedSocietalAnnualCPAnnual 57,3835112 (1123%)53,016 (108%)
Kageleiry [35], 2016USA, DevelopedHealth systemChildhood (0–18 yrs)DS0–18 yrs 275,603
Annual 15,31110,640 (144%)64,767 (24%)
Park [41], 2011South Korea, DevelopedHealth systemLifetimeCPLifetime 32,003
Annual 4572203 (21%)30,028 (1%)
Barrett [34], 2015 UK, Developedsocietal6 monthsAutistic DisorderAnnual 35,1004267 (823%)42,310 (83%)
Special Educational NeedsAnnual 29,5034267 (691%)42,310 (70%)
ASDAnnual 28,5484267 (669%)42,310 (67%)
Peng [51], 2009USA, DevelopedHealth systemAnnualPDDAnnual 10,53810,640 (99%)64,767 (16%)
Griffiths [36], 2012Senegal, DevelopingHouseholdLifetimeBacterial MeningitisLifetime 41,230
Annual 137458 (2370%)1510 (91%)
Xiong [52], 2011 China, DevelopingHouseholdAnnualAutismAnnual 3566429 (831%)10,153 (35%)
Physical DisabilityAnnual 2989429 (697%)10,153 (29%)
Mental DisabilityAnnual 1164429 (271%)10,153 (11%)
Ou [37], 2015China, DevelopingHouseholdAnnualASDAnnual 7470429 (1741%)10,153 (74%)
* % = (annual costs/current health expenditure (CHE) per capita). ** % = (annual costs/gross domestic product (GDP) per capita). Studies are arranged by strength of evidence according to our critical appraisal tool, the highest quality at the top. ASD = Autism Spectrum Disorders, CP = Cerebral Palsy, DS = Down Syndrome, IDD = Intellectual Developmental Disorder, PDD = Pervasive Developmental Disorder. Care must be taken not to simply compare the costs from different studies as there are considerable methodological differences between them, this table is just a way of summarizing these differences. The study by Knapp et al estimated both annual costs (survey based) and modelled lifetime costs (model based). Unlike the rest of lifetime studies in this review, what we are presenting for this study as annual cost is the number reported by Knapp not our calculation from dividing lifetime costs by number of years in the model.
Publisher’s Note: MDPI stays neutral with regard to jurisdictional claims in published maps and institutional affiliations.

