
Effects of Classroom Active Desks on Children and Adolescents’ Physical Activity, Sedentary Behavior, Academic Achievements and Overall Health: A Systematic Review

 , ,
, ,  , ,
, ,
Abstract
1. Introduction
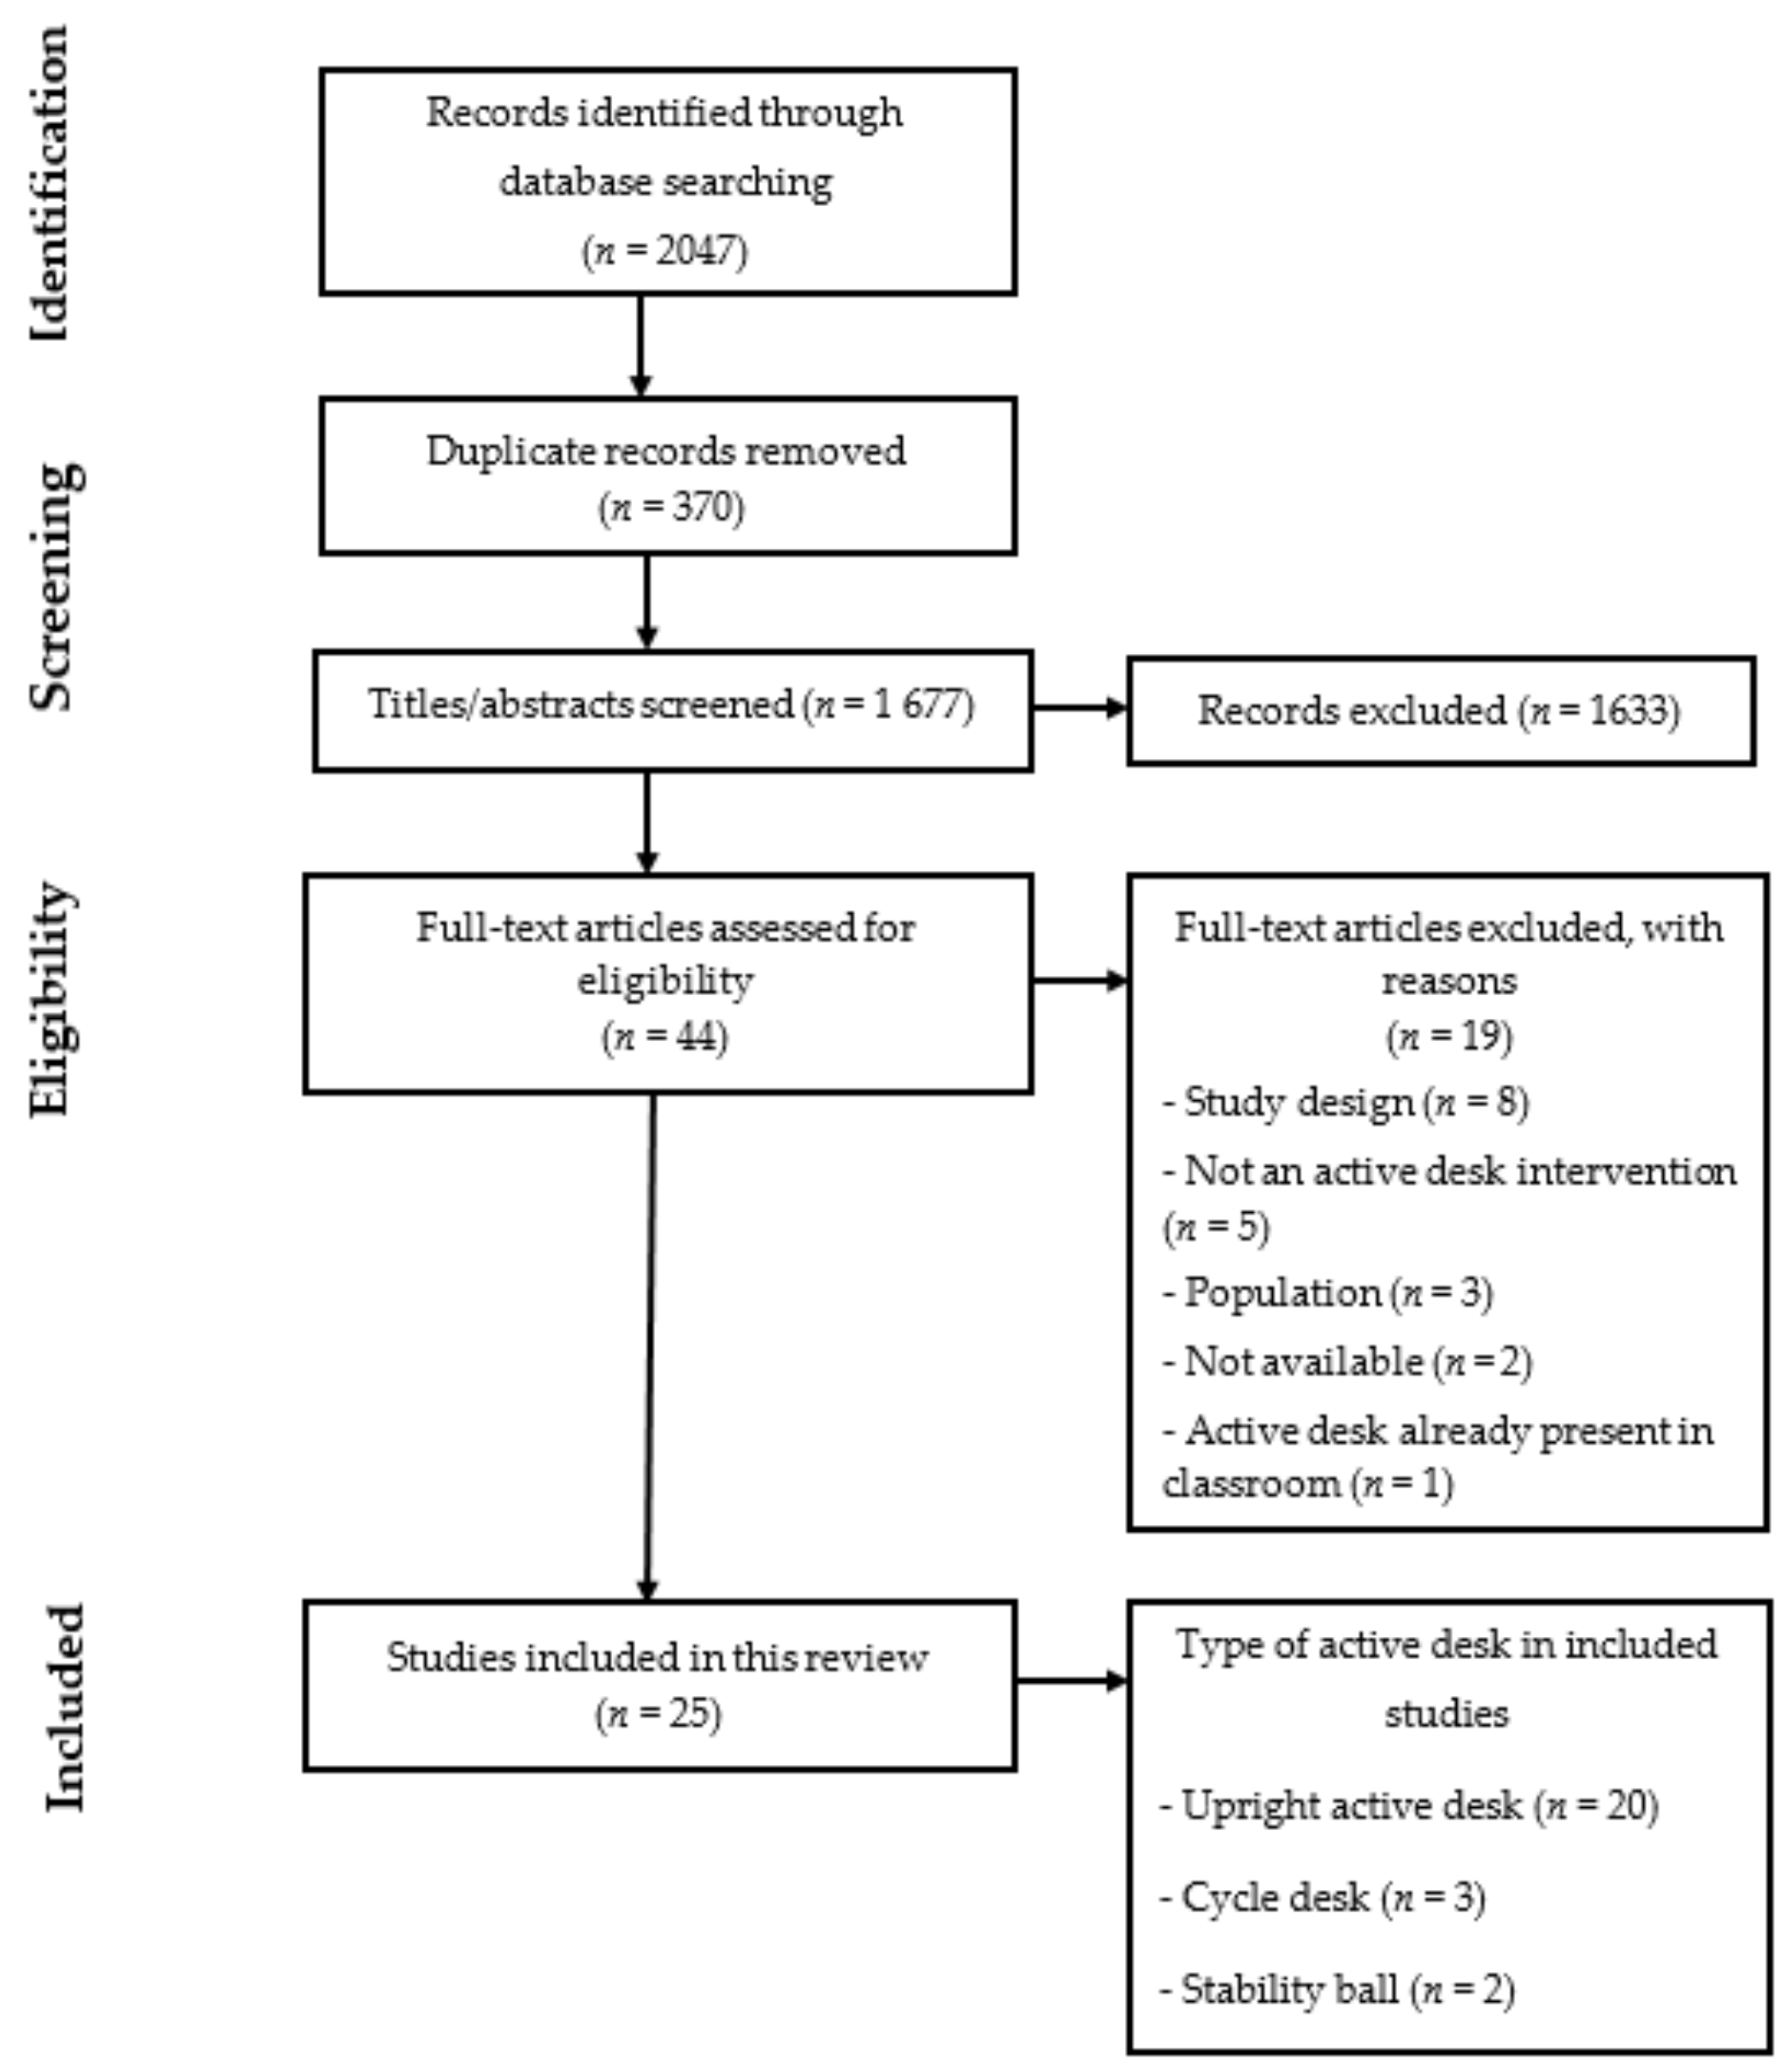
2. Methods
2.1. Search Strategy
2.2. Eligibility Criteria
2.2.1. Inclusion Criteria
2.2.2. Exclusion Criteria
2.3. Synthesis of Results

| Active Desk Type | Description | Range of Price (USD) | Pictures |
|---|---|---|---|
| Upright active desk | Corresponds to standing desk, sit-to-stand desk or stand-biased desk. | 150–900 |   |
| Cycling desk | Is a stationary bike with a desk enabling individuals to work while cycling | 200–900 |  |
| Stability ball | Replace the traditional chair with a stability ball on individual desk | 10–100 |  |
| Author (Country) | Study Design | School Description | Sample Description | Type of Active Desk | Intervention Description | Outcomes |
|---|---|---|---|---|---|---|
| Upright active desk | ||||||
| Benden et al. (2011) (Texas, USA) [40] | RCT * | 1 E | N = 58 Age: NR Sex: NR Grade: 1 BMI: NR Race/ethnie: NR Total study groups: 4 classrooms (2 IG and 2 CG) IG (N = 31) CG (N = 27) | Upright active desks + stools | Treatment length: 9 months (2009–2010 school year) Active desks: individuals Active desks usage time per week: all the school day | EE Body composition (body mass, BMI, body fat percentage) Method: BodyBugg Armband |
| Benden et al. (2012) (Texas, USA) [41] | NRT | 1 E | N = 9 Age range: 6–8 y Grade: 1st grade Sex: girls 33% BMI: 19.5 ± 4.3 kg·m2 Race/ethnie: NR | Upright active desks + stools | Treatment length: 5 months Active desks: individuals They used traditional desk on fall semester before swapping stand-biased for spring semester Active desks usage time per week: own volition | Body composition (weight, BMI) EE Step count Methods: Bodybugg Armband A digital scale |
| Benden et al. (2014) (Texas, USA) [42] | RCT | 1 E | N = 326 Mean age: 8.5 y Sex: girls 51.23% Grade: 2, 3, 4 Race/ethnie: White (70.55%), Black (10.12%), Hispanic (10.74%), Asian (7.98%), Native American (0.61%) Total study groups: 8 classrooms (4 IG and 4 CG) Interventional group (N = 202) BMI IG: 17.44 ± 3.26 kg·m2 Overweight and obesity IG: 16% overweight and 13% obesity Control group (N = 124) BMI CG: 17.73 ± 3 kg·m2 Overweight and obesity CG: 5% with overweight and 16% with obesity | Upright active desks + stools | Treatment length: 9 months (2012–2013 school year) Active desks: individuals Active desks usage time per week: all the school day | Body composition (BMI, body mass) Step count EE Method: Sensewear armband |
| Blake et al. (2012) (Texas, USA) [43] | NRCT * | 1 E | N = NR Age range: 6–7 y Grade: 1st Sex: NR BMI: NR Race/ethnie: NR Total study groups: 5 groups (2 IG, 2 CG, 1 within-group comparisons) | Upright active desks + stools | Treatment length: 1 year Active desks: individuals Active desks usage per week: own volition | Sitting and standing time EE On-task behavior (concentration, engagement) Process evaluation Methods: BodyBugg armband Interviews |
| Clemes et al. (2016) (Melbourne, Australia **) [31] | RCT * | 1 E | N = 44 Mean age: 11.6 ± 0.5 y Grade: 6 Sex: girls 56.8% BMI: 19.4 ± 3.3 kg·m2 Race/ethnie: NR Total study groups: 2 classrooms (1IG and 1CG) IG (N = 24) CG (N = 20) | Upright active desks | Treatment length: 10 weeks (September–Novembrer 2013) Active desks: individuals Active desks usage time per week: children were encouraged to stand at least one 30-min class per day | Sitting, standing and stepping time Step counts Method: Accelerometers (activPAL) |
| Clemes et al. (2016) (Bradford, England **) [31] | NRCT * | E | N = 54 Mean age: 10.0 + 0.3 y Age range: 9–10 y Grade: 5 Sex: NR BMI: 18.3 + 3.2 kg/m2 Race/ethnie: NR Total study groups: IG (N = 27) CG (N = 27) | Upright active desks | Treatment length: 9 weeks (January–April 2014) Active desks: 6 sit-to-stand desks Active desks usage time per weeks: once a day for at least 1 h | Sitting, standing and stepping time Step counts Method: Accelerometers (activPAL) |
| Clemes et al. (2020) (Bradford, England) [44] | RCT * | 8 E | N = 176 Mean age: 9.3 ± 0.5 y Age range: 9–10 y Sex: girls 44.3% Grade: 4–5 Race/ethnie: White British (35.8%), South Asian (48.3%), Other (15.9%) Total study groups: 8 classrooms (4 IG and 4 CG) Interventional group (N = 86) mean age: 9.3 ± 0.4 y BMI: 18.2 ± 3.3 kg·m2 Control group (N = 90) mean age: 9.3 ± 0.5 y BMI: 18.2 ± 4.0 kg·m2 | Upright active desks + stools | Treatment length: 4–5 months (February-July 2017) Active desks: 6 active desks replaced 3 standard desks in IG Active desks usage time per week: at least 1 h/day | Process evaluation PA (MVPA, LPA) Sitting, standing and stepping time Blood pressure Body composition (BMI, body mass) On-task behavior (concentration, engagement) Musculoskeletal discomfort Methods: Inclinometer (ActivPAL3) Bio-impedance (Tanita DC-360S) Accelerometer (ActiGraph GT3x + ) Interview, focus groups Questionnaires Semi-automated recorder (Omron HEM-907) |
| Dornhecker et al. (2015) [45] | NRCT | 3 E | N = 282 Age range: 7–10 y Grade: 2, 3, 4 Sex: girls 53.18% BMI: NR Race/ethnie: Black (12.68%), Hispanic (10.49%), Asian (7.62%), White (69.22%) Total study groups: 2 groups (1 IG and 1 CG) Interventional group (N = 158) Grade 2 (35.44%), Grade 3 (45.57%), Grade 4 (18.99%) Control group (N = 124) Grade 2 (43.55%), Grade 3 (33.87%), Grade 4 (22.58%) | Upright active desks + stools | Treatment length: 5 months Active desks: NR Active desks usage per week: NR | On-task behavior (concentration, engagement) Method: Behavioral Observations of Students in Schools (BOSS) |
| Ee et al. (2018) (Perth, Australia) [32] | Cross-over | 1 E | N = 47 Age range: 10–11 y Grade: 4 Sex: boys 100% BMI: NR Race/ethnie: NR | Upright active desks | Treatment length: Academic year (2016–2017) Active desks: individuals They used 21 school day a standing desk, then they swapped during 21 school day with traditional desk. This swapping continued throughout the school year Active desks usage time per week: all the school day. | Standing and sitting time Sedentary time PA (MVPA, LPA) Musculoskeletal discomfort Methods: Accelerometers (ActiGraph GT9X Link) Nordic Musculoskeletal Questionnaire |
| Kidokoro et al. (2019 ) (Nagano, Japan) [46] | NRCT | 1E | N = 38 Mean age: 11.3 ± 0.5 y Age range: 11–12 y Grade: 6 Sex: girls 42% BMI: IG: 18.3 ± 3.1 CG: 17.4 ± 3.3 Race/ethnie: NR Total study groups: 2 groups (1 IG and 1 CG) Interventional group (N = 18) Mean age: 11.3 ± 0.5 y BMI: 18.3 ± 3 kg·m2 Control group (N = 2O) Mean age: 11.3 ± 0.5 y BMI: 17.4 ± 3.3 kg·m2 | Upright active desk | Treatment length: 6 months (July–December 2018) Active desks: individuals Active desks usage per week: own volition | PA (LPA, MVPA) Sedentary time Process evaluation Methods: Accelerometers (ActiGraph) Questionnaire (Likert-type scale) |
| Koepp et al. (2012) (Idaho, USA) [47] | NRT | 1 E | N = 8 Mean Age: 11.3 ± 0.5 y Grade: 6 Sex: girls 37.5% BMI: 19.4 ± 5.3 kg·m2 Race/ethnie: NR | Upright active desk + stools | Treatment length: 5 months (January–June 2010) Active desks: individuals Active desk usage time week: own volition | Step count Body composition (BMI, weight) Musculoskeletal discomfort On-task behavior (concentration, engagement) Methods: Podometers Observations |
| Mehta et al. (2015) (Texas, USA) [48] | NRT * | 1 S | N = 27 Mean age: 14.30 ± 0.61 y Grade: NR Sex: girls 70.6% BMI: 23.27 ± 4.44 kg·m2 Race/ethnie: White (41%), Hispanic (52%), Black (4%), Asian (4%) | Upright active desks | Treatment length: academic year, 27 weeks of continued exposure Active desks: individuals Active desks usage time per week: own volition | Neurocognitive function Prefrontal Cortex (PFC) Activity Methods: The Psychology Experiment Building Language Wisconsin Card Sorting Task (WCST) Flanker Task (FT) Memory Span Task (MST) Trail-Making Task (TMT) Stroop Color Word Task (SCWT) Functional near infrared spectroscopy (fNIRS) |
| Parry et al. (2019) (Perth, Western Australia) [49] | Cross-over | E | N = 23 Age range: 9–11 y Grade: 4 Sex: boys 100% BMI: NR Race/ethnie: NR | Upright active desk | Treatment length: academic year (2017) Active desks: individuals They used 21 school day a standing desk, then they swapped during 21 school day with traditional desk. This swapping continued throughout the school year Active desks usage time per week: all the school day | Sitting and standing time Sedentary time and PA (MVPA, LPA) Musculoskeletal discomfort Methods: Accelerometers (Actigraph GT9X Link) Modified version of the Nordic Musculoskeletal Questionnaire Focus groups, interview |
| Pickens et al. (2016) (Texas, USA) [50] | RT | 1 S | N = 18 Age: NR Grade: NR Sex: girls 72% BMI: NR Race/ethnie: Hispanic (66%), White (30%) | Upright active desks + stools | Treatment length: 3 months Active desks: individuals Active desks usage time per week: NR | Step count Sitting, standing time Method: Inclinometer (ActivPal3™) |
| Sherry et al. (2020) (Bradford, UK) [51] | CT * | 2 E | N = 49 Age range: 9–10 y Grade: 5 Sex: 53.8% BMI: IG: underweight (9.1%), normal (63.6%), overweight (13.6%), obese (18.2%) CG: underweight (3.9%), normal (61.5%), overweight (11.5%), obese (23.1) Race/ethnie: South Asian (69.4%), White British (26.5%), Other (4%) Total study groups: 2 groups (1 IG and 1 CG) IG (N = 27) CG (N = 22) | Upright active desks + stools | Treatment length: 8 months (November 2015 to July 2016) Active desks: individuals Active desks usage time per week: at least 20 min per classroom day | Musculoskeletal discomfort Cognitive function Process evaluation Sitting, standing, stepping time Methods: Inclinometer (ActivPAL) Questionnaires Stroop test Corsi Block Tapping test Interviews, Observations |
| Sprengeler et al. (2020) (Ludwigsburg, Germany) [52] | Cross-over | 1 E | N = 52 Mean age: 8.4 ± 0.7 y Age range: 8–10 y Grade: 3 Sex: 61.5% BMI: normal weight (78.9%), overweight/obese (21.1%) Race/ethnie: NR | Upright active desks + stools | Treatment length: 3 months (January-March 2018) Active desks: individuals. 32 desks were equally distributed among the three classes Active desks usage time per week: the group 1 used active desks during 3 weeks (February, T1) and after were assigned to the traditional working desks until March (T2). The group 2 begin to used traditional desks until February (T1) and after used active desks (T2). A washout period of 2 weeks is present between T1 and T2 | Standing, and sitting time Methods: Inclinometer (ActivPAL) |
| Sudholz et al. (2016) (Melbourne, Australia) [53] | NRCT * | 1 S | N = 41 Mean age: 13.7 ± 1.4 y Age range: 12–16 y Grade: 7, 9, 10 Sex: girls 49% BMI: NR Race/ethnie: NR Total study groups: 2 groups (1 IG and 1 CG) IG (N = 27) CG (N = 14) | Upright active desks + stools | Treatment length: 7 weeks (August to October 2014) Active desks: individuals Active desks usage time per week: own volition | Sitting and standing time/bouts Sedentary time PA (LPA) Feasibility/process evaluation Musculoskeletal discomfort Methods: Accelerometer (ActiGraph3X) Inclinometer (ActivPAL3C) Questionnaire |
| Swartz et al. (2019) (USA) [54] | Cross-over | 1 E | N = 99 Mean age: 10.2 ± 1.4 y Grade: 3, 4, 6 Grade 3 (N = 22) Grade 4 (N = 36) Grade 6 (N = 41) Sex: girls 42.9% BMI: Grade 3: 55th BMI percentile Grade 4: 43rd BMI percentile Grade 6: 61st BMI percentile Race/ethnie: White (69%), black (3%), Asian (8%), mixed race (7%), Hispanic (8%) | Upright active desks + stools | Treatment length: 9 weeks Active desks: individuals. Half of the students used a stand-biased desk and half used a sitting desk. The Stand-Sit group used a stand-biased desk for 9 weeks (September to December) and sitting desk for 9 weeks (January to April). The Sit -Stand group used a sitting desk for 9 weeks (September to December) and stand-biased for 9 weeks (January to April). Active desks usage time per week: NR | Sedentary time PA (LPA, MVPA) Method: Accelerometer (ActigraphGT3X+ or wGT3X-BT) |
| Verloigne et al. (2018) (Flanders, Belgium) [55] | RCT | 10 E and 9 S | N = 343 Age range: 10–16 y Grade: 5, 10 Sex: girls 54.5% BMI: NR Race/ethnie: NR Total study groups: IG: 5 primary, 5 secondary CG: 5 primary 4 secondary | Upright active desks | Treatment length: 6 months (January–June 2017) Active desks: 3 standing desks were placed in each intervention class Recommendations of active desks usage time per week: rotations every half lesson hour (25 mn) | Process evaluation Sitting, standing and stepping time Methods: Inclinometer (ActivPAL) Focus groups (children) and interviews (teachers) The Paediatric Quality of Life Inventory (PEDS-QL) EuroQol 5dimension Youth (EQ-5D-Y |
| Wendel et al. (2016) (Texas, USA) [56] | RCT | 3 E | N = 193 Mean age: 8.8 y Grade: 3, 4 Sex: girls 50.3% BMI: normal (79.3%), overweight (11.9%), obese (8.8%) Race/ethnie: White (74.6%), Asian (10.4%), Hispanic (7.8%), Afro-American (7.3%) Total study groups: 4 groups (IG, CG, CG-IG, IG-CG) IG (N = 62) CG (N = 49) IG-CG (N = 59) CG-IG (N = 23) | Upright active desks + stools | Treatment length: 2 years (2011–2013) Active desks: individuals Active desks usage time per week: NR | Body composition (BMI) |
| Wick et al. (2018) (Swiss) [57] | NRCT * | 2 E | N = 38 Age range: 10–12 y Grade: NR Sex: girls 42% Race/ethnie: NR Total study group: 2 groups (1 IG and 1 CG) Interventional group (N = 19) Mean age: 10.8 ± 0.6 y BMI: 18.0 ± 2.8 kg·m2 Control group (N = 19) Mean age: 10.8 ± 0.8 BMI: 18.8 ± 4.3 kg·m2 | Upright active desks | Treatment length: 11 weeks (August–December 2014) Active desks: individuals Active desks usage per week: teachers encouraged students to work for about 60 min a day at the active desk | Sitting, standing and walking time Cognitive function Methods: Accelerometers (ActiGraph) Observations Self-reporting Digit span task test Eriksen flanker test |
| Cycling desk | ||||||
| Fedewa et al. (2017) (South-eastern region, USA) [30] | RCT * | 1 S | N = 17 Age range: 14–18 y Grade: 8–12 Sex: NR BMI: NR Race/ethnie: NR Total study groups: 6 classrooms (3 IG and 3 CG) IG (N = 11) CG (N = 6) | Bike desks | Treatment length: academic year Actives desks: 4 FitDesks per IG classroom. Actives desks usage time per week: access to FitDesks for the entire day with the exception of lunch, and extracurricular courses including physical education, computer lab, and art. | Sedentary time PA (MVPA, LPA, vector magnitude) Process evaluation EE Methods: Accelerometers (ActiGraph GT3X) Interviews Questionnaire |
| Ruiter et al. (2019) (Germany) [58] | NRT | 2 E | N = 38 Age: 12.50 ± 0.62 y Grade: 8 Sex: girls 57% BMI: NR Race/ethnie: NR | Bike desks | Treatment length: 2 weeks Active desks: individuals. Active desks usage time per week: they used bike desks only for the cognitive function’s assessment. All 2 sessions (week 1, week 2) occurred at the same time on separate days with a 7-day interval between tests. | Cognitive capacities Methods: Eriksen Flanker Task Digit Span Task Visual pattern Task Questionnaire |
| Torbeyns et al. (2017) (Ninove, Belgium) [34] | RCT | 1 S | N = 44 Mean age: 14.3 ± 0.6 y Grade: 9–10 Sex: girls 34% Race/ethnie: NR Total study groups: 2 classroom (1 IG and 1 CG) Interventional group (N = 21) BMI: 19.7 ± 3.5 kg·m2 Control group (N = 23) BMI CG: 20.1 ± 3.7 kg·m2 | Bike desks | Treatment length: 22 weeks, 5 months (October-February 2015) Actives desks: individuals; students adjust the cycling intensity to their preference Actives desks usage time per week: IG used a bike desk for 4 class hours/week | PA Body composition (BMI, body mass, body fat percentage, waist circumference) EE Physical fitness Cognitive capacities On-task behavior (concentration, engagement) Methods: SenseWear mini armband The Dutch (Native speech of the participants) version of the Rey Auditory Verbal Learning Test (RAVLT) The Stroop test The Rosvold Continuous Performance Test (RCPT) Continuous electroencephalography (EEG) LOSO attention questionnaire ‘Dutch’ and mathematics test |
| Stability ball | ||||||
| Erwin et al. (2016) (USA) [33] | RCT | 1 E | N = 43 Age: NR Grade: 4 Sex: girls 32.6% BMI: NR Race/ethnie: White (76%), African American (11%), Asian (7%), Hispanic (3%), other (3%) Total study groups: 2 classrooms (1 IG and 1 CG) IG (N = 23) CG (N = 21) | Stability balls | Treatment length: 12 weeks Active desks: individuals Active desks usage time per week: all the school day | On-task behavior (concentration, engagement) PA (step count, horizontal et vertical accelerometers count) Methods: Accelerometer (ActiGraph) Momentary Time Sampling (MTS) |
| Fedewa et al. (2015) (USA) [59] | RCT | 1 E | N = 67 Age: NR Grade: 2 Sex: girls 48% BMI: NR Race/ethnie: NR Total study groups: 4 classrooms (2 IG and 2 CG) IG (N = 36) CG (N = 31) | Stability balls | Treatment length: 9 months Active desks: individuals Active desks usage time per week: all the school day | Academic performance Discipline referral levels On-task behavior (concentration, engagement) Methods: Measures of Academic Progress “clip downs” (a school wide disciplinary system) Momentary Time Sampling (MTS) |
| Author (Year) | Body Composition | Sedentary Behaviors and Physical Activity | Energy Expenditure | Physical Capacity and Cardiometabolic Health |
|---|---|---|---|---|
| Upright active desk | ||||
| Benden et al. (2011) [40] | NR | N/A | EE: IG > CG: +0.182 ± 0.080 kcal·min−1 (p = 0.022) Students in the intervention group IG burned 17% more calories than did those in the control group Overweight/obese EE: IG > CG (IG: 1.56 kcal·min−1; CG: 1.18 kcal·min−1) | N/A |
| Benden et al. (2012) [41] | Weight: fall < spring fall vs. spring: fall: 27 ± 7.9 kg vs. spring: 29.5 ± 8.9 kg BMI: fall < spring fall vs. spring: fall: 19.5 ± 4.3 kg·m2 vs. spring: 19.8 ± 4.3 kg·m2 | Steps: Steps within-subjects spring > fall: +17.6% Mean number of steps spring > fall: +836 steps | Spring: >fall: +25.7%: +0.29 kcal·min−1 (p < 0.0001) Day-to-day variation: Lower EE day 3 and 4 (p < 0.0001) | N/A |
| Benden et al. (2014) [42] | BMI: no significant | Step counts: Fall semester: IG > CG: +1.61 steps/min (p = 0.0002) Spring semester: IG > CG (+0.12 steps/min): no significant (p = 0.8193) Normal vs. overweight and obese: overweight: 0.78 steps/min (p < 0.001); obese: 0.62 steps/min (p = 0.0059) | EE: Fall semester: increase IG > CG: +0.16 kcal·min−1 (p < 0.001) Spring semester: increase IG > CG: +0.08 kcal·min−1 (p = 0.0092) Normal vs. overweight and obese: overweight: 0.24 kcal·min−1 (p < 0.001); obese: 0.40 kcal·min−1 (p < 0.001) | N/A |
| Blake et al. (2012) [43] | N/A | Standing and sitting time: IG: 66% standing at their desks as opposed to sitting | EE: IG > CG: +17% burned calories | N/A |
| Clemes et al. (2016) (Melbourne, Australia) [31] | N/A | During class: Sitting time: IG pre > post: pre vs. post: pre: 67.9 ± 8.4% vs. post: 58.5 ± 8.4% (p < 0.001) Standing time: IG pre < post pre vs. post: pre: 18.1 ± 4.5 vs. post: 26.4 ± 7.5% (p < 0.001) Stepping time: no significant Step counts: no significant Sitting time (%) IG < CG (p = 0.03) Standing time (%) IG > CG (p < 0.01) Whole weekday: Standing time IG pre < post pre vs. post: pre: 21.3 ± 6.1% vs. post: 25.5 ± 5.5% (p < 0.01) Sitting time: no significant Stepping time: no significant | N/A | N/A |
| Clemes et al. (2016) (Bradford, England*) [31] | N/A | During class: Sitting time IG pre > post: IG pre vs. post: pre: 71.8 ± 10.6% vs. post 62 ± 15.8% (p = 0.03) Standing time: no significant Stepping time IG pre < post IG pre vs. post: pre: 8.2 ± 2.8% vs. post: 14.5 ± 7.9% (p = 0.002) Step counts IG pre < post IG pre vs. post: pre: 1654 ± 528.9 vs. post: 3024 ± 2195 (p = 0.013) Difference IG and CG: no significant Whole weekday: Sitting, standing and stepping time: no significant | N/A | N/A |
| Clemes et al. (2020) [44] | Body mass: IG < CG IG vs. CG: IG: 37.7 ± 8.7 kg vs. CG: 39.2 ± 10.6 kg Percent body fat: Girls: IG > CG IG vs. CG: IG: 25 ± 8.3% vs. CG: 23.7 ± 9.1% Boys: IG < CG IG vs. CG: IG: 19 ± 6.6%; CG: 20.7 ± 8.9% BMI: IG > CG IG vs. CG: IG: 18.8 ± 3.5 kg·m2 vs. CG: 18.7 ± 4.1 kg/m² | ↓ Sitting time IG (−30.6 min/day) Sitting time: IG < CG IG vs. CG: IG: 472 ± 73.5 min/day vs. CG: 504.4 ± 94 min/day Standing time: IG > CG IG vs. CG: IG: 197.1 ± 49.4 min/day vs. CG: 176.5 ± 45.7 min/day Stepping time: IG > CG IG vs. CG: IG: 166.4 ± 41.9 min/day vs. CG: 150 ± 42.1 min/day LPA: IG post > pre post vs. pre: post: 392.7 ± 70.8 min/day vs. pre: 383.5 ± 68.6 min/day MVPA: IG post > pre post vs. pre: post: 45.7 ± 24.7 min/day vs. pre: 37.4 ± 17.9 min/day | N/A | Systolic blood pressure: IG > CG IG vs. CG: IG: 110.5 ± 11.2 mmHg vs. CG: 107.3 ± 11.7 mmHg Diastolic blood pressure: IG > CG IG vs. CG: IG: 68.4 ± 9.7 mmHG vs. CG: 66.3 ± 9.5 mmHg |
| Ee et al. (2018) [32] | N/A | School standing and sitting: IG and CG: sitting time (61%) > standing time (19%) Standing time: IG > CG IG vs. CG: IG: 84 ± 4 min/day vs. CG: 63 ± 3 min/day (p < 0.001) Sitting time: IG < CG IG vs. CG: IG: 208 ± 6 min/day vs. CG: 231 ± 5 min/day (p = 0.003) Whole Day Physical Activity and Sedentary Time Sedentary time: no significant: IG vs. CG: IG: 674 ± 23 min/day vs. CG: 686 ± 26 min/day LPA: no significant IG vs. CG: IG: 241 ± 7 min/day vs. CG: 256 ± 6 min/day MVPA: no significant Moderate: IG vs. CG: IG: 39 ± 2 min/day vs. CG: 42 ± 2 min/day Vigorous: IG vs. CG: IG: 18 ± 1 min/day vs. CG: 20 ± 1 min/day | N/A | N/A |
| Kidokoro et al. (2019) [46] | N/A | During classroom Sedentary behaviors: IG < CG IG vs. CG: IG: 59% vs. CG: 67% (p = 0.035) SB: IG post < pre: −18.3 min/day LPA: no significant MVPA: IG > CG IG vs. CG: IG: 12.5% vs. CG: 8.3% (p = 0.005) MVPA: IG pre < post: +19.9 min/day | N/A | N/A |
| Koepp et al. (2012) [47] | Weight: pre < post: pre vs. post: pre: 41.4 kg vs. 44.5 kg (p = 0.0007) BMI: pre and post: no significant pre vs. post: pre: 19.4 ± 5.3 kg/m² vs. post: 19.3 ± 5.2 kg.m2 (p < 0.3416) | Step counts: no significant pre vs. post: pre 1886 ± 809 steps vs. post: 2248 ± 990 steps (p > 0.1127) | N/A | N/A |
| Parry et al. (2019) [49] | N/A | For IG vs. CG: Standing time: > at the start of the school year (+17 min/school day) and at the end (+26 min/school day) Sitting time: <at the start of the school year (−17 min/school days) and at the end (−40 min/school day) Standing and sitting time over time: IG and CG: no significant (p = 0.062) Physical activity and sedentary time: no significant | N/A | N/A |
| Pickens et al. (2016) [50] | N/A | Sitting time: pre > post pre vs. post: pre: 1032.4 min vs. post: 857.6 min (p < 0.0001) Standing time: pre < post pre vs. post: pre: 203.7 min vs. post: 353 min (p < 0.001) Steps: pre < post pre vs. post: pre: 6611.6 vs. post: 8898.4 (p = 0.0619) | N/A | N/A |
| Sherry et al. (2020) [51] | N/A | During class time Sitting time: IG < CG IG vs. CG: IG: 52.4 ± 21.9% vs. CG: 72.1 ± 6.6% (p = 0.001) Standing time: IG > CG IG vs. CG: IG: 35.6 ± 18.1% vs. CG: 17.6 ± 9.0% (p = 0.001) Stepping time: IG > CG IG vs. CG: IG: 12.0 ± 4.0% vs. CG: 11.0 ± 2.7% (p = 0.035) Sit-to-stand transitions: IG > CG IG vs. CG: IG: 10.7 ± 2.3 p/h vs. CG: 5.6 ± 2.2 p/h (p < 0.001) Behavior after school: no significant Full weekday Sitting time: IG < CG IG vs. CG: IG: 59.1 ± 10.3% vs. CG: 63.5 ± 9.7% (p = 0.042) | N/A | N/A |
| Sprengeler et al. (2020) [52] | N/A | During lessons: Sitting time: G1: pre > mid: −13.1% G2: pre > mid: −9.78% Standing time: G1: pre < mid: 11.6% G2: pre < mid: 8.63% During school breaks: Sitting: G1: pre > mid: −10.3%, pre > post: −11.8% G2: pre > mid: −11.8%, pre > post: −8.59% Standing: G1: pre < mid: 6.20% G2: pre < mid: 7.82%, pre < post: 8.08% | N/A | N/A |
| Swartz et al. (2019) [54] | N/A | During classroom Sedentary and active time post: IG + CG: ↑ sedentary time (p < 0.001) ↓ active (p < 0.001) Sedentary behavior: IG pre-post (+2.4%) < CG pre-post (+6.5%) (p = 0.038) LPA: time I: no significant (p = 0.314) MVPA: during classrooms IG pre-post (−0.7%) < CG pre-post (−5.0%) (p = 0.001) Predictive outcomes Sedentary behavior: students with high sedentary time at baseline have more finals effects (p = 0.029) LPA: IG and CG: no significant (p = 0.773) MVPA: students with high sedentary time at baseline have more finals effects (p < 0.0001) | N/A | N/A |
| Verloigne et al. (2018) [55] | N/A | (Questionnaire data) Primary school Self-efficacy to break up sitting time: IG pre < mid pre vs. mid: 3.2 ± 0.2 vs. 3.4 ± 0.2 (beta = 0.188) Habit of breaking up sitting time: CG pre < post pre vs. post: 3.6 ± 0.2 vs. 3.4 ± 0.2 (beta = 0.467) Secondary school: ↓ Sitting time: IG < CG pre-mid test, beta = 0.058 IG pre vs. mid: 275.8 ± 11.4 min/day vs. 366.5 ± 11.4 min/day CG pre vs. mid: 362.2 ± 12.5 min/day vs. 314.7 ± 12.5 min/day Breaking up sitting time: IG pre > mid pre vs. mid: 3.7 ± 0.1 vs. 3.5 ± 0.1 (beta = −0.456) (ActivPAL) Primary school Sitting time: during school hours: IG pre > mid pre vs. mid: 243.8 ± 8.9 min vs. 217.9 ± 8.9 min (beta = −37.404) Standing time: during schools hours/entire school day: IG pre < post school hours: pre vs. mid: 105.6 ± 7.5 min vs. 131.2 ± 7.5 min, beta = 34.148 entire school day: pre vs. mid: 195.1 ± 11.1 min vs. 220.5 ± 11.1 min (beta = 34.464) Stepping time: during entire school day: IG pre > mid: −7 min pre vs. mid: 141.5 ± 8.3 min vs. 134.1 ± 8.3 min (beta = −18.796) Sitting time: during school hours: IG ↓ (−26 min) vs. CG ↑ (+12 min) Time spent in sitting bouts during school hours: IG ↓ (−19 min) vs. CG ↑ (+11 min) Time spent in sitting bouts across the whole school day: IG ↓ (−27 min) vs. CG ↑ (+18 min) Standing time: during school hours: ↑ IG (+26 min) vs. CG ↓ (~10 min) Time spent in standing bouts during school hours: ↑ IG (+29 min) vs. CG ↓ (~10 min) Time spent in standing bouts across the whole school day: ↑ IG (+25 min) vs. CG ↓ (~10 min) Secondary school: Number of sit-to-stand transition: IG pre > mid pre vs. mid: 24.7 ± 1.8 vs. 21.7 ± 1.9 (beta = −5.034) | N/A | N/A |
| Wendel et al. (2016) [56] | BMI IG < CG IG vs. CG (p = 0.037) BMI IG and CG-IG/IG-CG: no significant | N/A | N/A | N/A |
| Wick et al. (2018) [57] | N/A | Sitting time: IG < CG IG vs. CG: IG: 172.1 ± 19.7 min vs. CG: 184.9 ± 13.7 min (p = 0.03) Standing time: IG > CG IG vs. CG: IG: 60.5 ± 15.1 min vs. CG: 47.1 ± 11.6 min (p = 0.0004) Walking time: no significant IG vs. CG: IG: 19.9 ± 6.3 min vs. CG: 18.9 ± 4.4 min (p = 0.57) | N/A | N/A |
| Cycling desk | ||||
| Fedewa et al. (2017) [30] | N/A | Sedentary time: IG < CG: IG vs. CG time 1: IG: 116.3 ± 53.9 min/day; CG: 58.6 ± 10.8 min/day IG vs. CG time 2: IG: 79.2 ± 52.1 min/day vs. CG: 114.5 ± 18.7 min/day LPA: IG > CG IG vs. CG time 1: IG: 19.4 ± 9.2 min/day vs. CG: 6.7 ± 3.0 min/day IG vs. CG time 3: IG: 24.8 min/day vs. CG: 10.2 ± 6.4 min/day MVPA: IG > CG IG vs. CG time 1: IG: 35.6 ± 19.1 min/day; CG: 15.6 ± 6.8 min/day IG vs. CG time 3: IG: 43.0 min/day vs. CG: 30.6 ± 13.2 min/day Vector magnitude: IG > CG IG vs. CG time 1: IG:152 394 ± 83 288 ct/min; CG: 65 908 ± 34 085 ct/min IG vs. CG time 3: IG: 176 119 ct/min vs. CG: 111 429 ± 46059 ct/min | EE: IG time 3 < time 1 Time 3 vs. time 1: time 3: 94.9 ± 29 kcal vs. time 1: 108.9 ± 32.1 kcal | N/A |
| Torbeyns et al. (2017) [34] | Fat percentage: IG and CG: pre < post pre vs. post: pre: 18.8 ± 9.9% vs. post: 20.1 ± 9.3% (p < 0.001) Waist circumference: IG and CG: pre < post pre vs. post: pre: 66.9 ± 6.6 cm vs. post: 68.0 ± 6.0 cm (p = 0.017) Body weight: IG and CG pre < post pre vs. post: pre: 56.5 ± 11.3 kg vs. post: 58.1 ± 9.9 kg (p < 0.001) BMI: CG post > pre post vs. pre: pre: 20.1 ± 3.7 kg/m²; post:20.5 ± 3.5 kg/m² (p = 0.005) IG post and pre: no significant pre vs. post: pre: 19.7 ± 3.5 kg/m² vs. post: 19.9 ± 3.2 kg/m² (p = 0.205) BMI CG and IG at T0 and T1: no significant | Physical activity outside the classroom PA: IG and CG pre > post Pre vs. post: pre: 2.6 ± 0.7 vs. post: 2.4 ± 0.7 (p < 0.001) | EE: IG EE access bike desks (+36%) > EE normal hours IG bike desks vs. EE IG normal hours: 128.5 ± 34.7 kcal.h−1 vs. 94.6 ± 16.7 kcal.h−1 (p< 0.001) Class hours in which IG had access to the bike desks: EE IG > CG IG vs. CG: 128.5 ± 34.7 kcal.h−1 vs. 100.0 ± 16.2 kcal.h−1 (p = 0.002) | 20 m shuttle run test: performance IG post > pre pre vs. post: pre 6.4 ± 2.5; post: 7.0 ± 2.9 (p = 0.021) RPE: post IG < CG IG vs. CG: IG: 5.5 ± 1.3; CG: 6.4 ± 1.3 (p = 0.047) |
| Stability ball | ||||
| Erwin et al. (2016) [33] | N/A | Difference IG and CG pre and post (p < 0.05) Vertical accelerometer counts: (IG and CG) pre > post pre vs. post, pre: 79.56 ± 46.36; post: 51.26 ± 38.11 (p < 0.05) Horizontal accelerometer counts: (IG and CG) pre > post pre vs. post: pre:103.92 ± 95.76; post: 62.45 ± 27.41 (p = 0.03) Step counts: (IG and CG) pre > post pre vs. post: pre: 4242.01 ± 2006.16; post: 2975.82 ± 1611.20 (p < 0.01) PA: IG and CG pre- and post-test: no significant | N/A | N/A |
| Author (Year) | Cognitive and Academic Performance | Fatigue and Musculoskeletal Pain Symptoms | Process Evaluation |
|---|---|---|---|
| Upright active desk | |||
| Blake et al. (2012) [43] | Attention and focus: IG > CG | N/A | By the fourth week of the intervention, more than two-thirds of the students stopped using the stool completely Teacher’s perspective: Good acceptability of children Active desks considering as “cool” Parents’ perception: positive impact on child’s behavior at school |
| Clemes et al. (2020) [44] | Learning engagement and disaffection scores: no differences Total difficulties score: IG < CG IG vs. CG: IG: 7.8 ± 6.6 vs. CG: 6.9 ± 6.0 Disruption to the classroom: no adverse effects | Musculoskeletal discomfort: no adverse effects | Overall recruitment: rate being 33% (95% CI: 16 to 55%) Parental consent: 75% At follow-up, retention of participating children was 97% |
| Dornhecker et al. (2015) [45] | Academic engagement: Fall semester: IG > CG: +4.21 (p = 0.003) Spring semester: IG > CG: +0.72 (p = 0.003) Differences 2nd grade and 3rd grade students: no significant (p = 0.39) Difference 4th grade and 3rd grade: no significant (p = 0.19) | N/A | N/A |
| Ee et al. (2018) [32] | N/A | Neck discomfort: IG < CG (p = 0.005) Other body parts: no significant | N/A |
| Kidokoro et al. (2019) [46] | N/A | N/A | Children’s perception: Enjoying classes using standing desks: 66.7% Expressed willingness to continue using their standing desks: 72.2% Felt that they could express their thoughts more effectively: 66.7% Found it easier to work: 77.7% Felt less sleepy when using standing desk: 97.8% Felt fatigued in the standing classroom: 11.2% Usage of standing desks: 21.4 ± 5.9 min/day Changing their posture: 1.8 ± 0.8 times during a class |
| Koepp et al. (2012) [47] | Classroom management: no significant (p < 0.5) Concentration: no significant (p < 0.81) | Discomfort: no significant (p < 0.06) | N/A |
| Mehta et al. (2015) [48] | Cognitive performance: (executive function and working memory tasks) post: +7–14% Neurocognitive assessments: Wisconsin Card Sort: Reaction time pre vs. post: −10% (p < 0.0001) Correct responses pre vs. post: +14% (p = 0.014) % Correct responses pre vs. post: +13% (p = 0.016) Flanker test: Reaction times for congruent pre vs. post: no significant (p = 0.112) Reaction times for incongruent pre vs. post: no significant (p = 0.079) Percent correct congruent pre vs. post: no significant (p = 0.18) Percent correct incongruent responses pre vs. post: no significant (p = 0.749) Memory Span test: pre vs. post: no significant (p = 0.09) Trail Making Test: pre vs. post: no significant (p > 0.205) TMT letters: −7% (p = 0.012) TMT number + letter: −14% (p > 0.0001) Stroop Color Word: Reaction times: pre > post: −13% (p = 0.001) Percent correct responses: pre vs. post: no significant (p = 0.239) Prefrontal cortex Activity: nHbO2 levels across all five tasks: pre vs. post: no significant (p > 0.212) Effect of hemisphere: no significant (p > 0.194) Time point × hemisphere interactions: Wisconsin Card Sorting Task (p = 0.042) Memory Span Task (p = 0.05) Trail-Making Task (p = 0.033) Stroop Color Word test: nHbT left hemisphere > right hemisphere: 19.22 (p = 0.001) Others test: no significant across hemispheres and interaction with time points (p > 0.117) | N/A | N/A |
| Parry et al. (2019) [49] | N/A | Musculoskeletal discomfort: neck and shoulder pre > post Neck: (p = 0.004) Shoulder: (p < 0.001) | N/A |
| Sherry et al. (2020) [51] | Cognitive function: Corsi Block Tapping: no significant Stroop test: no significant | Musculoskeletal discomfort: Whole body: no significant Upper limb: no significant Neck and back: no significant Lower limb: no significant | Children’s perception: Like sit-to-stand transition because sitting can become uncomfortable Improve behavior in class: children stay in the same place One child feels the classroom noisier Teacher’s perception: Need lot of place Need to adapt his teaching After the 20-min period standing, 22 out 27 children immediately chose to sit back down. |
| Sudholz et al. (2016) [53] | N/A | Musculoskeletal discomfort: Got pain in legs or back: while standing during lessons: 51% | Children’s perceptions: Continue to used actives desks: 70% Worked well during lessons: 69% Enjoying lessons more since the actives desks were introduced: 54% Felt more energetic across the day: 46% Concentrated better on doing my work: 44% Was easily distracted: 36% Was too tired: to be active after school: 18% Teachers’ perceptions: Continue teaching with the height adjustable desks: 71% Adolescent standing during lessons: Negatively influenced ability to work effectively: 14% Results in loss of concentration: 14% Increase ability to complete tasks: 29% Were too disruptive: 0% |
| Verloigne et al. (2018) [55] | N/A | N/A | Primary schools: Frequency of using the standing desks: IG mid > post mid vs. post: 2.94 ± 0.61 times/week vs. 1.80 ± 0.61 times/week (beta = −0.379) Mean duration at the desks: IG mid > post mid vs. post: 84.31 ± 13.03 min.week−1 vs. 57.69 ± 13 min.week−1 (beta = −0.376) Self-efficacy to use the desk: IG mid > post mid vs. post: 4.12 ± 0.15 vs. 3.75 ± 0.15 (beta = −0.147) Habit to use the standing desk: IG mid > post mid vs. post: 3.59 ± 0.21 vs. 3.03 ± 0.21 (beta = −0.224) Subjective norm to use the standing: desk IG mid < post mid vs. post:4.11 ± 0.11 vs. 4.32 ± 0.11 (beta = 0.242) Relation with classmate: IG pre > post pre vs. post: 4.4 ± 0.2 vs. 4.2 ± 9.2 (beta = −0.04) Secondary schools Frequency of using the desks: IG mid < post mid vs. post: 1.30 ± 0.66 times/week vs. 1.42 ± 0.66 times/week (beta = 0.195) Pupils’ attitude towards the desks: IG mid < post mid vs. post: 3.71 ± 0.13 vs. 3.89 ± 0.13 (beta = 0.057) |
| Wick et al. (2018) [57] | Eriksen Flanker Task: Reaction time (congruous): IG pre > post pre vs. post: pre: 476 ± 99 ms vs. post: 451 ± 119 ms (p = 0.04) Accuracy: IG pre < post pre vs. post: pre: 0.87 ± 0.17% vs. post: 0.92 ± 0.16% (p = 0.01) Digit span task: Working memory: no significant Number of correct trials: no significant Cognitive function x group: no significant results | N/A | N/A |
| Cycling desk | |||
| Fedewa et al. (2017) [30] | N/A | N/A | Mean value for all items: 3.87 ± 0.23/5 Preference to site on the bike compared to sitting in a chair: 4.63 ± 1.59/5 Sitting on the bike was fun: 4.13 ± 1.64/5 |
| Ruiter et al. (2019) [58] | Digit Span Task: Accuracy and response times: no differences Visual Pattern Task: Accuracy and response times: no differences Eriksen Flanker Task: Responses time during incongruent: trials IG < CG (p = 0.01) Accuracy and response times: no differences Congruent and neutral stimuli: no differences Subjective task experience: Fatigue Motivation, difficulty, mental effort: no significant | N/A | N/A |
| Torbeyns et al. (2017) [34] | Rey auditory verbal learning test: no significant results Stroop test: Accuracy: on the word incongruent stimuli: IG post > pre pre vs. post: pre: 86.3 ± 10.9 ; post: 90.1 ± 7.1% (p = 0.030) Reaction time: IG and CG: pre > post pre vs. post: pre: 728.1 ± 105.6 ms vs. post: 694.2 ± 98.4 ms (p < 0.001 = Immediately repeated words: no significant Rosvold continuous performance test: Amplitude: post < pre post vs. pre: post: 3.2 ± 1.4 µV vs. pre: 3.9 ± 1.4 µV (p = 0.012) reaction time: no significant Attention during class: no significant Academic performance: no significant Mathematics test IG and CG post < pre post vs. pre: post: 0.39 ± 0.52 vs. pre: 0.66 ± 0.52 (p = 0.004) | N/A | N/A |
| Stability ball | |||
| Erwin et al. (2016) [33] | On-task behaviors: no significant | N/A | N/A |
| Fedewa et al. (2015) [59] | Effect on-task behavior: On task: CG (87%) > IG (77%) Time working with peers: CG (15%) > IG (13%) Effect between Time and Group: (p < 0.01) pre < post (p < 0.01) Time doing independent work: CG (39%) > IG (29%) Effect time-group: (p = 0.02) pre < post (p < 0.01) Interaction time with the teacher: CG (33%) < IG (35%) Effect time-group: (p < 0.01) pre < post (p < 0.01) Effect on academic performance: Literacy: (IG + CG): post > pre (p < 0.01) Mathematics: (IG + CG): post > pre (p < 0.01) | N/A | N/A |
2.4. Data Collection
2.5. Risk of Bias, Study Quality Assessment and Result Consideration
| Studies | Random Sequence Generation | Allocation Concealment | Performance Bias | Detection Bias | Attrition Bias | Reporting Bias | Other Bias |
|---|---|---|---|---|---|---|---|
| Upright active desk | |||||||
| Benden et al. (2011) [40] | Low risk | Unclear | High risk | High risk | Low risk | Low risk | Unclear |
| Benden et al. (2012) [41] | High risk | High risk | High risk | High risk | High risk | Low risk | Unclear |
| Benden et al. (2014) [42] | Low risk | Unclear | High risk | High risk | Low risk | Low risk | Low risk |
| Blake et al. (2012) [43] | High risk | High risk | High risk | High risk | High risk | High risk | Unclear |
| Clemes et al. (2016) (Bradford, England) [31] | High risk | Unclear | High risk | High risk | Low risk | Low risk | Unclear |
| Clemes et al. (2016) (Melbourne, Australia) [31] | Unclear | Unclear | High risk | High risk | Low risk | Low risk | Unclear |
| Clemes et al. (2020) [44] | Low risk | Low risk | High risk | High risk | Low risk | Low risk | Low risk |
| Dornhecker et al. (2015) [45] | Low risk | Unclear | High risk | High risk | Low risk | Low risk | Unclear |
| Ee et al. (2018) [32] | N/A | N/A | High risk | High risk | Low risk | Low risk | Low risk |
| Kidokoro et al. (2019) [46] | High risk | High risk | High risk | High risk | Low risk | Low risk | Low risk |
| Koepp et al. (2012) [47] | High risk | High risk | High risk | High risk | Low risk | Low risk | Unclear |
| Mehta et al. (2015) [48] | High risk | High risk | High risk | High risk | Low risk | Low risk | Low risk |
| Parry et al. (2019) [49] | N/A | N/A | High risk | High risk | Low risk | Low risk | Unclear |
| Pickens et al. (2016) [50] | High risk | Unclear | High risk | High risk | Low risk | Low risk | Unclear |
| Sherry et al. (2020) [51] | High risk | High risk | High risk | High risk | Low risk | Low risk | Low risk |
| Sprengeler et al. (2020) [52] | N/A | N/A | High risk | High risk | Low risk | Low risk | Low risk |
| Sudholz et al. (2016) [53] | High risk | High risk | High risk | High risk | Low risk | Low risk | Low risk |
| Swartz et al. (2019) [54] | N/A | N/A | High risk | High risk | Low risk | Low risk | Low risk |
| Verloigne et al. (2018) [55] | Low risk | Unclear | High risk | High risk | High risk | Low risk | Low risk |
| Wendel et al. (2016) [56] | Low risk | Low risk | High risk | High risk | Low risk | Low risk | Low risk |
| Wick et al. (2018) [57] | High risk | Unclear | High risk | High risk | Low risk | Low risk | Low risk |
| Cycling desk | |||||||
| Fedewa et al. (2017) [30] | Low risk | Unclear | High risk | High risk | Low risk | Low risk | Unclear |
| Ruiter et al. (2019) [58] | Low risk | Low risk | High risk | High risk | Low risk | Low risk | Unclear |
| Torbeyns et al. (2017) [34] | Low risk | Unclear | High risk | High risk | Low risk | Low risk | Low risk |
| Stability ball | |||||||
| Erwin et al. (2016) [33] | Low risk | Unclear | High risk | High risk | Low risk | Low risk | Unclear |
| Fedewa et al. (2015) [59] | Low risk | High risk | High risk | High risk | Low risk | Low risk | Unclear |
| Outcome Assessment | No of Studies | Design | Quality Assessment | Quality | ||||
|---|---|---|---|---|---|---|---|---|
| Risk of Bias | Inconsistency | Indirectness | Imprecision | Other | ||||
| Body composition | School grade ranged between 1 and 10. Body composition was assessed objectively as body mass index, body mass, body fat percentage (bio-impedance), waist circumference. | |||||||
| 5 | RCT a | No serious risk of bias | No serious inconsistency | No serious indirectness | Serious imprecision b | None | MODERATE | |
| 2 | NRT c | Serious risk of bias d | Serious inconsistency e | No serious indirectness | No serious imprecision | None | VERY LOW | |
| Physical activity | School grade ranged between 1 and 12. Physical activity was assessed as light physical activity, MVPA, step counts, standing, stepping and walking time: by devices (accelerometers, inclinometers), self-reported questionnaires and/or external observations. | |||||||
| 7 | RCT f | No serious risk of bias | Serious inconsistency g | No serious indirectness | Serious imprecision h | None | LOW | |
| 6 | NRCT i | Serious risk of bias j | No serious inconsistency | No serious indirectness | Serious imprecision k | None | VERY LOW | |
| 2 | NRT l | Serious risk of bias m | No serious inconsistency | No serious indirectness | Serious imprecision n | None | VERY LOW | |
| 1 | RT o | No serious risk of bias | No serious inconsistency | No serious indirectness | No serious imprecision | None | LOW | |
| 4 | Cross-over p | No serious risk of bias | No serious inconsistency | No serious indirectness | No serious imprecision | None | LOW | |
| Sedentary behaviors | School grade ranged between 1 and 10. Sedentary behaviors were assessed by observations and/or self reporting questionnaires. | |||||||
| 3 | RCT q | No serious risk of bias | No serious inconsistency | No serious indirectness | Serious risk of imprecision r | None | MODERATE | |
| 6 | NRCT s | Serious risk of bias t | No serious inconsistency | No serious indirectness | Serious risk of imprecision u | None | VERY LOW | |
| 1 | RT v | No serious risk of bias | No serious inconsistency | No serious indirectness | No serious imprecision | None | LOW | |
| 4 | Cross-over w | No serious risk of bias | No serious inconsistency | No serious indirectness | No serious imprecision | None | LOW | |
| Energy expenditure | School grade ranged between 1 and 10. Energy expenditure was assessed by a portable device (armband) during school days and/or entire days. | |||||||
| 4 | RCT x | No serious risk of bias | No serious inconsistency | No serious indirectness | Serious risk of imprecision y | None | MODERATE | |
| 1 | NRCT z | Serious risk of bias aa | No serious inconsistency | No serious indirectness | Serious risk of imprecision ab | None | VERY LOW | |
| 1 | NRT ac | Serious risk of bias ad | No serious inconsistency | No serious indirectness | Serious risk of imprecision ae | None | VERY LOW | |
| Cognitive and academic performance | School grade ranged between 2 and 10. Cognitive performance was assessed by cognitive functions test (working memory, inhibitory control, flexibility, attention) and on-task behaviors (observations, interviews) | |||||||
| 4 | RCT af | Serious risk of bias ag | No serious inconsistency | No serious indirectness | No serious imprecision | None | MODERATE | |
| 4 | NRCT ah | Serious risk of bias ai | No serious inconsistency | No serious indirectness | No serious imprecision | None | VERY LOW | |
| 3 | NRT aj | Serious risk of bias ak | No serious inconsistency | No serious indirectness | No serious imprecision | None | VERY LOW | |
| Fatigue and musculoskeletal symptoms | School grade ranged between 4 and 10. Fatigue and musculoskeletal symptoms were assessed by questionnaires (Nordic Musculoskeletal Questionnaire, paper questionnaires), teacher observations, focus groups and/or interviews. | |||||||
| 1 | RCT al | No serious risk of bias | No serious inconsistency | No serious indirectness | Serious imprecision am | None | MODERATE | |
| 2 | NRCT an | Serious risk of bias ao | No serious inconsistency | No serious indirectness | Serious imprecision ap | None | VERY LOW | |
| 1 | NRT aq | Serious risk of bias ar | No serious inconsistency | No serious indirectness | No serious imprecision | None | VERY LOW | |
| 2 | Cross-over as | No serious risk of bias | No serious inconsistency | No serious indirectness | No serious imprecision | None | LOW | |
| Process evaluation | Mean age ranged between 6 and 17 year. Perceptions and experiences of participants was assessed by questionnaires, self-reporting answers and/or interviews. | |||||||
| 3 | RCT at | Serious risk of bias au | Serious inconsistency av | No serious indirectness | No serious imprecision | None | LOW | |
| 4 | NRCT aw | Serious risk of bias ax | No serious inconsistency | No serious indirectness | No serious imprecision | None | VERY LOW | |
| Physical capacities and cardiometabolic health | School grade ranged between 4 and 10. Physical capacities was assessed by the 20 m shuttle run test. Cardiometabolic health was assessed by blood pressure. | |||||||
| 2 | RCT ay | No serious risk of bias | No serious inconsistency | No serious indirectness | Serious imprecision az | None | MODERATE | |
3. Results
3.1. Description of Studies
3.2. Data Synthesis by Outcome
3.2.1. Body Composition
3.2.2. Sedentary Behaviors
3.2.3. Physical Activity
3.2.4. Energy Expenditure
3.2.5. Physical Capacities and Cardiometabolic Health
3.2.6. Cognitive and Academic Performance
3.2.7. Fatigue and Musculoskeletal Pain Symptoms
3.2.8. Process Evaluation
4. Discussion
Methodological Concerns
5. Conclusions
Author Contributions
Funding
Institutional Review Board Statement
Informed Consent Statement
Data Availability Statement
Conflicts of Interest
References
- Patterson, R.; McNamara, E.; Tainio, M.; de Sá, T.H.; Smith, A.D.; Sharp, S.J.; Edwards, P.; Woodcock, J.; Brage, S.; Wijndaele, K. Sedentary Behaviour and Risk of All-Cause, Cardiovascular and Cancer Mortality, and Incident Type 2 Diabetes: A Systematic Review and Dose Response Meta-Analysis. Eur. J. Epidemiol. 2018, 33, 811–829. [Google Scholar] [CrossRef] [PubMed]
- Stamatakis, E.; Ekelund, U.; Ding, D.; Hamer, M.; Bauman, A.E.; Lee, I.-M. Is the Time Right for Quantitative Public Health Guidelines on Sitting? A Narrative Review of Sedentary Behaviour Research Paradigms and Findings. Br. J. Sports Med. 2019, 53, 377–382. [Google Scholar] [CrossRef] [PubMed]
- Sedentary Behaviour Research Network Letter to the Editor: Standardized Use of the Terms “Sedentary” and “Sedentary Behaviours.”. Appl. Physiol. Nutr. Metab. 2012, 37, 540–542. [CrossRef]
- Tremblay, M.S.; Aubert, S.; Barnes, J.D.; Saunders, T.J.; Carson, V.; Latimer-Cheung, A.E.; Chastin, S.F.M.; Altenburg, T.M.; Chinapaw, M.J.M. SBRN Terminology Consensus Project Participants Sedentary Behavior Research Network (SBRN)—Terminology Consensus Project Process and Outcome. Int. J. Behav. Nutr. Phys. Act 2017, 14, 75. [Google Scholar] [CrossRef]
- Thivel, D.; Tremblay, A.; Genin, P.M.; Panahi, S.; Rivière, D.; Duclos, M. Physical Activity, Inactivity, and Sedentary Behaviors: Definitions and Implications in Occupational Health. Front. Public Health 2018, 6. [Google Scholar] [CrossRef]
- Forouzanfar, M.H.; Afshin, A.; Alexander, L.T.; Anderson, H.R.; Bhutta, Z.A.; Biryukov, S.; Brauer, M.; Burnett, R.; Cercy, K.; Charlson, F.J.; et al. Global, Regional, and National Comparative Risk Assessment of 79 Behavioural, Environmental and Occupational, and Metabolic Risks or Clusters of Risks, 1990–2015: A Systematic Analysis for the Global Burden of Disease Study 2015. Lancet 2016, 388, 1659–1724. [Google Scholar] [CrossRef]
- Ding, D.; Lawson, K.D.; Kolbe-Alexander, T.L.; Finkelstein, E.A.; Katzmarzyk, P.T.; van Mechelen, W.; Pratt, M. The Economic Burden of Physical Inactivity: A Global Analysis of Major Non-Communicable Diseases. Lancet 2016, 388, 1311–1324. [Google Scholar] [CrossRef]
- Friedenreich, C.M.; Ryder-Burbidge, C.; McNeil, J. Physical Activity, Obesity and Sedentary Behavior in Cancer Etiology: Epidemiologic Evidence and Biologic Mechanisms. Mol. Oncol. 2020, n/a. [Google Scholar] [CrossRef] [PubMed]
- Ekelund, U.; Steene-Johannessen, J.; Brown, W.J.; Fagerland, M.W.; Owen, N.; Powell, K.E.; Bauman, A.; Lee, I.-M. Does Physical Activity Attenuate, or Even Eliminate, the Detrimental Association of Sitting Time with Mortality? A Harmonised Meta-Analysis of Data from More than 1 Million Men and Women. Lancet 2016, 388, 1302–1310. [Google Scholar] [CrossRef]
- Schmid, D.; Ricci, C.; Leitzmann, M.F. Associations of Objectively Assessed Physical Activity and Sedentary Time with All-Cause Mortality in US Adults: The NHANES Study. PLoS ONE 2015, 10, e0119591. [Google Scholar] [CrossRef] [PubMed]
- Lee, I.-M.; Shiroma, E.J.; Lobelo, F.; Puska, P.; Blair, S.N.; Katzmarzyk, P.T. ; Lancet Physical Activity Series Working Group Effect of Physical Inactivity on Major Non-Communicable Diseases Worldwide: An Analysis of Burden of Disease and Life Expectancy. Lancet 2012, 380, 219–229. [Google Scholar] [CrossRef]
- Paffenbarger, R.S.; Hyde, R.T.; Wing, A.L.; Hsieh, C.C. Physical Activity, All-Cause Mortality, and Longevity of College Alumni. N. Engl. J. Med. 1986, 314, 605–613. [Google Scholar] [CrossRef] [PubMed]
- Janssen, X.; Mann, K.D.; Basterfield, L.; Parkinson, K.N.; Pearce, M.S.; Reilly, J.K.; Adamson, A.J.; Reilly, J.J. Development of Sedentary Behavior across Childhood and Adolescence: Longitudinal Analysis of the Gateshead Millennium Study. Int. J. Behav. Nutr. Phys. Act 2016, 13, 88. [Google Scholar] [CrossRef]
- Farooq, M.A.; Parkinson, K.N.; Adamson, A.J.; Pearce, M.S.; Reilly, J.K.; Hughes, A.R.; Janssen, X.; Basterfield, L.; Reilly, J.J. Timing of the Decline in Physical Activity in Childhood and Adolescence: Gateshead Millennium Cohort Study. Br. J. Sports Med. 2018, 52, 1002–1006. [Google Scholar] [CrossRef] [PubMed]
- Hallal, P.C.; Andersen, L.B.; Bull, F.C.; Guthold, R.; Haskell, W.; Ekelund, U. Global Physical Activity Levels: Surveillance Progress, Pitfalls, and Prospects. Lancet 2012, 380, 247–257. [Google Scholar] [CrossRef]
- Saunders, T.J.; Chaput, J.-P.; Tremblay, M.S. Sedentary Behaviour as an Emerging Risk Factor for Cardiometabolic Diseases in Children and Youth. Can. J. Diabetes 2014, 38, 53–61. [Google Scholar] [CrossRef]
- Andersen, L.B.; Harro, M.; Sardinha, L.B.; Froberg, K.; Ekelund, U.; Brage, S.; Anderssen, S.A. Physical Activity and Clustered Cardiovascular Risk in Children: A Cross-Sectional Study (The European Youth Heart Study). Lancet 2006, 368, 299–304. [Google Scholar] [CrossRef]
- Carson, V.; Hunter, S.; Kuzik, N.; Gray, C.E.; Poitras, V.J.; Chaput, J.-P.; Saunders, T.J.; Katzmarzyk, P.T.; Okely, A.D.; Connor Gorber, S.; et al. Systematic Review of Sedentary Behaviour and Health Indicators in School-Aged Children and Youth: An Update. Appl. Physiol. Nutr. Metab. 2016, 41, S240–S265. [Google Scholar] [CrossRef]
- Ekelund, U.; Luan, J.; Sherar, L.; Esliger, D.; Griew, P.; Cooper, A. Moderate to Vigorous Physical Activity and Sedentary Time and Cardiometabolic Risk Factors in Children and Adolescents. JAMA 2012, 307, 704–712. [Google Scholar] [CrossRef] [PubMed]
- Martinez-Gomez, D.; Eisenmann, J.; Gómez-Martínez, S.; Veses, A.; Marcos, A.; Veiga, O. Sedentary Behavior, Adiposity and Cardiovascular Risk Factors in Adolescents. The AFINOS Study. Revista Española de Cardiología 2010, 63, 277–285. [Google Scholar] [CrossRef]
- Väistö, J.; Eloranta, A.-M.; Viitasalo, A.; Tompuri, T.; Lintu, N.; Karjalainen, P.; Lampinen, E.-K.; Ågren, J.; Laaksonen, D.E.; Lakka, H.-M.; et al. Physical Activity and Sedentary Behaviour in Relation to Cardiometabolic Risk in Children: Cross-Sectional Findings from the Physical Activity and Nutrition in Children (PANIC) Study. Int. J. Behav. Nutr. Phys. Act 2014, 11, 55. [Google Scholar] [CrossRef]
- Esteban-Cornejo, I.; Martinez-Gomez, D.; Sallis, J.F.; Cabanas-Sánchez, V.; Fernández-Santos, J.; Castro-Piñero, J.; Veiga, O.L. Objectively Measured and Self-Reported Leisure-Time Sedentary Behavior and Academic Performance in Youth: The UP&DOWN Study. Prev. Med. 2015, 77, 106–111. [Google Scholar] [CrossRef]
- Syväoja, H.J.; Kantomaa, M.T.; Ahonen, T.; Hakonen, H.; Kankaanpää, A.; Tammelin, T.H. Physical Activity, Sedentary Behavior, and Academic Performance in Finnish Children. Med. Sci. Sports Exerc. 2013, 45, 2098–2104. [Google Scholar] [CrossRef]
- Syväoja, H.J.; Kankaanpää, A.; Kallio, J.; Hakonen, H.; Kulmala, J.; Hillman, C.H.; Pesonen, A.-K.; Tammelin, T.H. The Relation of Physical Activity, Sedentary Behaviors, and Academic Achievement Is Mediated by Fitness and Bedtime. J. Phys. Act Health 2018, 15, 135–143. [Google Scholar] [CrossRef]
- Kuh, D.; Shlomo, Y.B. A Life Course Approach to Chronic Disease Epidemiology; OUP Oxford: Oxford, UK, 2004; ISBN 978-0-19-857815-4. [Google Scholar]
- Thivel, D.; Chaput, J.P.; Duclos, M. Integrating Sedentary Behavior in the Theoretical Model Linking Childhood to Adulthood Activity and Health? An Updated Framework. Physiol. Behav. 2018, 196, 33–35. [Google Scholar] [CrossRef] [PubMed]
- Patton, G.C.; Bond, L.; Carlin, J.B.; Thomas, L.; Butler, H.; Glover, S.; Catalano, R.; Bowes, G. Promoting Social Inclusion in Schools: A Group-Randomized Trial of Effects on Student Health Risk Behavior and Well-Being. Am. J. Public Health 2006, 96, 1582–1587. [Google Scholar] [CrossRef] [PubMed]
- Pinel-Jacquemin, S.; Florin, A.; Guimard, P. Bien-Être Des Élèves à l’école et Promotion de Leur Santé; Ministère de l’éducation nationale et de la jeunesse; Conseil national d’évaluation du système scolaire (CNESCO): Paris, France, 2016.
- Ayala, A.M.C.; Sudholz, B.; Salmon, J.; Dunstan, D.W.; Ridgers, N.D.; Arundell, L.; Timperio, A. The Impact of Height-Adjustable Desks and Prompts to Break-up Classroom Sitting on Adolescents’ Energy Expenditure, Adiposity Markers and Perceived Musculoskeletal Discomfort. PLoS ONE 2018, 13, e0203938. [Google Scholar] [CrossRef]
- Fedewa, A.; Cornelius, C.; Ahn, S. The Use of Bicycle Workstations to Increase Physical Activity in Secondary Classrooms. Health Psychol. Rep. 2017, 6, 60–74. [Google Scholar] [CrossRef]
- Clemes, S.A.; Barber, S.E.; Bingham, D.D.; Ridgers, N.D.; Fletcher, E.; Pearson, N.; Salmon, J.; Dunstan, D.W. Reducing Children’s Classroom Sitting Time Using Sit-to-Stand Desks: Findings from Pilot Studies in UK and Australian Primary Schools. J. Public Health (Oxf.) 2016, 38, 526–533. [Google Scholar] [CrossRef] [PubMed]
- Ee, J.; Parry, S.; de Oliveira, B.I.; McVeigh, J.A.; Howie, E.; Straker, L. Does a Classroom Standing Desk Intervention Modify Standing and Sitting Behaviour and Musculoskeletal Symptoms during School Time and Physical Activity during Waking Time? Int. J. Environ. Res. Public Health 2018, 15. [Google Scholar] [CrossRef]
- Erwin, H.E.; Fedewa, A.; Ahn, S.; Thornton, M. Elementary Students’ Physical Activity Levels and Behavior When Using Stability Balls. Am. J. Occup. Ther. 2016, 70, 700220010p1–700220010p7. [Google Scholar] [CrossRef]
- Torbeyns, T.; de Geus, B.; Bailey, S.; Decroix, L.; Cutsem, J.V.; Pauw, K.D.; Meeusen, R. Bike Desks in the Classroom: Energy Expenditure, Physical Health, Cognitive Performance, Brain Functioning, and Academic Performance. J. Phys. Act. Health 2017, 14, 429–439. [Google Scholar] [CrossRef] [PubMed]
- Minges, K.E.; Chao, A.M.; Irwin, M.L.; Owen, N.; Park, C.; Whittemore, R.; Salmon, J. Classroom Standing Desks and Sedentary Behavior: A Systematic Review. Pediatrics 2016, 137, e20153087. [Google Scholar] [CrossRef] [PubMed]
- Sherry, A.P.; Pearson, N.; Clemes, S.A. The Effects of Standing Desks within the School Classroom: A Systematic Review. Prev. Med. Rep. 2016, 3, 338–347. [Google Scholar] [CrossRef]
- Rollo, S.; Crutchlow, L.; Nagpal, T.S.; Sui, W.; Prapavessis, H. The Effects of Classroom-Based Dynamic Seating Interventions on Academic Outcomes in Youth: A Systematic Review. Learn. Environ. Res. 2019, 22, 153–171. [Google Scholar] [CrossRef]
- Josaphat, K.-J.; Kugathasan, T.A.; Reid, R.E.R.; Begon, M.; Léger, P.-M.; Labonté-Lemoyne, E.; Sénécal, S.; Arvisais, D.; Mathieu, M.-E. Use of Active Workstations in Individuals with Overweight or Obesity: A Systematic Review. Obesity 2019, 27, 362–379. [Google Scholar] [CrossRef] [PubMed]
- Moher, D.; Liberati, A.; Tetzlaff, J.; Altman, D.G.; Group, T.P. Preferred Reporting Items for Systematic Reviews and Meta-Analyses: The PRISMA Statement. PLoS Medicine 2009, 6, e1000097. [Google Scholar] [CrossRef] [PubMed]
- Benden, M.E.; Blake, J.J.; Wendel, M.L.; Huber, J.C. The Impact of Stand-Biased Desks in Classrooms on Calorie Expenditure in Children. Am. J. Public Health 2011, 101, 1433–1436. [Google Scholar] [CrossRef] [PubMed]
- Benden, M.E.; Wendel, M.L.; Jeffrey, C.E.; Zhao, H.; Morales, M.L. Within-Subjects Analysis of the Effects of a Stand-Biased Classroom Intervention on Energy Expenditure. J. Exerc. Physiol. Online 2012, 15, 9–20. [Google Scholar]
- Benden, M.E.; Zhao, H.; Jeffrey, C.E.; Wendel, M.L.; Blake, J.J. The Evaluation of the Impact of a Stand-Biased Desk on Energy Expenditure and Physical Activity for Elementary School Students. Int. J. Environ. Res. Public Health 2014, 11, 9361–9375. [Google Scholar] [CrossRef]
- Blake, J.J.; Benden, M.E.; Wendel, M.L. Using Stand/Sit Workstations in Classrooms: Lessons Learned From a Pilot Study in Texas. J. Public Health Manag. Pract. 2012, 18, 412–415. [Google Scholar] [CrossRef]
- Clemes, S.A.; Bingham, D.D.; Pearson, N.; Chen, Y.-L.; Edwardson, C.L.; McEachan, R.R.C.; Tolfrey, K.; Cale, L.; Richardson, G.; Fray, M.; et al. Stand Out in Class: Restructuring the Classroom Environment to Reduce Sitting Time – Findings from a Pilot Cluster Randomised Controlled Trial. Int. J. Behav. Nutr. Phys. Act. 2020, 17, 55. [Google Scholar] [CrossRef]
- Dornhecker, M.; Blake, J.J.; Benden, M.; Zhao, H.; Wendel, M. The Effect of Stand-Biased Desks on Academic Engagement: An Exploratory Study. Int. J. Health Promot. Educ. 2015, 53, 271–280. [Google Scholar] [CrossRef] [PubMed]
- Kidokoro, T.; Shimizu, Y.; Edamoto, K.; Annear, M. Classroom Standing Desks and Time-Series Variation in Sedentary Behavior and Physical Activity among Primary School Children. Int. J. Environ. Res. Public Health 2019, 16, 1892. [Google Scholar] [CrossRef] [PubMed]
- Koepp, G.A.; Snedden, B.J.; Flynn, L.; Puccinelli, D.; Huntsman, B.; Levine, J.A. Feasibility Analysis of Standing Desks for Sixth Graders. ICAN 2012. [Google Scholar] [CrossRef]
- Mehta, R.K.; Shortz, A.E.; Benden, M.E. Standing Up for Learning: A Pilot Investigation on the Neurocognitive Benefits of Stand-Biased School Desks. Int. J. Environ. Res. Public Health 2015, 13. [Google Scholar] [CrossRef] [PubMed]
- Parry, S.; IR de Oliveira, B.; McVeigh, J.A.; Ee, J.; Jacques, A.; Straker, L. Standing Desks in a Grade 4 Classroom over the Full School Year. Int. J. Environ. Res. Public Health 2019, 16, 3590. [Google Scholar] [CrossRef]
- Pickens, A.W.; Benden, M.E.; Schneider, D.E.; Zhao, H. Use of Stand-Biased Desks to Reduce Sedentary Time in High School Students: A Pilot Study. Int. J. Child Health Nutr. 2016, 5, 75–78. [Google Scholar] [CrossRef]
- Sherry, A.P.; Pearson, N.; Ridgers, N.D.; Johnson, W.; Barber, S.E.; Bingham, D.D.; Nagy, L.C.; Clemes, S.A. Impacts of a Standing Desk Intervention within an English Primary School Classroom: A Pilot Controlled Trial. Int. J. Environ. Res. Public Health 2020, 17, 7048. [Google Scholar] [CrossRef]
- Sprengeler, O.; Hebestreit, A.; Gohres, H.; Bucksch, J.; Buck, C. Effects of Installing Height-Adjustable Standing Desks on Daily and Domain-Specific Duration of Standing, Sitting, and Stepping in 3rd Grade Primary School Children. Front. Public Health 2020, 8. [Google Scholar] [CrossRef]
- Sudholz, B.; Timperio, A.; Ridgers, N.D.; Dunstan, D.W.; Baldock, R.; Holland, B.; Salmon, J. The Impact and Feasibility of Introducing Height-Adjustable Desks on Adolescents’ Sitting in a Secondary School Classroom. AIMS Public Health 2016, 3, 274–287. [Google Scholar] [CrossRef]
- Swartz, A.M.; Tokarek, N.R.; Lisdahl, K.; Maeda, H.; Strath, S.J.; Cho, C.C. Do Stand-Biased Desks in the Classroom Change School-Time Activity and Sedentary Behavior? Int. J. Environ. Res. Public Health 2019, 16, 933. [Google Scholar] [CrossRef] [PubMed]
- Verloigne, M.; Ridgers, N.D.; De Bourdeaudhuij, I.; Cardon, G. Effect and Process Evaluation of Implementing Standing Desks in Primary and Secondary Schools in Belgium: A Cluster-Randomised Controlled Trial. Int. J. Behav. Nutr. Phys. Act. 2018, 15, 94. [Google Scholar] [CrossRef]
- Wendel, M.L.; Benden, M.E.; Zhao, H.; Jeffrey, C. Stand-Biased Versus Seated Classrooms and Childhood Obesity: A Randomized Experiment in Texas. Am. J. Public Health 2016, 106, 1849–1854. [Google Scholar] [CrossRef]
- Wick, K.; Faude, O.; Manes, S.; Zahner, L.; Donath, L. I Can Stand Learning: A Controlled Pilot Intervention Study on the Effects of Increased Standing Time on Cognitive Function in Primary School Children. Int. J. Environ. Res. Public Health 2018, 15, 356. [Google Scholar] [CrossRef] [PubMed]
- Ruiter, M.; Eielts, C.; Loyens, S.; Paas, F. Comparing Cognitive Control Performance During Seated Rest and Self-Paced Cycling on a Desk Bike in Preadolescent Children. J. Phys. Act. Health 2019, 16, 533–539. [Google Scholar] [CrossRef] [PubMed]
- Fedewa, A.; Davis, M.A.C.; Ahn, S. Effects of Stability Balls on Children’s On-Task Behavior, Academic Achievement, and Discipline Referrals: A Randomized Controlled Trial. Am. J. Occup. Ther. 2015, 69, 6902220020p1–6902220020p9. [Google Scholar] [CrossRef]
- Higgins, J.P.T.; Thomas, J.; Chandler, J.; Cumpston, M.; Li, T.; Page, M.J.; Welch, V.A. Cochrane Handbook for Systematic Reviews of Interventions. John Wiley & Sons: Chichester, UK, 2019; ISBN 978-1-119-53661-1. [Google Scholar]
- Guyatt, G.H.; Oxman, A.D.; Vist, G.; Kunz, R.; Brozek, J.; Alonso-Coello, P.; Montori, V.; Akl, E.A.; Djulbegovic, B.; Falck-Ytter, Y.; et al. GRADE Guidelines: 4. Rating the Quality of Evidence—Study Limitations (Risk of Bias). J. Clin. Epidemiol. 2011, 64, 407–415. [Google Scholar] [CrossRef] [PubMed]
- Tudor-Locke, C.; Schuna, J.M.; Frensham, L.J.; Proenca, M. Changing the Way We Work: Elevating Energy Expenditure with Workstation Alternatives. Int. J. Obes. 2014, 38, 755–765. [Google Scholar] [CrossRef]
- Coenen, P.; Willenberg, L.; Parry, S.; Shi, J.W.; Romero, L.; Blackwood, D.M.; Maher, C.G.; Healy, G.N.; Dunstan, D.W.; Straker, L.M. Associations of Occupational Standing with Musculoskeletal Symptoms: A Systematic Review with Meta-Analysis. Br. J. Sports Med. 2018, 52, 176–183. [Google Scholar] [CrossRef] [PubMed]
- Ioannidis, J.P.A. The Mass Production of Redundant, Misleading, and Conflicted Systematic Reviews and Meta-Analyses. Milbank Q. 2016, 94, 485–514. [Google Scholar] [CrossRef] [PubMed]
- Migueles, J.H.; Cadenas-Sanchez, C.; Ekelund, U.; Delisle Nyström, C.; Mora-Gonzalez, J.; Löf, M.; Labayen, I.; Ruiz, J.R.; Ortega, F.B. Accelerometer Data Collection and Processing Criteria to Assess Physical Activity and Other Outcomes: A Systematic Review and Practical Considerations. Sports Med. 2017, 47, 1821–1845. [Google Scholar] [CrossRef] [PubMed]
- Dupont, F.; Léger, P.-M.; Begon, M.; Lecot, F.; Sénécal, S.; Labonté-Lemoyne, E.; Mathieu, M.-E. Health and Productivity at Work: Which Active Workstation for Which Benefits: A Systematic Review. Occup. Environ. Med. 2019, 76, 281–294. [Google Scholar] [CrossRef] [PubMed]

Publisher’s Note: MDPI stays neutral with regard to jurisdictional claims in published maps and institutional affiliations. |
© 2021 by the authors. Licensee MDPI, Basel, Switzerland. This article is an open access article distributed under the terms and conditions of the Creative Commons Attribution (CC BY) license (http://creativecommons.org/licenses/by/4.0/).
Share and Cite
Guirado, T.; Chambonnière, C.; Chaput, J.-P.; Metz, L.; Thivel, D.; Duclos, M. Effects of Classroom Active Desks on Children and Adolescents’ Physical Activity, Sedentary Behavior, Academic Achievements and Overall Health: A Systematic Review. Int. J. Environ. Res. Public Health 2021, 18, 2828. https://doi.org/10.3390/ijerph18062828
Guirado T, Chambonnière C, Chaput J-P, Metz L, Thivel D, Duclos M. Effects of Classroom Active Desks on Children and Adolescents’ Physical Activity, Sedentary Behavior, Academic Achievements and Overall Health: A Systematic Review. International Journal of Environmental Research and Public Health. 2021; 18(6):2828. https://doi.org/10.3390/ijerph18062828
Chicago/Turabian StyleGuirado, Terry, Camille Chambonnière, Jean-Philippe Chaput, Lore Metz, David Thivel, and Martine Duclos. 2021. "Effects of Classroom Active Desks on Children and Adolescents’ Physical Activity, Sedentary Behavior, Academic Achievements and Overall Health: A Systematic Review" International Journal of Environmental Research and Public Health 18, no. 6: 2828. https://doi.org/10.3390/ijerph18062828
APA StyleGuirado, T., Chambonnière, C., Chaput, J.-P., Metz, L., Thivel, D., & Duclos, M. (2021). Effects of Classroom Active Desks on Children and Adolescents’ Physical Activity, Sedentary Behavior, Academic Achievements and Overall Health: A Systematic Review. International Journal of Environmental Research and Public Health, 18(6), 2828. https://doi.org/10.3390/ijerph18062828