


Abstract
Blue spaces have been found to have significant salutogenic effects. However, little is known about the mechanisms and pathways that link blue spaces and health. The purpose of this systematic review and meta-analysis is to summarise the evidence and quantify the effect of blue spaces on four hypothesised mediating pathways: physical activity, restoration, social interaction and environmental factors. Following the PRISMA guidelines, a literature search was conducted using six databases (PubMed, Scopus, PsycInfo, Web of Science, Cochrane Library, EBSCOHOST/CINAHL). Fifty studies were included in our systematic review. The overall quality of the included articles, evaluated with the Qualsyst tool, was judged to be very good, as no mediating pathway had an average article quality lower than 70%. Random-effects meta-analyses were conducted for physical activity, restoration and social interaction. Living closer to blue space was associated with statistically significantly higher physical activity levels (Cohen’s d = 0.122, 95% CI: 0.065, 0.179). Shorter distance to blue space was not associated with restoration (Cohen’s d = 0.123, 95% CI: −0.037, 0.284) or social interaction (Cohen’s d = −0.214, 95% CI: −0.55, 0.122). Larger amounts of blue space within a geographical area were significantly associated with higher physical activity levels (Cohen’s d = 0.144, 95% CI: 0.024, 0.264) and higher levels of restoration (Cohen’s d = 0.339, 95% CI: 0.072, 0.606). Being in more contact with blue space was significantly associated with higher levels of restoration (Cohen’s d = 0.191, 95% CI: 0.084, 0.298). There is also evidence that blue spaces improve environmental factors, but more studies are necessary for meta-analyses to be conducted. Evidence is conflicting on the mediating effects of social interaction and further research is required on this hypothesised pathway. Blue spaces may offer part of a solution to public health concerns faced by growing global urban populations.
Keywords:
physical activity; stress; social isolation; pollution; heat island; urban nature; park; lake; health; environment 1. Introduction
The world’s urban population has grown by approximately 460% between 1950 and 2018, increasing the number of people living in urban areas from 751 million in 1950 to 4.2 billion in 2018 [1]. This tremendous increase in the urban population has raised several environmental, social and health concerns [2]. Urbanisation is linked to increased risk of non-communicable diseases, premature mortality [3], as well as a higher risk of mental illnesses [4] and social isolation [5]. Urban growth is projected to continue and bring an additional 2.5 billion people to urban areas by 2050 [1]. It is therefore of paramount importance for city-planners to create sustainable and healthy urban environments, which promote mental and physical wellbeing.
Natural environments bring several benefits to public health and social wellbeing in urban settings. Studies have shown that exposure to natural environments contributes to reduced mortality rates and increased wellbeing among urban dwellers [6]. Most of the research has concentrated on the impact of green spaces (e.g., parks), but in recent years it has emerged that blue spaces such as coasts, lakes, rivers and canals can bring similar benefits [7,8,9]. To date, few studies differentiate between green and blue spaces, as blue space is often treated as an inherent component of parks and natural environments [9]. However, blue spaces are independent entities and there is a need to be considered separately and not solely as a subcategory of green spaces [10]. Over the years, research has focused on the negative effects of blue spaces and the understanding of such effects is well developed [11]. Health hazards, such as an increased risk of flooding and higher levels of disease transmission, through exposure to several microbes and contact of humans with a wide range of hazardous chemicals, have often been linked to blue spaces [11]. However, recent epidemiological studies have shown that blue spaces also have a positive effect on public health [9], including the reduction of mortality rate with the greatest rate of decline seen in areas closest to blue space [12], better physical health [7], and better mental health [8]. In fact, a recent meta-analysis quantified the health impact of blue spaces and concluded that it is as strong as that of green spaces [9]. Therefore, it logically derives that the existence of such benefits from blue spaces also enables discussion of environmental justice around their accessibility and availability to some groups of the population. Simultaneously, blue spaces are considered valuable ecosystem services, have both an aesthetic and ecological role in urban environments and can be used for urban microclimate regulation [10,13].
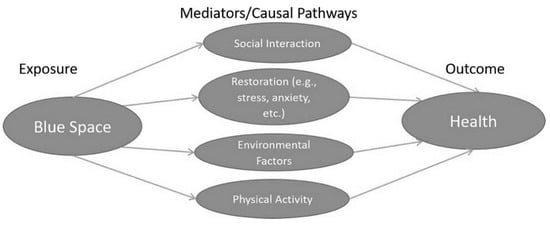
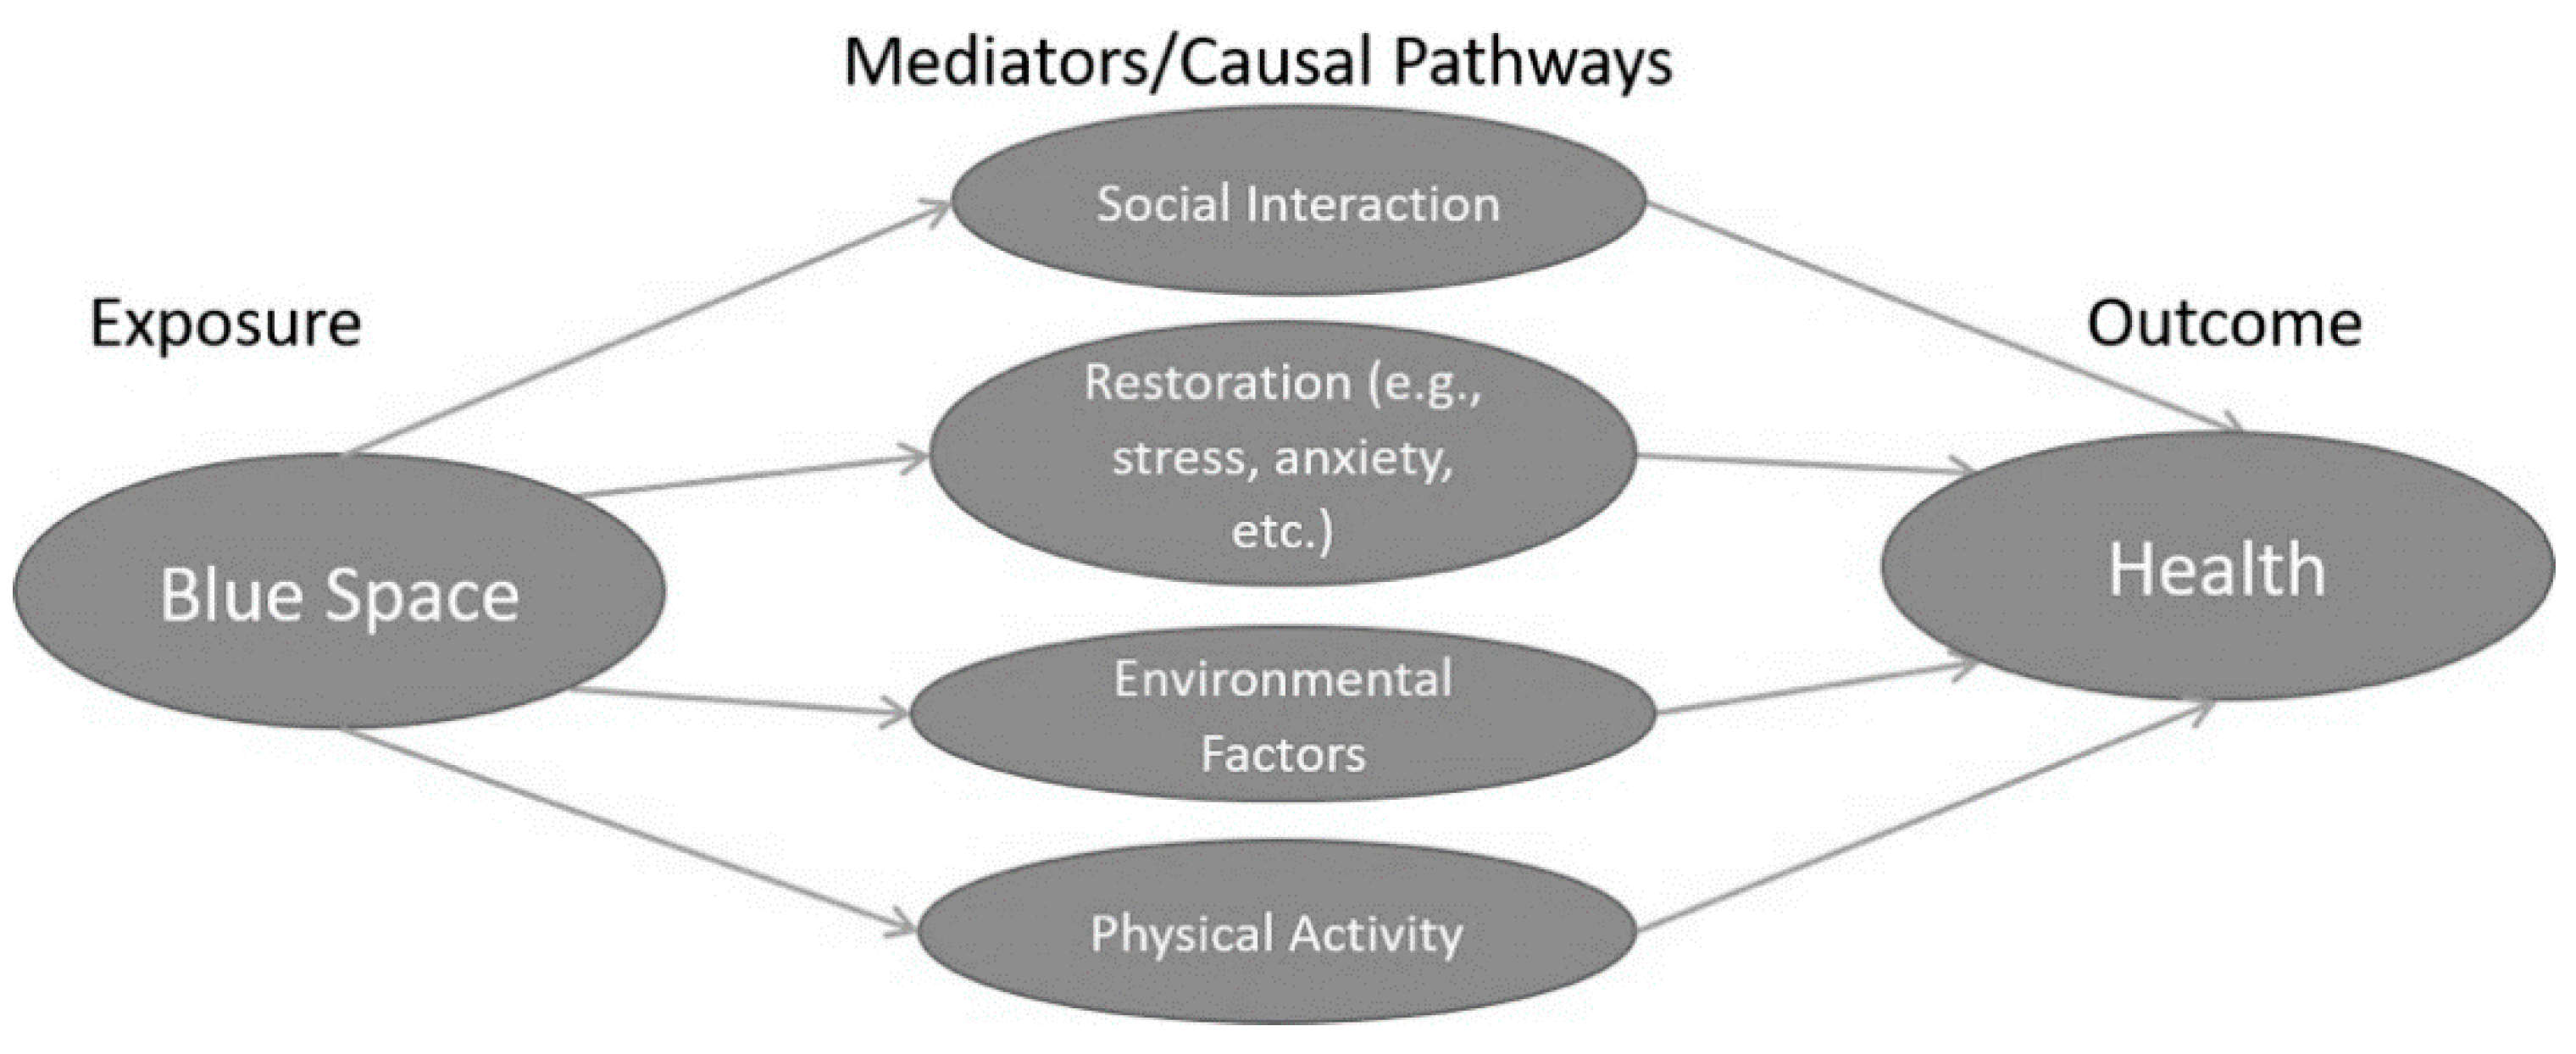
In order to leverage these salutogenic effects and improve the health of the urban population, it is important to understand the linking mechanisms between exposure to blue space and health. Four mechanisms have been proposed to mediate the relationship between blue spaces and health (Figure 1): (1) Access to blue spaces may promote physical activity which is the fourth most important risk factor for poor health [14]; (2) Exposure to blue spaces may improve restoration [15]. This follows the definition by [15] and therefore considers markers of restoration, including, but not limited to, stress, anxiety, depressed mood and psychological wellbeing, which have been linked with risk of cardiovascular diseases [16] and mental health issues [17]; (3) Blue spaces may contribute to a healthier environment and reduce air pollution, heat island effect, risk of flooding [18]; and finally (4) Blue spaces may promote social interactions which have been found to benefit mental and physical health, among others, through a sense of community, mutual support between people, quicker emergency reaction and sense of coherence [19].
Figure 1.
Blue Space—Hypothesised Health Mediators/Causal Pathways.
To date there has been no review synthesising evidence about these potential mechanisms.
The purpose of this systematic review and meta-analysis is to summarise current evidence and quantify the effect of blue space on physical activity, restoration, environmental factors and social interaction.
2. Materials and Methods
This systematic review and meta-analysis followed the PRISMA guidelines and the composition of systematic reviews in research guidelines [20,21]. The review protocol was pre-registered with PROSPERO (available at http://www.crd.york.ac.uk/PROSPERO/ (accessed on 22 January 2021) with registration number CRD42019154917).
2.1. Search Strategy
Six databases (PubMed, Scopus, PsycInfo, Web of Science, Cochrane Library, CINAHL (EBSCO)) were searched for articles using keywords and synonyms of terms pertaining to urban green and blue spaces (e.g., rivers, canals) and potential mechanisms or mediating factors (e.g., physical activity, stress, sleep, air pollutant, social interaction, noise). For each database, a search string was created, combining these keywords (search strategy provided in Supplementary File/Table S2). Searches were limited to articles reporting research on human participants and published in English from inception until 22 January 2021. A snowball search for relevant studies was conducted, by two reviewers (MG, SC), based on the reference lists provided in the included articles of this review and review articles identified. Explanation of search terms is provided in Supplementary File/Table S1.
2.2. Eligibility Criteria
To be included in this review and meta-analysis the studies had to fulfil the inclusion and exclusion criteria detailed in Table S3 in the supplementary material. Briefly, studies had to present original peer-reviewed research providing quantitative information about the relationship between exposure to blue spaces and markers of social interaction, restoration, physical activity and/or environmental factors. We included studies which considered those as outcomes or mediators. The following blue spaces were considered: all inland waterways, coastal environments, canalled areas, blue infrastructure (BI), navigable transportation canals, aqueducts, lakes, marinas, rivers, ponds, reservoirs, marshes, estuaries, fountains, streams, reconstructed or recalibrated wetlands, waterfront parks, deculverted/daylighted areas, open air streams, urban waterways, riparian corridors, recalibrated urban parks, urban forests, natural preserves. Included studies had to be of the following designs: cross-sectional, longitudinal, cohort study, case study of specific sites, natural experiment, prospective study, randomised controlled trial, case reports and series, cross-over study, or evaluation study. We considered studies that reported exposure to blue space in the following categories: distance to blue space, amount of blue space within a geographical area, contact with blue spaces (e.g., visits) and visibility of blue space.
Studies were excluded if they were: qualitative studies, opinion pieces, theoretical papers, non-peer-reviewed or conducted using a virtual environment.
2.3. Screening, Data Extraction and Quality Appraisal
All search results/articles were retrieved and uploaded to the Rayyan QCRI online tool for systematic reviews [22]. Study abstracts and titles were independently screened for inclusion by two reviewers from a pool of four (MG, SC, ZT, NS). A third reviewer (out of the reviewer pool) was used to resolve disagreement where necessary. Full-text screens were then carried out independently by two reviewers (MG, SC), while a third reviewer was used to settle conflicting decisions.
For data extraction, a standard template was used, containing details of each article’s title, author, date, title, population, age (mean (SD)), sample size, design, main results, area/context, blue space exposure, method of blue space exposure measurement, and confounding variables.
Quality appraisal of studies was conducted by two reviewers using the Standard Quality Assessment Criteria for Evaluating Primary Research Papers from a Variety of Fields QUALSYST tool [23]. This tool was chosen as it enables the assessment of quality and evaluation of potential bias over a wide range of research designs from experimental to observational [24]. All articles were evaluated on a rating scale in five domains: use of correct methods, design appropriateness, sample size, inclusion of confounding variables, report of sufficient statistical evidence and description of participants/subjects.
2.4. Meta-Analyses
Studies were classed according to how exposure to blue space was measured (e.g., distance to blue space, amount of blue space, frequency of visits) and the mechanism/mediator investigated, by two study authors (MG, SC). A meta-analysis was conducted when at least three studies were available for the same exposure and mechanism/mediator combined. Meta-analyses were feasible for the association between the amount of blue space and physical activity, distance to blue space and physical activity, amount of blue space and restoration, distance to blue space and restoration, contact with blue space and restoration and distance to blue space and social interaction. Other categories did not have a sufficient number of articles or did not report sufficient statistics to permit a meta-analysis. Prior to each meta-analysis, the effect size of blue space of each study was extracted and converted to Cohen’s d, based on conversion methods for effect sizes in the existing literature [25,26]. Effect sizes were pooled using a random-effect model meta-analysis, and the results were presented as forest plots. We interpreted Cohen’s d effect sizes as low, moderate, or high, according to upper limits of 0.2, 0.5 and 0.8, respectively [27]. Subsequently, when a study used several different measurements for the same exposure category, the same outcomes reported by this study were averaged over the different measurement in the same exposure category. For studies reporting separate results for different groups for the same exposure and outcome, we computed the average outcome for each exposure category weighted by the sample size of each group. When studies reported the same outcome measure both objectively and via self-report, we prioritised the objective measure. For example, Garrett et al. [28] reported both self-reported physical activity and accelerometer physical activity levels. In this case, the objective measure (accelerometer) was prioritised over the self-reported physical activity levels. Heterogeneity amongst studies was gauged by visual inspection of funnel plots and quantified using I2 statistics. With upper limits of 25%, 50% and 75% respectively for I2, heterogeneity was interpreted as medium, moderate, or high [29]. All meta-analyses were computed using Comprehensive Meta-Analysis software version 3 [30]. Forest plots were created based on Cohen’s d effect size, using the same software [30].
3. Results
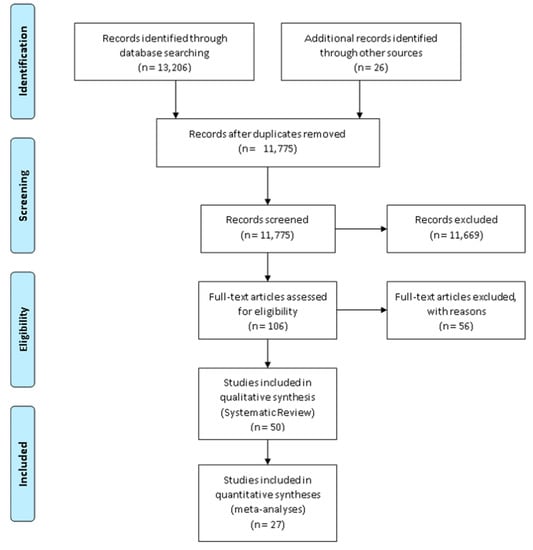
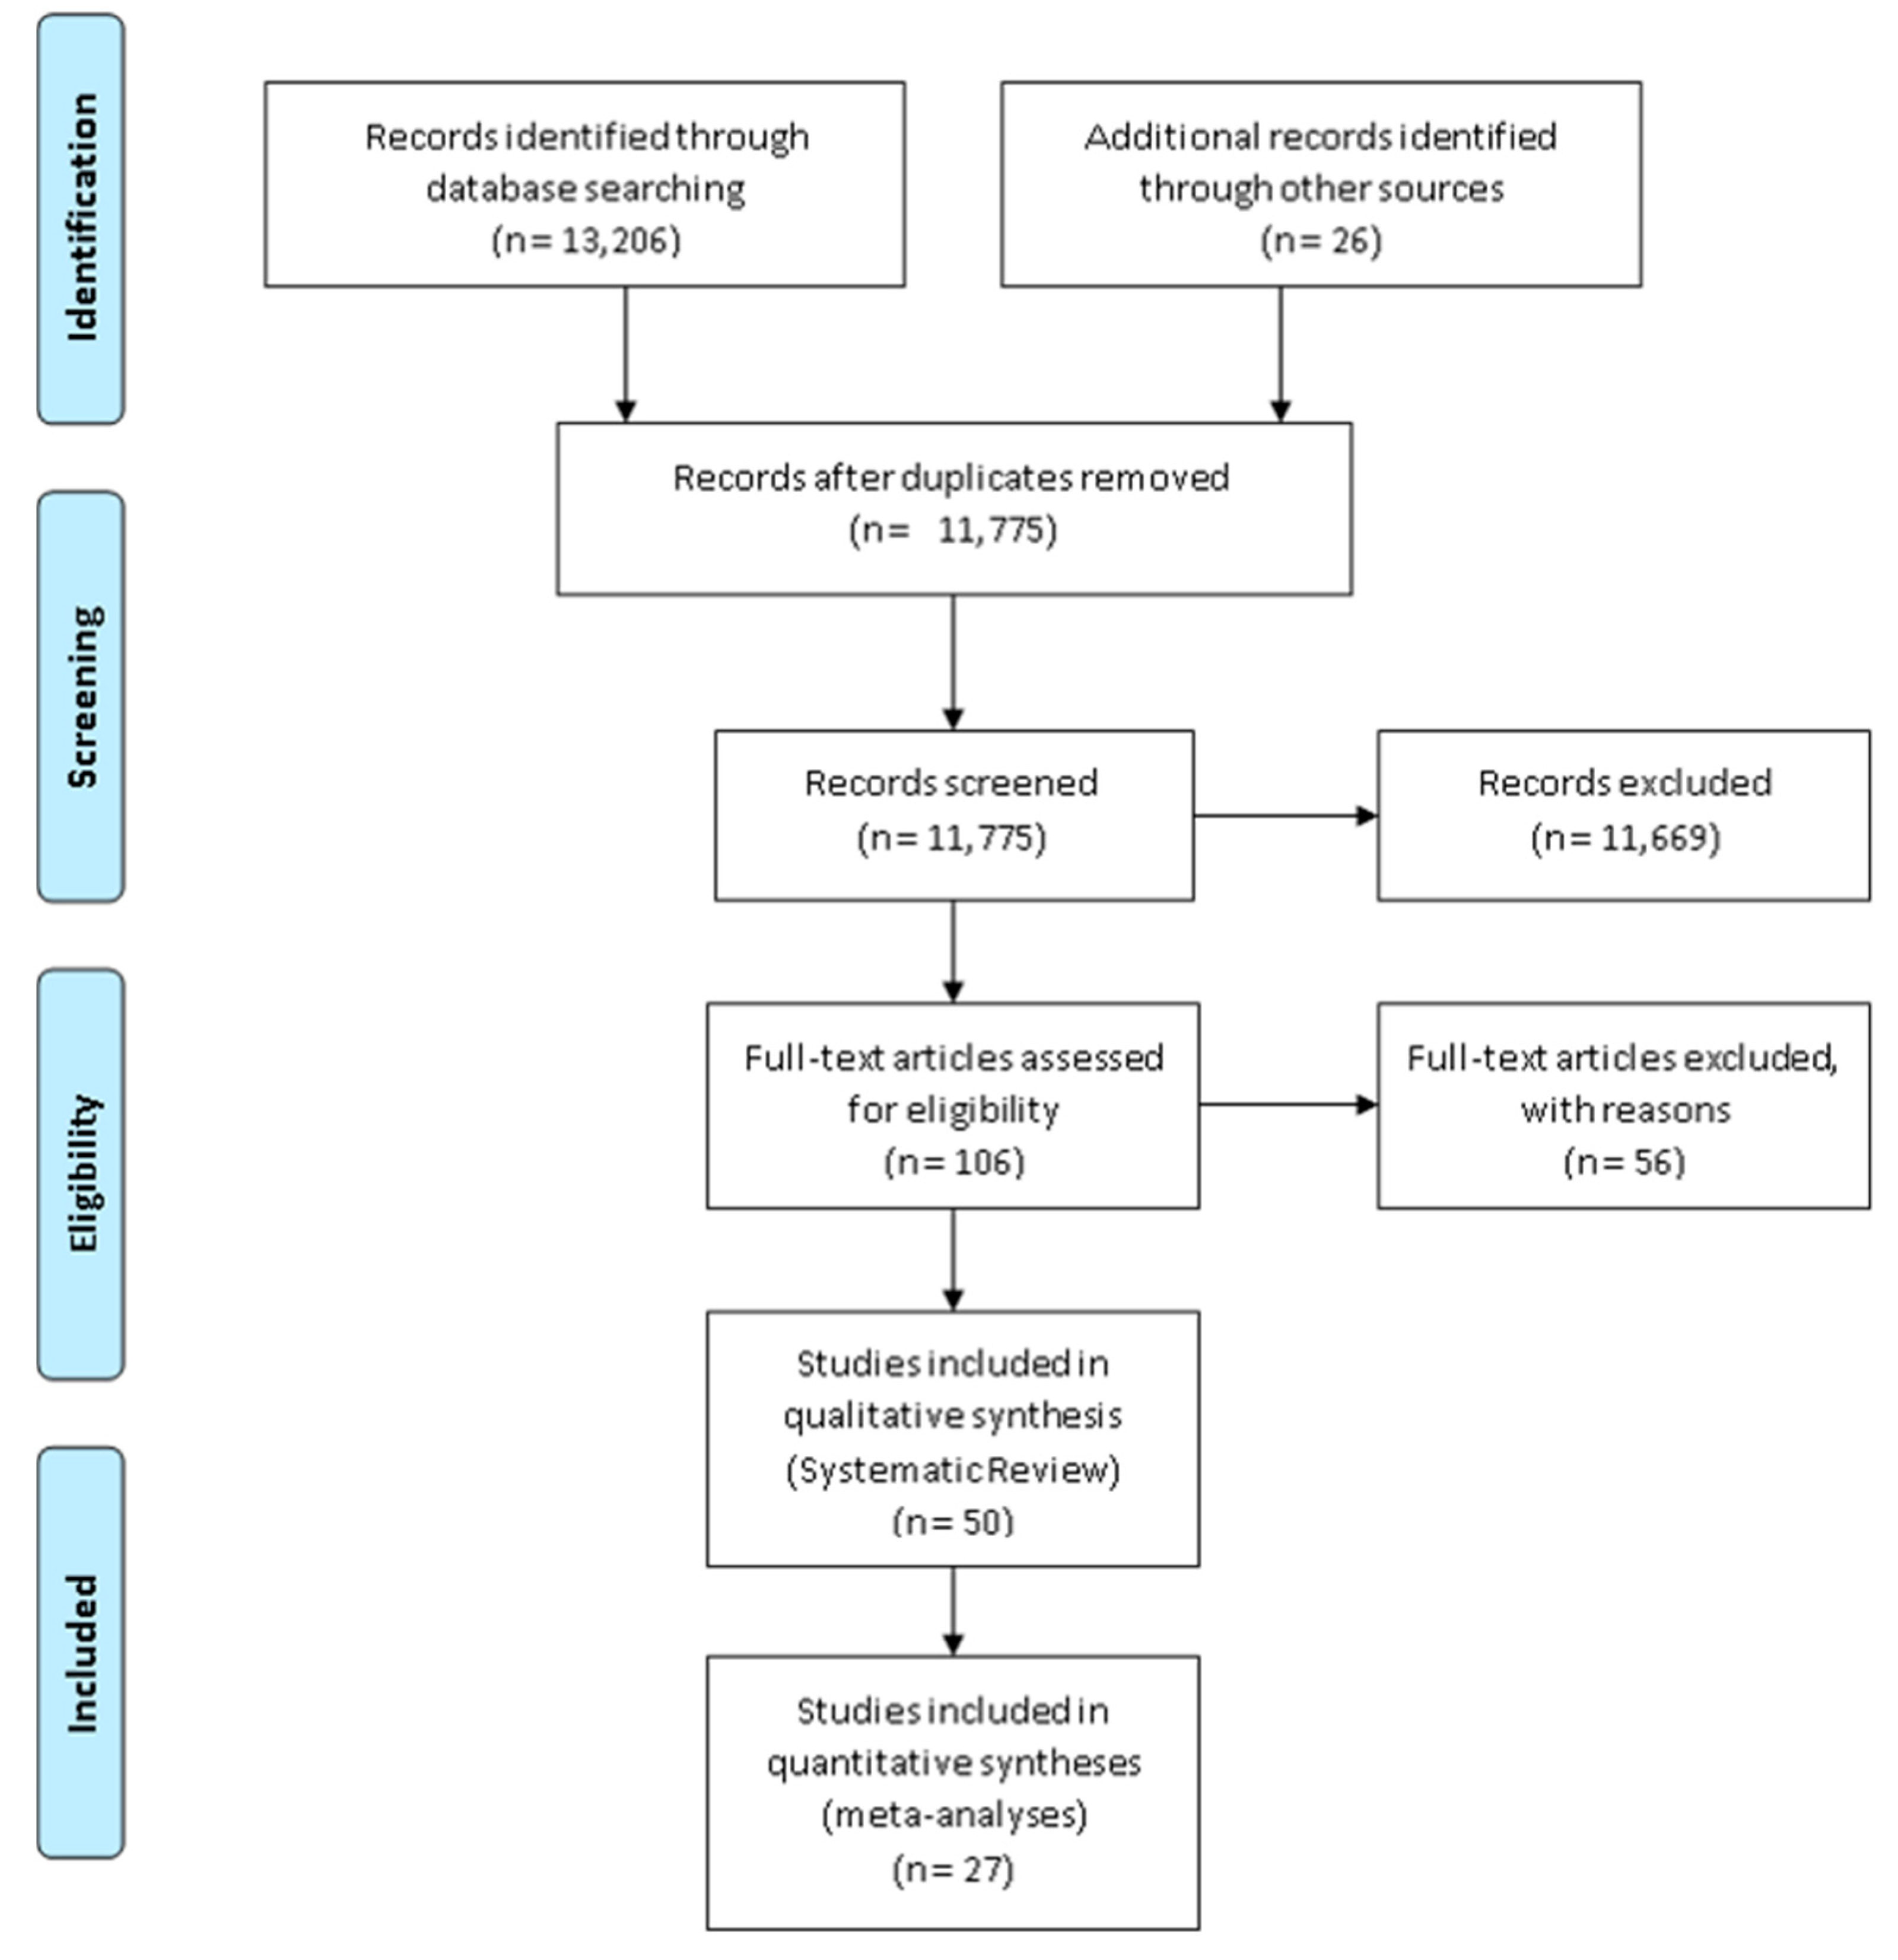
The electronic searches identified 13,206 articles; 9122 in PubMed, 47 in Scopus, 1136 in PsycInfo, 1843 in Web of Science, 53 in Cochrane Library, and 1005 in CINAHL (EBSCO). 26 more papers, meeting the inclusion criteria, were added to the database from the snowball search. After removing duplicates, 106 articles were found to be eligible for full-text screening. This resulted in 50 studies being included in the review. The main reasons for excluding studies were that studies did not measure the right exposure, were qualitative, were conducted in a virtual environment or referred solely to impacts of green space. The data flow is presented in Figure 2. All 50 articles were split into four categories based on their mediating pathways, while eight articles presented findings for more than one mediating pathway and these were therefore assigned to more than one category. There were 18 articles for physical activity, 21 for restoration, seven for social interaction, and 14 articles for environmental factors.
Figure 2.
PRISMA Flow Diagram.
3.1. Study Design Characteristics
Among the 50 articles included in this review, 35 articles had a cross-sectional design [31,32,33,34,35,36,37,38,39,40,41,42,43,44,45,46,47,48,49,50,51,52,53,54,55,56,57,58,59,60,61,62,63,64,65], four were cross-over studies [66,67,68,69], seven were of longitudinal design [70,71,72,73,74,75,76], two were cohort studies [77,78], one article had both a longitudinal and cross-sectional design [79] and one article had both a cross-over and cross-sectional design [28] (Table 1). For physical activity, 14 articles were cross-sectional [28,31,32,33,34,35,36,37,38,55,56,57,58,59], one longitudinal [70], two cohort studies [77,78] and one both cross-over and cross-sectional [28]. For restoration, 14 articles were cross-sectional [39,40,41,42,43,44,45,55,56,57,60,61,62,63], three were longitudinal [71,72,75], three were cross-over [66,67,69] and one study had both a longitudinal and cross-sectional design [79]. For social interaction, six articles were of cross-sectional design [43,46,47,56,57,61] and one article was longitudinal [73]. In environmental factors, 11 articles were cross-sectional [48,49,50,51,52,53,54,56,57,64,65], two were longitudinal [74,76] and one was cross-over [68].
Table 1.
Characteristics of included studies.
3.2. Physical Activity
3.2.1. General Description
The association between physical activity and exposure to blue spaces was examined in 18 papers [29,32,33,34,35,36,37,38,39,48,56,57,58,59,60,72,78,79]. Fourteen papers reported blue spaces to have at least one positive association on physical activity, such as a higher volume of physical activity [70], a lower probability of inactivity [78] and more intense physical activity (more Moderate to Vigorous Physical Activity (MVPA)) [32]. Living closer to blue space or in an area with more blue space or more blue space surface was generally reported to positively influence physical activity compared to living further away or in areas with less blue space surface, in adult populations. Grow et al. [33] also found a negative association between proximity to blue space and walking for children, while Wang, Ettema and Helbich [59] found negative associations between the amount of blue space within an area and transportation/recreational walking in adults. Only four studies reported non-statistically significant associations [31,55,56,57].
3.2.2. Physical Activity Measurement Types
Out of the 14 papers showing an association between blue spaces and physical activity, 10 papers showed a positive impact either on walking or MVPA [32,33,34,36,37,38,47,70,77,78]. Of these, Grow et al. [33] also found a negative association between walking and blue space for children. Wang, Ettema and Helbich [59] found negative associations between transportation and recreational walking and blue space, for adults. Pasanen et al. [35] used a more inclusive physical activity indicator, namely “on-land outdoor physical activity”. They reported more “on-land outdoor physical activity” for closer proximity to blue space [35]. Garrett et al. [28] investigated the relationship between “meeting the physical activity guidelines” and blue space. They found higher odds of “meeting the physical activity guidelines” for more freshwater coverage and closer distance to blue space. Apart from MVPA, Jansen et al. [80], also used light physical activity (LPA) as a physical activity indicator in their study, finding a positive association between blue space and LPA.
Cycling was used as a physical activity indicator in two of the 14 papers showing an association between blue spaces and physical activity [33,34].
3.2.3. Quality Assessment
In general, all 18 physical activity related papers were of very good quality, with an average quality score of 88.12%. Papers were downgraded mainly due to insufficient justification of their methods of blue space measurement and the need for a more detailed explanation of their statistical analyses. Quality scores are provided in Supplementary File/Table S4.
3.2.4. Meta-Analyses
There was sufficient data to meta-analyse the effect of distance between blue space and dwelling/neighbourhood and the effect of the amount of blue space on physical activity.
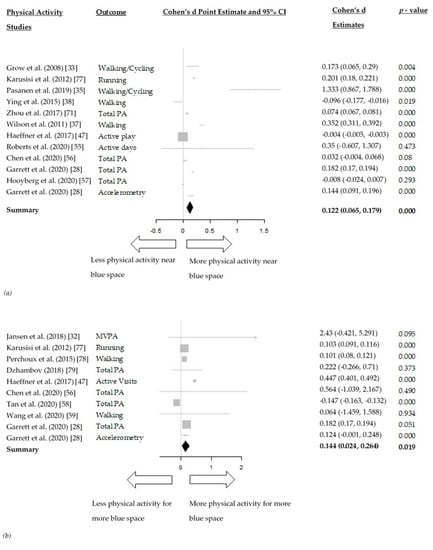
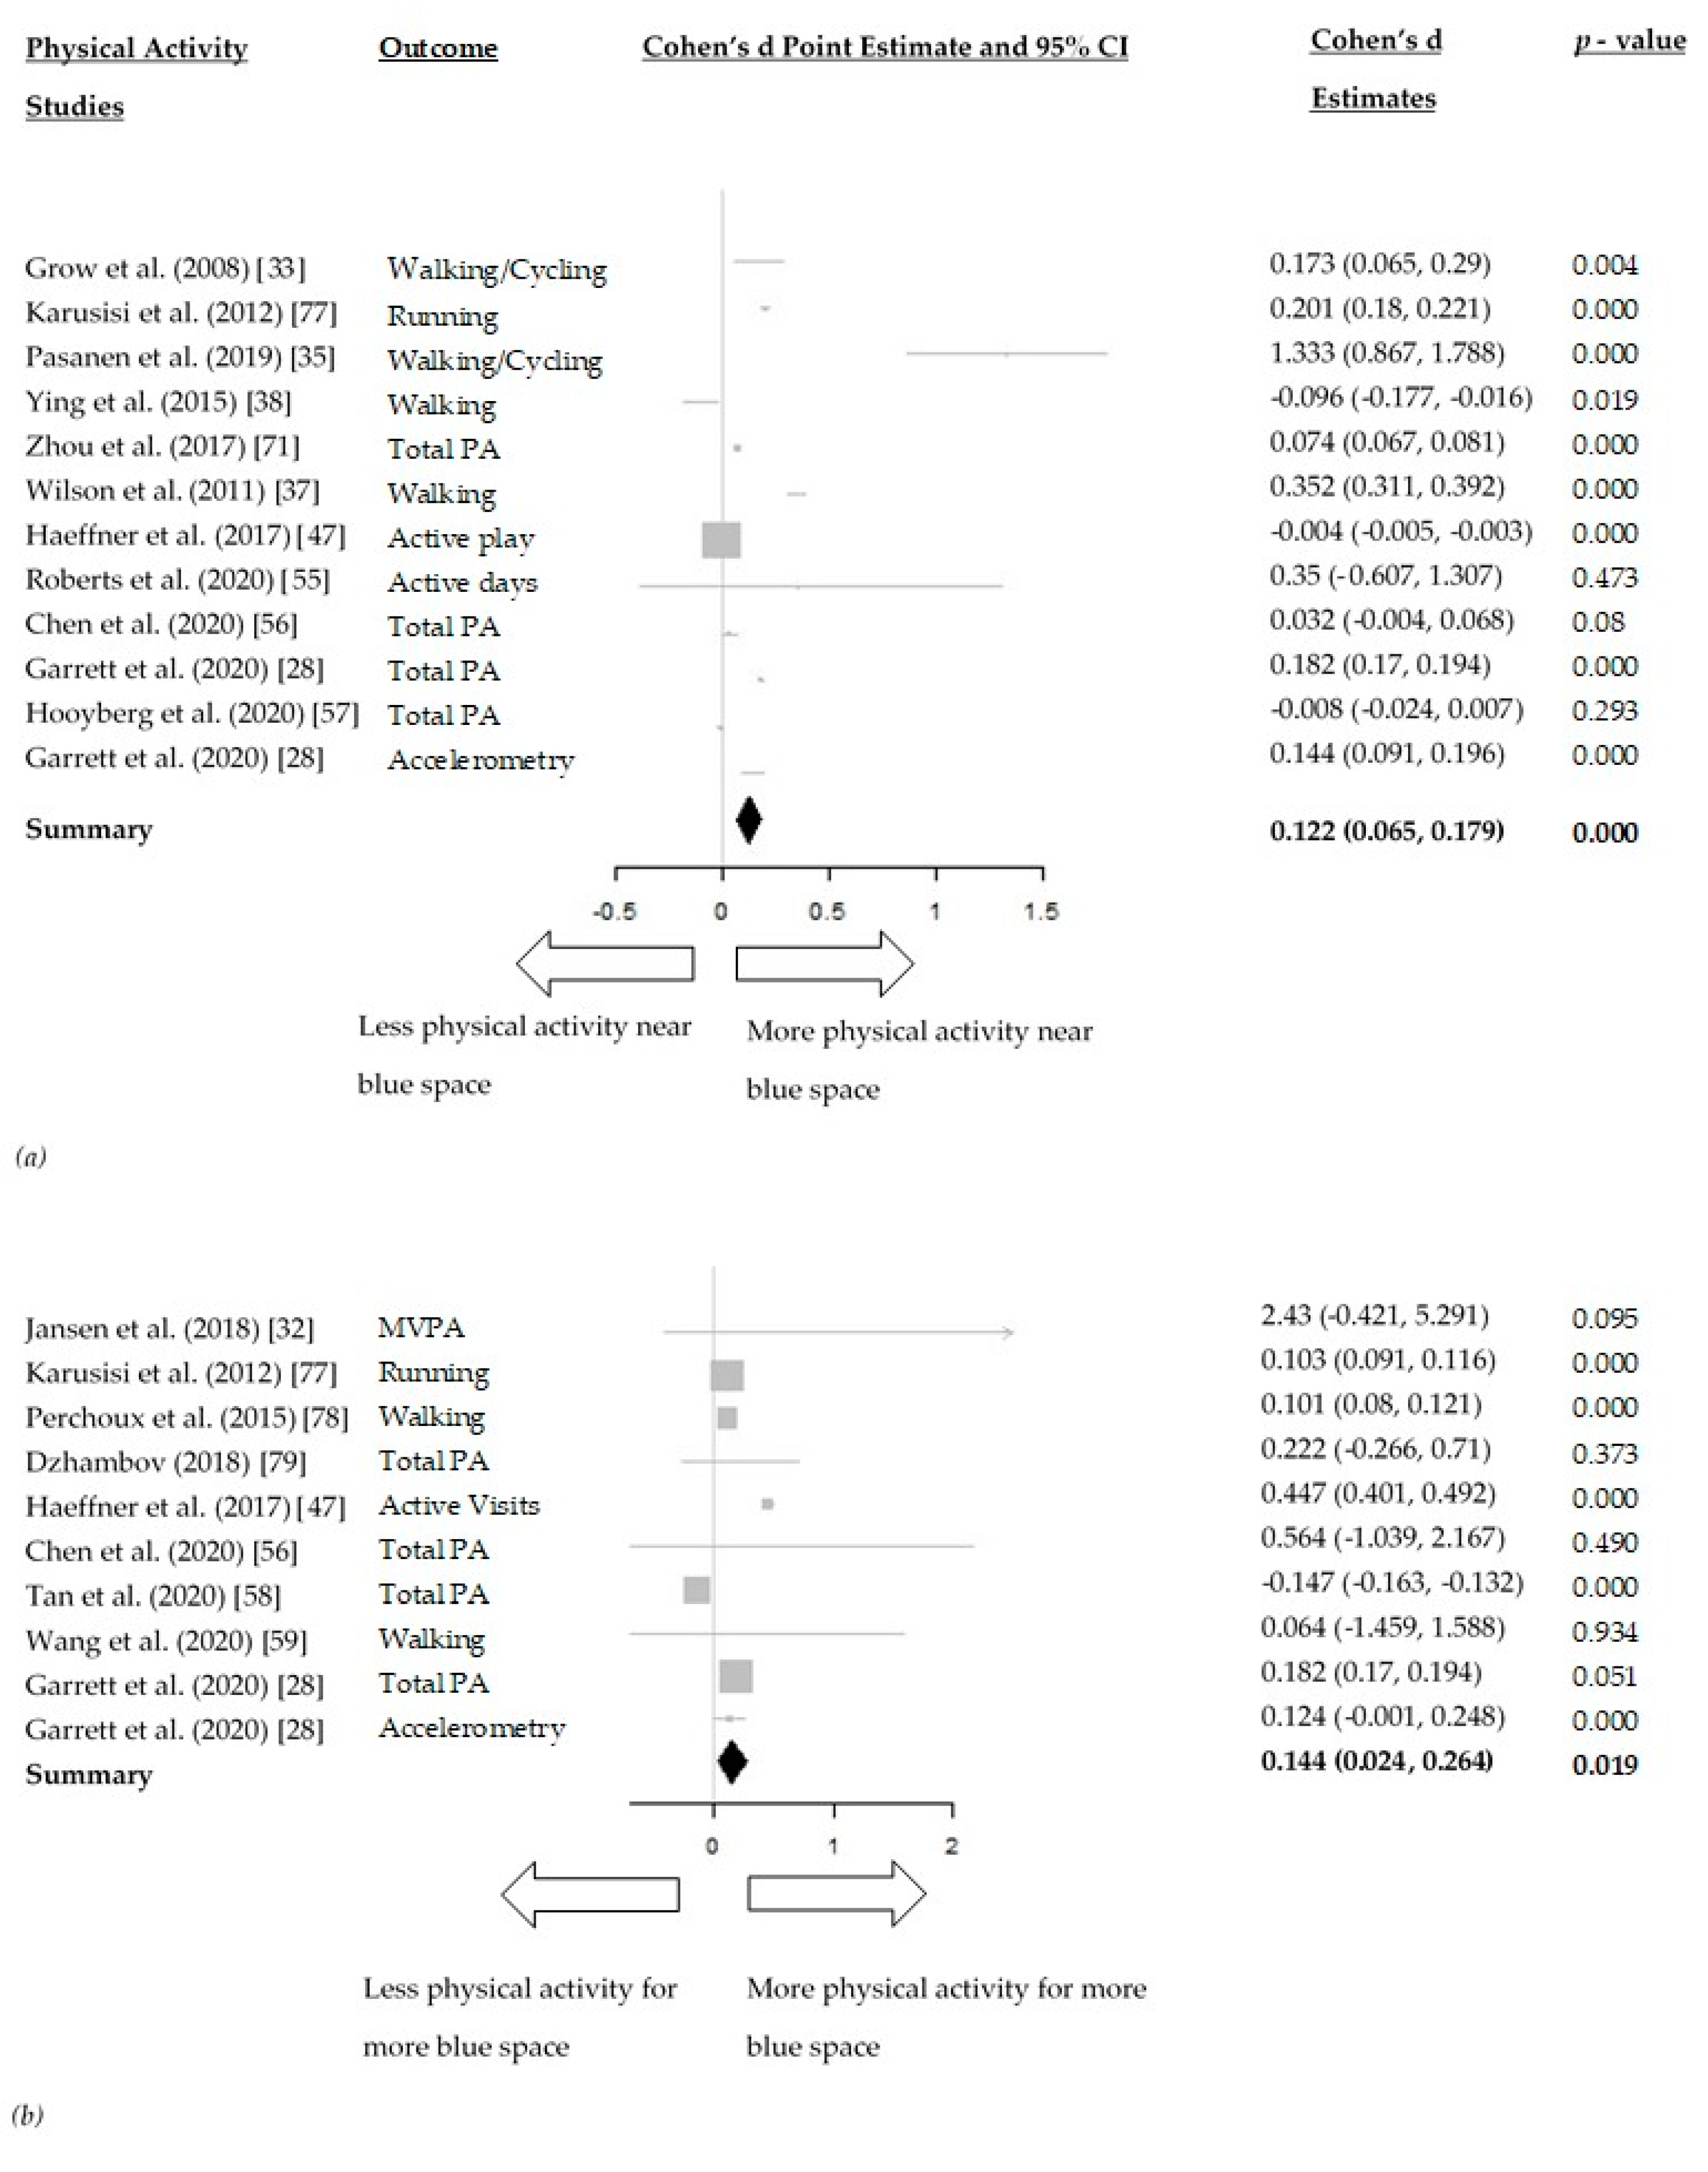
The meta-analysis between distance to blue space and physical activity included 11 studies [28,33,35,37,38,47,55,56,57,70,77]. In the random-effects model, living closer to blue space was associated with statistically significant higher physical activity levels (Cohen d = 0.122, 95% CI: 0.065, 0.179) (Figure 3a). The effect size was low.
Figure 3.
(a) Forest plot of the relationships between distance to blue space and physical activity; (b) Forest plot of the relationships between the amount of blue space around a certain geographical area and physical activity.
The meta-analysis between the amount of blue space and physical activity included nine studies [28,32,47,56,58,59,77,78,79]. A larger amount of blue space within a geographical area was statistically significantly associated with higher physical activity levels (Cohen d = 0.144, 95%CI: 0.024, 0.264) (Figure 3b). The effect size was low and similar to the effect between distance to blue space and physical activity.
Considerable heterogeneity was present in both models with an I2 of 99.49% and 99.34% for the association between distance to blue space and amount of blue space, respectively, with physical activity.
3.3. Restoration
3.3.1. General Description
The association between exposure to blue spaces and restoration was explored in 21 articles [39,40,41,42,43,44,45,55,56,57,60,61,62,63,66,67,69,71,72,75,79]. 18 articles reported statistically significant effects of blue spaces on restoration [40,41,42,44,45,55,56,60,61,62,63,66,67,69,71,72,75,79], while three articles [39,43,57] did not find an association. Living closer to blue space or in an area with more blue space or more blue space surface was generally reported to positively influence restoration compared to living further away or in an area with less blue space or blue space surface, in adult populations. Contrastingly, in children, Huynh et al. [40], did not find an association of blue spaces with restoration.
More specifically, seven studies found a beneficial effect of blue space availability or visibility on stress or psychological distress [41,43,55,56,63,66,71], while four articles used mental or emotional wellbeing as a restoration indicator and also found a beneficial effect [40,60,66,71]. Positive effects of blue space availability or visibility on anxiety or mood disorders were reported in one study [42]. Pearson et al. [42] suggested that proximity to Great Lakes had a positive effect on mood disorders but proximity to inland lakes had a negative effect. Positive effects of blue space availability or visibility were also found for other measures of restoration, such as attention restoration [71], self-reported history of depression [39], General Health Questionnaire (GHQ-12) scores [61,79], self-reported experienced restoration [62], Short Form 36 health survey (SF-36) scores [44,56] self-reported negative feelings [67], feelings of fascination or “being away” [63] state body shape, appearance and weight satisfaction [75], Patient Health Questionnaire (PHQ-9) [55], Wellbeing Index (WHO-5) [60,69], self-reported life satisfaction [69] and encounters of daily happy moments [72]. Blue space availability/visibility was also found to reduce major depressive disorders, by Rugel et al. [43].
3.3.2. Quality Assessment
Overall, the 21 restoration–related articles were judged as of very good quality with an average quality score of 88.77%. The main reasons for lower quality scores were the insufficient justification of methods of blue space measurements and the lack of a detailed description of input variables. Quality scores are provided in Supplementary File/Table S4.
3.3.3. Meta-Analyses
Sufficient data were available to conduct a meta-analysis of the association between distance to blue space and restoration, amount of blue space within a geographical area and restoration, contact with blue space and restoration.
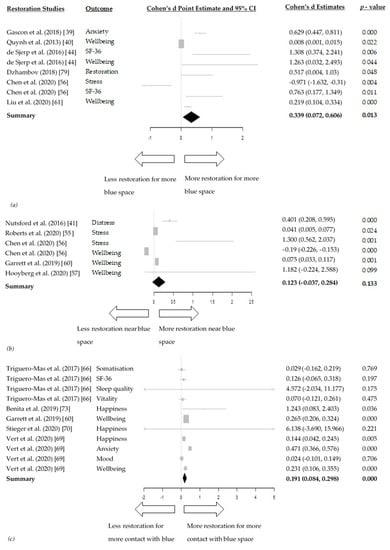
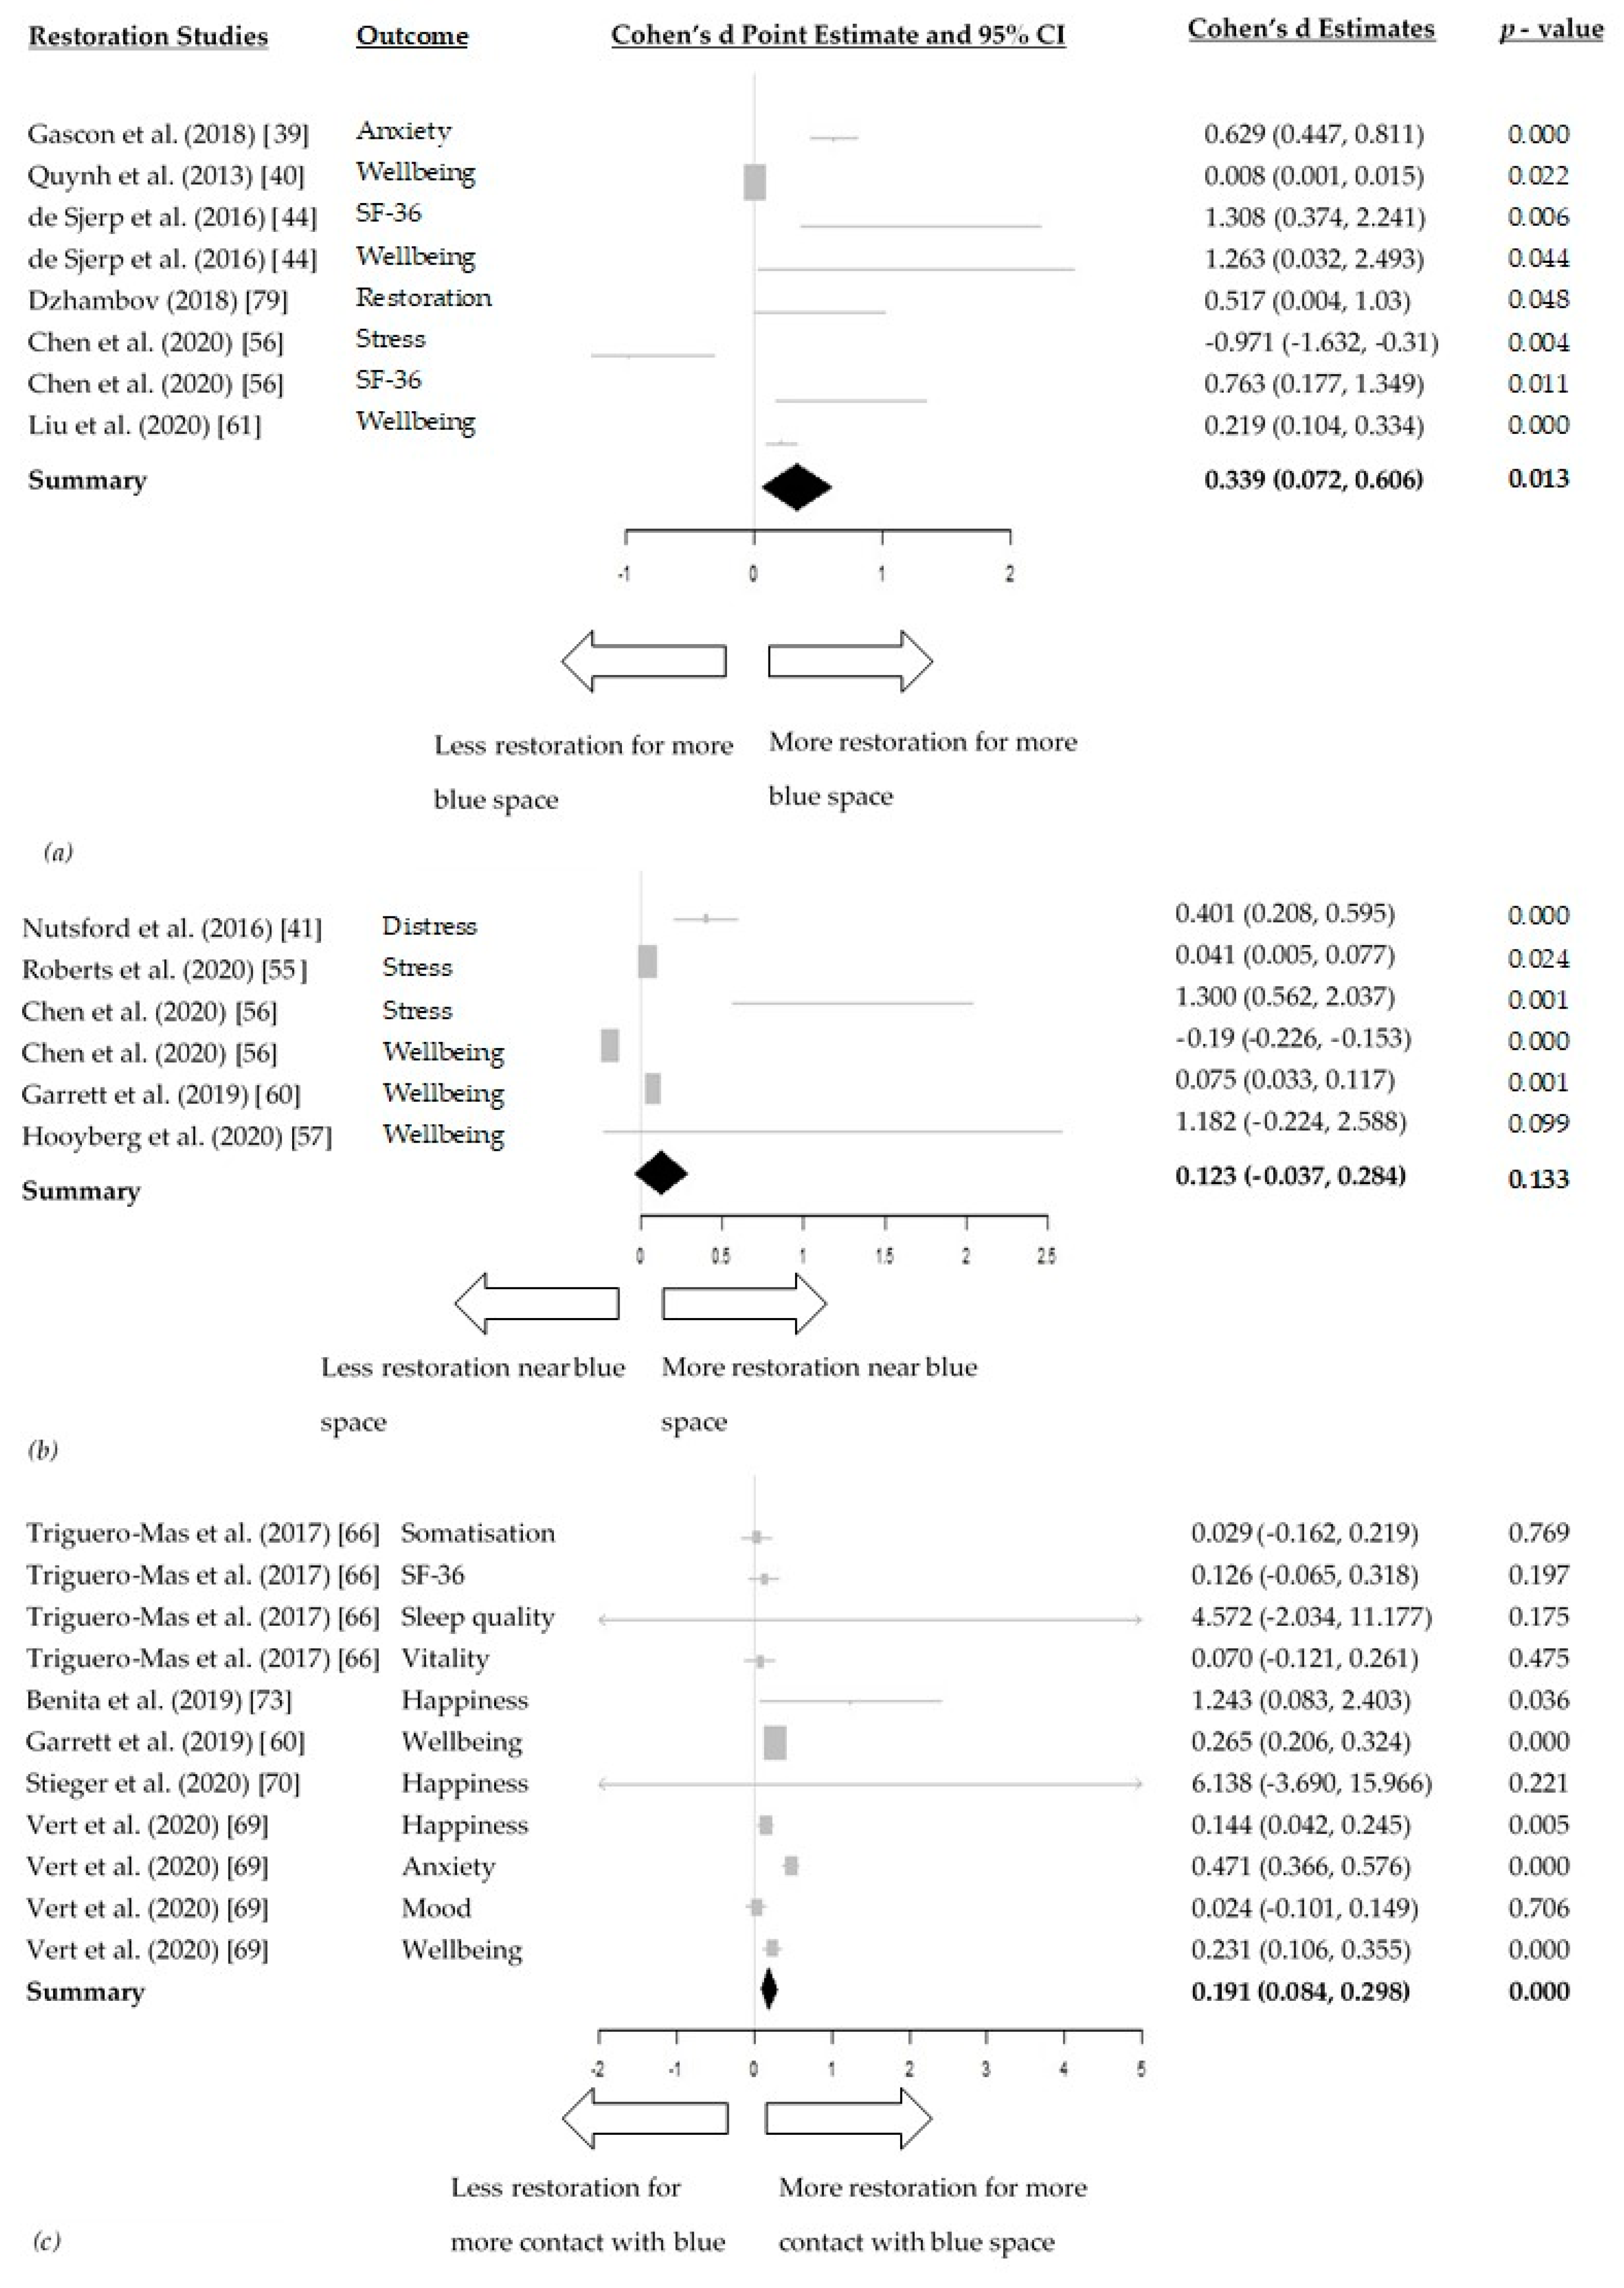
For the effect of amount of blue space within a geographical area on restoration the meta–analysis included six studies [39,40,44,56,61,79] pulling together the effects of blue space on five markers of restoration. For the effects of distance to blue space on restoration and contact with blue space on restoration, both meta-analyses included five studies [41,55,56,57,60] and [60,66,69,72,75] respectively. In the random-effects models, the increase of amount of blue space within a geographical area showed a small to moderate, but positive association with improved markers of restoration (Cohen d = 0.339, 95% CI: 0.072, 0.606, I2 = 91.97%) (Figure 4a). Having blue space closer to a dwelling/neighbourhood was not associated with higher restoration (Cohen d = 0.123, 95% CI: −0.037, 0.284, I2 = 96.60%) (Figure 4b) and being in more contact with blue space was associated with more restoration (Cohen d = 0.191, 95% CI: 0.084, 0.298, I2 = 79.50%) (Figure 4c). High heterogeneity was present in all three meta-analyses for restoration.
Figure 4.
(a) Forest plot of the relationship between the amount of blue space within a geographical area and restoration; (b) Forest plot of the relationships between distance to blue space and restoration; (c) Forest plot of the relationship between contact with blue space and restoration.
3.4. Social Interaction
3.4.1. General Description
Social interaction was associated with exposure to blue spaces in seven articles [43,46,47,56,57,61,73]. Generally, there was evidence that increasing contact with blue space, decreasing distance between dwellings/neighbourhoods and increasing the amount of blue within a geographical area could improve neighbourhood perception and social interaction, but that this may depend on the scale of each blue space setting.
More specifically, De Bell et al. [46] found that blue space exposure was associated with increased time with family or friends. This benefit, deriving from blue space exposure, appeared smaller than the positive effect of blue space exposure on psychological wellbeing, among people aged between 25 and 65. Hipp et al. [73] also found positive effects of blue space exposure on social interaction, as closer proximity to blue space increased the neighbouring, cohesion and attachment indices of the study’s population. Other markers of social interaction, such as sense of community [81], neighbourhood attachment, community participation and social cohesion [61], were also found to benefit from blue space. On the contrary, increasing a river’s length in a neighbourhood was found to be associated with lower neighbouring cohesion and attachment indices [73]. More amount of blue space within a geographical area was also found to decrease neighbourly interaction [61].
3.4.2. Quality Assessment
The social interaction related articles were judged to be of very good quality with an average quality score of 88.95%. The main reason for lower quality scores was insufficient details when reporting results. Quality scores are provided in Supplementary File/Table S4.
3.4.3. Meta-Analyses
There were sufficient data to meta-analyse the effect of amount of blue space within a geographical area on social interaction and the effect of distance to blue space on social interaction.
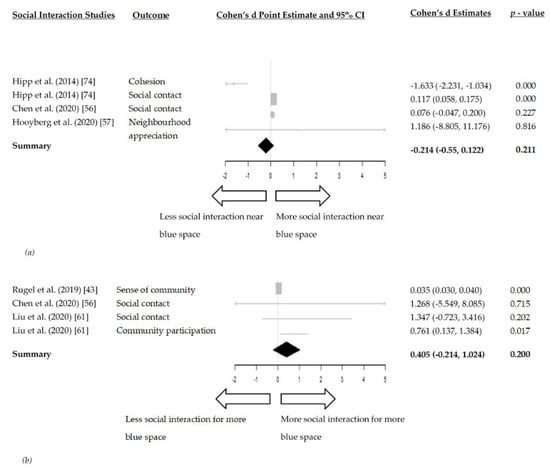
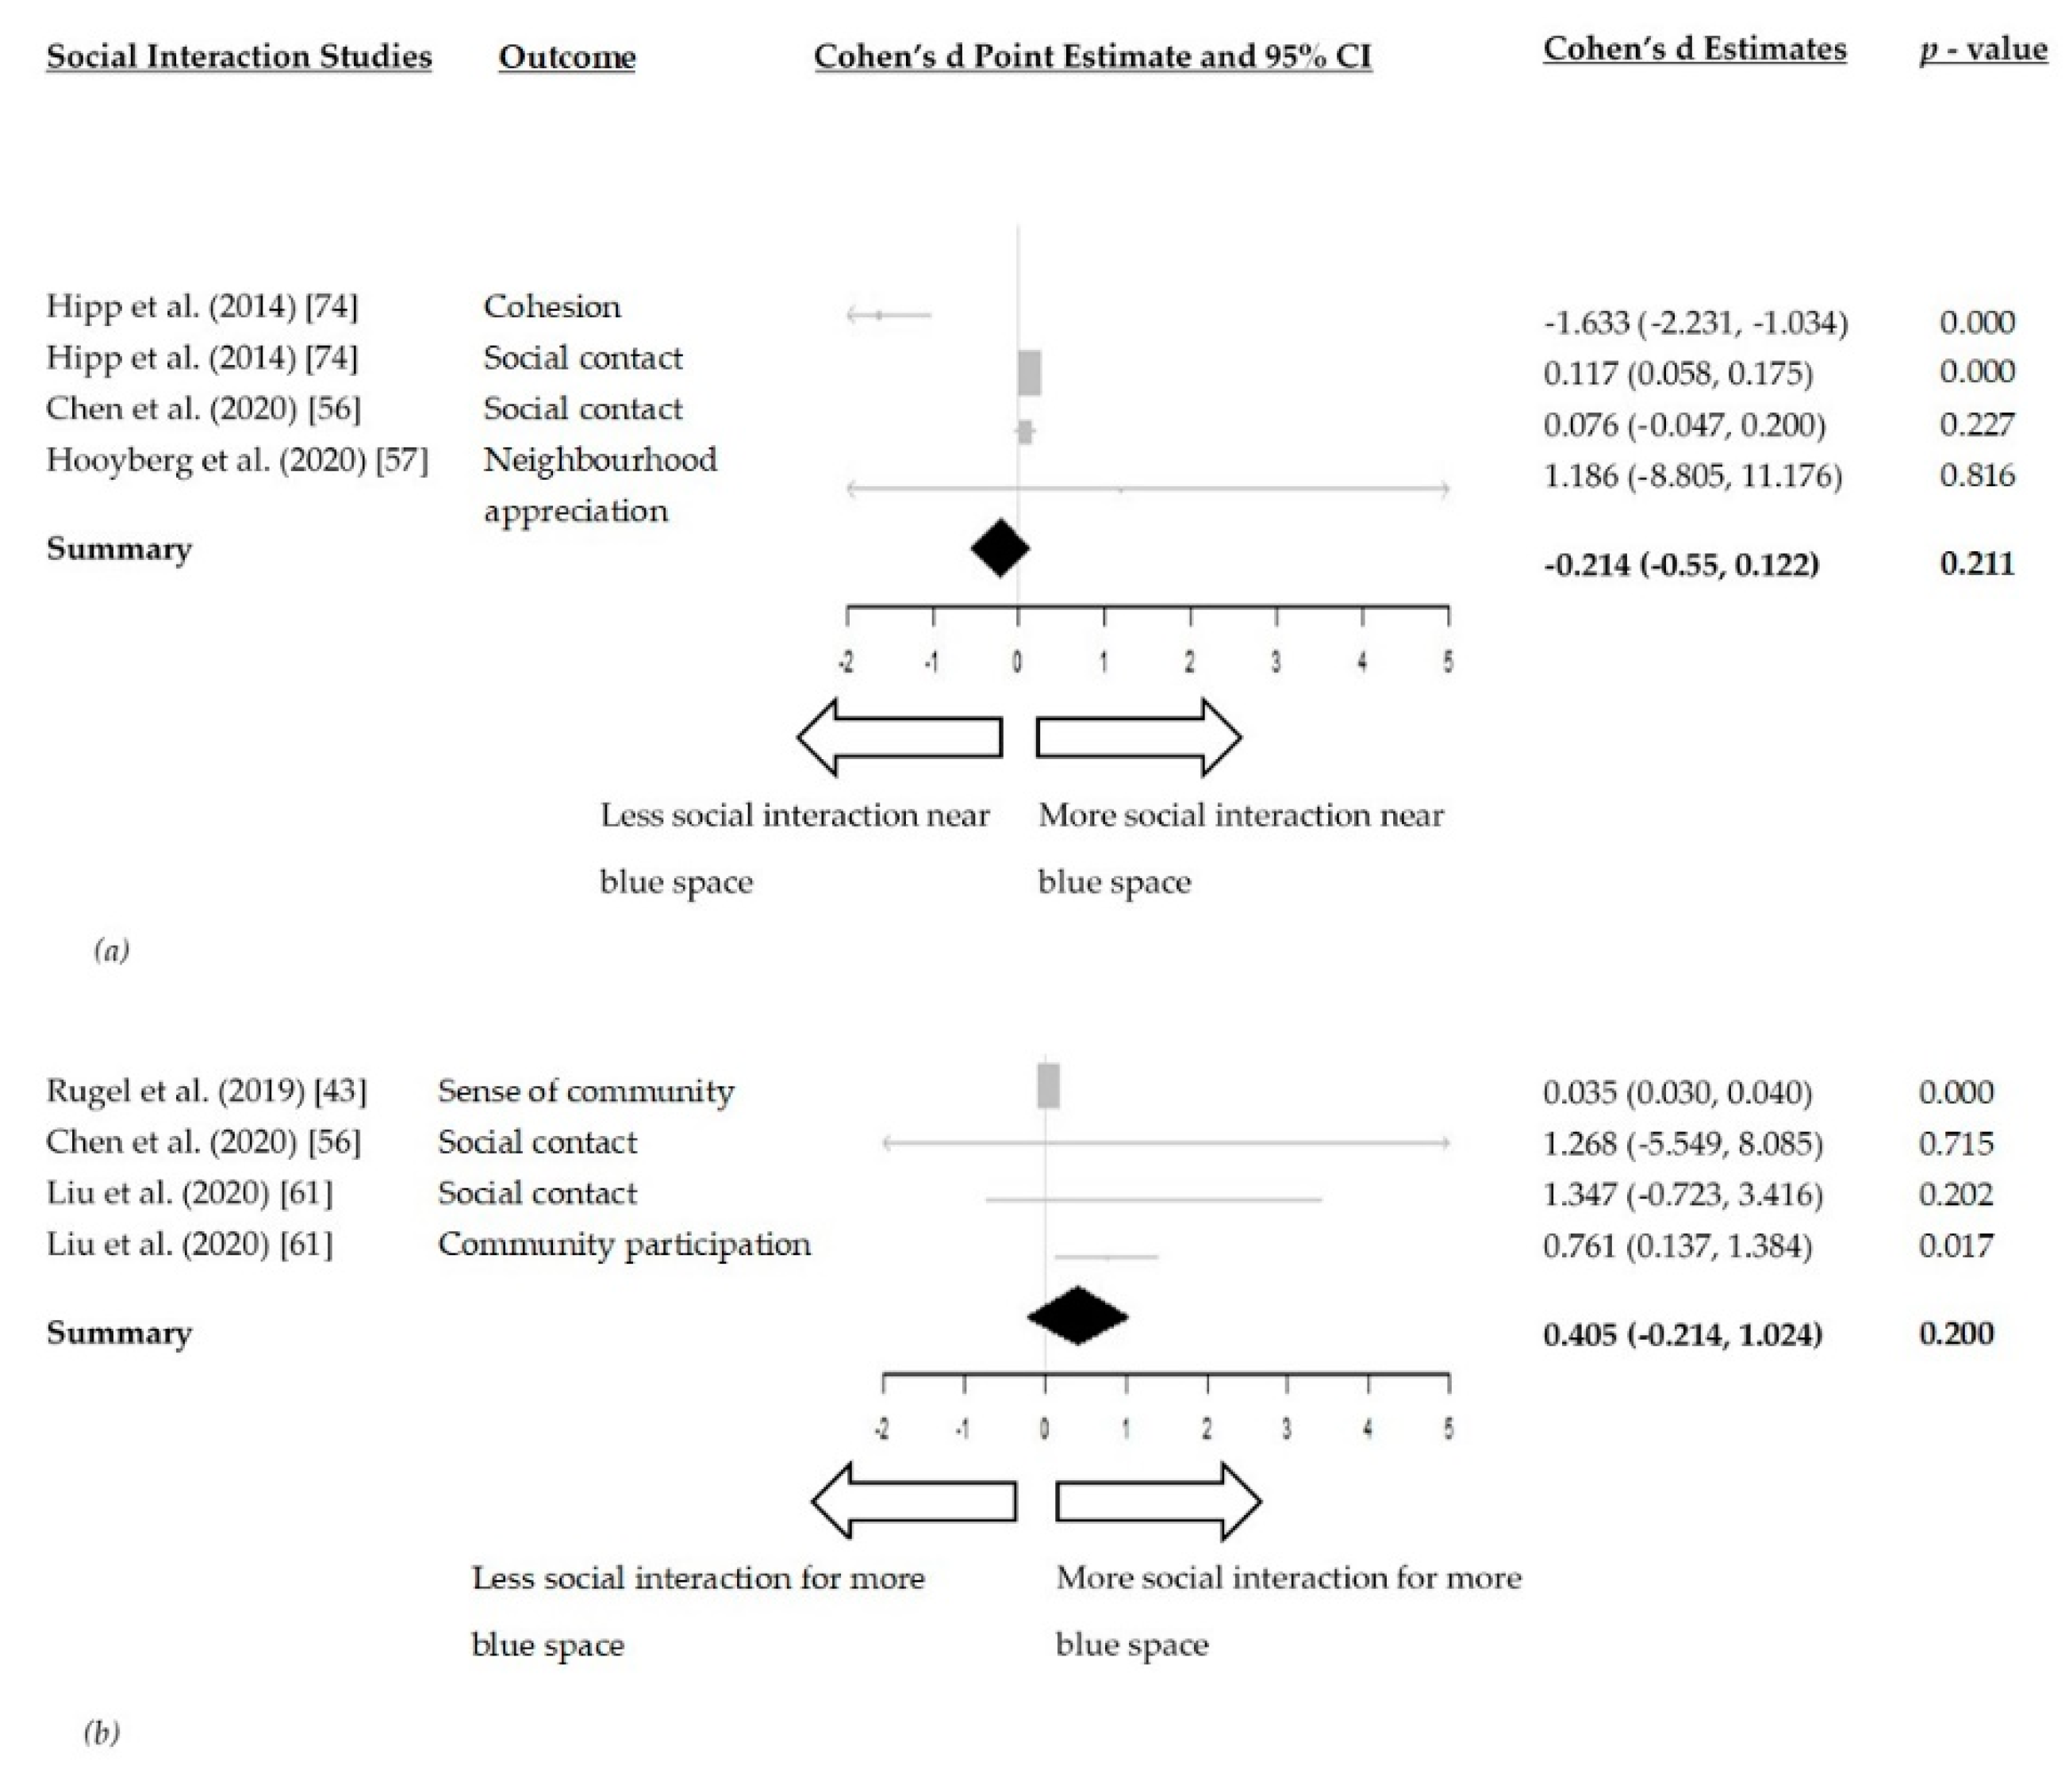
The meta-analysis between distance to blue space and social interaction included three studies [56,57,73]. In the random-effects model, living closer to blue space was not associated with higher levels of social interaction (Cohen d = −0.214, 95% CI: −0.55, 0.122, I2 = 90.81%) (Figure 5a).
Figure 5.
(a) Forest plot of the relationship between distance to blue space and social interaction; (b) Forest plot of the relationship between amount of blue space within a geographical area and social interaction.
The meta-analysis of the effect of the amount of blue space within a geographical area and social interaction included three studies [43,56,61]. The amount of blue space within a geographical area was not associated with higher levels of social interaction (Cohen d = 0.405, 95% CI: −0.214, 1.024, I2 = 56.41%) (Figure 5b).
3.5. Environmental Factors
3.5.1. General Description
Environmental factors were found to be associated with the presence of blue spaces in 14 articles [48,49,50,51,52,53,54,56,57,64,65,68,74,76]. Generally, the presence of blue space in a geographical area was found to positively affect environmental factors, such as lower heat stress index, decreased land surface temperature, higher self-perceived ecological quality of an area and improved air quality mainly through PM2.5 concentrations. Negative effects of blue space presence on environmental factors were found in two studies, regarding increased anthrophony or reduced biophony in a park area [50], increased disease transmission in a developing country context [52] and increased air pollution (PM10) due to river dust [76].
Five articles found a positive effect of blue spaces on temperature [48,49,53,64,65], four articles found a beneficial effect of blue space presence on air quality through lower PM2.5 concentrations [56,57,68,74], two articles presented a positive effect of blue space presence on ecological quality [51,54], one article found an association between increased disease transmission and blue space proximity [52], one article presented increased anthrophony and decreased biophony near a park area [50] and one article found negative effects of blue space on air quality due to increased river dust [76]. Several measures of environmental factors were obtained for each of the environmental factors. Specifically, temperature changes were approached through land surface temperature measurements by Burkart et al. [48] and Wu et al. [65]. Klok et al. [49] operationalised temperature through physiological equivalent temperature, while Saaroni and Ziv [53] used the heat stress index. Another measure of temperature, namely thermal sensation vote, was used by Lehnert et al. [64]. Air quality improvements were described by lower PM2.5 concentrations by Liu et al. [74] and McNabola, Broderick and Gill [68]. Chen et al. [56] approached air pollution through an air quality index obtained from annual data for Guangzhou, China, in 2018. Miró et al. [51] operationalised ecological quality by species richness, while Smith and Moore [54] used self–perceived ecological quality. Environmental noise was measured through anthrophony and biophony by Kuehne, Padgham and Olden [50] and disease transmission was approached through parasitaemia due to increased rainfall and closer proximity to blue spaces in the article by Raso et al. [52]. The negative impact of blue space on air quality through river dust was approached through PM10 air pollution by Chen et al. [76], while the same measure (PM10 air pollution) showed positive effects in a study by Hooyberg et al. [57]. Data were not sufficient for a meta-analysis to be conducted.
3.5.2. Quality Assessment
Overall, the 14 articles presenting an association between blue space presence and environmental factors were judged as of good quality with an average quality score of 80.43%. The main reasons for lower quality scores were insufficient details in the presentation of results, lack of confounding variables and reported statistics, complex study design and lack of a detailed justification of the methods. Quality scores are provided in Supplementary File/Table S4.
4. Discussion
This review aimed to synthesise the existing evidence about the mechanisms that mediate the impact of blue space on health, specifically physical activity, restoration, social interaction and environmental factors, and quantify these pathways. Fifty studies were included in our systematic review, of which 27 studies provided data for meta-analyses.
Overall, there was evidence to indicate that blue space increases physical activity, enhances restoration and improves environmental factors. Blue space may also have a beneficial effect on social interaction, but the evidence was mixed and further research is needed on this hypothesised pathway. Thus, three of the four hypothesised pathways (physical activity, restoration, environmental factors) are supported by empirical evidence, while findings for social interaction are inconclusive.
Interestingly, the beneficial effects of blue space on physical activity were almost equally obtained through a shorter distance of someone’s residence to blue space (Cohen d = 0.122, 95% CI: 0.065, 0.179) and a greater amount of blue space around a geographical area (Cohen d = 0.144, 95% CI: 0.024, 0.264). Empirical evidence, therefore, suggests that the development of blue space within shorter distances to residences and increasing the amount of blue space within neighbourhoods could significantly benefit health through the mediating pathway of physical activity.
Our meta-analyses indicated that the blue space benefits on restoration where mainly acquired through a higher amount of blue space within a geographical area (Cohen d = 0.339, 95% CI: 0.072, 0.606), compared to increased contact with blue space (Cohen d = 0.191, 95% CI: 0.084, 0.298). Intriguingly, the increase of amount of blue space within a geographical area was found to be the highest among all mediating pathways and exposures. This evidence, therefore, suggests that developing more blue spaces within neighbourhoods could primarily benefit the restorative character of an area. Living closer to blue space was not found to significantly affect restoration (Cohen d = 0.123, 95% CI: −0.037, 0.284). While urbanicity has been found to increase mental disorders through social stress [82], we propose that creating more blue spaces and promoting contact with them can be used to reverse this effect and ameliorate urban living. The aesthetic nature of blue space may also contribute to its beneficial effects on restoration [10].
Our systematic review suggests that several environmental phenomena, such as heat stress and low air quality can benefit from the development of blue space in urban settings. The evidence base was small, heterogeneous in terms of environmental definitions and measures (precluding a meta-analysis) and mainly focused on heat-related and air quality effects. The beneficial effect of blue space on other environmental factors, such as environmental noise, ecological quality and biodiversity, was insufficiently investigated. A better understanding of blue space effects on environmental factors is necessary for it to be used towards microclimate regulation and therefore further research is conducted around this mediating pathway.
Research around the relationship between blue space and social interaction is still in its infancy and evidence was mixed. Our systematic review, therefore, presented contrasting evidence for this mediating pathway. Our meta-analyses did not find significant beneficial effects of living closer to blue space (Cohen d = −0.214, 95% CI: −0.55, 0.122) or having more blue space within a geographical area (Cohen d = 0.405, 95% CI: −0.214, 1.024) on social interaction.
Findings of this systematic review and meta-analysis are consistent with the existing literature on the salutogenic benefits of blue spaces [8,15,83]. Our review compliments the existing literature by taking a more in-depth look at the mechanisms and mediating pathways between blue space and health. Our findings are also consistent with reported green space benefits, such as increased physical activity [84], increased restoration (e.g., through lower stress levels) [85,86] and improved environmental factors (heat stress) [87]. We therefore suggest that blue space can act as an equally beneficial asset in urban settings, compared to green space, and should be given more attention in future research.
Having reviewed the empirical evidence on the beneficial effect of blue space on the four hypothesised pathways, we suggest that future research should focus on clarifying which particular blue space features have the strongest effect on each mediating pathway. Simultaneously, there is a clear need for more and higher quality research around the effect of blue space on social interaction; research on this lacked consistency and results were found to be inconclusive. This review further highlighted that most studies on the relationship between blue space and environmental factors lacked comparability in terms of outcome measures and failed to account for key confounding factors. Our review highlights the inclusion of more confounding variables in environmental health research, a better definition of blue space elements and the adoption of widely used measures. This is in line with recommendations for future research by Yu et al. [88], who highlighted the complexity and uncertainties of the relationship between blue space and temperature variations. Finally, the majority of included studies were cross–sectional, highlighting the need for more longitudinal research to allow for causality estimation.
4.1. Strength and Limitations
This was a comprehensive review evaluating 50 studies. Our review followed the PRISMA guidelines and had a published protocol. It has also followed guidelines for the composition of systematic reviews in research [21]. The abstract and full-text screening was conducted by independent reviewers. The inclusiveness and design of this review can therefore be considered of high quality.
Interestingly, the search for our systematic review indicated that frequently water bodies are included in existing green spaces categories. Blue spaces are often not separated from green spaces, and simply treated as a category of green spaces. For instance, in a study by Sikorska et al. [89], water bodies were one of the types which could guarantee improved access to urban green spaces but they were treated as one of the categories of greenery. Thus, effect sizes for blue spaces might have been underestimated.
As in the case of green spaces [90], accessibility and availability barriers play a significant role in the use of blue spaces. Thus, measures of exposure to blue space, such as distance to blue space or amount of blue space, reflect presence of blue space but do not entirely explain real time of effective engagement with them. This is therefore another limitation of this study and further research should be conducted on the effect of accessibility barriers of blue spaces.
High heterogeneity was found in six of our seven meta-analyses conducted for distance to blue space and physical activity, amount of blue space and physical activity, amount of blue space and restoration, distance to blue space and restoration, contact with blue space and restoration and distance to blue space and social interaction. Their I2s ranged between 79.50% and 99.49%. The meta-analysis between amount of blue space and social interaction had a comparatively lower I2 of 56.41%. Potential sources of heterogeneity were the wide range of physical activity and restoration indicators used, differences between study designs and the lack of universal measures of blue space exposure. Thus, high heterogeneity should be expected in this type of research. Results of meta-analyses with high heterogeneity should be considered with caution [91]. It is likely that effect size might have been underestimated.
4.2. Quality Assessment
The overall quality of the articles included in this review was judged to be very good, as no mediating/causal pathway had an average article quality lower than 70%. These quality ratings show promise for research in this sector, as studies have been well-designed.
4.3. Study Design
The majority of the articles included in this review had a cross-sectional design (70.00%), followed by longitudinal (14.00%) and cross-over (8.00%) studies. This, together with the recognition that blue space effects are not immediate, but develop over time, may explain why relationships found in our meta-analyses are weak. According to Rindfleisch et al. [92], a longitudinal study design is more appropriate when looking at events or variables with a clear temporal nature. This may be the case of blue space effects and more longitudinal studies are therefore necessary in the future.
4.4. Blue Space Exposure
Articles included in this review measured exposure to blue space in several ways, which subsequently created compatibility difficulties between articles for our meta-analyses to be conducted. As explained above, the lack of universal measures of blue space exposure led to high heterogeneity in all three meta-analyses. Seventeen different measures of blue space exposure were used in the existing literature, namely 100 m, 300 m and 500 m buffers around residencies, coastal proximity of residencies, access to parks/blue space, the proportion of visible water surfaces, frequency of use using GPS devices, road network access/distance, 1 km circular buffers around residencies, GPS mapping of people’s activities near water, self–assessed distance to blue space, self–assessed use of blue space over time, proportion of blue space per municipality using GIS technology, 5 km buffer around schools, proportion of postcode occupied by blue space, self—assessed visual exposure and participation in activities around blue space, distance of blue space to a neighbourhood, self-perceived distance to blue space, normalised difference water index (NDWI), ratio of “blueness” in street view images, minimal distance to water body and polygons using satellite imaging. As a result, a meta-analysis for each health mediator could not be performed, as very few articles shared the same definition or measurement of blue space exposure. An internationally recognised definition and measurement tool for blue space exposure would improve comparability and allow for quantification and calculation of aggregate effects.
4.5. Measuring Impact on Health Mediators
Articles related to physical activity used 13 different assessment methods, namely moderate to vigorous physical activity (MVPA), light physical activity (LPA), self-assessed time spent exercising around a blue space per day, self-perceived time spent being active, jogging, recreational walking, watersports, on–land physical activity within 5 km of a blue space, times of walking to work per week, walking more or less than 300 min within a 6.6 km distance to blue space, meeting of physical activity guidelines, health-enhancing energy expenditure per week and percentage of physically active neighbours.
Restoration studies mostly used subjective measures, while few studies had more experimental methods. There were 23 different restoration indicators; self-assessed stress, self–assessed attention restoration, self-assessed mental wellbeing, GHQ-12 scores, SF-36 scores, PHQ-9 scores, self–assessed restorative quality, self–reported history of depression, self-reported events of positive/negative mood, self-reported psychological distress, K10 scores, anxiety or mood disorder, history of major depressive disorder, history of use of antidepressants, visits to mental health specialists, stress measurements with EEG devices, self-perceived life satisfaction, WHO-5 wellbeing index, state physical appearance, state body shape, state weight satisfaction, recalled wellbeing and number of self-reported happy moments among children.
Articles looking at social interaction used seven different measures, namely self–reported number of visits of blue space with friends, self–reported familiarity with neighbourhood, self–reported sense of neighbouring, self–perceived attachment to neighbourhood, self-reported community participation, self-perceived social appreciation and self –perceived cohesion of neighbourhood. Interestingly, all social interaction measures were self–reported, which might include some personal predisposition and therefore bias. It is as a result, needed for a more neutral tool for social interaction to be established and adopted in future research.
Considerable variability was also found in measures of environmental factors as relevant articles used six different environmental measures; air quality (PM2.5), humidity, heat stress index, ecological quality, noise and land surface temperature. Given the nature of the field, no measure was self–reported and all measures were taken using electronic devices or GIS tools. This provides us with robust measurements and any bias should be attributed to malfunction of sensors or range issues.
This prominent variability of tools/types within health mediators led to a high degree of methodological heterogeneity in our meta–analyses. On the other hand, the large number of several physical activity, restoration, social interaction measures, as well as environmental factors, prove the complexity of the field and the need for more multidisciplinary research and cooperation.
4.6. Blue Space Types
Blue space benefits and use are not equally distributed among people of different age and socio-economic status [46]. Issues of equality may also exist between different types and quality of blue space. Indeed, among the 50 articles included in this review, only eight looked at a particular blue space type or considered blue space properties, such as size, length or position. Specifically, Pearson et al. [42] found that Great Lakes had a larger and positive effect on anxiety/mood disorder hospitalisations than inland lakes. Furthermore, Hipp et al. [73] found that increasing the length of a river had a negative effect on neighbouring, neighbourhood attachment and neighbourhood cohesion. Looking at three blue spaces with different urbanisation levels (low, medium, high), the location of a blue space was considered by Liu et al. [74]. Interestingly, they found that dry disposition was higher at a greater urbanisation level, which further supports the notion that blue space should be a priority for urban planners especially in metropolitan cities. Miró et al. [51] looked at sustainable drainage systems (SuDS) and suggested that SuDS created as ponds offer a higher ecological quality than SuDS created as swales or detention basins. This finding is a logical continuation of Grizzetti et al. [93] that highlight the positive relationship between the ecological condition and potential recreational capacity of aquatic environments. The temperature changes of a certain pond in Israel at different times and sides were investigated by Saaroni and Ziv [53]. They found that downwind sides of the pond had significantly lower temperatures, lower heat stress index and more relative humidity than upwind sides [53]. This suggests that specific weather features should be considered when deciding on the location of new urban blue spaces. Lehnert et al. [64] looked at fountains, finding a beneficial effect on thermal sensation vote. Respectively, the positive effect of two courtyard pools was investigated by Amirbeiki et al. [63], reporting a beneficial effect on students’ pleasantness, refreshment and relaxation. The negative effects of two specific rivers on air quality through river dust were examined by Chen et al. [76], finding that, based on the position of the rivers, weak northeast monsoons cause the highest health risk in the area.
This review found a small proportion (16.00%) of articles looking at specific blue features. The amount of knowledge derived from the above eight articles looking at specific blue space features highlights the need for more research in this area and emphasises the need to consider blue space independently from other outdoor environments.
4.7. Confounders
The confounding effects of variables such as age, gender, socio-economic status and education were considered in most of the studies included in this review. Indeed, several articles have highlighted the fact that blue space use is dependent on age, with potential differences between children and adults in their interactions with blue space [33,40]. De Bell et al. [46] found that women appreciated nature more than men. People with better education were more likely to access blue spaces, while those with lower income faced issues of blue space access or availability [94]. It follows that the indirect impact of age, gender, socio-economic status and education should continue to be considered in future research. Other confounding factors, including average time spent at home a day, presence of chronic disease, body mass index (BMI), ownership of dog and energy expenditure at work, were considered in some of the articles included in this review (Table 1).
4.8. Comparison to Existing Literature
To our knowledge, two other systematic reviews and a narrative overview have been conducted around the salutogenic effect of blue space [8,15,83]. The systematic review by Gascon et al. [8] explored the relationship between outdoor blue spaces, health and wellbeing. They included 35 studies and found that higher levels of exposure to outdoor blue spaces were associated with better health and wellbeing, while they also highlighted the need for more longitudinal studies in future research [8]. Kabisch, van den Bosch and Lafortezza [83] explored the effects of green and blue spaces on health, among children and the elderly. Compared to the aforementioned systematic review, these authors included fewer studies in their systematic review (27 studies). They found a positive trend in the relationship between green and blue spaces and health, but results appeared inconclusive, lacked consistency and depended on socio-economic factors [83]. Within their research, green and blue spaces were combined under the umbrella term ‘nature-based solutions’, and so the health impacts of blue spaces were not considered independently. The narrative overview by White et al. [15] explored the potential benefits of blue space on both human and planetary health and wellbeing through mediating pathways, such as physical activity levels, urban temperature variations, social relations and stress. They developed a framework highlighting the existence of the mediating pathways used in our systematic review and meta-analysis.
Our review looked deeper into the relationships between blue space and health, including only articles with blue space as an independent environment. This review explored the effect of blue space on the health “mediators”, such as physical activity, restoration, social interaction and environmental factors. To our knowledge, no other systematic review has looked at health mediators, and this review can therefore be considered a logical continuation of the existing narrative overview by White et al. [15] and systematic reviews by Gascon et al. [8] and Kabisch, van den Bosch and Lafortezza [83].
5. Conclusions
This systematic review and meta-analysis has summarised and quantified evidence about mechanisms of the salutogenic effect of blue space on health. We found empirical evidence to support three hypothesised pathways. Blue spaces promote physical activity and increase restoration. They also improve environmental factors, however more research is necessary for meta-analyses to be conducted on this third mediating pathway. The evidence about the role of social interaction is ambiguous. Findings for blue spaces are consistent with reported green space benefits. Considering that most cities in the world are built around blue spaces such as coasts, lakes and rivers, blue spaces are potentially valuable public health assets, which may help reduce the health risk factors associated with increased urbanisation.
Supplementary Materials
The following are available online at https://www.mdpi.com/1660-4601/18/5/2486/s1, Table S1: Search keywords; Table S2: Search strings; Table S3: Inclusion/Exclusion criteria; Table S4: Quality scores.
Author Contributions
Contributions to this manuscript are as follows: conceptualisation, M.G. and S.C.; methodology, M.G. and S.C.; screening, M.G., S.C., Z.T., N.S., meta-analysis, S.C. and G.M., writing—original draft preparation, M.G.; writing—review and editing, M.G., S.C., Z.T., N.S. and G.M. All authors have read and agreed to the published version of the manuscript.
Funding
There are no sources of funding to declare.
Institutional Review Board Statement
Not applicable.
Informed Consent Statement
Not applicable.
Data Availability Statement
The data that support the findings of this study are available from the corresponding author, upon request.
Conflicts of Interest
The authors declare no conflict of interest.
References
- United Nations World Urbanization Prospects: The 2018 Revision. 2018. Available online: https://population.un.org/wup/ (accessed on 25 February 2021).
- Izakovičová, Z.; Mederly, P.; Petrovič, F. Long-term land use changes driven by urbanisation and their environmental effects (example of Trnava City, Slovakia). Sustainability 2017, 9, 1553. [Google Scholar] [CrossRef] [Scilit]
- O’Reilly, G.; O’Reilly, D.; Rosato, M.; Connolly, S. Urban and rural variations in morbidity and mortality in Northern Ireland. BMC Public Health 2007, 7, 123. [Google Scholar] [CrossRef] [Scilit]
- Gruebner, O.; Rapp, M.A.; Adli, M.; Kluge, U.; Galea, S.; Heinz, A. Cities and mental health. Dtsch. Arztebl. Int. 2017, 114, 121–127. [Google Scholar] [CrossRef] [Scilit]
- Trivedi, J.; Sareen, H.; Dhyani, M. Rapid urbanization—Its impact on mental health: A South Asian perspective. Indian J. Psychiatry 2008, 50, 161. [Google Scholar] [CrossRef] [Scilit] [PubMed]
- Twohig-Bennett, C.; Jones, A. The health benefits of the great outdoors: A systematic review and meta-analysis of greenspace exposure and health outcomes. Environ. Res. 2018, 166, 628–637. [Google Scholar] [CrossRef] [Scilit]
- Britton, E.; Kindermann, G.; Domegan, C.; Carlin, C. Blue care: A systematic review of blue space interventions for health and wellbeing. Health Promot. Int. 2020, 35, 50–69. [Google Scholar] [CrossRef] [Scilit]
- Gascon, M.; Zijlema, W.; Vert, C.; White, M.P.; Nieuwenhuijsen, M.J. Outdoor blue spaces, human health and well-being: A systematic review of quantitative studies. Int. J. Hyg. Environ. Health 2017, 220, 1207–1221. [Google Scholar] [CrossRef] [Scilit] [PubMed]
- Smith, N.; Chastin, S.; Tieges, Z.; Webb, S.; Georgiou, M.; King, A. A systematic literature review and meta-analysis of quantitative studies on the impact of urban blue space on human health. Cities 2020. in review. [Google Scholar]
- Völker, S.; Kistemann, T. The impact of blue space on human health and well-being—Salutogenetic health effects of inland surface waters: A review. Int. J. Hyg. Environ. Health 2011, 214, 449–460. [Google Scholar] [CrossRef] [Scilit]
- Grellier, J.; White, M.P.; Albin, M.; Bell, S.; Elliott, L.R.; Gascón, M.; Gualdi, S.; Mancini, L.; Wolf, T.; Wuijts, S.; et al. BlueHealth: A study programme protocol for mapping and quantifying the potential benefits to public health and well-being from Europe’s blue spaces. BMJ Open 2017, 7, 16188. [Google Scholar] [CrossRef] [Scilit] [PubMed]
- Tieges, Z.; Mcgregor, D.; Georgiou, M.; Smith, N.; Saunders, J.; Millar, R.; Morison, G.; Chastin, S. The Impact of Regeneration and Climate Adaptations of Urban Green – Blue Assets on All-Cause Mortality: A 17-Year Longitudinal Study. Int. J. Environ. Res. Public Health 2020, 17, 4577. [Google Scholar] [CrossRef] [Scilit] [PubMed]
- Manteghi, G.; Bin Limit, H.; Remaz, D. Water bodies an urban microclimate: A review. Mod. Appl. Sci. 2015, 9, 1–12. [Google Scholar] [CrossRef] [Scilit]
- World Health Organization. Global Recommendations on Physical Activity for Health; World Health Organization: Geneva, Switzerland, 2010; p. 60. [Google Scholar]
- White, M.P.; Elliott, L.R.; Gascon, M.; Roberts, B.; Fleming, L.E. Blue space, health and well-being: A narrative overview and synthesis of potential benefits. Environ. Res. 2020, 191, 110169. [Google Scholar] [CrossRef] [Scilit] [PubMed]
- Steptoe, A.; Kivimäki, M. Stress and cardiovascular disease. Nat. Rev. Cardiol. 2012, 9, 360–370. [Google Scholar] [PubMed]
- Kubzansky, L.D.; Huffman, J.C.; Boehm, J.K.; Hernandez, R.; Kim, E.S.; Koga, H.K.; Feig, E.H.; Lloyd-Jones, D.M.; Seligman, M.E.P.; Labarthe, D.R. Positive Psychological Well-Being and Cardiovascular Disease: JACC Health Promotion Series. J. Am. Coll. Cardiol. 2018, 72, 1382–1396. [Google Scholar] [CrossRef] [Scilit]
- Gunawardena, K.R.; Wells, M.J.; Kershaw, T. Utilising green and bluespace to mitigate urban heat island intensity. Sci. Total Environ. 2017, 584–585, 1040–1055. [Google Scholar] [CrossRef] [Scilit]
- Umberson, D.; Karas Montez, J. Social Relationships and Health: A Flashpoint for Health Policy. J. Health Soc. Behav. 2010, 51, S54–S66. [Google Scholar] [CrossRef] [Scilit]
- Liberati, A.; Altman, D.G.; Tetzlaff, J.; Mulrow, C.; Gøtzsche, P.C.; Ioannidis, J.P.A.; Clarke, M.; Devereaux, P.J.; Kleijnen, J.; Moher, D. The PRISMA statement for reporting systematic reviews and meta-analyses of studies that evaluate health care interventions: Explanation and elaboration. J. Clin. Epidemiol. 2009, 62, e1–e34. [Google Scholar] [PubMed]
- Wilson, L.; Robinson, K. 005 Clinical Practice Guidelines and Systematic Reviews: Point of Intersection? BMJ Qual. Saf. 2013, 22, A13. [Google Scholar] [CrossRef] [Scilit]
- Ouzzani, M.; Hammady, H.; Fedorowicz, Z.; Elmagarmid, A. Rayyan-a web and mobile app for systematic reviews. Syst. Rev. 2016, 5, 1–10. [Google Scholar] [CrossRef] [Scilit]
- Kmet, L.M.; Cook, L.S.; Lee, R.C. Standard Quality Assessment Criteria for Evaluating Primary Research Papers from a Variety of Fields; Education and Research Archive: Edmonton, AB, Canada, 2004. [Google Scholar]
- Chastin, S.F.M.; De Craemer, M.; De Cocker, K.; Powell, L.; Van Cauwenberg, J.; Dall, P.; Hamer, M.; Stamatakis, E. How does light-intensity physical activity associate with adult cardiometabolic health and mortality? Systematic review with meta-analysis of experimental and observational studies. Br. J. Sports Med. 2019, 53, 370–376. [Google Scholar]
- Borenstein, M.; Hedges, L.V.; Higgins, J.P.T.; Rothstein, H.R. Introduction to Meta-Analysis; John Wiley & Sons: Hoboken, NJ, USA, 2009; ISBN 9780470057247. [Google Scholar]
- Chinn, S. A simple method for converting an odds ratio to effect size for use in meta-analysis. Stat. Med. 2000, 19, 3127–3131. [Google Scholar] [CrossRef]
- Sullivan, G.M.; Feinn, R. Using Effect Size—or Why the P Value Is Not Enough. J. Grad. Med. Educ. 2012, 4, 279–282. [Google Scholar] [CrossRef] [Scilit]
- Garrett, J.K.; White, M.P.; Elliott, L.R.; Wheeler, B.W.; Fleming, L.E. Urban nature and physical activity: Investigating associations using self-reported and accelerometer data and the role of household income. Environ. Res. 2020, 190, 109899. [Google Scholar] [CrossRef] [Scilit]
- Higgins, J.P.T.; Thompson, S.G.; Deeks, J.J.; Altman, D.G. Measuring inconsistency in meta-analyses. Br. Med. J. 2003, 327, 557–560. [Google Scholar] [CrossRef] [Scilit]
- Borenstein, M.; Hedges, L.; Higgins, J.; Rothstein, H. Comprehensive Meta Analysis; Version 3.0; Biostatistics: Seattle, WA, USA, 2013. [Google Scholar]
- Arbillaga-Etxarri, A.; Gimeno-Santos, E.; Barberan-Garcia, A.; Benet, M.; Borrell, E.; Dadvand, P.; Foraster, M.; Marín, A.; Monteagudo, M.; Rodriguez-Roisin, R.; et al. Socio-environmental correlates of physical activity in patients with chronic obstructive pulmonary disease (COPD). Thorax 2017, 72, 796–802. [Google Scholar] [CrossRef] [Scilit]
- Jansen, F.M.; Van Kollenburg, G.H.; Kamphuis, C.B.M.; Pierik, F.H.; Ettema, D.F. Hour-by-hour physical activity patterns of adults aged 45–65 years: A cross-sectional study. J. Public Health 2018, 40, 787–796. [Google Scholar] [CrossRef] [Scilit]
- Grow, H.M.; Saelens, B.E.; Kerr, J.; Durant, N.H.; Norman, G.J.; Sallis, J.F. Where are youth active? Roles of proximity, active transport, and built environment. Med. Sci. Sports Exerc. 2008, 40, 2071–2079. [Google Scholar] [CrossRef] [Scilit]
- Jansen, F.M.; Ettema, D.F.; Kamphuis, C.B.M.; Pierik, F.H.; Dijst, M.J. How do type and size of natural environments relate to physical activity behavior? Health Place 2017, 46, 73–81. [Google Scholar] [CrossRef] [Scilit]
- Pasanen, T.P.; White, M.P.; Wheeler, B.W.; Garrett, J.K.; Elliott, L.R. Neighbourhood blue space, health and wellbeing: The mediating role of different types of physical activity. Environ. Int. 2019, 131, 105016. [Google Scholar] [CrossRef] [Scilit]
- Völker, S.; Heiler, A.; Pollmann, T.; Claßen, T.; Hornberg, C.; Kistemann, T. Do perceived walking distance to and use of urban blue spaces affect self-reported physical and mental health? Urban For. Urban Green. 2018, 29, 1–9. [Google Scholar] [CrossRef] [Scilit]
- Wilson, L.A.M.; Giles-Corti, B.; Burton, N.W.; Giskes, K.; Haynes, M.; Turrell, G. The association between objectively measured neighborhood features and walking in middle-aged adults. Am. J. Health Promot. 2011, 25, 12–22. [Google Scholar] [CrossRef] [Scilit]
- Ying, Z.; Ning, L.D.; Xin, L. Relationship between built environment, physical activity, adiposity, and health in adults aged 46–80 in Shanghai, China. J. Phys. Act. Health 2015, 12, 569–578. [Google Scholar] [CrossRef] [Scilit]
- Gascon, M.; Sánchez-Benavides, G.; Dadvand, P.; Martínez, D.; Gramunt, N.; Gotsens, X.; Cirach, M.; Vert, C.; Molinuevo, J.L.; Crous-Bou, M.; et al. Long-term exposure to residential green and blue spaces and anxiety and depression in adults: A cross-sectional study. Environ. Res. 2018, 162, 231–239. [Google Scholar] [CrossRef] [Scilit]
- Huynh, Q.; Craig, W.; Janssen, I.; Pickett, W. Exposure to public natural space as a protective factor for emotional well-being among young people in Canada. BMC Public Health 2013, 13. [Google Scholar] [CrossRef] [Scilit]
- Nutsford, D.; Pearson, A.L.; Kingham, S.; Reitsma, F. Residential exposure to visible blue space (but not green space) associated with lower psychological distress in a capital city. Health Place 2016, 39, 70–78. [Google Scholar] [CrossRef] [Scilit] [PubMed]
- Pearson, A.L.; Shortridge, A.; Delamater, P.L.; Horton, T.H.; Dahlin, K.; Rzotkiewicz, A.; Marchiori, M.J. Effects of freshwater blue spaces may be beneficial for mental health: A first, ecological study in the North American Great Lakes region. PLoS ONE 2019, 14, e0221977. [Google Scholar] [CrossRef] [Scilit]
- Rugel, E.J.; Carpiano, R.M.; Henderson, S.B.; Brauer, M. Exposure to natural space, sense of community belonging, and adverse mental health outcomes across an urban region. Environ. Res. 2019, 171, 365–377. [Google Scholar] [CrossRef] [Scilit]
- De Vries, S.; ten Have, M.; van Dorsselaer, S.; van Wezep, M.; Hermans, T.; de Graaf, R. Local availability of green and blue space and prevalence of common mental disorders in the Netherlands. BJPsych Open 2016, 2, 366–372. [Google Scholar] [CrossRef] [Scilit]
- Triguero-Mas, M.; Dadvand, P.; Cirach, M.; Martínez, D.; Medina, A.; Mompart, A.; Basagaña, X.; Gražulevičiene, R.; Nieuwenhuijsen, M.J. Natural outdoor environments and mental and physical health: Relationships and mechanisms. Environ. Int. 2015, 77, 35–41. [Google Scholar] [CrossRef] [Scilit]
- De Bell, S.; Graham, H.; Jarvis, S.; White, P. The importance of nature in mediating social and psychological benefits associated with visits to freshwater blue space. Landsc. Urban Plan. 2017, 167, 118–127. [Google Scholar] [CrossRef] [Scilit]
- Haeffner, M.; Jackson-Smith, D.; Buchert, M.; Risley, J. “Blue” space accessibility and interactions: Socio-economic status, race, and urban waterways in Northern Utah. Landsc. Urban Plan. 2017, 167, 136–146. [Google Scholar] [CrossRef] [Scilit]
- Burkart, K.; Meier, F.; Schneider, A.; Breitner, S.; Canário, P.; Alcoforado, M.J. by Vegetation (Urban Green) and Proximity to Water (Urban Blue). Environ. Health Perspect. 2016, 124, 927–934. [Google Scholar] [CrossRef] [Scilit]
- Klok, L.; Rood, N.; Kluck, J.; Kleerekoper, L. Assessment of thermally comfortable urban spaces in Amsterdam during hot summer days. Int. J. Biometeorol. 2019, 63, 129–141. [Google Scholar] [CrossRef] [Scilit] [PubMed]
- Kuehne, L.M.; Padgham, B.L.; Olden, J.D. The Soundscapes of Lakes across an Urbanization Gradient. PLoS ONE 2013, 8, e55661. [Google Scholar] [CrossRef] [Scilit] [PubMed]
- Miró, A.; Hall, J.; Rae, M.; O’Brien, D. Links between ecological and human wealth in drainage ponds in a fast-expanding city, and proposals for design and management. Landsc. Urban Plan. 2018, 180, 93–102. [Google Scholar] [CrossRef] [Scilit]
- Raso, G.; Silué, K.D.; Vounatsou, P.; Singer, B.H.; Yapi, A.; Tanner, M.; Utzinger, J.; N’Goran, E.K. Spatial risk profiling of Plasmodium falciparum parasitaemia in a high endemicity area in Cte d’Ivoire. Malar. J. 2009, 8, 1–16. [Google Scholar] [CrossRef] [Scilit]
- Saaroni, H.; Ziv, B. The impact of a small lake on heat stress in a Mediterranean urban park: The case of Tel Aviv, Israel. Int. J. Biometeorol. 2003, 47, 156–165. [Google Scholar] [CrossRef] [Scilit]
- Smith, J.W.; Moore, R.L. Perceptions of community benefits from two wild and scenic rivers. Environ. Manag. 2011, 47, 814–827. [Google Scholar] [CrossRef] [Scilit]
- Roberts, H.; van Lissa, C.; Helbich, M. Perceived neighbourhood characteristics and depressive symptoms: Potential mediators and the moderating role of employment status. Soc. Sci. Med. 2021, 268, 113533. [Google Scholar] [CrossRef] [Scilit] [PubMed]
- Chen, Y.; Yuan, Y. The neighborhood effect of exposure to blue space on elderly individuals’ mental health: A case study in Guangzhou, China. Health Place 2020, 63, 102348. [Google Scholar] [CrossRef] [Scilit] [PubMed]
- Hooyberg, A.; Roose, H.; Grellier, J.; Elliott, L.R.; Lonneville, B.; White, M.P.; Michels, N.; De Henauw, S.; Vandegehuchte, M.; Everaert, G. General health and residential proximity to the coast in Belgium: Results from a cross-sectional health survey. Environ. Res. 2020, 184, 109225. [Google Scholar] [CrossRef] [Scilit] [PubMed]
- Tan, C.L.Y.; Chang, C.C.; Nghiem, L.T.P.; Zhang, Y.; Oh, R.R.Y.; Shanahan, D.F.; Lin, B.B.; Gaston, K.J.; Fuller, R.A.; Carrasco, L.R. The right mix: Residential urban green-blue space combinations are correlated with physical exercise in a tropical city-state. Urban For. Urban Green. 2021, 57, 126947. [Google Scholar] [CrossRef] [Scilit]
- Wang, Z.; Ettema, D.; Helbich, M. Objective environmental exposures correlate differently with recreational and transportation walking: A cross-sectional national study in the Netherlands. Environ. Res. 2020, 194, 110591. [Google Scholar] [CrossRef] [Scilit]
- Garrett, J.K.; White, M.P.; Huang, J.; Ng, S.; Hui, Z.; Leung, C.; Tse, L.A.; Fung, F.; Elliott, L.R.; Depledge, M.H.; et al. Urban blue space and health and wellbeing in Hong Kong: Results from a survey of older adults. Health Place 2019, 55, 100–110. [Google Scholar] [CrossRef] [Scilit]
- Liu, Y.; Wang, R.; Lu, Y.; Li, Z.; Chen, H.; Cao, M.; Zhang, Y.; Song, Y. Natural outdoor environment, neighbourhood social cohesion and mental health: Using multilevel structural equation modelling, streetscape and remote-sensing metrics. Urban For. Urban Green. 2020, 48, 126576. [Google Scholar] [CrossRef] [Scilit]
- Subiza-Pérez, M.; Vozmediano, L.; San Juan, C. Green and blue settings as providers of mental health ecosystem services: Comparing urban beaches and parks and building a predictive model of psychological restoration. Landsc. Urban Plan. 2020, 204, 103926. [Google Scholar] [CrossRef] [Scilit]
- Amirbeiki, F.; Ghasr, A.K. Investigating the Effects of Exposure to Natural Blue Elements on the Psychological Restoration of University Students. Int. J. Archit. Eng. Urban Plan 2020, 30, 1–10. [Google Scholar] [CrossRef] [Scilit]
- Lehnert, M.; Brabec, M.; Jurek, M.; Tokar, V.; Geletič, J. The role of blue and green infrastructure in thermal sensation in public urban areas: A case study of summer days in four Czech cities. Sustain. Cities Soc. 2021, 66, 102683. [Google Scholar] [CrossRef] [Scilit]
- Wu, C.; Li, J.; Wang, C.; Song, C.; Chen, Y.; Finka, M.; La Rosa, D. Understanding the relationship between urban blue infrastructure and land surface temperature. Sci. Total Environ. 2019, 694, 133742. [Google Scholar] [CrossRef] [Scilit]
- Triguero-Mas, M.; Donaire-Gonzalez, D.; Seto, E.; Valentín, A.; Martínez, D.; Smith, G.; Hurst, G.; Carrasco-Turigas, G.; Masterson, D.; van den Berg, M.; et al. Natural outdoor environments and mental health: Stress as a possible mechanism. Environ. Res. 2017, 159, 629–638. [Google Scholar] [CrossRef] [Scilit]
- Reeves, J.P.; Knight, A.T.; Strong, E.A.; Heng, V.; Neale, C.; Cromie, R.; Vercammen, A. The application of wearable technology to quantify health and wellbeing co-benefits from urban wetlands. Front. Psychol. 2019, 10, 1–16. [Google Scholar] [CrossRef] [Scilit] [PubMed]
- McNabola, A.; Broderick, B.M.; Gill, L.W. Reduced exposure to air pollution on the boardwalk in Dublin, Ireland. Measurement and prediction. Environ. Int. 2008, 34, 86–93. [Google Scholar] [CrossRef] [Scilit] [PubMed]
- Vert, C.; Gascon, M.; Ranzani, O.; Márquez, S.; Triguero-Mas, M.; Carrasco-Turigas, G.; Arjona, L.; Koch, S.; Llopis, M.; Donaire-Gonzalez, D.; et al. Physical and mental health effects of repeated short walks in a blue space environment: A randomised crossover study. Environ. Res. 2020, 188, 109812. [Google Scholar] [CrossRef] [Scilit] [PubMed]
- Zhou, P.; Grady, S.C.; Chen, G. How the built environment affects change in older people’s physical activity: A mixed- methods approach using longitudinal health survey data in urban China. Soc. Sci. Med. 2017, 192, 74–84. [Google Scholar] [CrossRef] [Scilit] [PubMed]
- Arnberger, A.; Eder, R.; Allex, B.; Ebenberger, M.; Hutter, H.P.; Wallner, P.; Bauer, N.; Zaller, J.G.; Frank, T. Health-related effects of short stays at mountain meadows, a river and an urban site—Results from a field experiment. Int. J. Environ. Res. Public Health 2018, 15, 2647. [Google Scholar] [CrossRef] [Scilit]
- Benita, F.; Bansal, G.; Tunçer, B. Public spaces and happiness: Evidence from a large-scale field experiment. Health Place 2019, 56, 9–18. [Google Scholar] [CrossRef] [Scilit] [PubMed]
- Hipp, J.R.; Corcoran, J.; Wickes, R.; Li, T. Examining the social porosity of environmental features on neighborhood sociability and attachment. PLoS ONE 2014, 9, e84544. [Google Scholar] [CrossRef] [Scilit] [PubMed]
- Liu, J.; Yan, G.; Wu, Y.; Wang, Y.; Zhang, Z.; Zhang, M. Wetlands with greater degree of urbanization improve PM2.5 removal efficiency. Chemosphere 2018, 207, 601–611. [Google Scholar] [CrossRef] [Scilit]
- Stieger, S.; Aichinger, I.; Swami, V. The impact of nature exposure on body image and happiness: An experience sampling study. Int. J. Environ. Health Res. 2020, 1–15. [Google Scholar] [CrossRef] [Scilit]
- Chen, C.-Y.; Chen, H.W.; Sun, C.-T.; Chuang, Y.H.; Nguyen, K.L.P.; Lin, Y.T. Impact assessment of river dust on regional air quality through integrated remote sensing and air quality modeling. Sci. Total Environ. 2021, 755, 142621. [Google Scholar] [CrossRef] [Scilit]
- Karusisi, N.; Bean, K.; Oppert, J.M.; Pannier, B.; Chaix, B. Multiple dimensions of residential environments, neighborhood experiences, and jogging behavior in the RECORD Study. Prev. Med. 2012, 55, 50–55. [Google Scholar] [CrossRef] [Scilit]
- Perchoux, C.; Kestens, Y.; Brondeel, R.; Chaix, B. Accounting for the daily locations visited in the study of the built environment correlates of recreational walking (the RECORD Cohort Study). Prev. Med. 2015, 81, 142–149. [Google Scholar] [CrossRef] [Scilit]
- Dzhambov, A.M. Residential green and blue space associated with better mental health: A pilot follow-up study in university students. Arh. Hig. Rada Toksikol. 2018, 69, 340–349. [Google Scholar] [CrossRef] [Scilit] [PubMed]
- Jansen, M.; Kamphuis, C.B.M.; Pierik, F.H.; Ettema, D.F.; Dijst, M.J. Neighborhood-based PA and its environmental correlates: A GIS- and GPS based cross-sectional study in the Netherlands. BMC Public Health 2018, 18, 1–8. [Google Scholar] [CrossRef] [Scilit] [PubMed]
- Rugel, E.J.; Henderson, S.B.; Carpiano, R.M.; Brauer, M. Beyond the Normalized Difference Vegetation Index (NDVI): Developing a Natural Space Index for population-level health research. Environ. Res. 2017, 159, 474–483. [Google Scholar] [CrossRef] [Scilit] [PubMed]
- Lederbogen, F.; Haddad, L.; Meyer-Lindenberg, A. Urban social stress--risk factor for mental disorders. The case of schizophrenia. Environ. Pollut. 2013, 183, 2–6. [Google Scholar] [CrossRef] [Scilit]
- Kabisch, N.; van den Bosch, M.; Lafortezza, R. The health benefits of nature-based solutions to urbanization challenges for children and the elderly—A systematic review. Environ. Res. 2017, 159, 362–373. [Google Scholar] [CrossRef] [Scilit]
- Barnett, D.W.; Barnett, A.; Nathan, A.; Van Cauwenberg, J.; Cerin, E. Built environmental correlates of older adults’ total physical activity and walking: A systematic review and meta-analysis. Int. J. Behav. Nutr. Phys. Act. 2017, 14, 1–24. [Google Scholar] [CrossRef] [Scilit]
- Antonelli, M.; Barbieri, G.; Donelli, D. Effects of forest bathing (shinrin-yoku) on levels of cortisol as a stress biomarker: A systematic review and meta-analysis. Int. J. Biometeorol. 2019, 63, 1117–1134. [Google Scholar] [CrossRef] [Scilit]
- Mygind, L.; Kjeldsted, E.; Hartmeyer, R.; Mygind, E.; Stevenson, M.P.; Quintana, D.S.; Bentsen, P. Effects of Public Green Space on Acute Psychophysiological Stress Response: A Systematic Review and Meta-Analysis of the Experimental and Quasi-Experimental Evidence. Environ. Behav. 2019, 001391651987337. [Google Scholar] [CrossRef] [Scilit]
- Darrel Jenerette, G.; Harlan, S.L.; Stefanov, W.L.; Martin, C.A. Ecosystem services and urban heat riskscape moderation: Water, green spaces, and social inequality in Phoenix, USA. Ecol. Appl. 2011, 21, 2637–2651. [Google Scholar] [CrossRef] [Scilit]
- Yu, Z.; Yang, G.; Zuo, S.; Jørgensen, G.; Koga, M.; Vejre, H. Critical review on the cooling effect of urban blue-green space: A threshold-size perspective. Urban For. Urban Green. 2020, 49, 126630. [Google Scholar] [CrossRef] [Scilit]
- Sikorska, D.; Łaszkiewicz, E.; Krauze, K.; Sikorski, P. The role of informal green spaces in reducing inequalities in urban green space availability to children and seniors. Environ. Sci. Policy 2020, 108, 144–154. [Google Scholar] [CrossRef] [Scilit]
- Biernacka, M.; Kronenberg, J. Classification of institutional barriers affecting the availability, accessibility and attractiveness of urban green spaces. Urban For. Urban Green. 2018, 36, 22–33. [Google Scholar] [CrossRef] [Scilit]
- Sabitova, A.; McGranahan, R.; Altamore, F.; Jovanovic, N.; Windle, E.; Priebe, S. Indicators Associated With Job Morale Among Physicians and Dentists in Low-Income and Middle-Income Countries: A Systematic Review and Meta-analysis. JAMA Netw. Open 2020, 3, e1913202. [Google Scholar] [CrossRef] [Scilit]
- Rindfleisch, A.; Malter, A.J.; Ganesan, S.; Moorman, C. Cross-Sectional versus Longitudinal Survey Research: Concepts, Findings, and Guidelines. J. Mark. Res. 2008, 45, 261–279. [Google Scholar] [CrossRef] [Scilit]
- Grizzetti, B.; Liquete, C.; Pistocchi, A.; Vigiak, O.; Zulian, G.; Bouraoui, F.; De Roo, A.; Cardoso, A.C. Relationship between ecological condition and ecosystem services in European rivers, lakes and coastal waters. Sci. Total Environ. 2019, 671, 452–465. [Google Scholar] [CrossRef] [Scilit]
- Schüle, S.A.; Hilz, L.K.; Dreger, S.; Bolte, G. Social inequalities in environmental resources of green and blue spaces: A review of evidence in the WHO European region. Int. J. Environ. Res. Public Health 2019, 16, 1216. [Google Scholar] [CrossRef] [Scilit] [PubMed]

Publisher’s Note: MDPI stays neutral with regard to jurisdictional claims in published maps and institutional affiliations. |
© 2021 by the authors. Licensee MDPI, Basel, Switzerland. This article is an open access article distributed under the terms and conditions of the Creative Commons Attribution (CC BY) license (http://creativecommons.org/licenses/by/4.0/).