
Mechanisms of Impact of Blue Spaces on Human Health: A Systematic Literature Review and Meta-Analysis


Abstract
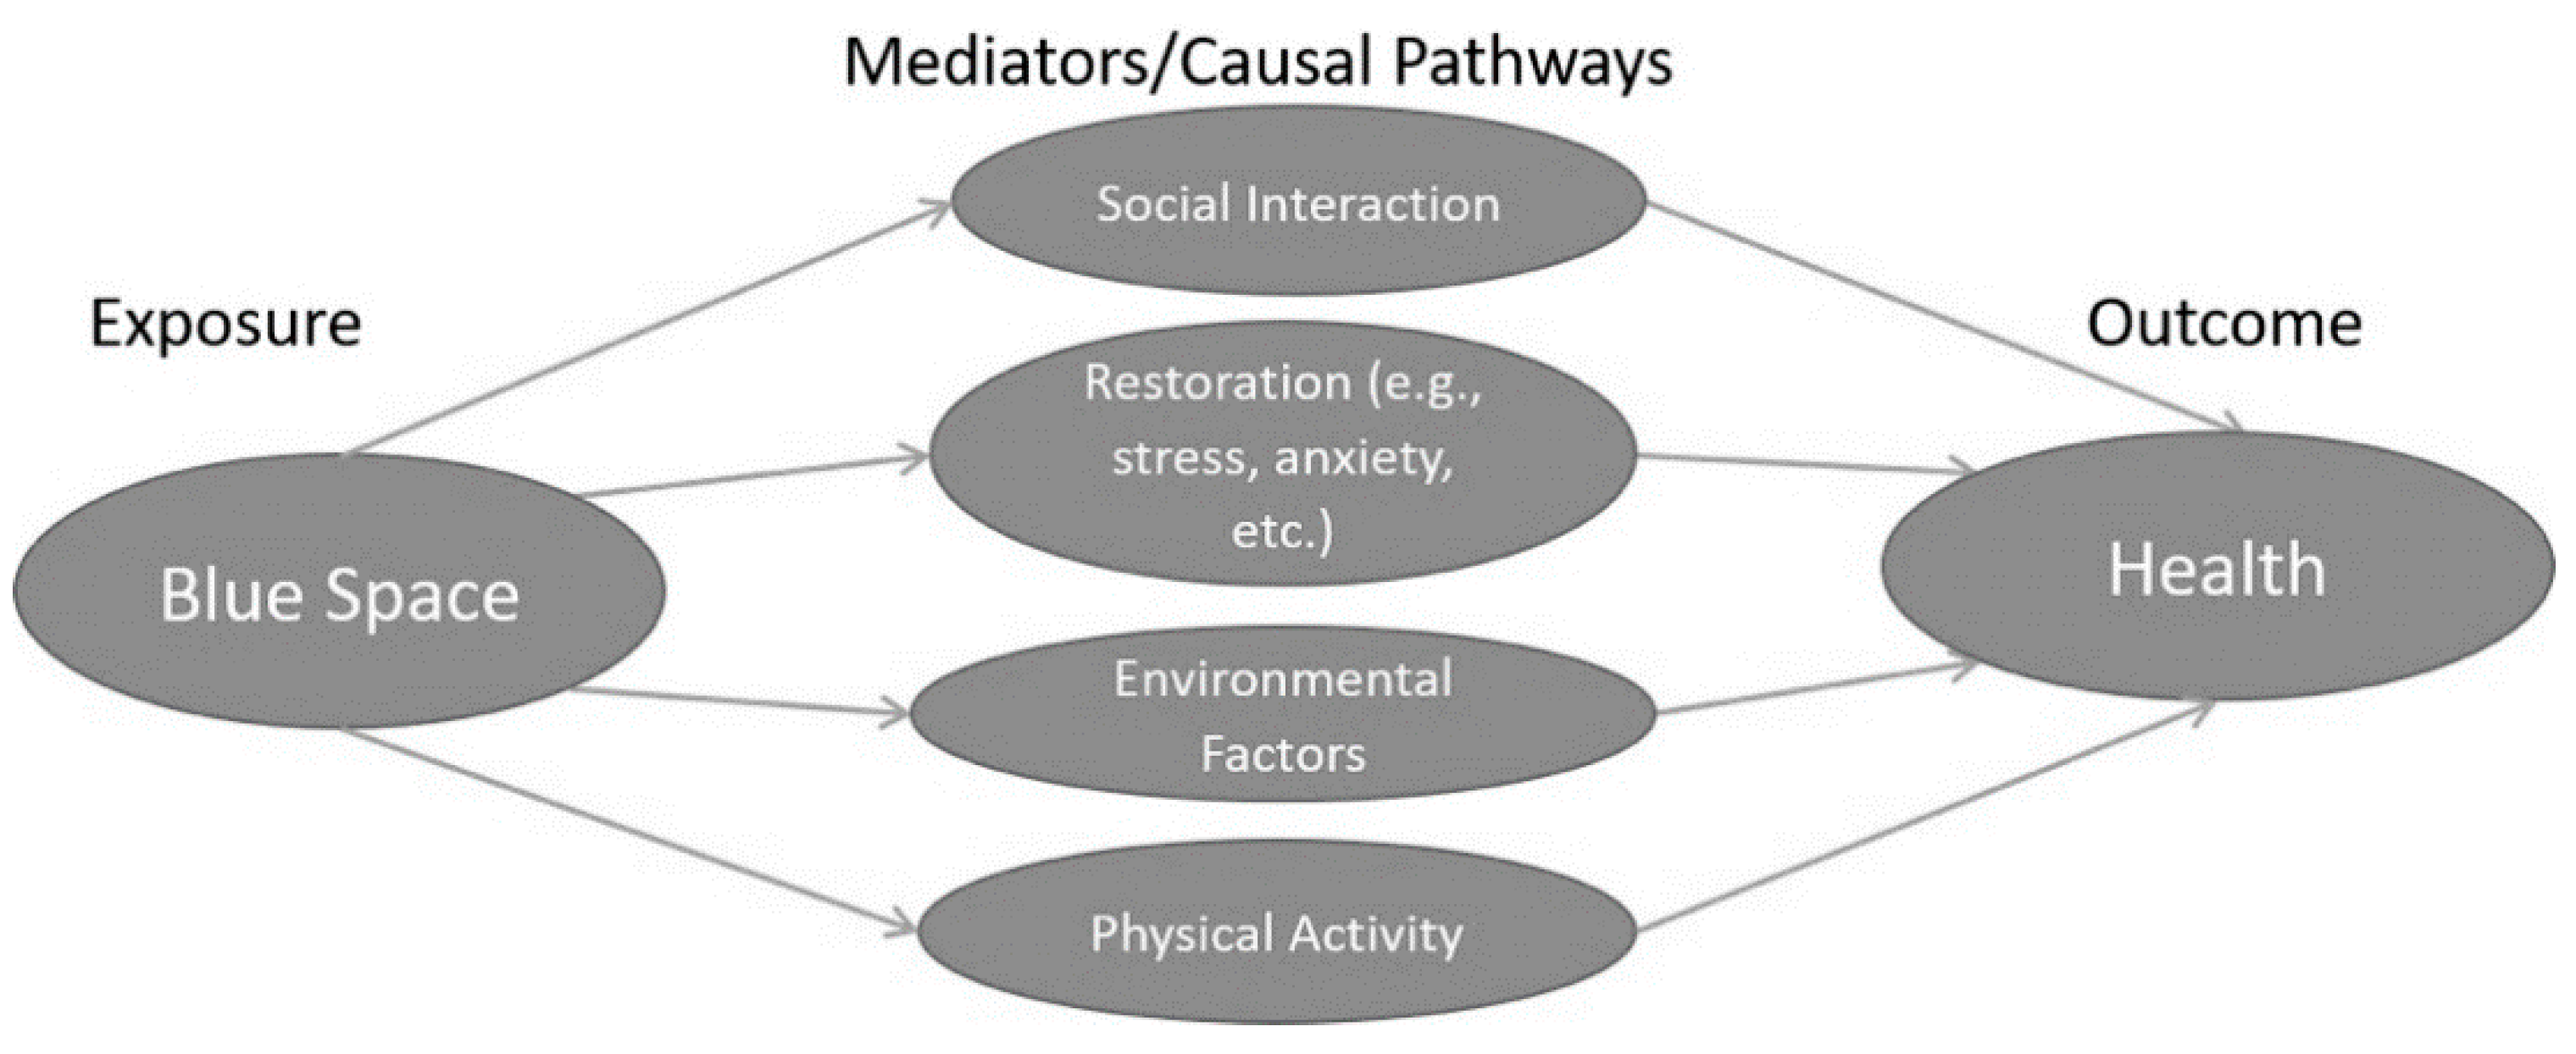
1. Introduction
2. Materials and Methods
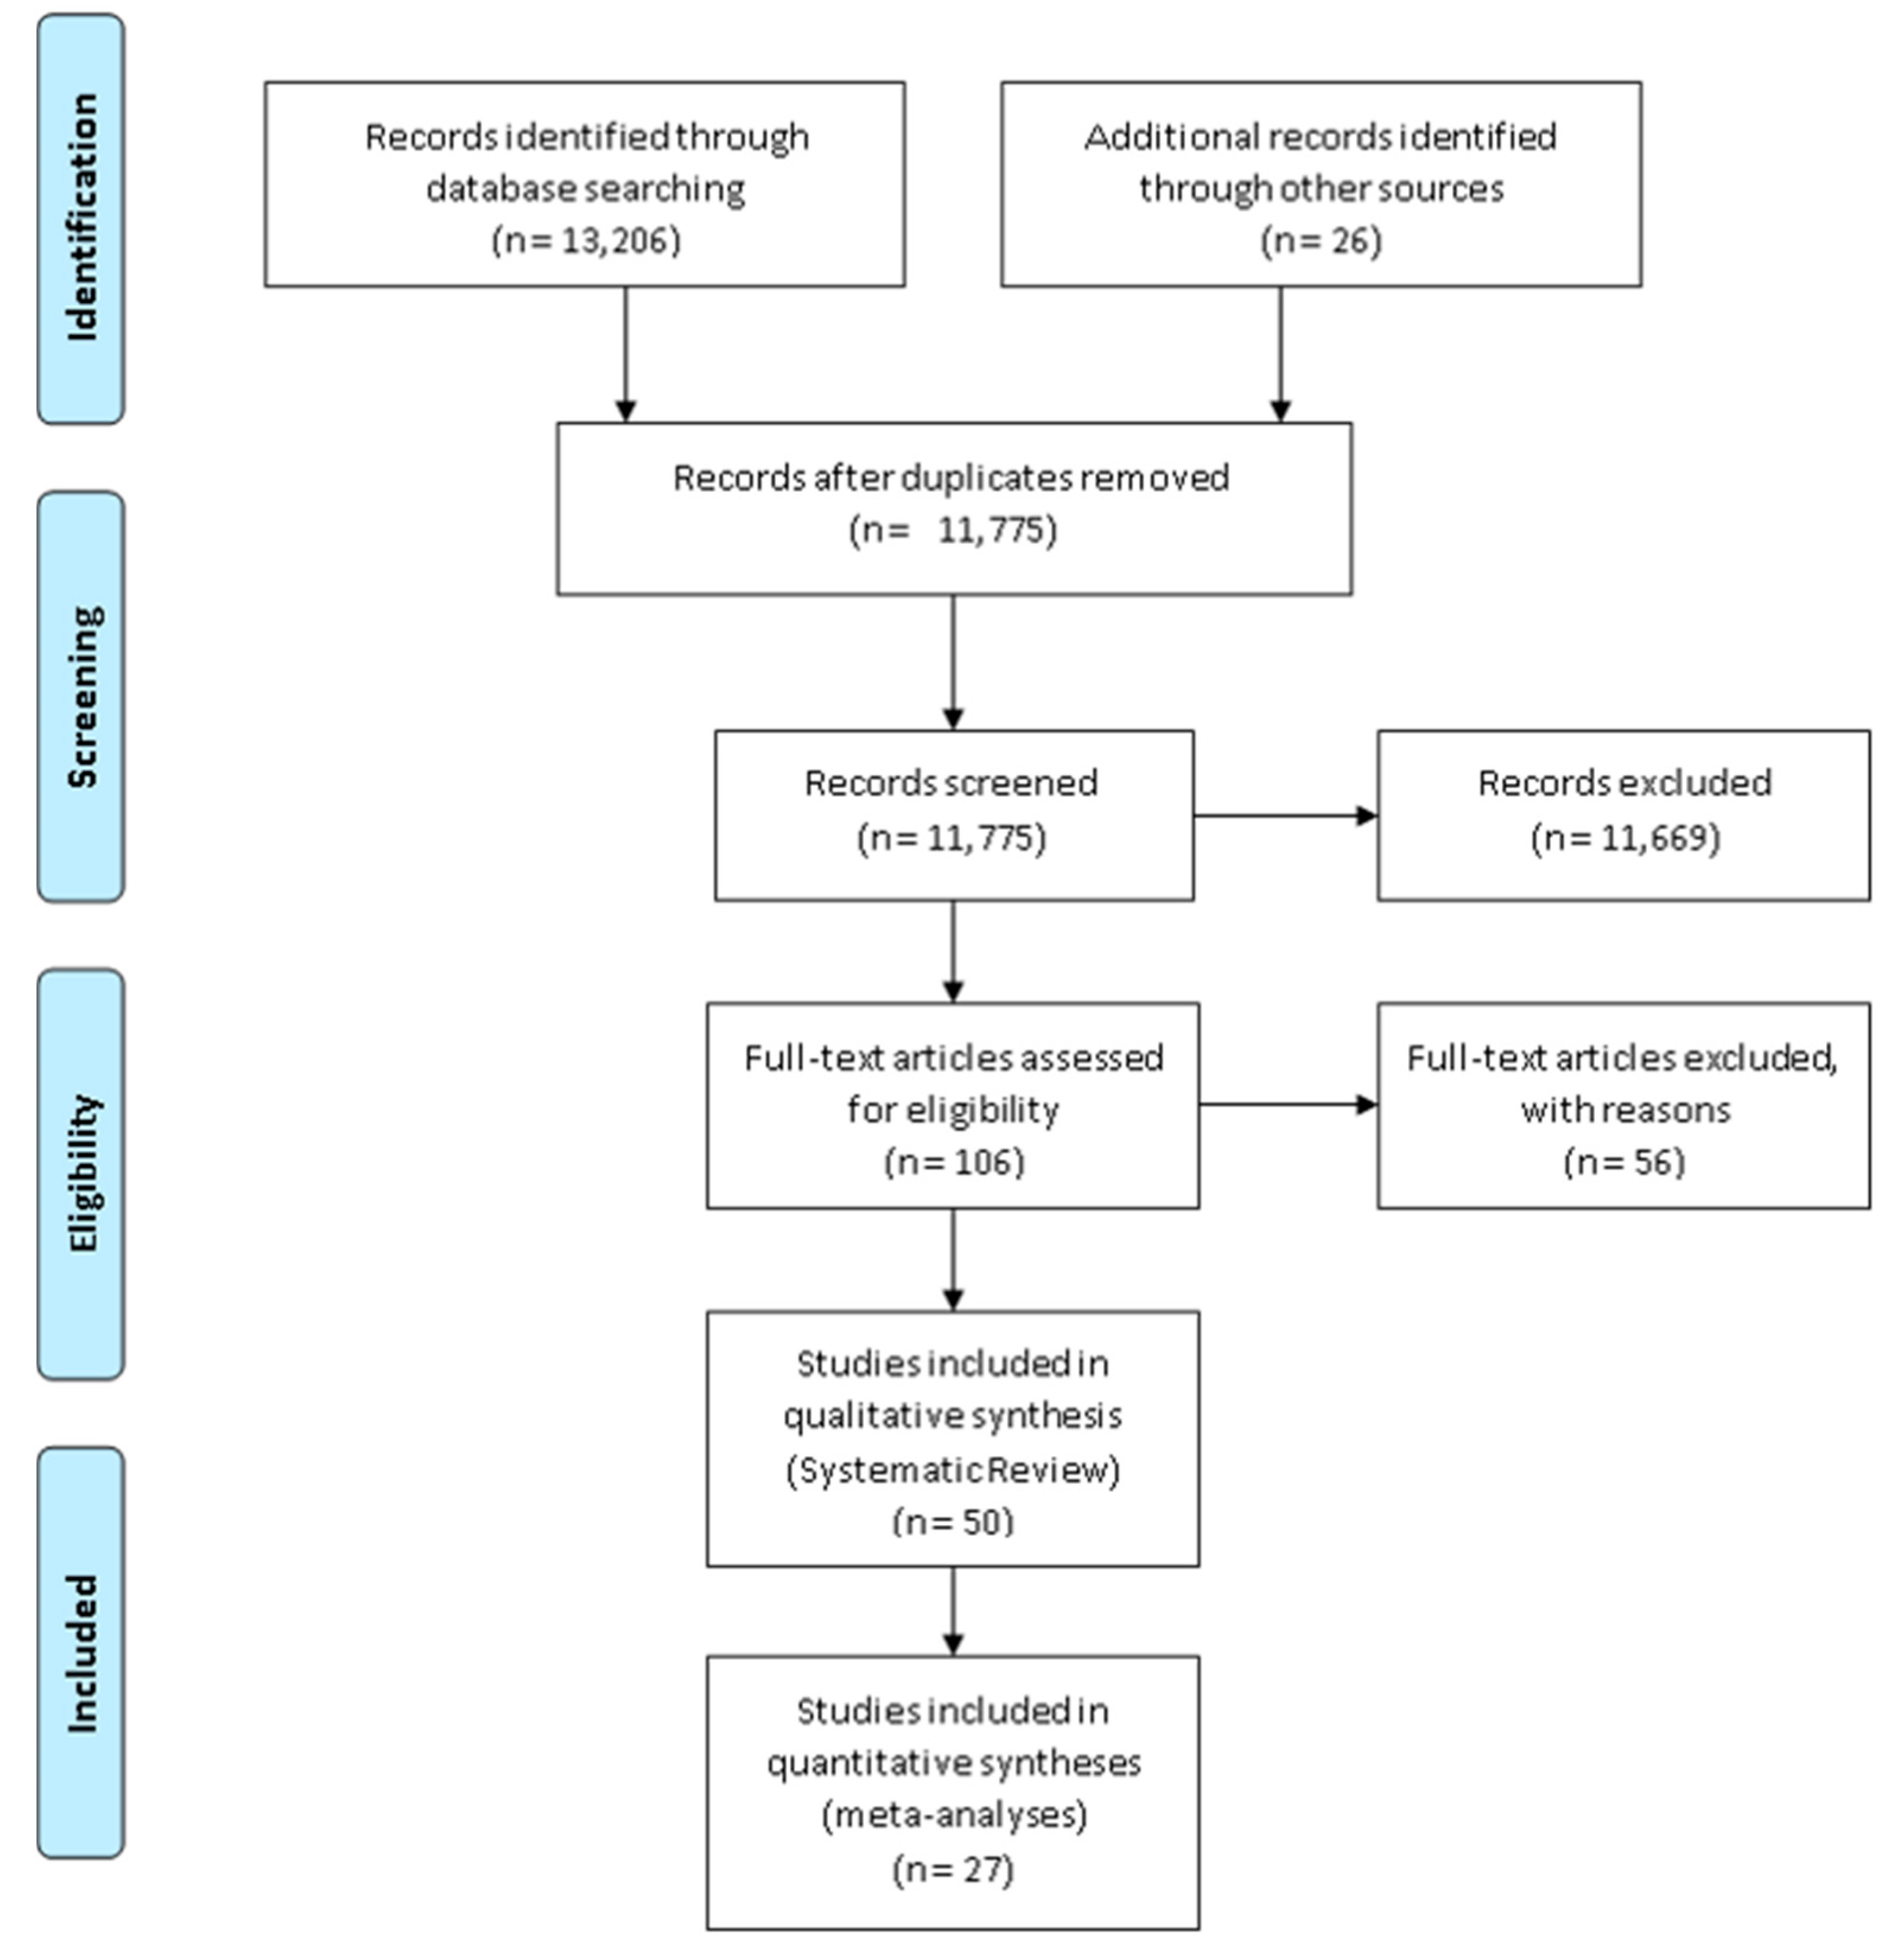
2.1. Search Strategy
2.2. Eligibility Criteria
2.3. Screening, Data Extraction and Quality Appraisal
2.4. Meta-Analyses
3. Results
3.1. Study Design Characteristics
3.2. Physical Activity
3.2.1. General Description
3.2.2. Physical Activity Measurement Types
3.2.3. Quality Assessment
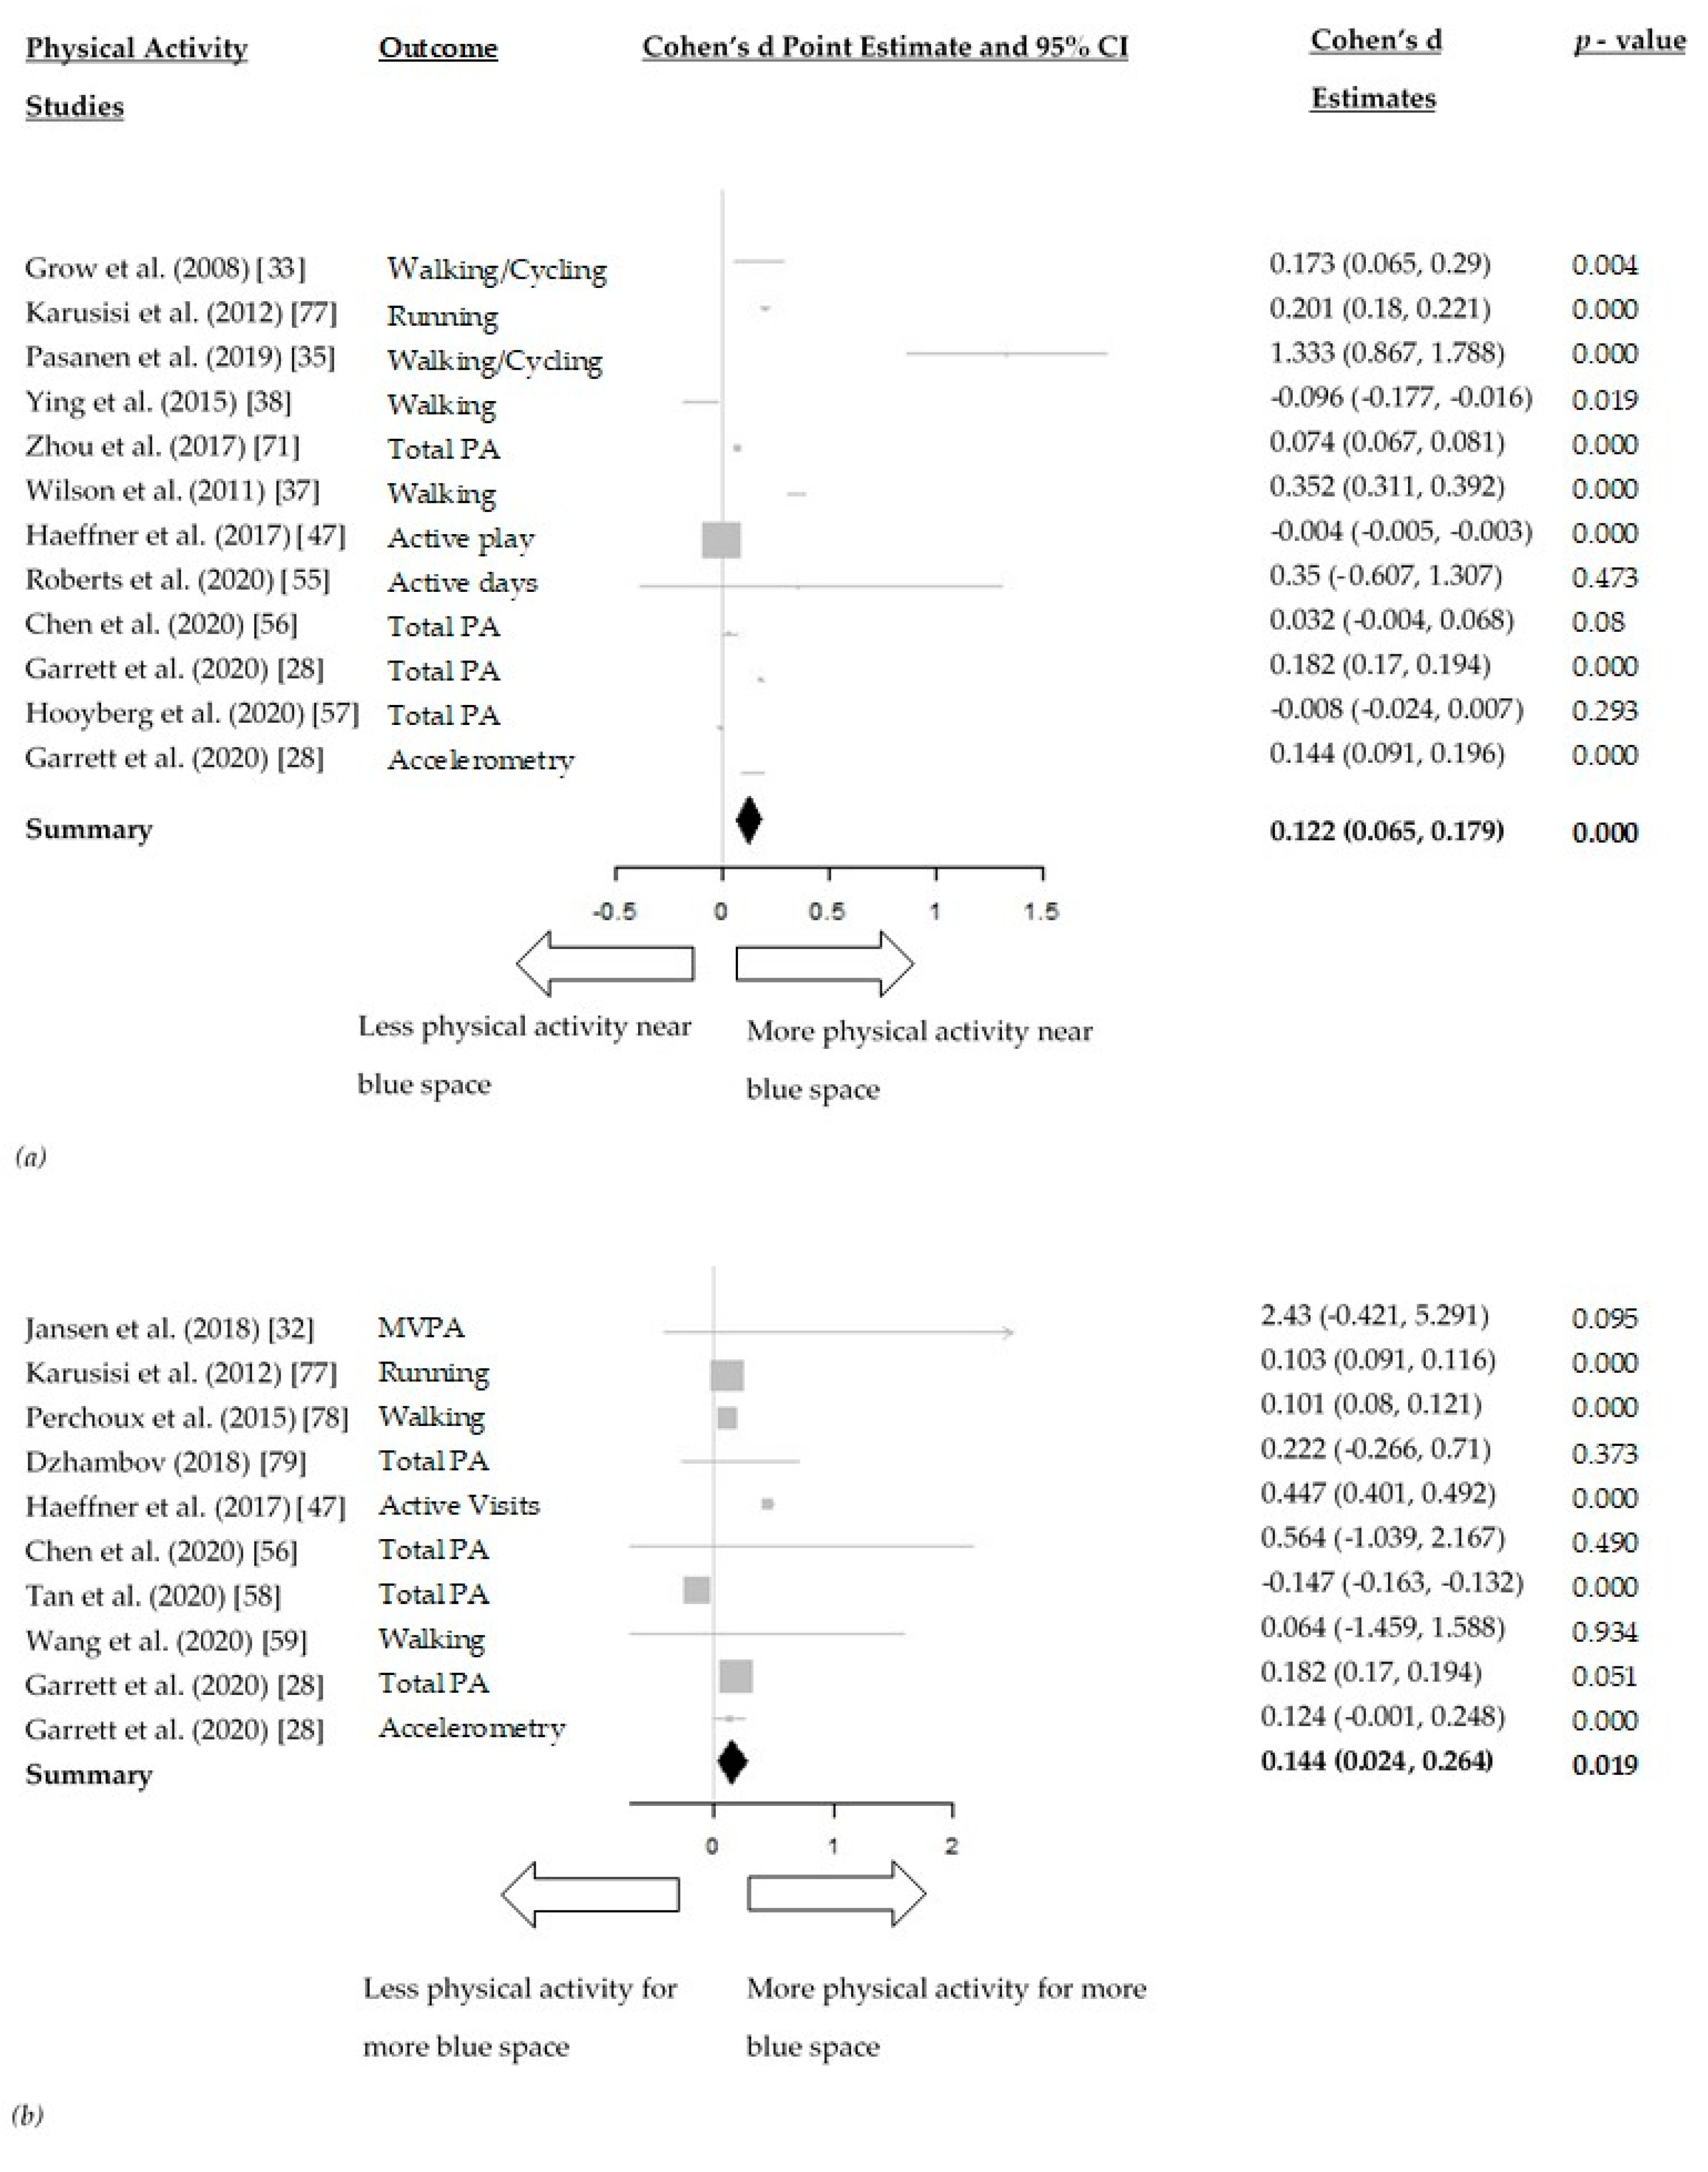
3.2.4. Meta-Analyses
3.3. Restoration
3.3.1. General Description
3.3.2. Quality Assessment
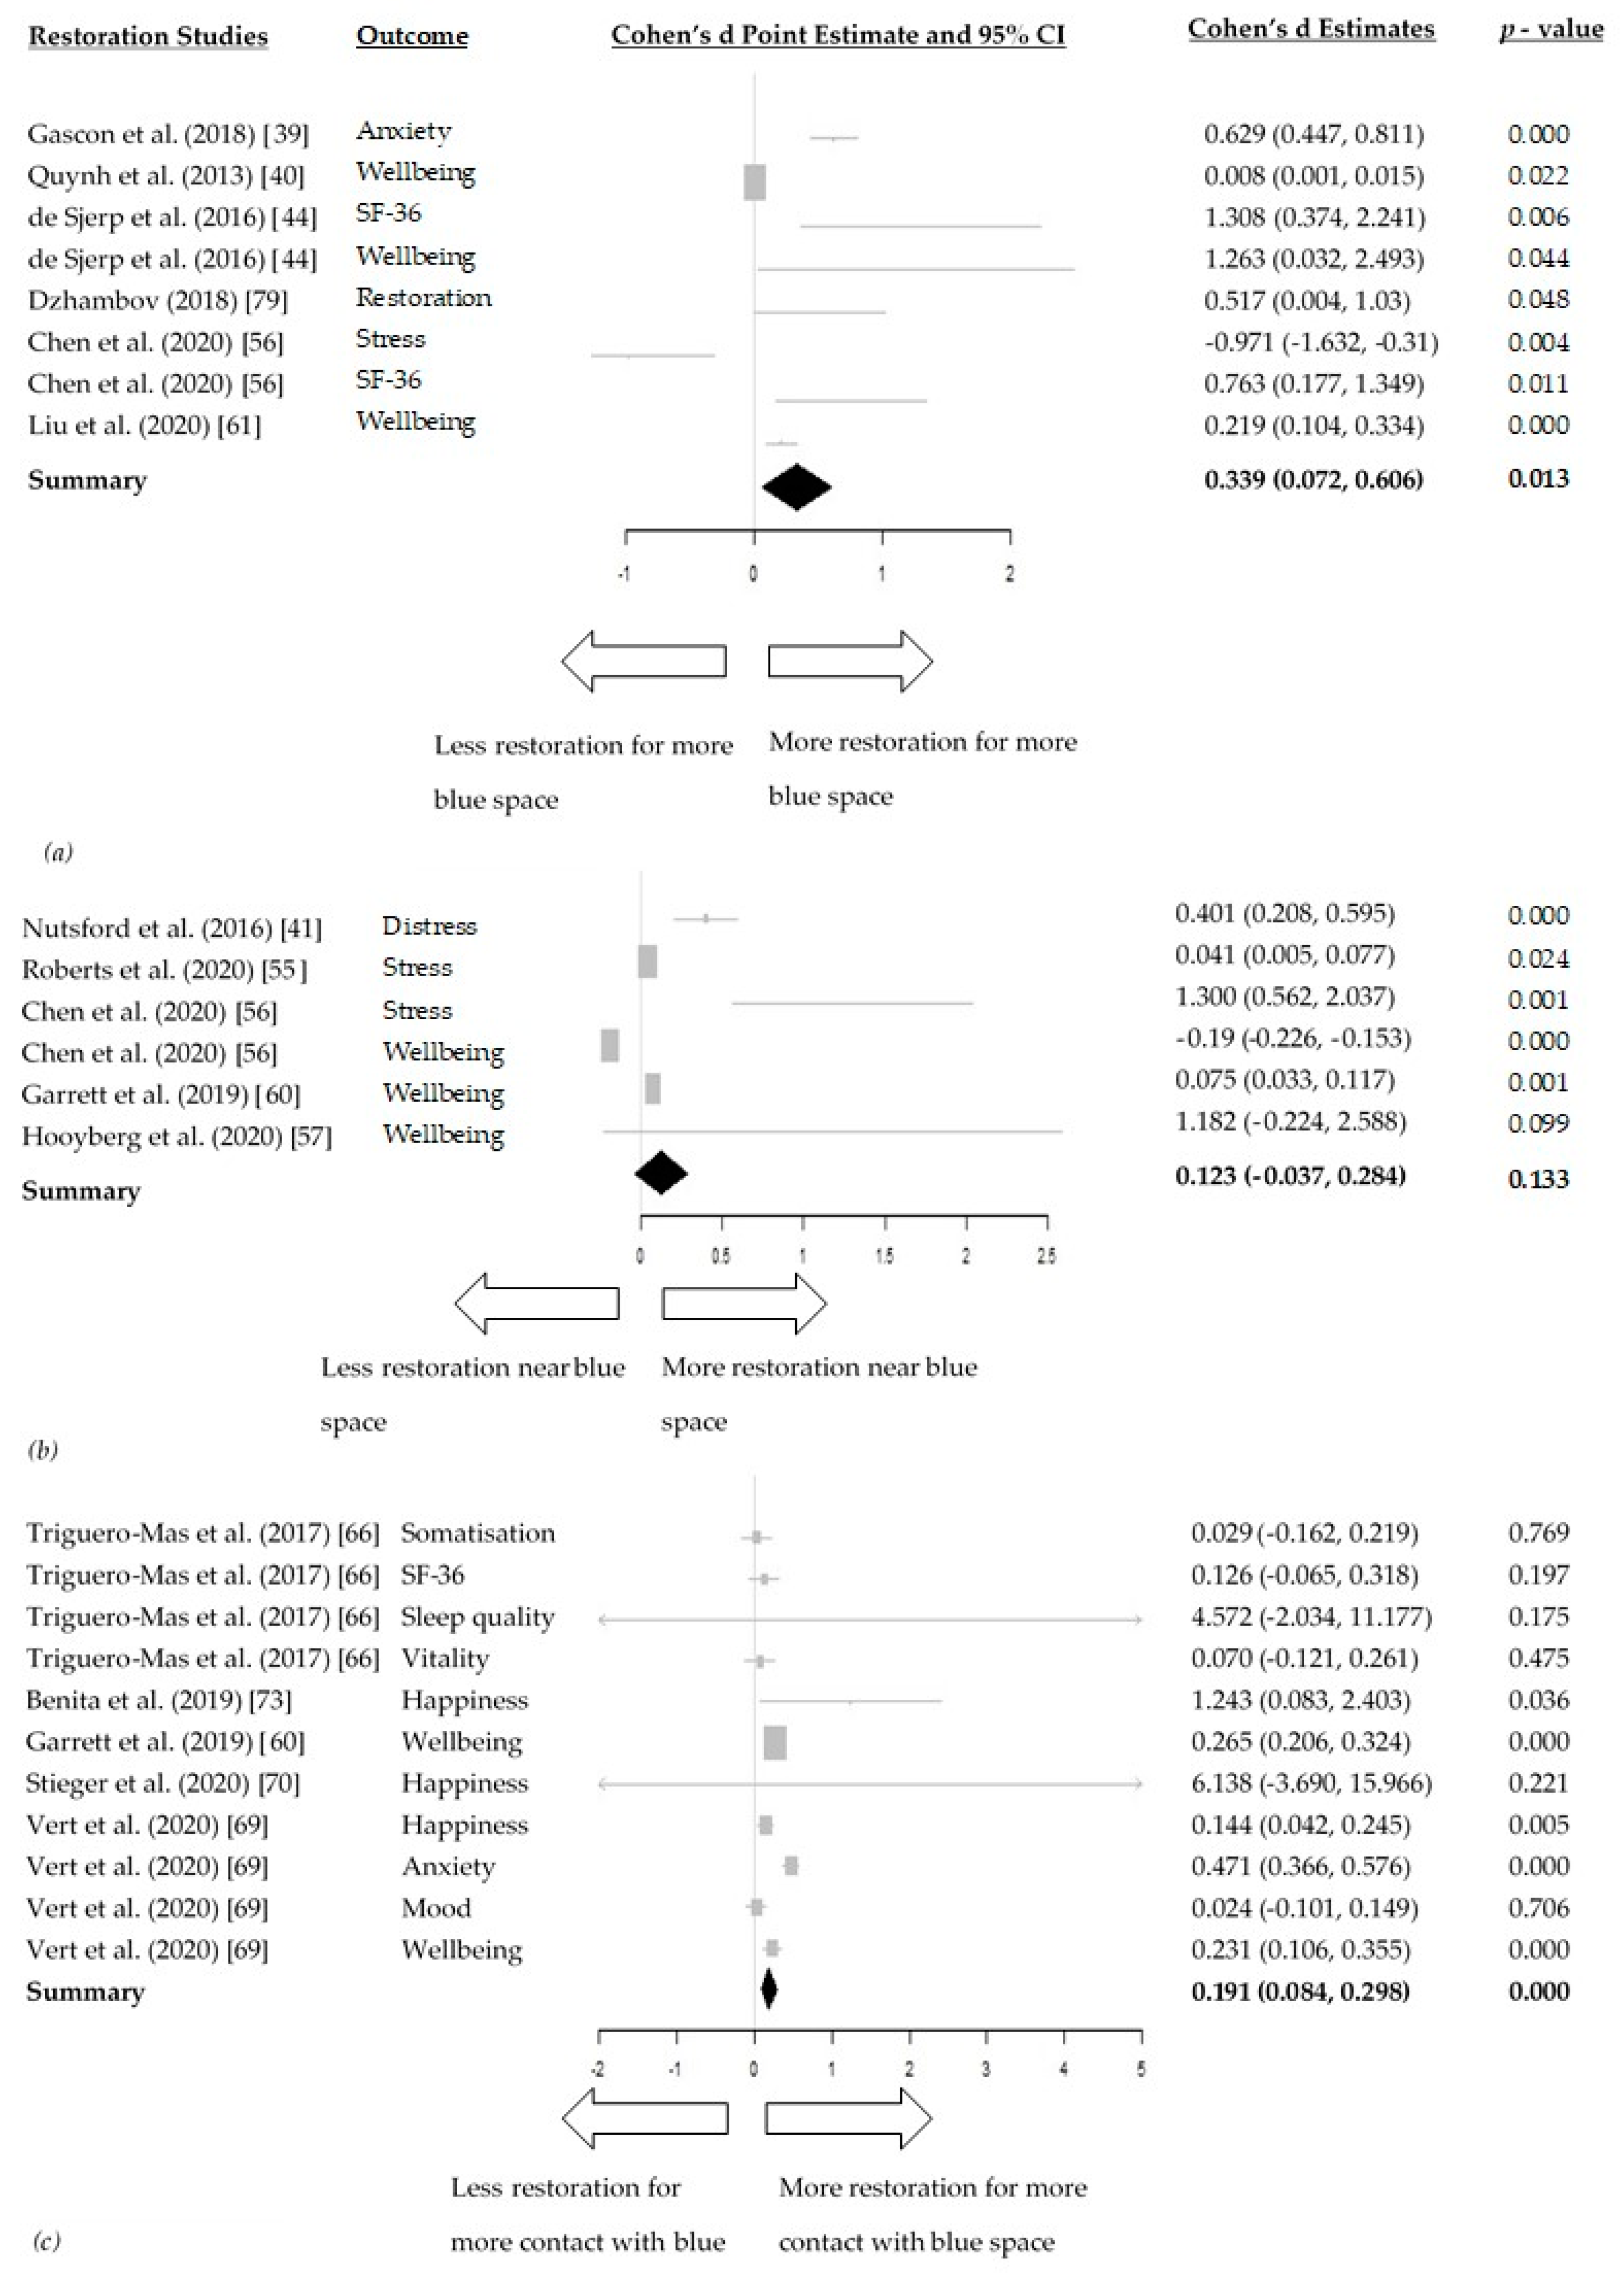
3.3.3. Meta-Analyses
3.4. Social Interaction
3.4.1. General Description
3.4.2. Quality Assessment
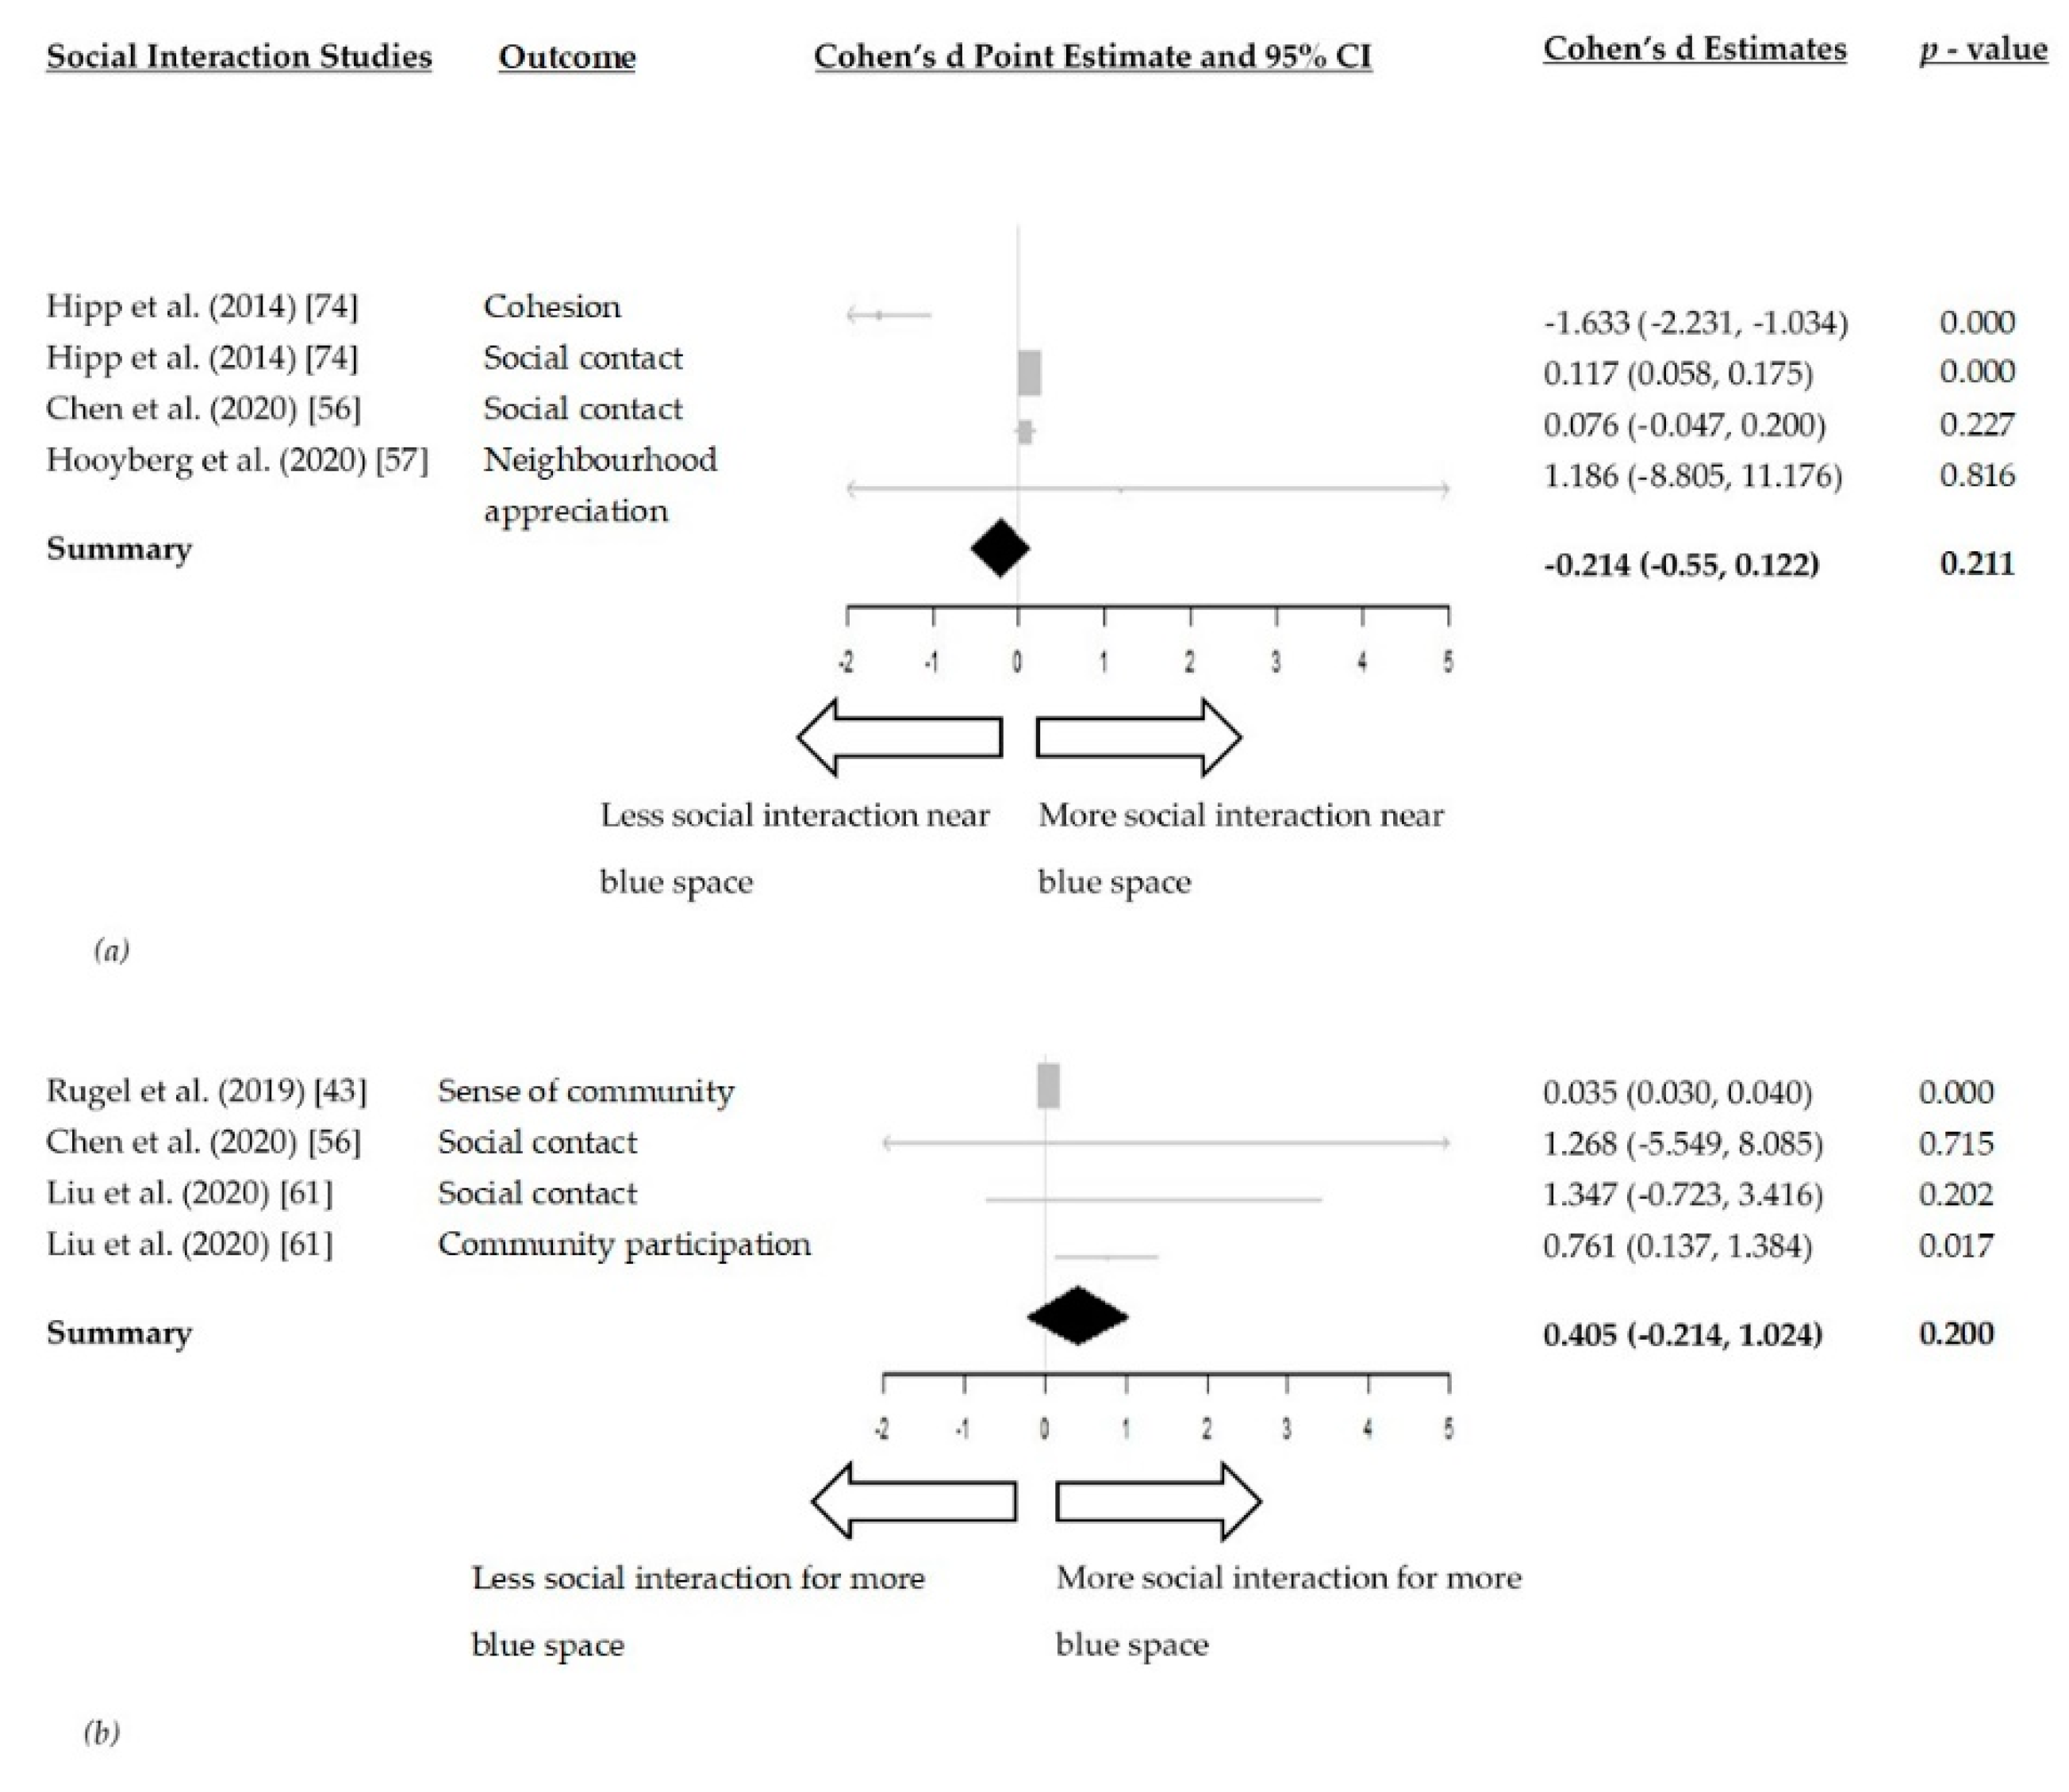
3.4.3. Meta-Analyses
3.5. Environmental Factors
3.5.1. General Description
3.5.2. Quality Assessment
4. Discussion
4.1. Strength and Limitations
4.2. Quality Assessment
4.3. Study Design
4.4. Blue Space Exposure
4.5. Measuring Impact on Health Mediators
4.6. Blue Space Types
4.7. Confounders
4.8. Comparison to Existing Literature
5. Conclusions
Supplementary Materials
Author Contributions
Funding
Institutional Review Board Statement
Informed Consent Statement
Data Availability Statement
Conflicts of Interest
References
- United Nations World Urbanization Prospects: The 2018 Revision. 2018. Available online: https://population.un.org/wup/ (accessed on 25 February 2021).
- Izakovičová, Z.; Mederly, P.; Petrovič, F. Long-term land use changes driven by urbanisation and their environmental effects (example of Trnava City, Slovakia). Sustainability 2017, 9, 1553. [Google Scholar] [CrossRef]
- O’Reilly, G.; O’Reilly, D.; Rosato, M.; Connolly, S. Urban and rural variations in morbidity and mortality in Northern Ireland. BMC Public Health 2007, 7, 123. [Google Scholar] [CrossRef]
- Gruebner, O.; Rapp, M.A.; Adli, M.; Kluge, U.; Galea, S.; Heinz, A. Cities and mental health. Dtsch. Arztebl. Int. 2017, 114, 121–127. [Google Scholar] [CrossRef]
- Trivedi, J.; Sareen, H.; Dhyani, M. Rapid urbanization—Its impact on mental health: A South Asian perspective. Indian J. Psychiatry 2008, 50, 161. [Google Scholar] [CrossRef] [PubMed]
- Twohig-Bennett, C.; Jones, A. The health benefits of the great outdoors: A systematic review and meta-analysis of greenspace exposure and health outcomes. Environ. Res. 2018, 166, 628–637. [Google Scholar] [CrossRef]
- Britton, E.; Kindermann, G.; Domegan, C.; Carlin, C. Blue care: A systematic review of blue space interventions for health and wellbeing. Health Promot. Int. 2020, 35, 50–69. [Google Scholar] [CrossRef]
- Gascon, M.; Zijlema, W.; Vert, C.; White, M.P.; Nieuwenhuijsen, M.J. Outdoor blue spaces, human health and well-being: A systematic review of quantitative studies. Int. J. Hyg. Environ. Health 2017, 220, 1207–1221. [Google Scholar] [CrossRef] [PubMed]
- Smith, N.; Chastin, S.; Tieges, Z.; Webb, S.; Georgiou, M.; King, A. A systematic literature review and meta-analysis of quantitative studies on the impact of urban blue space on human health. Cities 2020. in review. [Google Scholar]
- Völker, S.; Kistemann, T. The impact of blue space on human health and well-being—Salutogenetic health effects of inland surface waters: A review. Int. J. Hyg. Environ. Health 2011, 214, 449–460. [Google Scholar] [CrossRef]
- Grellier, J.; White, M.P.; Albin, M.; Bell, S.; Elliott, L.R.; Gascón, M.; Gualdi, S.; Mancini, L.; Wolf, T.; Wuijts, S.; et al. BlueHealth: A study programme protocol for mapping and quantifying the potential benefits to public health and well-being from Europe’s blue spaces. BMJ Open 2017, 7, 16188. [Google Scholar] [CrossRef] [PubMed]
- Tieges, Z.; Mcgregor, D.; Georgiou, M.; Smith, N.; Saunders, J.; Millar, R.; Morison, G.; Chastin, S. The Impact of Regeneration and Climate Adaptations of Urban Green – Blue Assets on All-Cause Mortality: A 17-Year Longitudinal Study. Int. J. Environ. Res. Public Health 2020, 17, 4577. [Google Scholar] [CrossRef] [PubMed]
- Manteghi, G.; Bin Limit, H.; Remaz, D. Water bodies an urban microclimate: A review. Mod. Appl. Sci. 2015, 9, 1–12. [Google Scholar] [CrossRef]
- World Health Organization. Global Recommendations on Physical Activity for Health; World Health Organization: Geneva, Switzerland, 2010; p. 60. [Google Scholar]
- White, M.P.; Elliott, L.R.; Gascon, M.; Roberts, B.; Fleming, L.E. Blue space, health and well-being: A narrative overview and synthesis of potential benefits. Environ. Res. 2020, 191, 110169. [Google Scholar] [CrossRef] [PubMed]
- Steptoe, A.; Kivimäki, M. Stress and cardiovascular disease. Nat. Rev. Cardiol. 2012, 9, 360–370. [Google Scholar] [PubMed]
- Kubzansky, L.D.; Huffman, J.C.; Boehm, J.K.; Hernandez, R.; Kim, E.S.; Koga, H.K.; Feig, E.H.; Lloyd-Jones, D.M.; Seligman, M.E.P.; Labarthe, D.R. Positive Psychological Well-Being and Cardiovascular Disease: JACC Health Promotion Series. J. Am. Coll. Cardiol. 2018, 72, 1382–1396. [Google Scholar] [CrossRef]
- Gunawardena, K.R.; Wells, M.J.; Kershaw, T. Utilising green and bluespace to mitigate urban heat island intensity. Sci. Total Environ. 2017, 584–585, 1040–1055. [Google Scholar] [CrossRef]
- Umberson, D.; Karas Montez, J. Social Relationships and Health: A Flashpoint for Health Policy. J. Health Soc. Behav. 2010, 51, S54–S66. [Google Scholar] [CrossRef]
- Liberati, A.; Altman, D.G.; Tetzlaff, J.; Mulrow, C.; Gøtzsche, P.C.; Ioannidis, J.P.A.; Clarke, M.; Devereaux, P.J.; Kleijnen, J.; Moher, D. The PRISMA statement for reporting systematic reviews and meta-analyses of studies that evaluate health care interventions: Explanation and elaboration. J. Clin. Epidemiol. 2009, 62, e1–e34. [Google Scholar] [PubMed]
- Wilson, L.; Robinson, K. 005 Clinical Practice Guidelines and Systematic Reviews: Point of Intersection? BMJ Qual. Saf. 2013, 22, A13. [Google Scholar] [CrossRef][Green Version]
- Ouzzani, M.; Hammady, H.; Fedorowicz, Z.; Elmagarmid, A. Rayyan-a web and mobile app for systematic reviews. Syst. Rev. 2016, 5, 1–10. [Google Scholar] [CrossRef]
- Kmet, L.M.; Cook, L.S.; Lee, R.C. Standard Quality Assessment Criteria for Evaluating Primary Research Papers from a Variety of Fields; Education and Research Archive: Edmonton, AB, Canada, 2004. [Google Scholar]
- Chastin, S.F.M.; De Craemer, M.; De Cocker, K.; Powell, L.; Van Cauwenberg, J.; Dall, P.; Hamer, M.; Stamatakis, E. How does light-intensity physical activity associate with adult cardiometabolic health and mortality? Systematic review with meta-analysis of experimental and observational studies. Br. J. Sports Med. 2019, 53, 370–376. [Google Scholar]
- Borenstein, M.; Hedges, L.V.; Higgins, J.P.T.; Rothstein, H.R. Introduction to Meta-Analysis; John Wiley & Sons: Hoboken, NJ, USA, 2009; ISBN 9780470057247. [Google Scholar]
- Chinn, S. A simple method for converting an odds ratio to effect size for use in meta-analysis. Stat. Med. 2000, 19, 3127–3131. [Google Scholar] [CrossRef]
- Sullivan, G.M.; Feinn, R. Using Effect Size—or Why the P Value Is Not Enough. J. Grad. Med. Educ. 2012, 4, 279–282. [Google Scholar] [CrossRef]
- Garrett, J.K.; White, M.P.; Elliott, L.R.; Wheeler, B.W.; Fleming, L.E. Urban nature and physical activity: Investigating associations using self-reported and accelerometer data and the role of household income. Environ. Res. 2020, 190, 109899. [Google Scholar] [CrossRef]
- Higgins, J.P.T.; Thompson, S.G.; Deeks, J.J.; Altman, D.G. Measuring inconsistency in meta-analyses. Br. Med. J. 2003, 327, 557–560. [Google Scholar] [CrossRef]
- Borenstein, M.; Hedges, L.; Higgins, J.; Rothstein, H. Comprehensive Meta Analysis; Version 3.0; Biostatistics: Seattle, WA, USA, 2013. [Google Scholar]
- Arbillaga-Etxarri, A.; Gimeno-Santos, E.; Barberan-Garcia, A.; Benet, M.; Borrell, E.; Dadvand, P.; Foraster, M.; Marín, A.; Monteagudo, M.; Rodriguez-Roisin, R.; et al. Socio-environmental correlates of physical activity in patients with chronic obstructive pulmonary disease (COPD). Thorax 2017, 72, 796–802. [Google Scholar] [CrossRef]
- Jansen, F.M.; Van Kollenburg, G.H.; Kamphuis, C.B.M.; Pierik, F.H.; Ettema, D.F. Hour-by-hour physical activity patterns of adults aged 45–65 years: A cross-sectional study. J. Public Health 2018, 40, 787–796. [Google Scholar] [CrossRef]
- Grow, H.M.; Saelens, B.E.; Kerr, J.; Durant, N.H.; Norman, G.J.; Sallis, J.F. Where are youth active? Roles of proximity, active transport, and built environment. Med. Sci. Sports Exerc. 2008, 40, 2071–2079. [Google Scholar] [CrossRef]
- Jansen, F.M.; Ettema, D.F.; Kamphuis, C.B.M.; Pierik, F.H.; Dijst, M.J. How do type and size of natural environments relate to physical activity behavior? Health Place 2017, 46, 73–81. [Google Scholar] [CrossRef]
- Pasanen, T.P.; White, M.P.; Wheeler, B.W.; Garrett, J.K.; Elliott, L.R. Neighbourhood blue space, health and wellbeing: The mediating role of different types of physical activity. Environ. Int. 2019, 131, 105016. [Google Scholar] [CrossRef]
- Völker, S.; Heiler, A.; Pollmann, T.; Claßen, T.; Hornberg, C.; Kistemann, T. Do perceived walking distance to and use of urban blue spaces affect self-reported physical and mental health? Urban For. Urban Green. 2018, 29, 1–9. [Google Scholar] [CrossRef]
- Wilson, L.A.M.; Giles-Corti, B.; Burton, N.W.; Giskes, K.; Haynes, M.; Turrell, G. The association between objectively measured neighborhood features and walking in middle-aged adults. Am. J. Health Promot. 2011, 25, 12–22. [Google Scholar] [CrossRef]
- Ying, Z.; Ning, L.D.; Xin, L. Relationship between built environment, physical activity, adiposity, and health in adults aged 46–80 in Shanghai, China. J. Phys. Act. Health 2015, 12, 569–578. [Google Scholar] [CrossRef]
- Gascon, M.; Sánchez-Benavides, G.; Dadvand, P.; Martínez, D.; Gramunt, N.; Gotsens, X.; Cirach, M.; Vert, C.; Molinuevo, J.L.; Crous-Bou, M.; et al. Long-term exposure to residential green and blue spaces and anxiety and depression in adults: A cross-sectional study. Environ. Res. 2018, 162, 231–239. [Google Scholar] [CrossRef]
- Huynh, Q.; Craig, W.; Janssen, I.; Pickett, W. Exposure to public natural space as a protective factor for emotional well-being among young people in Canada. BMC Public Health 2013, 13. [Google Scholar] [CrossRef]
- Nutsford, D.; Pearson, A.L.; Kingham, S.; Reitsma, F. Residential exposure to visible blue space (but not green space) associated with lower psychological distress in a capital city. Health Place 2016, 39, 70–78. [Google Scholar] [CrossRef] [PubMed]
- Pearson, A.L.; Shortridge, A.; Delamater, P.L.; Horton, T.H.; Dahlin, K.; Rzotkiewicz, A.; Marchiori, M.J. Effects of freshwater blue spaces may be beneficial for mental health: A first, ecological study in the North American Great Lakes region. PLoS ONE 2019, 14, e0221977. [Google Scholar] [CrossRef]
- Rugel, E.J.; Carpiano, R.M.; Henderson, S.B.; Brauer, M. Exposure to natural space, sense of community belonging, and adverse mental health outcomes across an urban region. Environ. Res. 2019, 171, 365–377. [Google Scholar] [CrossRef]
- De Vries, S.; ten Have, M.; van Dorsselaer, S.; van Wezep, M.; Hermans, T.; de Graaf, R. Local availability of green and blue space and prevalence of common mental disorders in the Netherlands. BJPsych Open 2016, 2, 366–372. [Google Scholar] [CrossRef]
- Triguero-Mas, M.; Dadvand, P.; Cirach, M.; Martínez, D.; Medina, A.; Mompart, A.; Basagaña, X.; Gražulevičiene, R.; Nieuwenhuijsen, M.J. Natural outdoor environments and mental and physical health: Relationships and mechanisms. Environ. Int. 2015, 77, 35–41. [Google Scholar] [CrossRef]
- De Bell, S.; Graham, H.; Jarvis, S.; White, P. The importance of nature in mediating social and psychological benefits associated with visits to freshwater blue space. Landsc. Urban Plan. 2017, 167, 118–127. [Google Scholar] [CrossRef]
- Haeffner, M.; Jackson-Smith, D.; Buchert, M.; Risley, J. “Blue” space accessibility and interactions: Socio-economic status, race, and urban waterways in Northern Utah. Landsc. Urban Plan. 2017, 167, 136–146. [Google Scholar] [CrossRef]
- Burkart, K.; Meier, F.; Schneider, A.; Breitner, S.; Canário, P.; Alcoforado, M.J. by Vegetation (Urban Green) and Proximity to Water (Urban Blue). Environ. Health Perspect. 2016, 124, 927–934. [Google Scholar] [CrossRef]
- Klok, L.; Rood, N.; Kluck, J.; Kleerekoper, L. Assessment of thermally comfortable urban spaces in Amsterdam during hot summer days. Int. J. Biometeorol. 2019, 63, 129–141. [Google Scholar] [CrossRef] [PubMed]
- Kuehne, L.M.; Padgham, B.L.; Olden, J.D. The Soundscapes of Lakes across an Urbanization Gradient. PLoS ONE 2013, 8, e55661. [Google Scholar] [CrossRef] [PubMed]
- Miró, A.; Hall, J.; Rae, M.; O’Brien, D. Links between ecological and human wealth in drainage ponds in a fast-expanding city, and proposals for design and management. Landsc. Urban Plan. 2018, 180, 93–102. [Google Scholar] [CrossRef]
- Raso, G.; Silué, K.D.; Vounatsou, P.; Singer, B.H.; Yapi, A.; Tanner, M.; Utzinger, J.; N’Goran, E.K. Spatial risk profiling of Plasmodium falciparum parasitaemia in a high endemicity area in Cte d’Ivoire. Malar. J. 2009, 8, 1–16. [Google Scholar] [CrossRef]
- Saaroni, H.; Ziv, B. The impact of a small lake on heat stress in a Mediterranean urban park: The case of Tel Aviv, Israel. Int. J. Biometeorol. 2003, 47, 156–165. [Google Scholar] [CrossRef]
- Smith, J.W.; Moore, R.L. Perceptions of community benefits from two wild and scenic rivers. Environ. Manag. 2011, 47, 814–827. [Google Scholar] [CrossRef][Green Version]
- Roberts, H.; van Lissa, C.; Helbich, M. Perceived neighbourhood characteristics and depressive symptoms: Potential mediators and the moderating role of employment status. Soc. Sci. Med. 2021, 268, 113533. [Google Scholar] [CrossRef] [PubMed]
- Chen, Y.; Yuan, Y. The neighborhood effect of exposure to blue space on elderly individuals’ mental health: A case study in Guangzhou, China. Health Place 2020, 63, 102348. [Google Scholar] [CrossRef] [PubMed]
- Hooyberg, A.; Roose, H.; Grellier, J.; Elliott, L.R.; Lonneville, B.; White, M.P.; Michels, N.; De Henauw, S.; Vandegehuchte, M.; Everaert, G. General health and residential proximity to the coast in Belgium: Results from a cross-sectional health survey. Environ. Res. 2020, 184, 109225. [Google Scholar] [CrossRef] [PubMed]
- Tan, C.L.Y.; Chang, C.C.; Nghiem, L.T.P.; Zhang, Y.; Oh, R.R.Y.; Shanahan, D.F.; Lin, B.B.; Gaston, K.J.; Fuller, R.A.; Carrasco, L.R. The right mix: Residential urban green-blue space combinations are correlated with physical exercise in a tropical city-state. Urban For. Urban Green. 2021, 57, 126947. [Google Scholar] [CrossRef]
- Wang, Z.; Ettema, D.; Helbich, M. Objective environmental exposures correlate differently with recreational and transportation walking: A cross-sectional national study in the Netherlands. Environ. Res. 2020, 194, 110591. [Google Scholar] [CrossRef]
- Garrett, J.K.; White, M.P.; Huang, J.; Ng, S.; Hui, Z.; Leung, C.; Tse, L.A.; Fung, F.; Elliott, L.R.; Depledge, M.H.; et al. Urban blue space and health and wellbeing in Hong Kong: Results from a survey of older adults. Health Place 2019, 55, 100–110. [Google Scholar] [CrossRef]
- Liu, Y.; Wang, R.; Lu, Y.; Li, Z.; Chen, H.; Cao, M.; Zhang, Y.; Song, Y. Natural outdoor environment, neighbourhood social cohesion and mental health: Using multilevel structural equation modelling, streetscape and remote-sensing metrics. Urban For. Urban Green. 2020, 48, 126576. [Google Scholar] [CrossRef]
- Subiza-Pérez, M.; Vozmediano, L.; San Juan, C. Green and blue settings as providers of mental health ecosystem services: Comparing urban beaches and parks and building a predictive model of psychological restoration. Landsc. Urban Plan. 2020, 204, 103926. [Google Scholar] [CrossRef]
- Amirbeiki, F.; Ghasr, A.K. Investigating the Effects of Exposure to Natural Blue Elements on the Psychological Restoration of University Students. Int. J. Archit. Eng. Urban Plan 2020, 30, 1–10. [Google Scholar] [CrossRef]
- Lehnert, M.; Brabec, M.; Jurek, M.; Tokar, V.; Geletič, J. The role of blue and green infrastructure in thermal sensation in public urban areas: A case study of summer days in four Czech cities. Sustain. Cities Soc. 2021, 66, 102683. [Google Scholar] [CrossRef]
- Wu, C.; Li, J.; Wang, C.; Song, C.; Chen, Y.; Finka, M.; La Rosa, D. Understanding the relationship between urban blue infrastructure and land surface temperature. Sci. Total Environ. 2019, 694, 133742. [Google Scholar] [CrossRef]
- Triguero-Mas, M.; Donaire-Gonzalez, D.; Seto, E.; Valentín, A.; Martínez, D.; Smith, G.; Hurst, G.; Carrasco-Turigas, G.; Masterson, D.; van den Berg, M.; et al. Natural outdoor environments and mental health: Stress as a possible mechanism. Environ. Res. 2017, 159, 629–638. [Google Scholar] [CrossRef]
- Reeves, J.P.; Knight, A.T.; Strong, E.A.; Heng, V.; Neale, C.; Cromie, R.; Vercammen, A. The application of wearable technology to quantify health and wellbeing co-benefits from urban wetlands. Front. Psychol. 2019, 10, 1–16. [Google Scholar] [CrossRef] [PubMed]
- McNabola, A.; Broderick, B.M.; Gill, L.W. Reduced exposure to air pollution on the boardwalk in Dublin, Ireland. Measurement and prediction. Environ. Int. 2008, 34, 86–93. [Google Scholar] [CrossRef] [PubMed]
- Vert, C.; Gascon, M.; Ranzani, O.; Márquez, S.; Triguero-Mas, M.; Carrasco-Turigas, G.; Arjona, L.; Koch, S.; Llopis, M.; Donaire-Gonzalez, D.; et al. Physical and mental health effects of repeated short walks in a blue space environment: A randomised crossover study. Environ. Res. 2020, 188, 109812. [Google Scholar] [CrossRef] [PubMed]
- Zhou, P.; Grady, S.C.; Chen, G. How the built environment affects change in older people’s physical activity: A mixed- methods approach using longitudinal health survey data in urban China. Soc. Sci. Med. 2017, 192, 74–84. [Google Scholar] [CrossRef] [PubMed]
- Arnberger, A.; Eder, R.; Allex, B.; Ebenberger, M.; Hutter, H.P.; Wallner, P.; Bauer, N.; Zaller, J.G.; Frank, T. Health-related effects of short stays at mountain meadows, a river and an urban site—Results from a field experiment. Int. J. Environ. Res. Public Health 2018, 15, 2647. [Google Scholar] [CrossRef]
- Benita, F.; Bansal, G.; Tunçer, B. Public spaces and happiness: Evidence from a large-scale field experiment. Health Place 2019, 56, 9–18. [Google Scholar] [CrossRef] [PubMed]
- Hipp, J.R.; Corcoran, J.; Wickes, R.; Li, T. Examining the social porosity of environmental features on neighborhood sociability and attachment. PLoS ONE 2014, 9, e84544. [Google Scholar] [CrossRef] [PubMed]
- Liu, J.; Yan, G.; Wu, Y.; Wang, Y.; Zhang, Z.; Zhang, M. Wetlands with greater degree of urbanization improve PM2.5 removal efficiency. Chemosphere 2018, 207, 601–611. [Google Scholar] [CrossRef]
- Stieger, S.; Aichinger, I.; Swami, V. The impact of nature exposure on body image and happiness: An experience sampling study. Int. J. Environ. Health Res. 2020, 1–15. [Google Scholar] [CrossRef]
- Chen, C.-Y.; Chen, H.W.; Sun, C.-T.; Chuang, Y.H.; Nguyen, K.L.P.; Lin, Y.T. Impact assessment of river dust on regional air quality through integrated remote sensing and air quality modeling. Sci. Total Environ. 2021, 755, 142621. [Google Scholar] [CrossRef]
- Karusisi, N.; Bean, K.; Oppert, J.M.; Pannier, B.; Chaix, B. Multiple dimensions of residential environments, neighborhood experiences, and jogging behavior in the RECORD Study. Prev. Med. 2012, 55, 50–55. [Google Scholar] [CrossRef]
- Perchoux, C.; Kestens, Y.; Brondeel, R.; Chaix, B. Accounting for the daily locations visited in the study of the built environment correlates of recreational walking (the RECORD Cohort Study). Prev. Med. 2015, 81, 142–149. [Google Scholar] [CrossRef]
- Dzhambov, A.M. Residential green and blue space associated with better mental health: A pilot follow-up study in university students. Arh. Hig. Rada Toksikol. 2018, 69, 340–349. [Google Scholar] [CrossRef] [PubMed]
- Jansen, M.; Kamphuis, C.B.M.; Pierik, F.H.; Ettema, D.F.; Dijst, M.J. Neighborhood-based PA and its environmental correlates: A GIS- and GPS based cross-sectional study in the Netherlands. BMC Public Health 2018, 18, 1–8. [Google Scholar] [CrossRef] [PubMed]
- Rugel, E.J.; Henderson, S.B.; Carpiano, R.M.; Brauer, M. Beyond the Normalized Difference Vegetation Index (NDVI): Developing a Natural Space Index for population-level health research. Environ. Res. 2017, 159, 474–483. [Google Scholar] [CrossRef] [PubMed]
- Lederbogen, F.; Haddad, L.; Meyer-Lindenberg, A. Urban social stress--risk factor for mental disorders. The case of schizophrenia. Environ. Pollut. 2013, 183, 2–6. [Google Scholar] [CrossRef]
- Kabisch, N.; van den Bosch, M.; Lafortezza, R. The health benefits of nature-based solutions to urbanization challenges for children and the elderly—A systematic review. Environ. Res. 2017, 159, 362–373. [Google Scholar] [CrossRef]
- Barnett, D.W.; Barnett, A.; Nathan, A.; Van Cauwenberg, J.; Cerin, E. Built environmental correlates of older adults’ total physical activity and walking: A systematic review and meta-analysis. Int. J. Behav. Nutr. Phys. Act. 2017, 14, 1–24. [Google Scholar] [CrossRef]
- Antonelli, M.; Barbieri, G.; Donelli, D. Effects of forest bathing (shinrin-yoku) on levels of cortisol as a stress biomarker: A systematic review and meta-analysis. Int. J. Biometeorol. 2019, 63, 1117–1134. [Google Scholar] [CrossRef]
- Mygind, L.; Kjeldsted, E.; Hartmeyer, R.; Mygind, E.; Stevenson, M.P.; Quintana, D.S.; Bentsen, P. Effects of Public Green Space on Acute Psychophysiological Stress Response: A Systematic Review and Meta-Analysis of the Experimental and Quasi-Experimental Evidence. Environ. Behav. 2019, 001391651987337. [Google Scholar] [CrossRef]
- Darrel Jenerette, G.; Harlan, S.L.; Stefanov, W.L.; Martin, C.A. Ecosystem services and urban heat riskscape moderation: Water, green spaces, and social inequality in Phoenix, USA. Ecol. Appl. 2011, 21, 2637–2651. [Google Scholar] [CrossRef]
- Yu, Z.; Yang, G.; Zuo, S.; Jørgensen, G.; Koga, M.; Vejre, H. Critical review on the cooling effect of urban blue-green space: A threshold-size perspective. Urban For. Urban Green. 2020, 49, 126630. [Google Scholar] [CrossRef]
- Sikorska, D.; Łaszkiewicz, E.; Krauze, K.; Sikorski, P. The role of informal green spaces in reducing inequalities in urban green space availability to children and seniors. Environ. Sci. Policy 2020, 108, 144–154. [Google Scholar] [CrossRef]
- Biernacka, M.; Kronenberg, J. Classification of institutional barriers affecting the availability, accessibility and attractiveness of urban green spaces. Urban For. Urban Green. 2018, 36, 22–33. [Google Scholar] [CrossRef]
- Sabitova, A.; McGranahan, R.; Altamore, F.; Jovanovic, N.; Windle, E.; Priebe, S. Indicators Associated With Job Morale Among Physicians and Dentists in Low-Income and Middle-Income Countries: A Systematic Review and Meta-analysis. JAMA Netw. Open 2020, 3, e1913202. [Google Scholar] [CrossRef]
- Rindfleisch, A.; Malter, A.J.; Ganesan, S.; Moorman, C. Cross-Sectional versus Longitudinal Survey Research: Concepts, Findings, and Guidelines. J. Mark. Res. 2008, 45, 261–279. [Google Scholar] [CrossRef]
- Grizzetti, B.; Liquete, C.; Pistocchi, A.; Vigiak, O.; Zulian, G.; Bouraoui, F.; De Roo, A.; Cardoso, A.C. Relationship between ecological condition and ecosystem services in European rivers, lakes and coastal waters. Sci. Total Environ. 2019, 671, 452–465. [Google Scholar] [CrossRef]
- Schüle, S.A.; Hilz, L.K.; Dreger, S.; Bolte, G. Social inequalities in environmental resources of green and blue spaces: A review of evidence in the WHO European region. Int. J. Environ. Res. Public Health 2019, 16, 1216. [Google Scholar] [CrossRef] [PubMed]


| Study | Country | Study Design | Population | N | Age Mean (SD)/Age Structure of Sample | Method of Blue Space Measurement | Exposure | Included in Meta-Analysis? | Initial (Prior to Conversion) Measure of Association Reported Included in Meta-Analysis: | Mediating/Causal Pathway | Confounders | Results |
|---|---|---|---|---|---|---|---|---|---|---|---|---|
| Arbillaga-Etxarri et al., 2017 [31] | Spain | Cross-sectional | COPD patients | 410 | 69 (9) | Presence of blue space within 300 m of residence | Amount of blue space | No | - | Physical activity | age, sex, socio-economic status, dyspnea, exercise capacity, anxiety | No significant association between physical activity and proximity to green and blue spaces. Dog walking and grandparenting were associated with an increase both in time in moderate to vigorous physical activity (MVPA) (18 min/day and 9 min/day, respectively) and in physical activity intensity (76 VMU/min and 59 VMUs/min, respectively) |
| Jansen et al., 2018 [32] | The Netherlands | Cross-sectional | Adults 45–65, living in Rotterdam and Maastricht | 222 | 56.8 (6.1) | Residences, roads, shopping facilities and hospitality industry (e.g., supermarkets, hotels), public social–cultural facilities (i.e., educational institutes, hospitals), sports terrain (e.g., football fields, swimming pool), recreational area (e.g., picnic places, zoos), city green (e.g., city parks, allotments), larger green (e.g., forests, moorlands) and blue space (e.g., rivers, lakes), within 800 m and 1600 m proximity | Amount of blue space | Yes | Beta | Physical activity | - | More MVPA for more blue space |
| Grow et al., 2008 [33] | US | Cross-sectional | Children and Adolescents in Boston, Cincinnati and San Diego, US | Children: 87, Adolescents: 124 | Children: 7.6 (1.7), Adolescents: 14.4 (1.7) | Frequency of use of one of the following: “indoor recreation or exercise facility (public or private),” “swimming pool,” “school recreation facilities open to the public,” “small public park,” “large public park,” “beach, lake, river or creek,” “bike/hiking/walking trails | Distance to blue space | Yes | Risk ratio (RR) | Physical activity | Proximity to facilities, demographic factors (driver’s license, city, race, parent education, Hispanic ethnicity, gender) | Lower chances for biking/walking near blue space (Children), Higher chances for biking/walking near blue space (Adolescents) |
| Jansen et al., 2017 [34] | The Netherlands | Cross-sectional | Adults aged 45–65 years in The Netherlands | 279 | 57.1 (10.9) | Blue space (e.g., lakes, rivers, water in parks, seas) | Amount of blue space | No | - | Physical activity | Gender, age, health status, BMI, education, employment, ethnicity, car ownership, having children, having a dog, having a garden, and city (Rotterdam vs. Maastricht) | Increased light physical activity (LPA) and MVPA within 150 m of setting |
| Karusisi et al., 2012 [77] | France | Cohort | Adults aged between 30 and 79 years, in France | 7290 | Age (years): 30–44 → Men: 36.43%, Women: 33.61%, Age (years) 45–59 → Men: 43.28%, Women: 38.54%, Age (years) 60–79 → Men: 20.29%, Women: 27.84% | Presence of blue/green space with 1 km radius circular buffers centred on each participant’s residence. | Both amount of blue space and distance to blue space | Yes | Risk Ratio (RR) | Physical activity | Age, sex, individual education, marital status, occupation, household income, home ownership, perceived financial strain, Human Development Index (HDI) based on country of birth, energy expenditure at work over the previous week | More chances of jogging within rather than outside neighbourhood for both more area covered with water and closer distance |
| Pasanen et al., 2019 [35] | England, UK | Cross-sectional | Adults in England | 21,097 | 16–24 -> 10.85%, 25–34 -> 14.34%, 35–44 -> 17.52%, 45–54 -> 16.71%, 55–64 -> 16.51%, 65–74 -> 13.29%, ≥75 -> 10.77 | Coastal proximity (0–1 km, > 1–5 km, > 5–20 km, > 20–50 km, and > 50 km), freshwater coverage (absence or presence of freshwater in the Lower-layer Super Output Area (LSOA)) | Distance to blue space | Yes | Beta | Physical activity | Urban/rural status (rural including towns, fringes, villages, hamlets, or isolated dwellings), deprivation (quintile of the Index of Multiple Deprivation), age, sex, education, marital status, annual household income, unemployed/employed, economically inactive (retired or stay-at-home parent), car availability, number of children/infants, long-term limiting illness, analyses for year (2008 or 2012) | More walking for closer to blue space |
| Perchoux et al., 2015 [78] | France | Cohort | All people in France | 4365 | 53 (-) | Presence of a lake or waterways determined from the 2003 IAU-IDF land use database in each area (residential space, workspace, service space, recreational space, social space, street network). | Amount of blue space | Yes | Odds Ratio (OR) | Physical activity | Age, sex, individual education, employment status, household income, marital status, living with at least one child under the age of 14 | Decreased odds of not doing any recreational walking for more blue space with a 500 m radius of the setting |
| Völker et al., 2018 [36] | Germany | Cross-sectional | Urban residents in Bielefeld and Gelsenkirchen, Germany | 1041 | Age mean from both areas: 51.5 (-), Bielefeld: 50.93 (-), Gelsenkirchen: 52.38 (-) | Questionnaires of “How quickly can you reach a body of water from your home by foot?” and “What kind of body of water is this?”. Area level sources. | Distance to blue space | No | - | Physical activity | Green space, age, gender, education, qualifications, net household income, education index | More frequent use of blue space when located within a 5-min walk in both areas |
| Wilson et al., 2011 [37] | Australia | Cross-sectional | People in Brisbane | 10,286 | 40–44 → 2088 (20.3%), 45–49 → 2264 (22.0), 50–54 → 2136 (20.8), 55–59 → 1965 (19.1), 60–65 → 1833 (17.8) | Network distance to nearest river or coast | Distance to blue space | Yes | Odds Ratio (OR) | Physical activity | Age, sex, education, occupation, living arrangement, household income, neighbourhood-level socio-economic disadvantage | Increased odds of walking near blue space |
| Ying et al., 2015 [38] | China | Cross-sectional | People in Shanghai, China, aged 46–80 | 1100 from 80 neighbourhoods | - | Existence of blue space in the 500 m residents’ activity buffer radius | Distance to blue space | Yes | Beta | Physical activity | Age, gender, employment status, education | Decreased number of total steps of walking for increased river proximity |
| Haeffner et al., 2017 [47] | US | Cross-sectional | People living in urban neighbourhoods in Utah, US | 1450 households from 13 neighbourhoods | - | Proximity of a participant’s household to its local waterway. Distance from the respondent’s home to the nearest Access Points (Aps) where they could see and/or spend time near the water. Access to such spaces. | Visit to blue space | No | - | Physical Activity | Respondent’s education, household income, homeowner status, race/ethnicity, children present, length of residency | Increased odds of walking, playing or visiting a blue space for presence of public access point (AP) near someone’s residence. |
| Zhou et al., 2017 [70] | China | Longitudinal | People in Huainan, China | Health survey n = 3094, interviews n = 42 | Interview stage: 55–64 years, n = 21, 65+ years n = 21. Health Survey: 55–64 years → 1177 (38%), 65–88 years → 1925 (62%) | Questionnaire to map older people’s activities and then use of GIS to spot the existence of natural or human-made water bodies | Distance to blue space | Yes | Beta | Physical activity | Gender, age, education, income, overweight and obesity, hypertension, diabetes, hyperlipidemia, cardiovascular conditions, liver and biliary system conditions, kidney function | Increased frequency of physical activity per week for closer distance to blue space |
| Arnberger et al., 2018 [71] | Alpine range from Austria to Switzerland | Longitudinal | Adult people 22 to 36 years old | 22 | 26.7 (4.1) | Existence of meadow/river on site. Visit of 5 different locations in the alpine region | Contact with blue space | No | - | Restoration | - | High restorative potential of mountain rivers. Blue space found to provide health benefits |
| Dzhambov, 2018 [79] | Bulgaria | Both cross-sectional and longitudinal | Students between 18 and 35 years old, in Plovdiv, Bulgaria | 109 | 21 (3) | Blue space presence in circular buffers of 100 m, 300 m and 500 m around students’ residences | Amount of blue space | Yes | Pearson’s R | Restoration | Age, gender, ethnicity, duration of residence, average time spent at home a day, perceived economic status | Association between restorative quality and blue space |
| Gascon et al., 2018 [39] | Spain | Cross-sectional | Adults in Barcelona | 958 | 56.5 (-) | Presence of blue spaces of any type and size represented in the map around the residential address (buffers of 100, 300 m and 500 m) | Amount of blue space | Yes | Odds Ratio (OR) | Restoration | Age, gender, educational attainment, marital status, living alone, work category, physical activity, smoking, sleep quality, social support, perceived social support, meditation, caregivers of people with AD or other chronic disease, family history of Alzheimer’s disease (AD) or any other dementia, BMI, air pollution—annual average levels of nitrogen oxides (NO2 and Nox) and particulate matter (PM2.5, PM2.5 absorbance (abs), PM10, and PM coarse). | Lower odds of self-reported history of anxiety, self-reported history of depression, self-reported history of medication with Benzodiazepines, self-reported history of antidepressants use, for more blue space within both a 300 m and 500 m radius. |
| Huynh et al., 2013 [40] | Canada | Cross-sectional | School students in Canada | 17,249 students, 317 schools | ≤11 -> 13.8%, 12 -> 20.1%, 13 -> 19.3%, 14 -> 19.2%, 15 -> 19.7%, ≥16 -> 7.8% | Public natural space (green and blue spaces such as parks, wooded areas, and water bodies) within a 5 km radius circular buffer surrounding each school. | Amount of blue space | Yes | Risk Ratio (RR) | Restoration | Socio-economic status, perceived neighbourhood safety (Family affluence scale), neighbourhood aesthetics, neighbourhood SES (median household income, employment rate, percentage of population with greater than high school education, urban/rural geographic location (rural area (<10,000 persons), small city (10,000–99,999 persons), or metropolitan area (>100,000 persons)). Age, gender, ethnicity and urban/rural geographic location as moderators. | Higher chances of positive emotional wellbeing for existence of public natural space within a 5 km radius around school |
| Nutsford et al., 2016 [41] | New Zeeland | Cross-sectional | People in New Zeeland | 442 | 15–44 yr → Females: 56%, Males: 54%, Total: 55%, 45–64 yr → Females: 32%, Males: 35%, Total: 33%, 65+ yr → Males: 12%, Females: 12%, Total: 12% | Visible blue space within <300 m; 300 m to 3 km; 3–6 km and 6–15 km | Distance to blue space | Yes | Beta | Restoration | Age, sex, personal income, neighbourhood population density, housing quality, crime and deprivation. | More visibility (closer distance) of blue space leads to better scores at the Kessler Psychological Distress scale (K10) |
| Pearson et al., 2019 [42] | US | Cross-sectional | People in US | 30,421 | 42 (16) | The proportion of a ZIP code occupied by inland lakes; The average Euclidean distance to the nearest blue space boundary, distinguished between inland lakes and Great Lakes. | Amount of blue space | Yes | Beta | Restoration | Median income and population density, age, sex | Decrease of individual-level anxiety/mood disorder hospitalisations for more blue space. |
| Rugel et al., 2019 [43] | Canada | Cross-sectional | People in Canada | 1,930,048 | Weighted %: 15–24 years → 17.4%, 25–34 years → 15.3%, 35–44 years → 18.7%, 45–54 years → 19.2%, 55–64 years → 12.8%, 65 and older → 16.5% | Presence of blue space permanent water features such as oceans, lakes, and rivers and intermittent sources such as sloughs and bogs. Visible blue space percentage within a 100-m buffer. Accessible blue space percentage within a 1000-m buffer. | Amount of blue space | Yes | Odds Ratio (OR) | Restoration | Sex, age, race-ethnicity, Provincial household income level (compares the participant with others residing in the same province), highest household education level, household type, household living arrangement (indicates the relationship of the participant with others in the same household), pain health status, urbanicity, population density, walkability. | Stronger sense of community for more blue space |
| Triguero-Mas et al., 2017 [66] | Spain, England (UK), The Netherlands, Lithuania | Cross-over | People in Spain, England, The Netherlands and Lithuania | Total: 406, Barcelona: 107, Stoke-on-Trent: 90, Doetinchem: 105, Kaunas: 104 | Total: 51.00 (26.00), Barcelona: 40.00 (23.00), Stoke-on-Trent: 43.50 (28.75), Doetinchem: 59.00 (16.00), Kaunas: 55.00 (23.25) | Contact with blue space defined as presence/absence within 50 m of each participant’s location point. Residential exposure with a 300 m buffer around residencies. | Contact with blue space | No | - | Restoration | City of residence, age, gender, education, neighbourhood socio-economic status, | Contact with green/blue space led to higher SF-36 mental health scores, 4DSQ scores, Vitality scale scores, number of nights of good sleep. |
| de Vries et al., 2016 [44] | The Netherlands | Cross-sectional | People in The Netherlands | 6621 | Age: below 35 N = 1600 (24%) Age: between 35 and 54 N = 3278 (50%) | Blue space availability as percentages of the area within 1 km from one’s home | Amount of blue space | Yes | Odds Ratio (OR) and Beta | Restoration | Gender, age, having a partner, having a child within the household, educational level, having a paid job, household income, urbanicity of the respondent’s neighbourhood, socio-economic status of the neighbourhood (by average residential property value) | Lower odds of anxiety disorder, any mood disorder, substance use disorder, common mental disorder for more blue space within 1 km from someone’s residence. Better self-perceived mental health scores (SF-36), self-perceived general health scores for more blue space within 1 km from someone’s residence. |
| Triguero-Mas et al., 2015 [45] | Spain | Cross-sectional | People in Catalonia, Spain | 8793 | 48 years | Access to blue spaces | Amount of blue space | Yes | Odds Ratio (OR) | Restoration | Gender, age, education completed, birth place, type of health insurance, marital status, indicators of household based on the occupation of the main person of each household, neighbourhood (the percentage of the population with education higher than secondary in the participant’s census track), socioeconomic status (SES) | Better self-perceived general health for blue space, Better self-perceived social support for more blue space |
| Reeves et al., 2019 [67] | England, UK | Cross-over | People exposed to wetlands | 36 | 41 (10.28) | Exposure to Wetland, Urban and Control site, London | Contact with blue space | No | - | Restoration | Age, gender, site order, self-reported levels of stress | Lower heart rate for contact with blue space setting compared to urban setting. More positive feelings for blue space setting. Decrease in negative feelings for blue setting. |
| Benita et al., 2019 [72] | Singapore | Longitudinal | Primary, secondary and junior college students | 10,464 | - | Parks, water bodies, open spaces as POIs. Visit of a POI during the day. Proximity of POIs to parks, water body and open space/reserve site with a 100 m buffer. | Visit to blue space | No | - | Restoration | Environmental factors (temperature, humidity, noise, daylight), Personal characteristics (age, housing price, social group), day and months | More happy moments among students who visited open spaces. |
| de Bell et al., 2017 [46] | Britain, Excluding the Isle of Scilly, the Scottish Highlands and Islands | Cross-sectional | People in Britain | 1043 | 6–24 → 11.1%, 25–44 → 32.4%, 45–64 → 33.5%, 65 and over → 23% | Areas such as rivers, canals and lakes and their immediate surroundings, including river paths, canal paths and lakeside walks. Excluded coastal blue spaces such as beaches. Visit to blue spaces. | Visit to blue space | No | - | Social interaction | Age, gender, household composition, socio-economic status, car ownership, health status, urbanicity of the respondents’ dwelling | Higher odds of spending time with family or friends for more visits to blue space. |
| Hipp et al., 2014 [73] | Australia | Longitudinal | People living in Australia | 4351 residents, 146 neighbourhoods | 0.512 (0.152) | “Holes” in the social environment: parks and industrial areas “Wedges” in the social environment: Rivers and Highways. | Distance to blue space and size of blue space | No | - | Social Interaction | Residential stability, median income, percent perceived non-Anglo, population density, approximate annual household income, highest level of education, own or rent, length of residence at current address, spoken languages at home other than English, dependent children of respondent, marital status, age, gender, ancestry measures. | Lower neighbouring index for increased size of blue space. Higher neighbourhood attachment index for increased size of blue space. Lower neighbourhood cohesion index for increased size of blue space. |
| Burkart et al., 2016 [48] | Portugal | Cross-sectional | Elders over 65, in urban areas of Portugal | 218,764 deaths from 213 civil parishes | - | Urban blue defines as urban water bodies | Distance to blue space | No | - | Environmental factors (Temperature) | Time trends, age, urban density, socio-economic status | Association between proximity to water and land surface temperature |
| Klok et al., 2019 [49] | The Netherlands | Cross-sectional | Areas in Amsterdam | 21 locations | - | Blue locations—urban areas close to water bodies such as canals, rivers, ponds and fountains in the chosen area. | Amount blue space | No | - | Environmental factors (Temperature) | - | Temperature reduction for presence of blue space |
| Kuehne et al., 2013 [50] | US | Cross-sectional | People/lakes in Washington state, US | 10 lakes | - | Lakes classified as Low (30%), Medium (30–50%), and High (50%) urbanisation | Amount of blue space | No | - | Environmental factors (Environmental noise) | Landscape factors, time period | Presence of public park/lake had a negative effect on biophony. Lakes with higher urbanisation levels led to higher anthrophony and lower biophony. |
| Liu et al., 2018 [74] | China | Longitudinal | Wetland plots/people in China | 3 wetland plots | - | Three wetlands chosen as experimental sites | Amount of blue space | No | - | Environmental factors (Air quality) | - | Greater PM 2.5 removal efficiency for wetlands with higher degree of urbanisation |
| McNabola et al., 2008 [68] | Ireland | Cross-over | Boardwalks/people in Ireland | 1 boardwalk in Dublin | - | Boardwalk next to River Liffey, Ireland. | Distance to blue space | No | - | Environmental factors (Air quality) | Traffic density, temperature, idle time, stability, traffic related turbulence | Pedestrians using boardwalks are less exposed to benzene and PM 2.5 pollution |
| Miro et al., 2018 [51] | Scotland, UK | Cross-sectional | Sustainable drainage systems (SuDS)/people in Scotland | 34 SuDS | - | Areas with Sustainable Drainage Systems (SuDS) | Amount of blue space | No | - | Environmental factors (Ecological quality) | Socio-economic indicators (semidetached houses, terraced houses, three rooms, six rooms, eight rooms, nine rooms, three cars, four cars) | Presence of SuDS leads to higher ecological quality |
| Raso et al., 2009 [52] | Ivory Coast | Cross-sectional | Children in Ivory Coast | 3962 | 1684 children (42.5%) 6–10 years old, 2278 children (57.5%) aged 11–16 years. | Distance of schools to rivers, using digitised ground maps | Distance to blue space | No | - | Environmental factors (Disease transmission) | Spatial correlation, age, bed net coverage, rainfall during the main malaria transmission season, distance to NDVI for vegetation | Association between proximity to rivers and P. falciparum infections |
| Saaroni and Ziv, 2003 [53] | Israel | Cross-sectional | Ponds/people in Israel | 1 pond in Tel Aviv, Israel | - | A pond of 4 ha. Four stations located 3–5 m from the edge of the pond (north, south, east, west) | Distance to blue space | No | - | Environmental factors (Temperature) | - | Lower temperatures, higher relative humidity and lower heat stress index downwind compared to upwind |
| Smith and Moore, 2011 [54] | US | Cross-sectional | Recreationists in US | 247 Recreationists at Farmington River, 841 Recreationists at Chattooga River | Farmington River: 47.7 (13.8), Chattooga River: 41.0 (11.8) | Farmington River, Chattooga River | Distance to blue space | No | - | Environmental factors (Ecological quality) | Age, gender, income, race, education, trips within the past 12 months, miles travelled from home to river | Decreased self-perceived ecological benefits for increased proximity to river. |
| Roberts, van Lissa and Helbich, 2021 [55] | The Netherlands | Cross-sectional | People in the The Netherlands | 11,505 | 18–24 years old -> 1301 (11.3), 25–35 years old -> 2143 (18.6), 36–45 years old -> 1979 (17.2), 46–55 years old-> 2817 (24.5), 56–65 years old -> 3265 (28.4) | Self-perceived distance to blue space: “Less than 300 m”, “≥300 m to 1 km”, “≥1–5 km” and “≥5 km or more” | Distance | Y | Beta | Physical activity, Restoration | Age, sex, ethnic origin (Dutch, Western migration background, Non-Western migration background), marital status (married, separated/divorced, widow, never married), education level (low, medium, high), income quintile (1 = lowest quintile, 5 = highest quintile), and household type (single parent, couple without children, couple with children, other household type), urbanity, deprivation, and social fragmentation. | Increased days of being physically active for at least 30 min over the past 7 days for closer distance to blue space (At home group). Decreased days of being physically active for at least 30 min over the past 7 days for closer distance to blue space (Working group). Lower stress for closer distance to blue space (Working and at home groups) |
| Chen and Yuan, 2020 [56] | Guangzhou, China | Cross-sectional | Elderly individuals in Guangzhou, China | 966 | 69.33 (7.77) | NDWI (Normalised difference water index), distance to nearest water body, proportion of water area in a 1 km buffer zone of neighbourhood boundary, per capita water area | Distance to blue space, Amount of blue space | Y | Beta | Physical activity, restoration, social interaction, environmental factors | Age, gender, educational attainment, marital status, hukou status, monthly household income, employment information | More physical activity for higher proportion of water area, more per capita water area, closer distance to blue space. Less physical activity for more NDWI. Better SF-36, more stress scores for more NDWI. Less stress, better SF-36 scores for closer proximity to blue space. Better SF-36, lower stress scores for more proportion of water area. Worse SF-36 scores, more stress for more per capita water area. More social contact for more NDWI, proportion of water area, closer distance to blue space. Less social contact for more per capita water area. Better air quality for more NDWI, per capita water area, proportion of water area and closer distance to blue space. |
| Garrett et al., 2020 [28] | England, UK | Cross-sectional, cross-over | Adults in the UK | 1774 in accelerometer analysis, 18,447 main analysis | All aged 16+ | Residential coastal proximity categorised as <5 km, 5–20 km and >20 km. Percentage freshwater coverage of each LSOA from the CEH Land Cover Map 2007 and categorised as (0%, >0–1%, >1–5%, >5–100%). | Amount of blue space, Distance to blue space | Y | Odds Ratio (OR) | Physical activity | Equivalised household income, (a) area-level—neighbourhood deprivation (LSOA IMD; quintiles; most deprived = reference category); (b) household-level—number of children (none = ref.); access to car/van (has access = ref.); (c) individual-level—age (categorised in 20 year intervals; 16–34 = ref.); sex (female = ref.); highest qualification (none/foreign/other = ref.); employment status (in work/education = ref.); marital status (single = ref.); limiting illness (limiting illness = ref.); BMI (normal weight = ref.); smoking (current smoker = ref.); and (d) year of survey (2008 = ref). | Higher odds of meeting the physical activity guidelines for more freshwater coverage and closer distance to blue space. |
| Hooyberg et al., 2020 [57] | Belgium | Cross-sectional | People in Belgium | 60,939 | 42.7 | Residential proximity calculated as the distance travelled using the fastest driving route from the geographical centre of the residential municipality to the nearest point at the Belgian coast | Distance | Y | Beta | Physical activity, Restoration, Social Interaction | Age (< 20 year, 21–45 year = ref, 46–65 year, > 65 year), sex (male = ref, female), having a chronic disease (yes, no = ref, no answer), BMI (normal weight = ref, underweight, obesity class I, obesity class II, obesity class III), employment status (employed = ref, unemployed), income (quintile 1, quintile 2, quintile 3, quintile 4, quintile 5 = ref, no answer), smoking status (nonsmoker = ref, occasional smoker, daily smoker, no answer) and level of urbanization (urban = ref, sub-urban, rural), year (1997, 2001, 2004 = ref, 2008, 2013) and season (winter = ref, spring, summer, fall), blue space ratio, green space ratio | Lower physical activity for closer distance to blue space. Better GHQ-12 scores for closer distance to blue space. |
| Tan et al., 2021 [58] | Singapore | Cross-sectional | People in Singapore | 1471 | All participants aged 17+ | Cover of blue space around 250 m, 500 m, 1 km, 1.5 km from home | Amount of blue space | Y | Odds Ratio (OR), Beta | Physical Activity | Age, gender, highest education qualification, ethnicity, housing type, individual income/allowance, occupational status, number of hours spent at home, exercise choice, exercise frequency | Lower overall exercise frequency for more blue space. |
| Wang, Ettema and Helbich, 2020 [59] | The Netherlands | Cross-sectional | People in the Netherlands | 65,785 | 18–44 years old -> 38.00%, 45–64 years old -> 39.03%, 65+ years old -> 22.97% | Blue space around respondents’ home addresses for buffers with 300, 600, and 1000 m radius. | Amount of blue space | Y | Beta | Physical Activity | Age, level of education, household income, gender, ethnicity, possession of driving license, household composition, number of cars per household, number of e-bikes per household, number of mopeds per household | Less walking for more blue space in weekdays. More recreational walking for more blue space over the weekends. |
| Liu et al., 2020 [61] | China | Cross-sectional | People in Guangzhou, China | 1150 | 39.553 (11.065) | Ratio of blueness of street view images within a circular buffer of 1500 ms around the geocoded address of the central point for each sampled neighbourhood. 1500 m buffer area based on remote-sensing data from the GlobeLand30 dataset. | Amount of blue space | Y | Beta | Restoration, Social Interaction | Gender, age, educational attainment, marital status, hukou status, employment status, participation in medical insurance and average household income per household member | Better GHQ-12 scores for more blue space. Better neighbourhood attachment, neighbourly interaction, community participation for more blue space. |
| Stieger, Aichinger and Swami, 2020 [75] | Austria | Longitudinal | People in Austria | 107 | 26.9 (11.2) | Participants described their surroundings. Blue space defined as lake, sea, river, wetlands | Contact with blue space | Y | Beta | Restoration | Age, sex, CNS scores, and NES scores | Higher state body satisfaction, state body shape satisfaction, state physical appearance, happiness for more contact with blue space. |
| Subiza-Pérez, Vozmediano and San Juan, 2020 [62] | Spain | Cross-sectional | People in Donostia-San Sebastián (Spain) | 429 | 40.72 (17.82) | Participants reported use of blue spaces based on the natural environment scoring tool | Contact with blue space | N | - | Restoration | Gender, age, access, recreational facilities, amenities, natural features, aesthetics non-natural, incivilities, significant natural features, global score, usability, frequency of use (monthly and weekly), time of use, walking, meeting with friends and relatives, practicing physical activity, reading, landscape contemplation, walking the dog, spending time with dependants, sunbathing/enjoying the sun, eating/drinking something, perceived restorativeness, place attachment, place identification | Users of beaches had higher levels of attachment, identification, and experienced restoration than the participants surveyed in urban parks. |
| Vert et al., 2020 [69] | Spain | Cross-over | People in Spain | 59 | 29 (min = 19, max = 49) | Participants were randomly assigned to settings (blue spaces, urban areas, control room) | Contact with blue space | Y | Incidence Rate Ration (IRR) | Restoration | Gender, age, education, perceived household income, marital status, residential access to natural spaces (blue and/or green), views of blue spaces at work, access to private open space, blue space exposure during childhood, meeting physical activity WHO guidelines, BMI | Better subjective wellbeing, mood, WHO-5 wellbeing index, life satisfaction, eudaimonic wellbeing for more blue space contact. |
| Amirbeiki and Ghasr, 2020 [63] | Iran | Cross-sectional | Students in Yazd, Iran | 81 students | Participants 20 to 31 years old | Courtyards’ water pools | Contact with blue space | N | - | Restoration | Age, sex, year of study, length of visiting the courtyards | Blue space had the most significant influence on feelings of fascination and being away. |
| Chen et al., 2021 [76] | Taiwan | Longitudinal | People in Taiwan, Estuary areas in Taiwan | 2 rivers in Taiwan (Dajia and Da’an) | - | 2 rivers | Distance to blue space | N | - | Environmental factors | - | PM10 concentration increases considerably during both wet and dry seasons near the two rivers. |
| Lehnert et al., 2021 [64] | Czech Republic | Cross-sectional | People in Brno, Olomouc, Ostrava, Plzen, | 1522 | - | Fountains | Distance to blue space | N | - | Environmental factors | Biometeorological indices, activity, hour of the day | High thermal sensation vote near blue space. |
| Wu et al., 2019 [65] | Wuhan, China | Cross-sectional | People in Wuhan, China, 51 lakes | 51 lakes | - | Normalized difference water index (NDWI) | Amount of blue space | N | - | Environmental factors | - | The cooling effects of blue space are dependent on size and shape. Lower surface temperature for more blue space. |
| Garrett et al., 2019 [60] | Hong Kong | Cross-sectional | Adults in Hong Kong | 1000 | 80% of respondents were > 50 years old | Incidental exposure: question of “Do you usually pass by/through this [the nearest] blue space when commuting, to or from work/school/other daily activities?”. Intentional exposure: how often participants visited any blue spaces in the last four weeks. Self-reported measure of proximity within 10–15 min walk from participant’s home. Frequency of visit of the closest blue space to participant’s home. Water contact (direct or not contact with water) | Distance to blue space, Contact with blue space | Y | Odds Ratio (OR) | Restoration | District, physical functioning, age, access to garden, occupation, income, sex, meeting recommended physical activity, children living in household, marital status, dog ownership, others on visit to nearest blue space | Higher odds of higher WHO-5 wellbeing index, better recalled wellbeing for closer distance to blue space and more contact with blue space. |
Publisher’s Note: MDPI stays neutral with regard to jurisdictional claims in published maps and institutional affiliations. |
© 2021 by the authors. Licensee MDPI, Basel, Switzerland. This article is an open access article distributed under the terms and conditions of the Creative Commons Attribution (CC BY) license (http://creativecommons.org/licenses/by/4.0/).
Share and Cite
Georgiou, M.; Morison, G.; Smith, N.; Tieges, Z.; Chastin, S. Mechanisms of Impact of Blue Spaces on Human Health: A Systematic Literature Review and Meta-Analysis. Int. J. Environ. Res. Public Health 2021, 18, 2486. https://doi.org/10.3390/ijerph18052486
Georgiou M, Morison G, Smith N, Tieges Z, Chastin S. Mechanisms of Impact of Blue Spaces on Human Health: A Systematic Literature Review and Meta-Analysis. International Journal of Environmental Research and Public Health. 2021; 18(5):2486. https://doi.org/10.3390/ijerph18052486
Chicago/Turabian StyleGeorgiou, Michail, Gordon Morison, Niamh Smith, Zoë Tieges, and Sebastien Chastin. 2021. "Mechanisms of Impact of Blue Spaces on Human Health: A Systematic Literature Review and Meta-Analysis" International Journal of Environmental Research and Public Health 18, no. 5: 2486. https://doi.org/10.3390/ijerph18052486
APA StyleGeorgiou, M., Morison, G., Smith, N., Tieges, Z., & Chastin, S. (2021). Mechanisms of Impact of Blue Spaces on Human Health: A Systematic Literature Review and Meta-Analysis. International Journal of Environmental Research and Public Health, 18(5), 2486. https://doi.org/10.3390/ijerph18052486