
Analysis of Bicycle-Motor Vehicle Crashes in San Antonio, Texas


Abstract
:1. Introduction
2. Materials and Methods
3. Results and Discussion
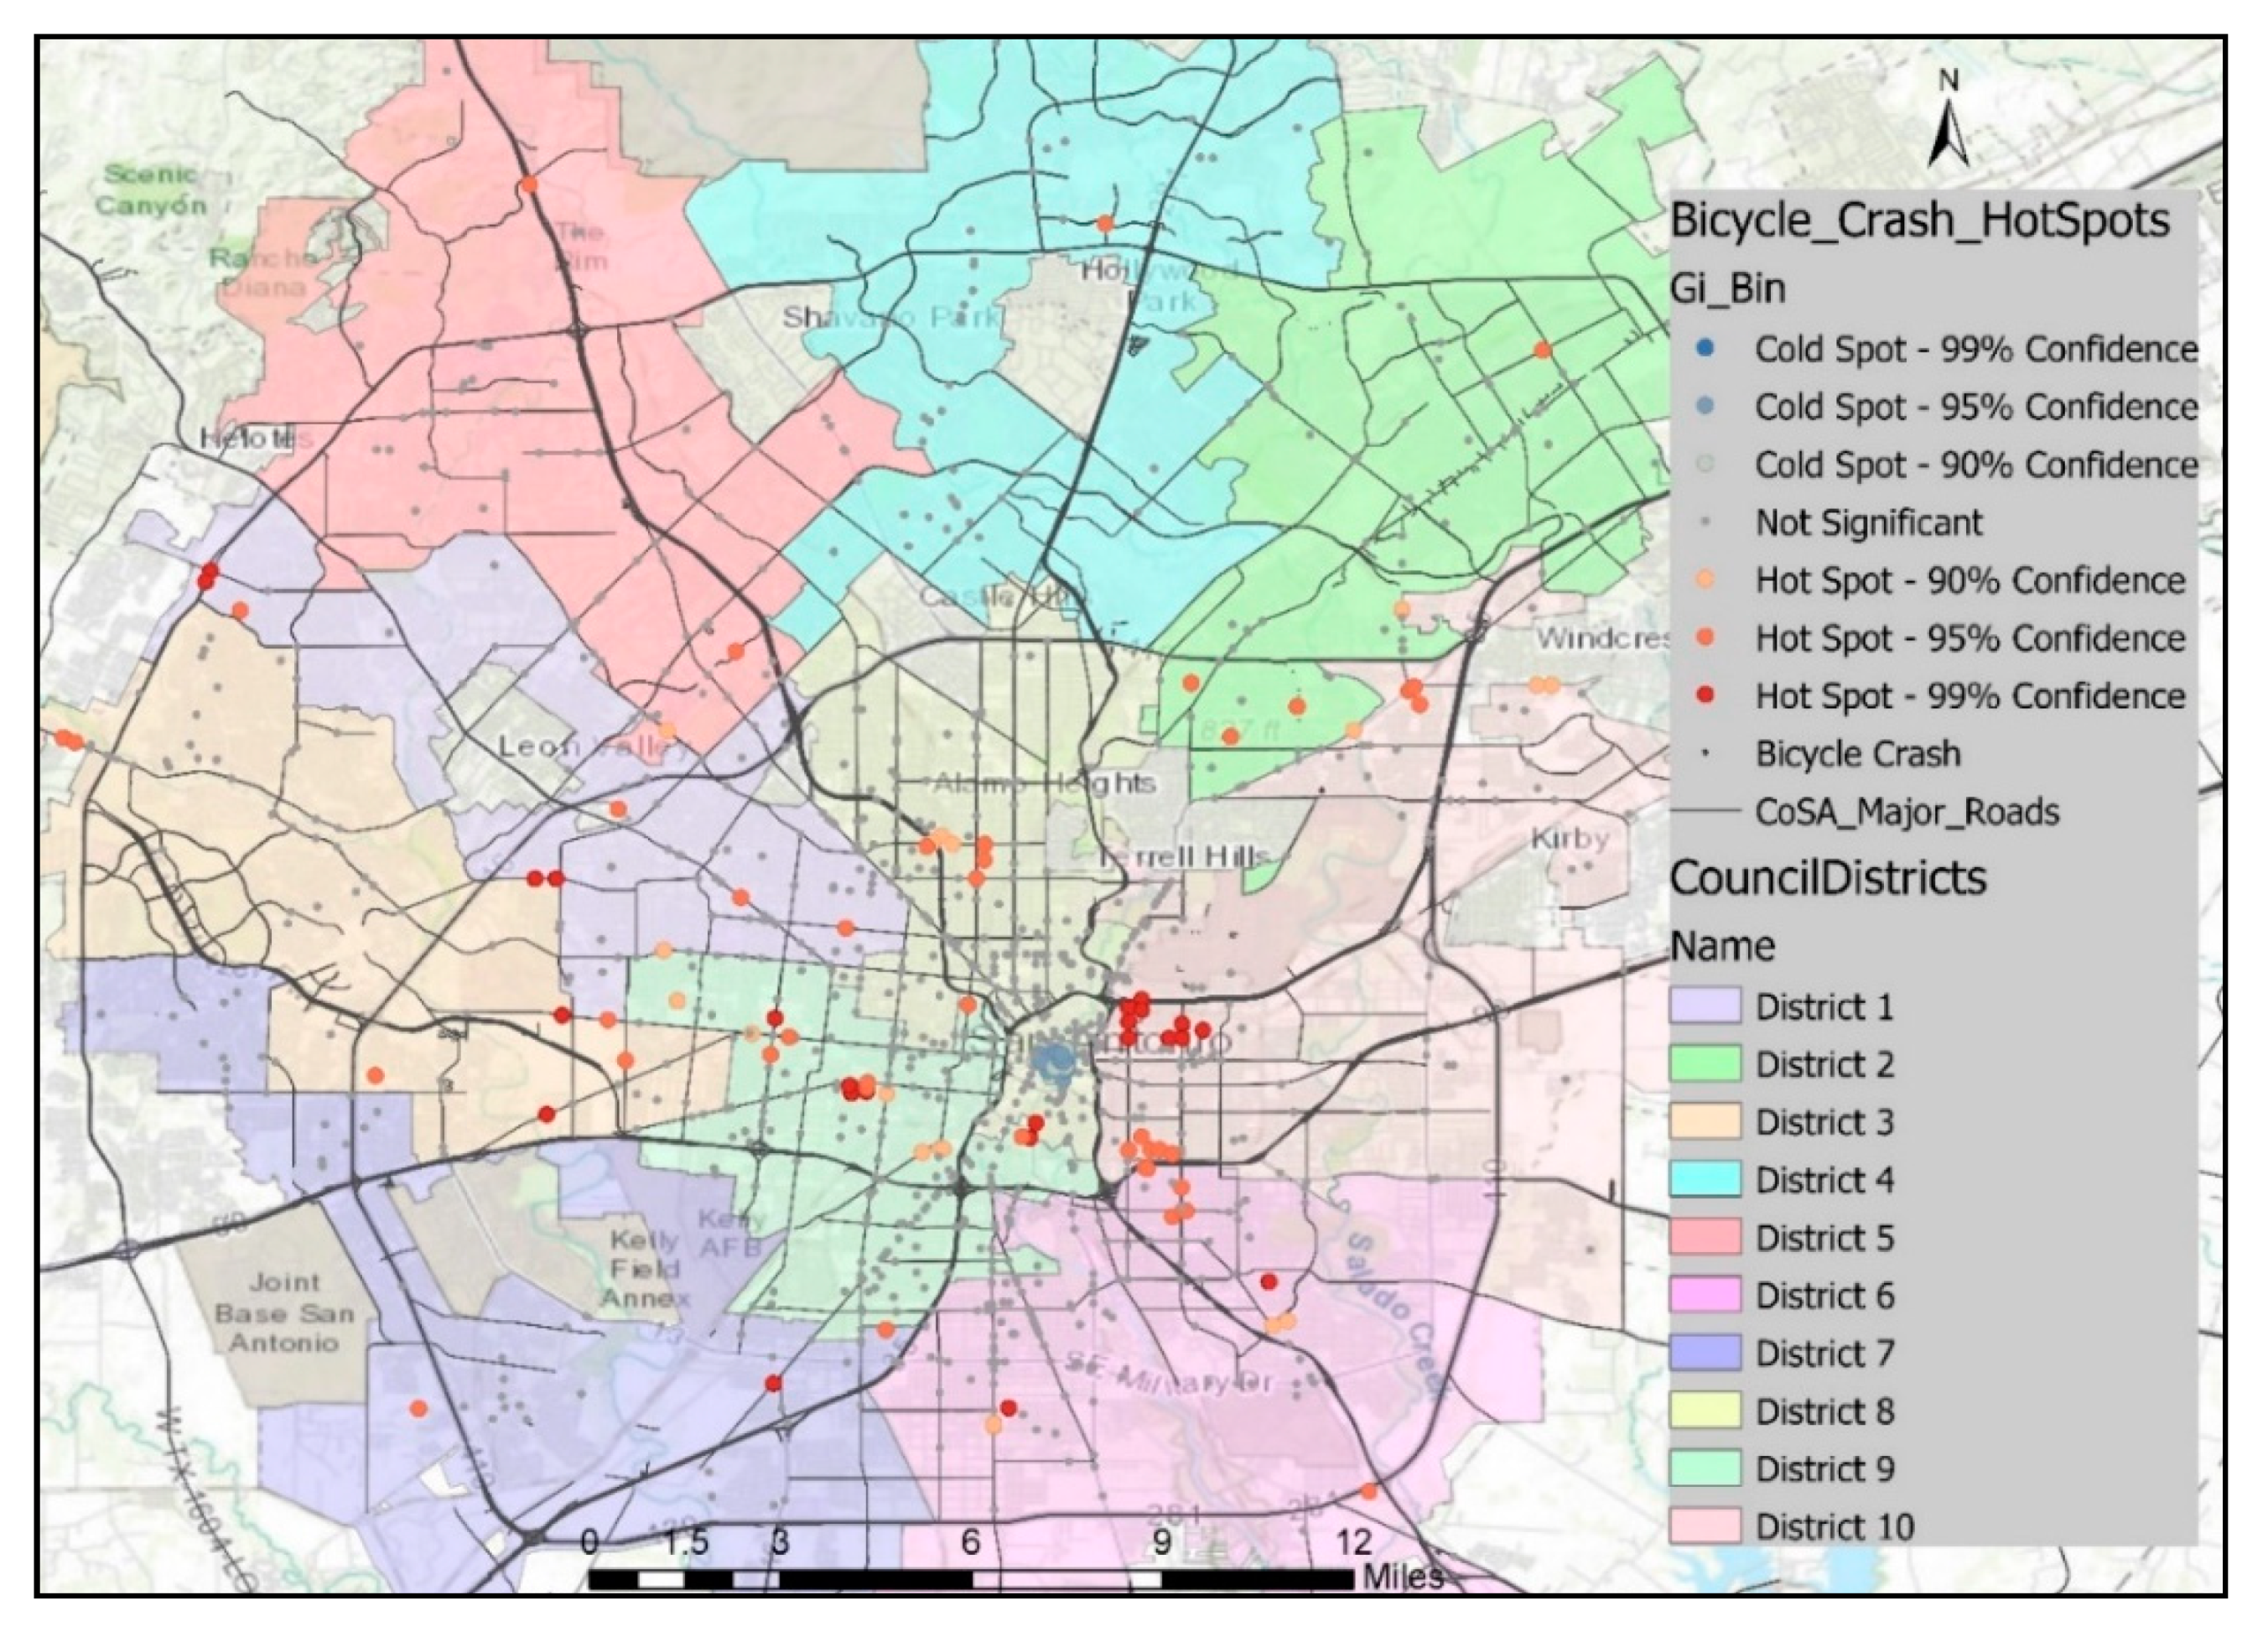
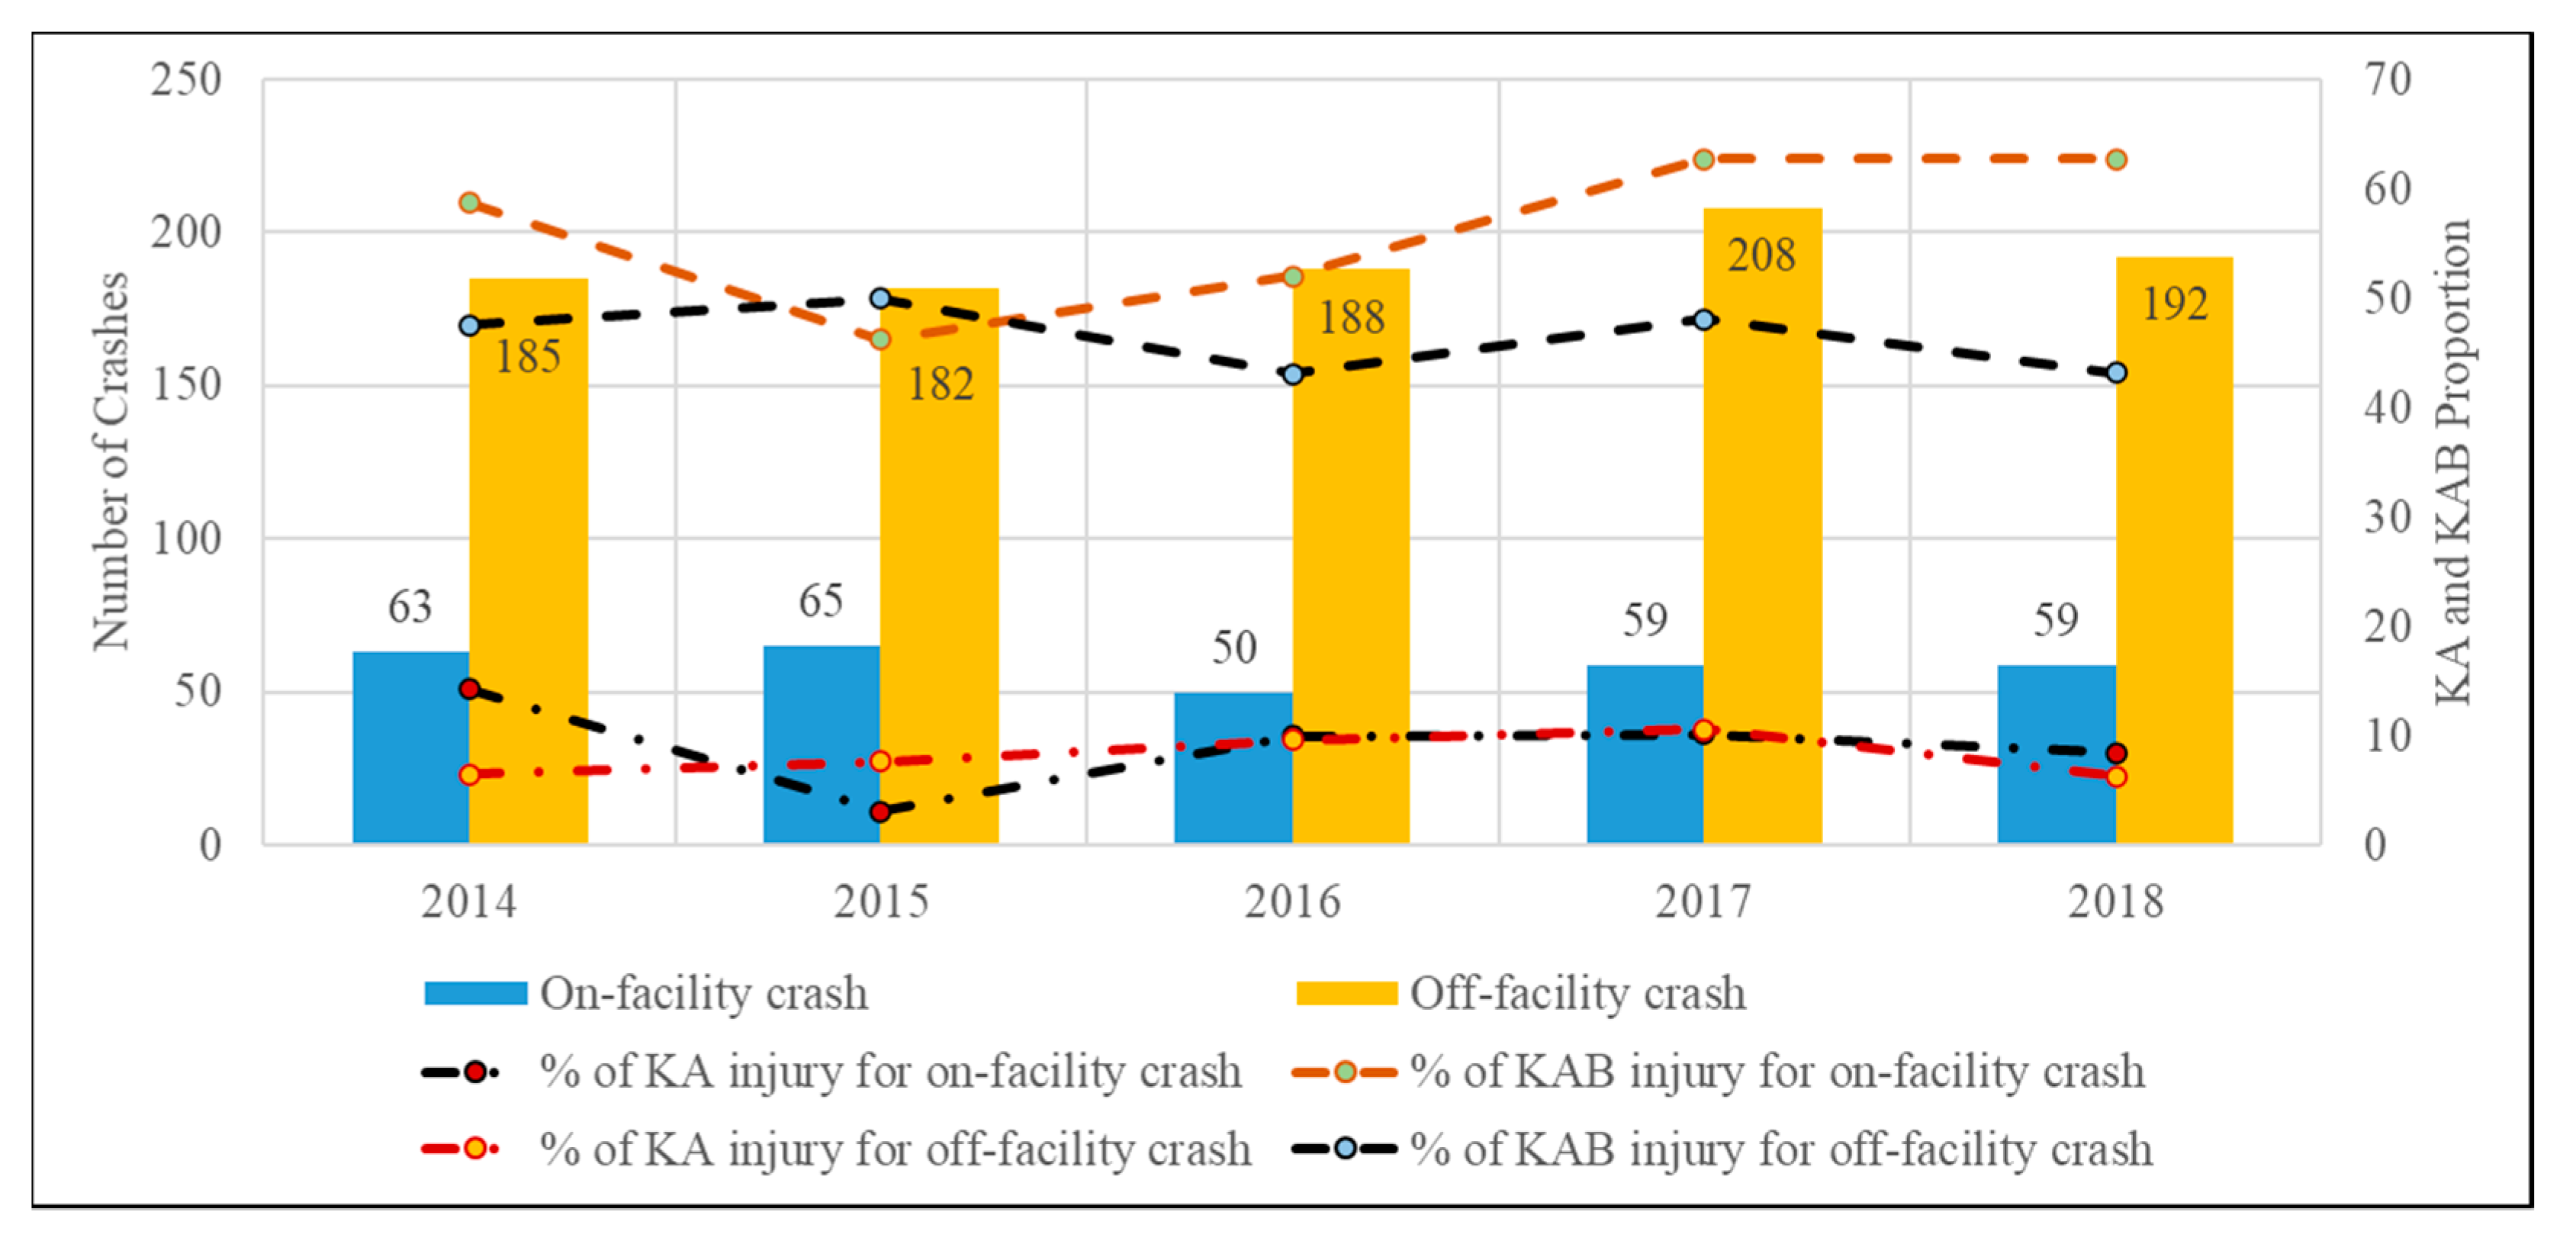
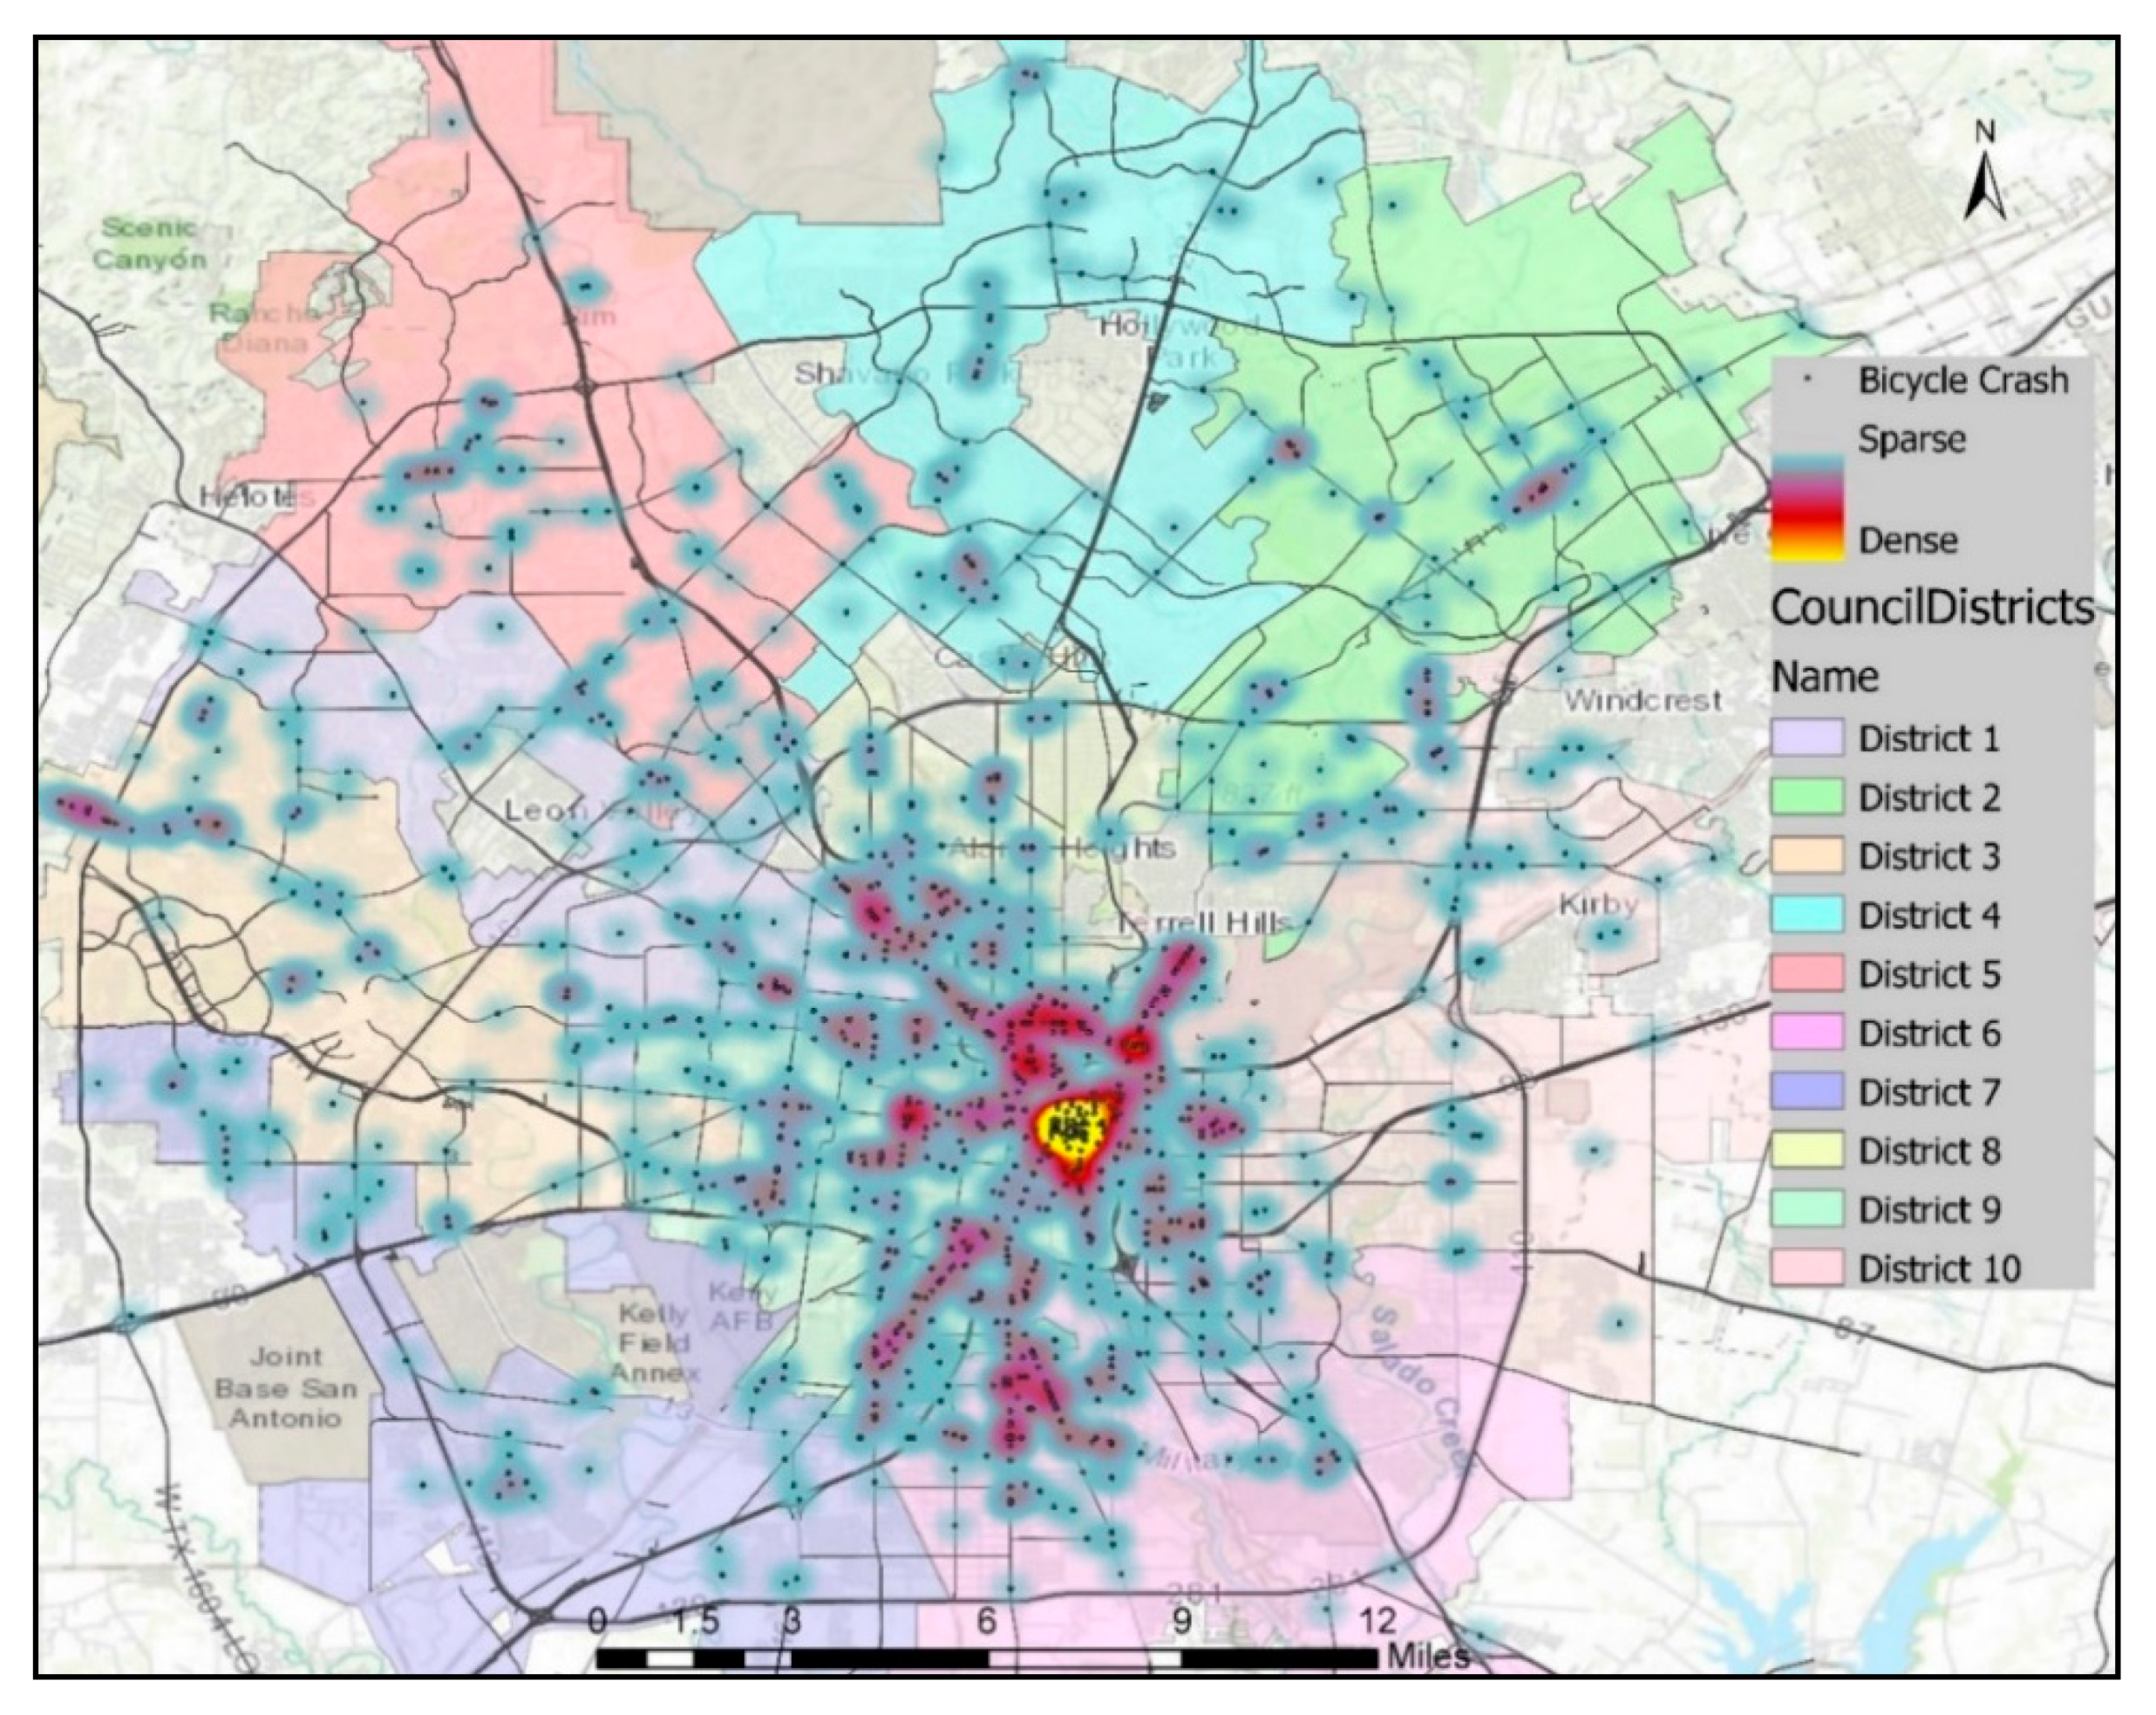
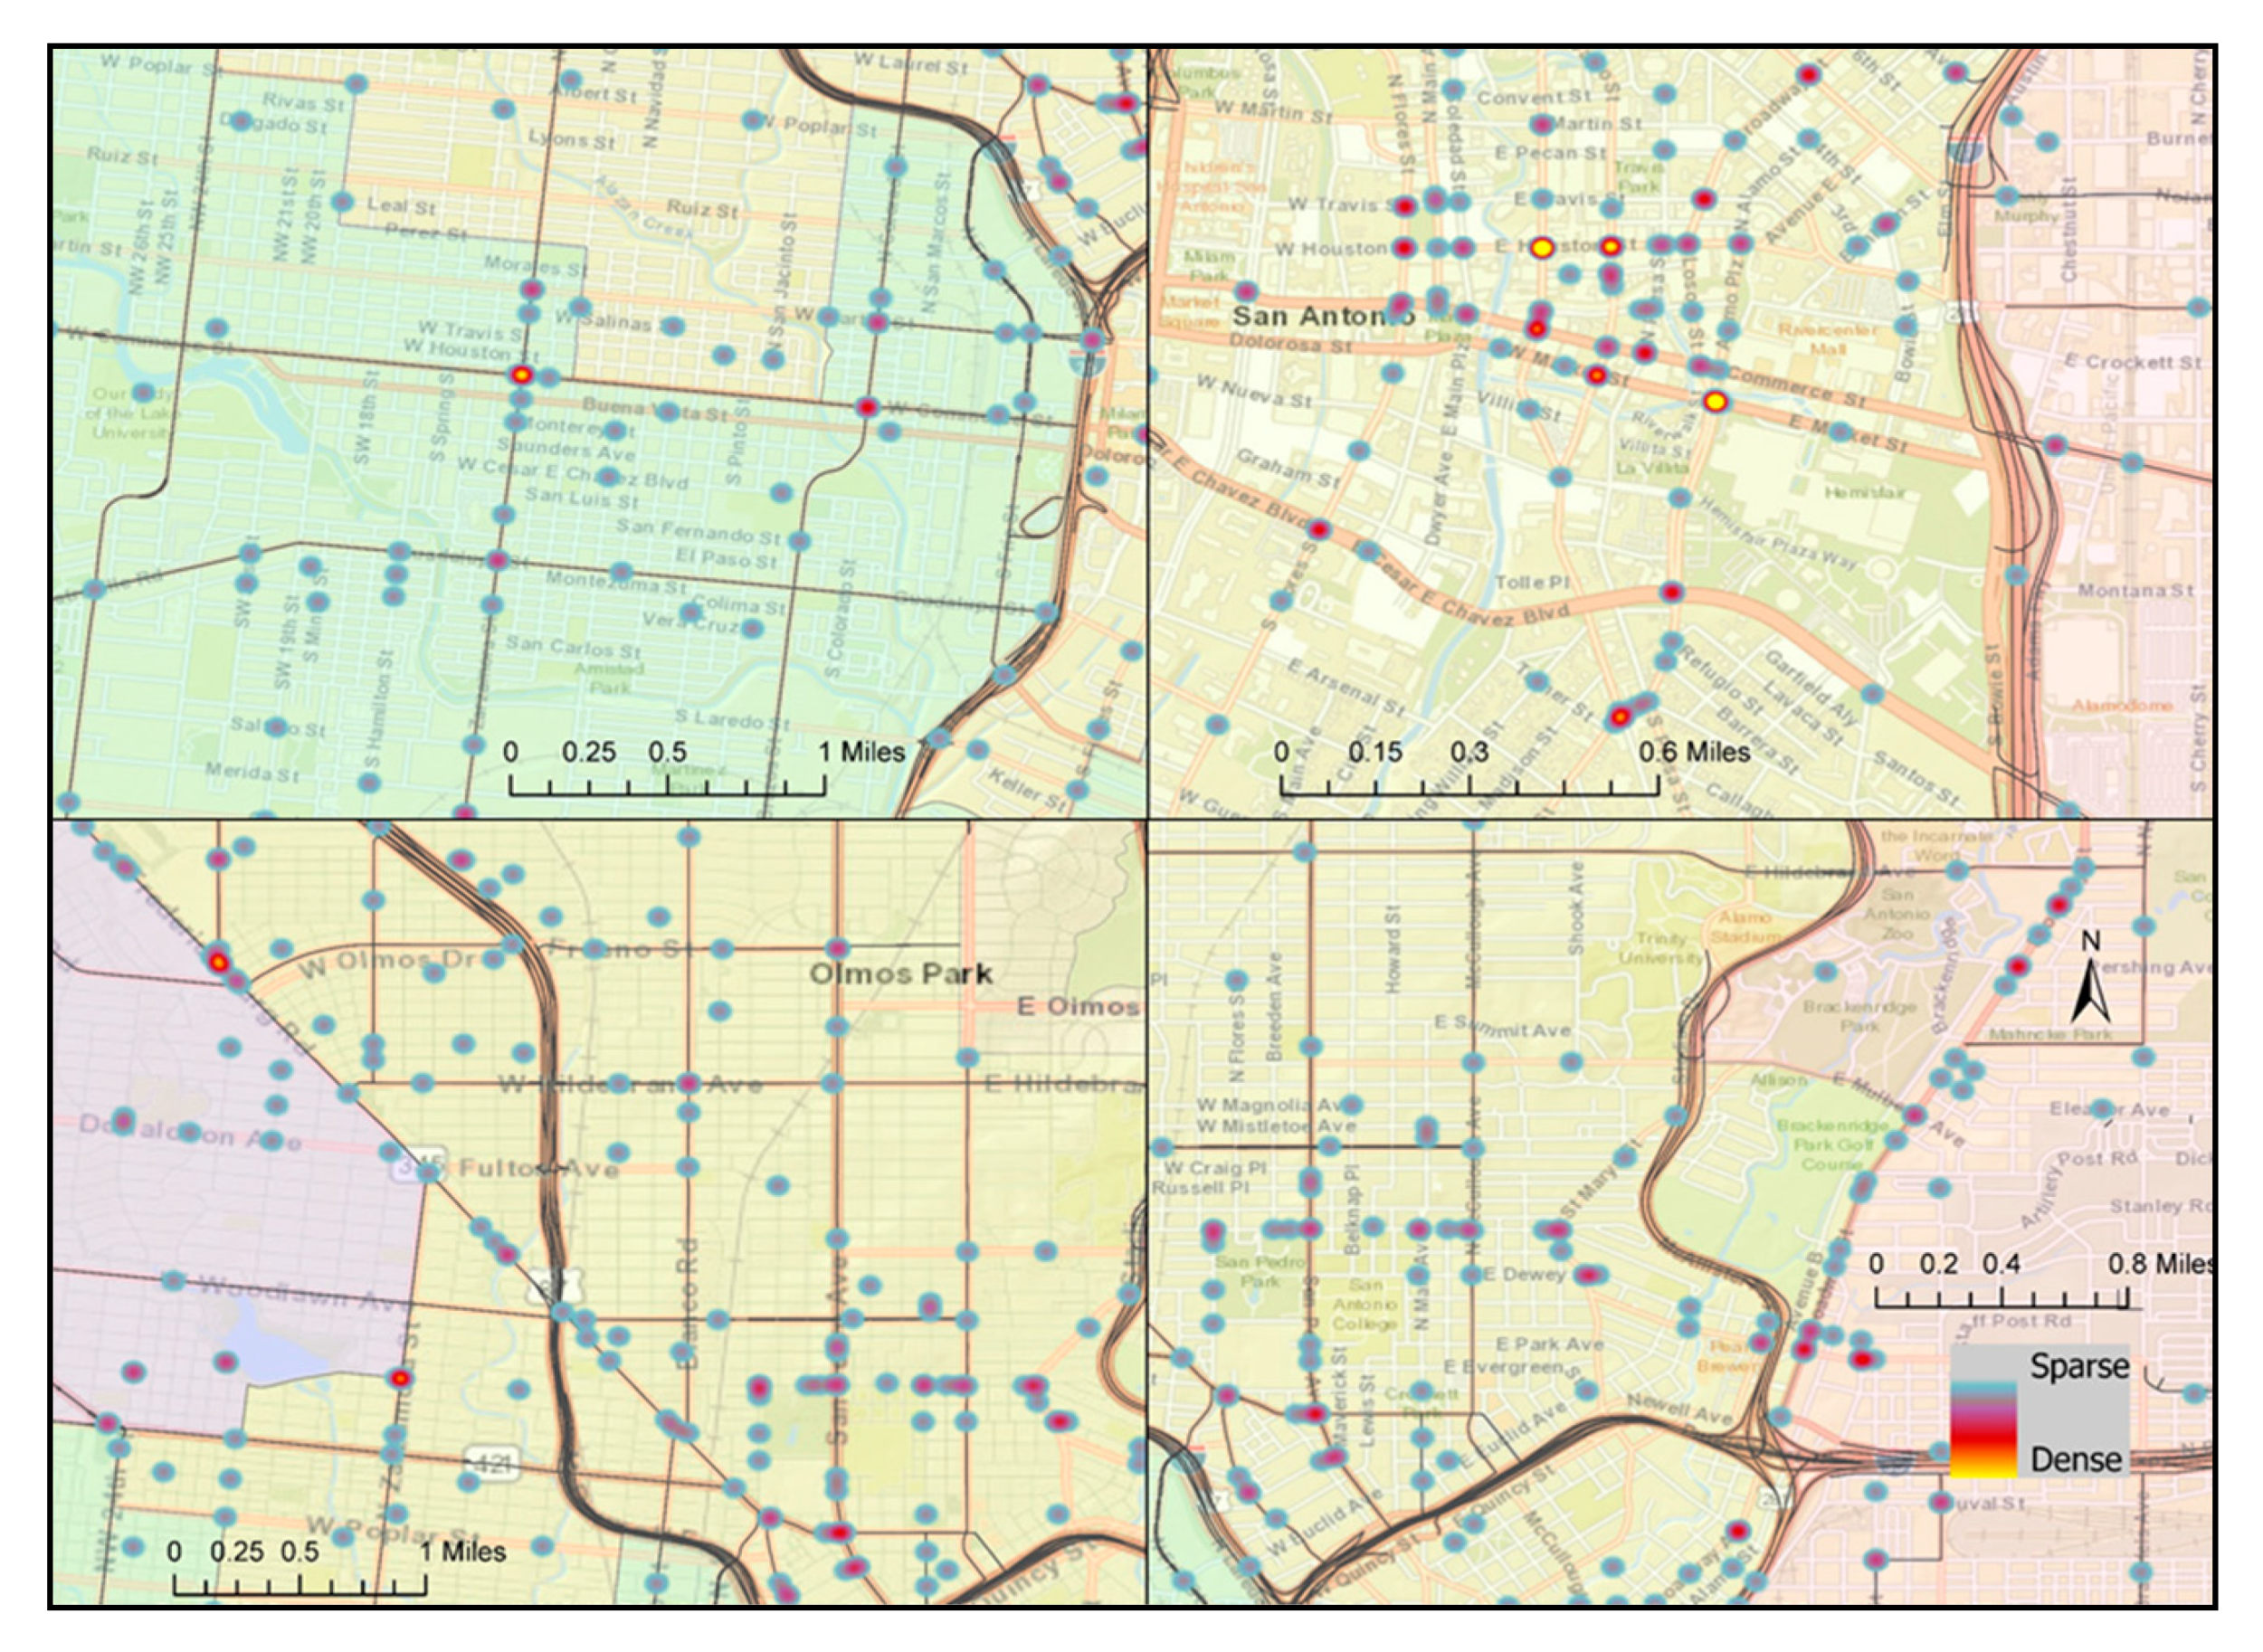
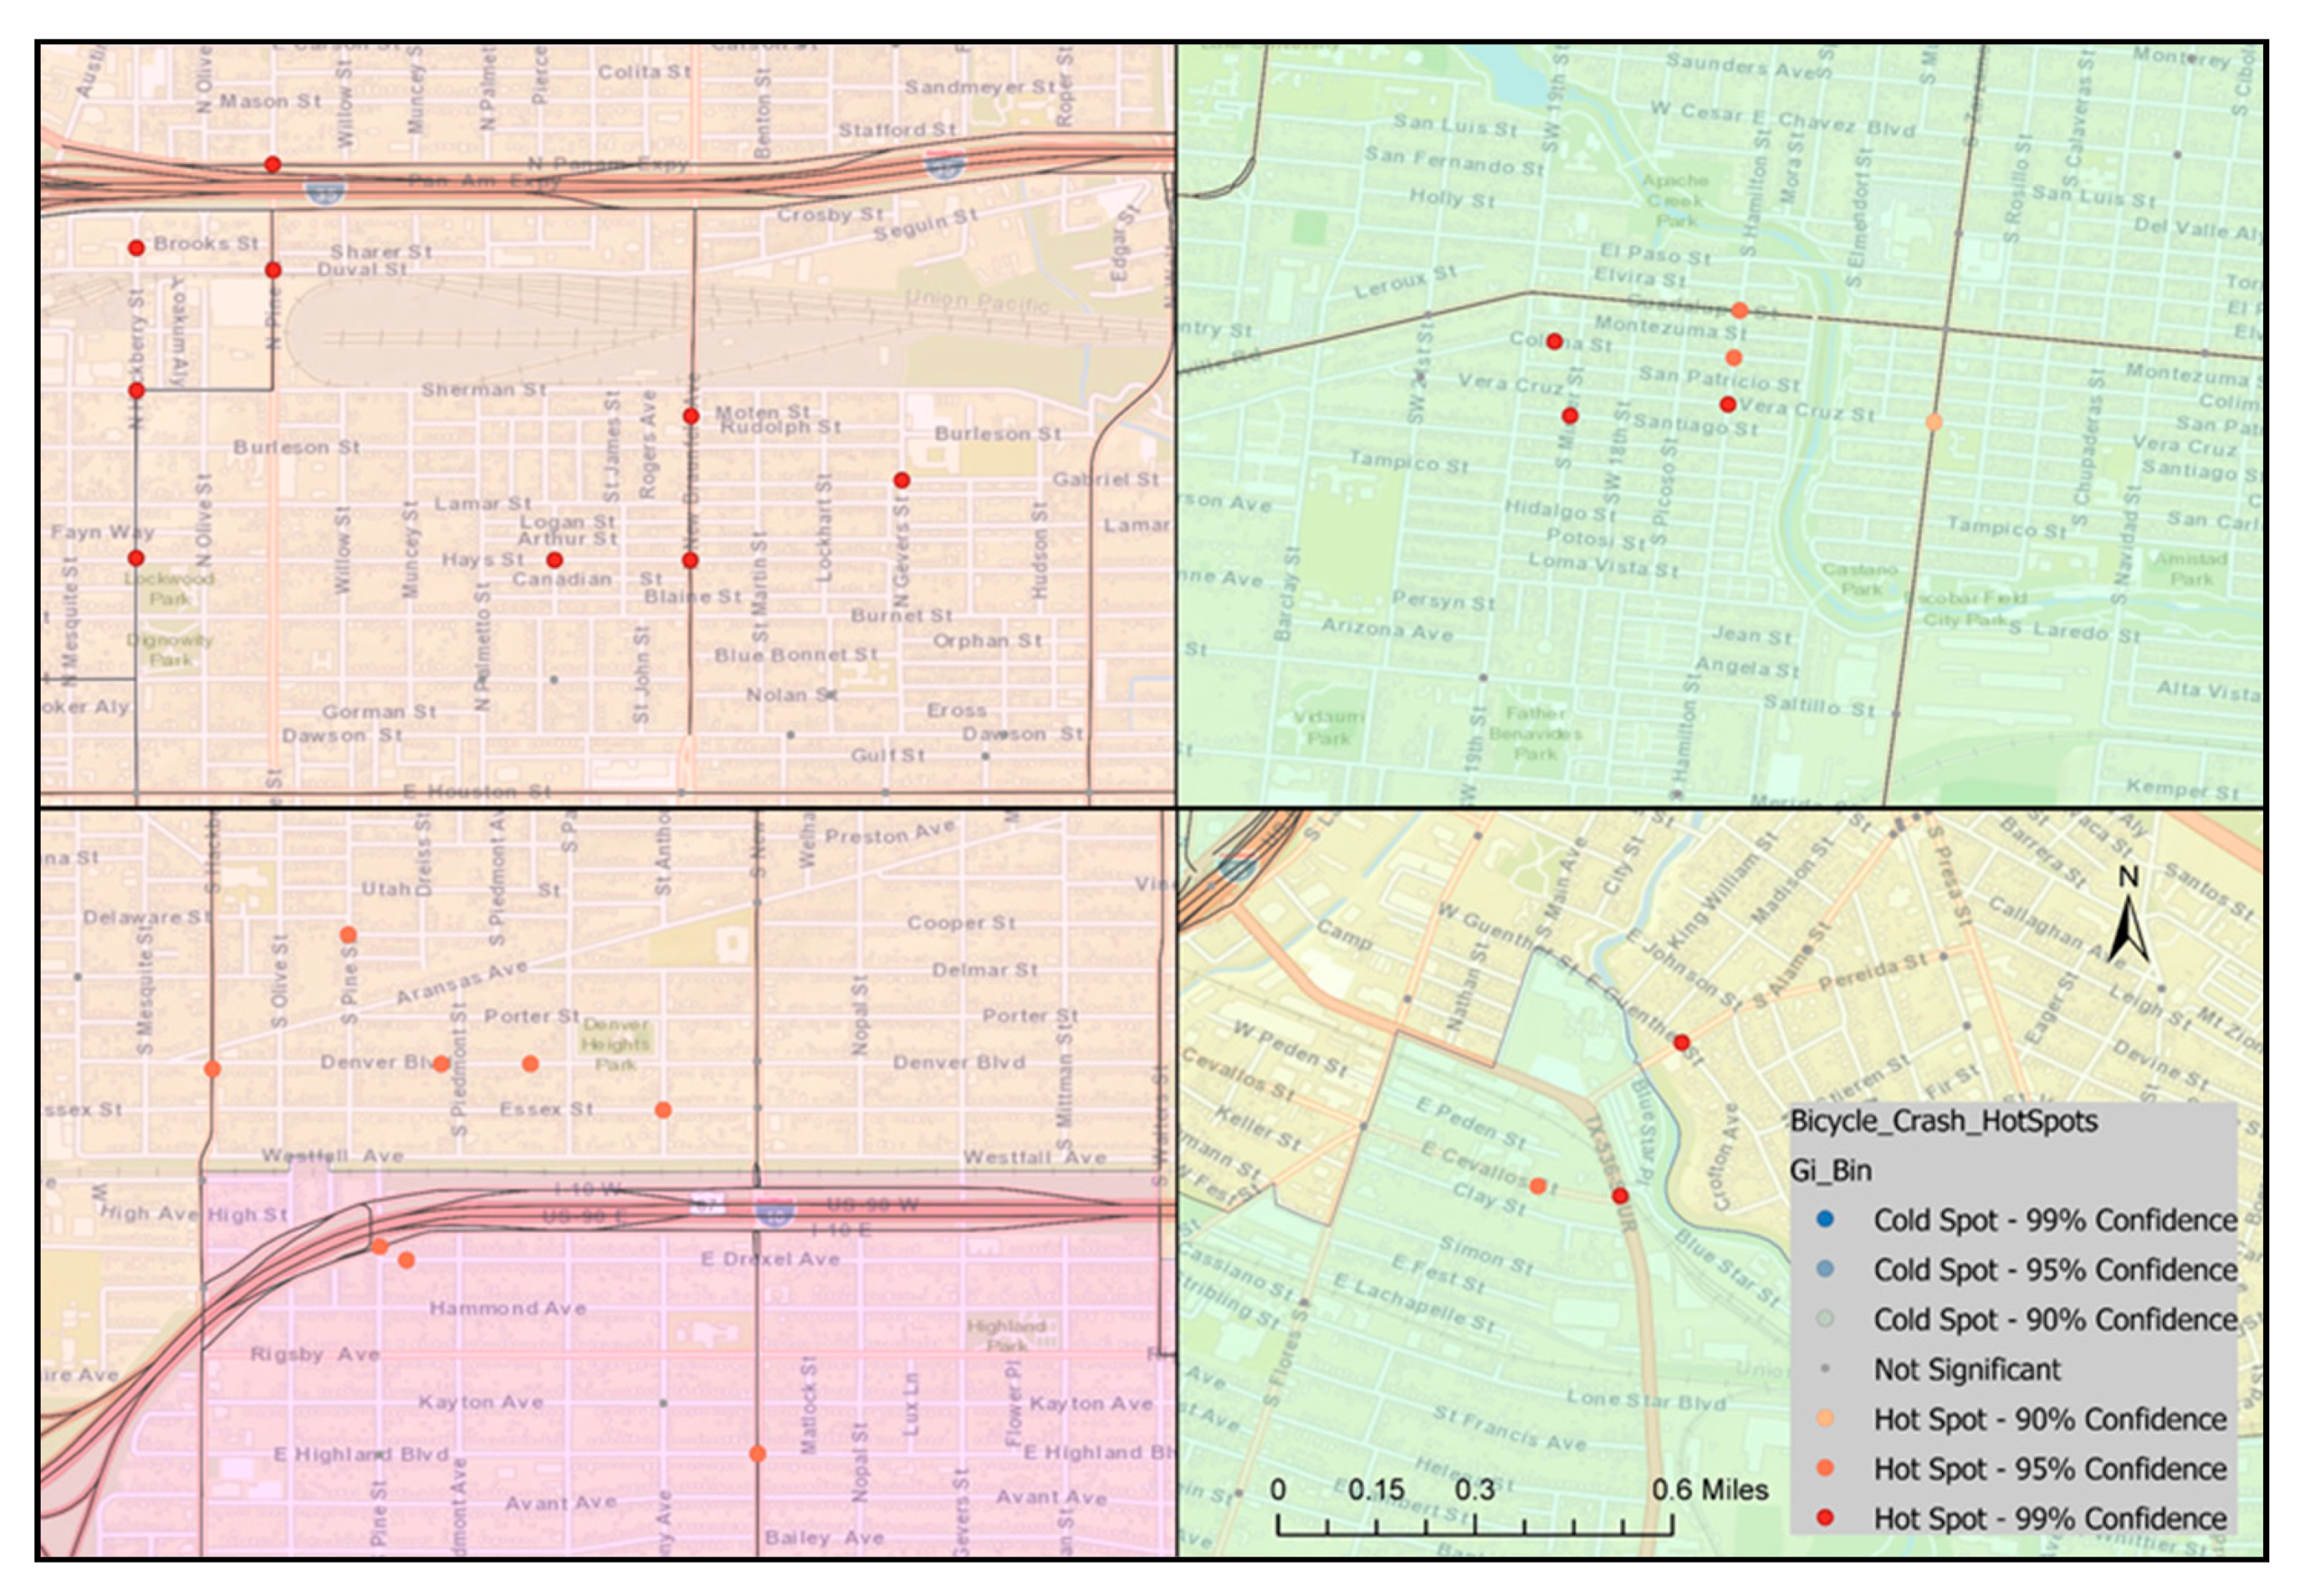
3.1. Spatial Analysis
3.2. General Characteristics of Bicycle Crashes
3.3. Bivariate Analysis
3.3.1. Environmental Factors
3.3.2. Time Factors
3.3.3. Road Factors
3.3.4. Bicyclist Factors
3.4. Logistic Regression Results
4. Conclusions
Author Contributions
Funding
Institutional Review Board Statement
Informed Consent Statement
Data Availability Statement
Conflicts of Interest
References
- Pucher, J.; Dill, J.; Handy, S. Infrastructure, programs, and policies to increase bicycling: An international review. Prev. Med. 2010, 50, S106–S125. [Google Scholar] [CrossRef]
- McKenzie, B. Modes Less Traveled: Commuting by Bicycle and Walking in the United States, 2008–2012. Available online: https://www.census.gov/prod/2014pubs/acs-25.pdf (accessed on 3 September 2016).
- Dill, J.; Carr, T. Bicycle Commuting and Facilities in Major U.S. Cities: If You Build Them, Commuters will Use Them. Available online: http://www.ltrc.lsu.edu/TRB_82/TRB2003-002134.pdf (accessed on 3 September 2016).
- Nelson, A.C.; Allen, D. If You Build Them, Commuters Will Use Them: Association Between Bicycle Facilities and Bicycle Commuting. Transp. Res. Rec. J. Transp. Res. Board 1997, 1578, 79–83. [Google Scholar] [CrossRef]
- Fishman, E.; Schepers, P. Global bike share: What the data tells us about road safety. J. Saf. Res. 2016, 56, 41–45. [Google Scholar] [CrossRef]
- Hamann, C.; Peek-Asa, C. On-road bicycle facilities and bicycle crashes in Iowa, 2007–2010. Accid. Anal. Prev. 2013, 56, 103–109. [Google Scholar] [CrossRef]
- Wang, T.; Chen, J.; Wang, C.; Ye, X. Understand e-bicyclist safety in China: Crash severity modeling using a generalized ordered logit model. Adv. Mech. Eng. 2018, 10. [Google Scholar] [CrossRef] [Green Version]
- Lee, J.; Abdel-Aty, M. Macro-level analysis of bicycle safety: Focusing on the characteristics of both crash location and residence. Int. J. Sustain. Transp. 2018, 12, 553–560. [Google Scholar] [CrossRef]
- Bicycle Accidents Rise in Emergency Rooms|Personal Injury Lawyers. (16 August 2019). Rhoades & Morrow. Available online: https://www.rhoadeslegal.com/2019/08/16/bicycle-accidents-rise-emergency-rooms/ (accessed on 28 July 2020).
- Sarmiento, K.; Haileyesus, T.; Waltzman, D.; Daugherty, J. Emergency Department Visits for Bicycle-Related Traumatic Brain Injuries among Children and Adults—United States, 2009–2018. Morb. Mortal. Wkly. Rep. 2021, 70, 693–697. [Google Scholar] [CrossRef] [PubMed]
- NHTSA. Traffic safety facts 2014 data. DOT HS 812 282, National Highway Traffic Administration. 2016. Available online: https://crashstats.nhtsa.dot.gov/api/public/viewpublication/812282 (accessed on 23 July 2021).
- Behnood, A.; Mannering, F. Determinants of bicyclist injury severities in bicycle-vehicle crashes: A random parameters approach with heterogeneity in means and variances. Anal. Methods Accid. Res. 2017, 16, 35–47. [Google Scholar] [CrossRef]
- U.S. Census Bureau QuickFacts: San Antonio city, Texas; Bexar County, Texas; United States. Retrieved 6 June 2021. Available online: https://www.census.gov/quickfacts/fact/table/sanantoniocitytexas,bexarcountytexas,US/PST045219 (accessed on 6 June 2021).
- Royall, E. Census Data: San Antonio Leads Nation in 2017 Population Growth. Rivard Report. 24 May 2018. Available online: https://therivardreport.com/census-data-san-antonio-leads-nation-in-2017-population-growth/ (accessed on 13 July 2021).
- City of San Antonio, San Antonio Bike Plan 2011 + Implementation Strategy. September 2011. Available online: https://www.sanantonio.gov/Portals/0/Files/SABikes/NewsReleases/BikeMasterPlan2013-ImplementationUpdate-20131204.pdf (accessed on 25 July 2021).
- Oja, P.; Titze, S.; Bauman, A.; De Geus, B.; Krenn, P.; Reger-Nash, B.; Kohlberger, T. Health benefits of cycling: A systematic review. Scand. J. Med. Sci. Sports 2011, 21, 496–509. [Google Scholar] [CrossRef] [PubMed]
- Lee, J.; Abdel-Aty, M.; Jiang, X. Multivariate crash modeling for motor vehicle and non-motorized modes at the macroscopic level. Accid. Anal. Prev. 2015, 78, 146–154. [Google Scholar] [CrossRef]
- Lee, J.; Abdel-Aty, M.; Choi, K.; Siddiqui, C. Analysis of residence characteristics of drivers, pedestrians, and bicyclists involved in traffic crashes. In Proceedings of the Transportation Research Board 92nd Annual Meeting, Washington, DC, USA, 13–17 January 2013. [Google Scholar]
- Abdel-Aty, M.; Siddiqui, C.; Huang, H.; Wang, X. Integrating Trip and Roadway Characteristics to Manage Safety in Traffic Analysis Zones. Transp. Res. Rec. J. Transp. Res. Board 2011, 2213, 20–28. [Google Scholar] [CrossRef] [Green Version]
- Milton, J.; Mannering, F. Relationship among highway geometric, traffic-related elements, and motor-vehicle accident frequencies. In Proceedings of the 76th Annual Meeting of the Transportation Research Board, Washington, DC, USA, November 1998; pp. 395–413. [Google Scholar]
- Obeng, K. Injury Severity, Vehicle Safety Features, and Intersection Crashes. Traffic Inj. Prev. 2008, 9, 268–276. [Google Scholar] [CrossRef] [PubMed]
- Tay, R.; Rifaat, S. Factors contributing to the severity of intersection crashes. J. Adv. Transp. 2007, 41, 245–265. [Google Scholar] [CrossRef]
- Chin, H.C.; Quddus, M. Applying the random effect negative binomial model to examine traffic accident occurrence at signalized intersections. Accid. Anal. Prev. 2003, 35, 253–259. [Google Scholar] [CrossRef]
- Huang, H.; Chin, H.C.; Haque, M.M. Severity of driver injury and vehicle damage in traffic crashes at intersections: A Bayesian hierarchical analysis. Accid. Anal. Prev. 2008, 40, 45–54. [Google Scholar] [CrossRef]
- Hilakivi, I.; Veilahti, J.; Asplund, P.; Sinivuo, J.; Laitinen, L.; Koskenvuo, K. A sixteen-factor personality test for predicting automobile driving accidents of young drivers. Accid. Anal. Prev. 1989, 21, 413–418. [Google Scholar] [CrossRef]
- Mercier, C.R.; Shelley, M.; Rimkus, J.B.; Mercier, J.M. Age and Gender as Predictors of Injury Severity in Head-on Highway Vehicular Collisions. Transp. Res. Rec. J. Transp. Res. Board 1997, 1581, 37–46. [Google Scholar] [CrossRef]
- Loo, B.P.; Tsui, K. Bicycle crash casualties in a highly motorized city. Accid. Anal. Prev. 2010, 42, 1902–1907. [Google Scholar] [CrossRef] [PubMed]
- Lusk, A.C.; Asgarzadeh, M.; Farvid, M.S. Database improvements for motor vehicle/bicycle crash analysis. Inj. Prev. 2015, 21, 221–230. [Google Scholar] [CrossRef] [Green Version]
- Pedroso, F.E.; Angriman, F.; Bellows, A.L.; Taylor, K. Bicycle Use and Cyclist Safety Following Boston’s Bicycle Infrastructure Expansion, 2009–2012. Am. J. Public Heal. 2016, 106, 2171–2177. [Google Scholar] [CrossRef] [PubMed]
- Hu, F.; Lv, D.; Zhu, J.; Fang, J. Related Risk Factors for Injury Severity of E-bike and Bicycle Crashes in Hefei. Traffic Inj. Prev. 2014, 15, 319–323. [Google Scholar] [CrossRef] [PubMed]
- Truong, L.T.; Nguyen, H.T.; De Gruyter, C. Mobile phone use among motorcyclists and electric bike riders: A case study of Hanoi, Vietnam. Accid. Anal. Prev. 2016, 91, 208–215. [Google Scholar] [CrossRef] [PubMed]
- Savolainen, P.; Mannering, F. Probabilistic models of motorcyclists’ injury severities in single- and multi-vehicle crashes. Accid. Anal. Prev. 2007, 39, 955–963. [Google Scholar] [CrossRef] [PubMed]
- Salon, D.; McIntyre, A. Determinants of pedestrian and bicyclist crash severity by party at fault in San Francisco, CA. Accid. Anal. Prev. 2018, 110, 149–160. [Google Scholar] [CrossRef]
- Ulfarsson, G.F.; Kim, S.; Booth, K.M. Analyzing fault in pedestrian–motor vehicle crashes in North Carolina. Accid. Anal. Prev. 2010, 42, 1805–1813. [Google Scholar] [CrossRef] [PubMed]
- Petritsch, T.A.; Landis, B.W.; Huang, H.F.; Challa, S. Sidepath Safety Model: Bicycle Sidepath Design Factors Affecting Crash Rates. Transp. Res. Rec. J. Transp. Res. Board 2006, 1982, 194–201. [Google Scholar] [CrossRef]
- Hunter, W.; Stewart, J.; Stutts, J. Study of Bicycle Lanes versus Wide Curb Lanes. Transp. Res. Rec. J. Transp. Res. Board 1999, 1674, 70–77. [Google Scholar] [CrossRef]
- Walker, I. Drivers overtaking bicyclists: Objective data on the effects of riding position, helmet use, vehicle type and apparent gender. Accid. Anal. Prev. 2007, 39, 417–425. [Google Scholar] [CrossRef]
- Pucher, J.; Dijkstra, L. Making walking and cycling safer: Lessons from Europe. Transp. Q. 2000, 54, 25–50. [Google Scholar]
- Liu, S.; Fan, W. (David) Investigating factors affecting injury severity in bicycle–vehicle crashes: A day-of-week analysis with partial proportional odds logit models. Can. J. Civ. Eng. 2021, 48, 941–947. [Google Scholar] [CrossRef]
- Zhu, S. Analysis of the severity of vehicle-bicycle crashes with data mining techniques. J. Saf. Res. 2021, 76, 218–227. [Google Scholar] [CrossRef] [PubMed]
- Billah, K.; Adegbite, Q.; Sharif, H.; Dessouky, S.; Simcic, L. Analysis of Intersection Traffic Safety in the City of San Antonio, 2013–2017. Sustainability 2021, 13, 5296. [Google Scholar] [CrossRef]
- Yan, X.; Ma, M.; Huang, H.; Abdel-Aty, M.; Wu, C. Motor vehicle–bicycle crashes in Beijing: Irregular maneuvers, crash patterns, and injury severity. Accid. Anal. Prev. 2011, 43, 1751–1758. [Google Scholar] [CrossRef] [PubMed]
- Klop, J.R.; Khattak, A. Factors Influencing Bicycle Crash Severity on Two-Lane, Undivided Roadways in North Carolina. Transp. Res. Rec. J. Transp. Res. Board 1999, 1674, 78–85. [Google Scholar] [CrossRef]
- Billah, K.; Sharif, H.O.; Dessouky, S. Analysis of Pedestrian–Motor Vehicle Crashes in San Antonio, Texas. Sustainability 2021, 13, 6610. [Google Scholar] [CrossRef]
- Environmental Systems Research Institute (ESRI). ArcGIS Pro Tool Reference. Density Toolset Concept. 2014. Available online: https://pro.arcgis.com/en/pro-app/tool-reference/spatial-analyst/how-kernel-density-works (accessed on 18 April 2020).
- Chainey, S.; Ratcliffe, J. GIS and Crime Mapping; John Wiley & Sons: Hoboken, NJ, USA, 2013. [Google Scholar]
- Silverman, B.W. Density Estimation for Statistics and Data Analysis; CRC Press: Boca Raton, FL, USA, 1986. [Google Scholar]
- Vemulapalli, S.S. GIS-based spatial and temporal analysis of aging-involved crashes in Florida. Doctoral Dissertation, The Florida State University, Florida, FL, USA, 2015. [Google Scholar]
- Harirforoush, H.; Bellalite, L. A new integrated GIS-based analysis to detect hotspots: A case study of the city of Sherbrooke. Accid. Anal. Prev. 2019, 130, 62–74. [Google Scholar] [CrossRef]
- Young, J.; Park, P.Y. Hotzone identification with GIS-based post-network screening analysis. J. Transp. Geogr. 2014, 34, 106–120. [Google Scholar] [CrossRef]
- Plug, C.; Xia, J.C.; Caulfield, C. Spatial and temporal visualization techniques for crash analysis. Accid. Anal. Prev. 2011, 43, 1937–1946. [Google Scholar] [CrossRef]
- Truong, L.T.; Somenahalli, S. Using GIS to Identify Pedestrian-Vehicle Crash Hot Spots and Unsafe Bus Stops. J. Public Transp. 2011, 14, 99–114. [Google Scholar] [CrossRef] [Green Version]
- RTA. Road Traffic Accidents in NSW–1993; Roads and Traffic Authority of NSW: Sydney, Australia, 1994. [Google Scholar]
- Geurts, K.; Wets, G.; Brijs, T.; Vanhoof, K. Identification and Ranking of Black Spots: Sensitivity Analysis. Transp. Res. Rec. J. Transp. Res. Board 2004, 1897, 34–42. [Google Scholar] [CrossRef]
- Harris, M.A.; Reynolds, C.C.O.; Winters, M.; Cripton, P.A.; Shen, H.; Chipman, M.L.; Cusimano, M.D.; Babul, S.; Brubacher, J.R.; Friedman, S.M.; et al. Comparing the effects of infrastructure on bicycling injury at intersections and non-intersections using a case–crossover design. Inj. Prev. 2013, 19, 303–310. [Google Scholar] [CrossRef]
- Selcraig, B. San Antonio Traffic Deaths Spiked in 2016—But Dropped in 2017. ExpressNews.Com. 23 February 2018. Available online: https://www.expressnews.com/news/local/article/San-Antonio-traffic-deaths-spiked-in-2016-but-12703608.php (accessed on 18 July 2021).
- Scott, L.R.; Bazargan-Hejazi, S.; Shirazi, A.; Pan, D.; Lee, S.; Teruya, S.A.; Shaheen, M. Helmet use and bicycle-related trauma injury outcomes. Brain Inj. 2019, 33, 1597–1601. [Google Scholar] [CrossRef] [PubMed]
- Harper, J.S.; Marine, W.M.; Garrett, C.J.; Lezotte, D.; Lowenstein, S.R. Motor vehicle crash fatalities: A comparison of hispanic and non-hispanic motorists in colorado. Ann. Emerg. Med. 2000, 36, 589–596. [Google Scholar] [CrossRef] [PubMed]
- Texas Bicycle Law. BikeDFW. Available online: http://www.bikedfw.org/texas-bicycle-law.html (accessed on 28 June 2021).
- Gårder, P.; Leden, L.; Pulkkinen, U. Measuring the Safety Effect of Raised Bicycle Crossings Using a New Research Methodology. Transp. Res. Rec. J. Transp. Res. Board 1998, 1636, 64–70. [Google Scholar] [CrossRef] [Green Version]


| Num. | Description | Values | Num. | Description | Values |
|---|---|---|---|---|---|
| 1 | Day of Week | Weekend | 7 | Speed limit | ≤25 mph |
| Weekday | >25 mph | ||||
| 2 | Season | Winter | 8 | Collision type | Going straight |
| Spring | Turning | ||||
| Summer | Other roads | ||||
| Fall | 10 | Gender | Male | ||
| 3 | Time of Day | 8 p.m.–6 a.m. | Female | ||
| 6 a.m.–8 p.m. | 11 | Age | ≤18 | ||
| 4 | Lighting condition | Daylight | 19–64 | ||
| Dark | ≥65 | ||||
| 5 | Weather condition | Rain | 12 | Ethnicity | Non-Hispanic |
| No rain | 13 | Helmet status | Wearing | ||
| 6 | Intersection presence | Yes | Not wearing | ||
| No |
| All Bicyclists | Not at Fault | At Fault | On Facility | Off Facility | |||||||||||
|---|---|---|---|---|---|---|---|---|---|---|---|---|---|---|---|
| N | KA | KAB | N | KA | KAB | N | KA | KAB | N | KA | KAB | N | KA | KAB | |
| Overall | 1528 | 7.9 | 47.4 | 959 | 8.7 | 48.6 | 569 | 6.7 | 45.5 | 296 | 9.1 | 56.4 | 955 | 8.4 | 46.6 |
| Daylight | 1061 | 6.4 | 45.4 | 640 | 6.6 | 45.6 | 421 | 6.2 | 45.1 | 199 | 9.0 | 55.3 | 644 | 6.5 | 44.9 |
| Dark | 417 | 12.0 | 50.6 | 286 | 13.3 | 52.1 | 131 | 9.1 | 47.3 | 87 | 8.0 | 57.5 | 282 | 13.1 | 48.9 |
| Rain | 49 | 12.2 | 40.8 | 38 | 13.2 | 36.8 | 11 | 9.1 | 54.5 | 5 | NA | 40.0 | 35 | 8.6 | 40.0 |
| No rain | 1473 | 7.8 | 47.7 | 915 | 8.6 | 49.1 | 558 | 6.6 | 45.3 | 290 | 9.3 | 56.6 | 916 | 8.4 | 46.9 |
| Highway/FM | 202 | 10.4 | 52.5 | 143 | 12.6 | 54.5 | 59 | 5.1 | 47.5 | 20 | 10.2 | 54.8 | 180 | 10.5 | 52.2 |
| Other roads | 1299 | 7.3 | 46.6 | 700 | 8.1 | 48.2 | 499 | 7.0 | 36.8 | 273 | 8.8 | 54.5 | 747 | 7.6 | 45.0 |
| ≤25 mph | 202 | 5.4 | 40.6 | 210 | 8.1 | 46.2 | 70 | 5.7 | 41.4 | 17 | 5.9 | 58.8 | 71 | 9.9 | 38.0 |
| >25 mph | 1202 | 8.2 | 48.3 | 749 | 8.8 | 49.3 | 453 | 7.3 | 46.6 | 264 | 9.5 | 56.8 | 816 | 8.3 | 47.2 |
| Weekend | 353 | 11.3 | 49.5 | 242 | 12.8 | 52.9 | 111 | 8.1 | 42.4 | 70 | 14.3 | 57.2 | 217 | 12.0 | 49.3 |
| Weekday | 1175 | 6.9 | 46.8 | 717 | 7.3 | 47.2 | 458 | 6.3 | 46.3 | 226 | 7.5 | 56.2 | 738 | 7.3 | 45.8 |
| Inter/Y | 754 | 6.8 | 47.7 | 523 | 7.8 | 47.5 | 318 | 5.3 | 48.1 | 208 | 7.7 | 54.3 | 513 | 6.6 | 46.6 |
| Inter/N | 774 | 9.0 | 47.2 | 436 | 9.4 | 49.5 | 251 | 8.4 | 42.2 | 88 | 12.5 | 61.4 | 442 | 10.4 | 46.6 |
| Winter | 319 | 6.9 | 43.3 | 213 | 7.5 | 45.1 | 106 | 5.7 | 39.6 | 58 | 3.4 | 50.0 | 203 | 8.4 | 44.8 |
| Spring | 421 | 6.9 | 45.1 | 252 | 6.3 | 43.4 | 169 | 7.7 | 47.9 | 81 | 8.6 | 58.0 | 270 | 6.3 | 43.3 |
| Summer | 384 | 9.4 | 52.6 | 233 | 10.7 | 54.9 | 151 | 7.3 | 49.0 | 81 | 12.3 | 56.8 | 242 | 9.5 | 51.2 |
| Fall | 404 | 8.4 | 48.3 | 261 | 10.0 | 51.0 | 143 | 5.6 | 43.4 | 76 | 10.5 | 59.2 | 240 | 9.6 | 47.1 |
| 8 p.m.–6 a.m. | 322 | 13.0 | 52.5 | 219 | 13.7 | 7.2 | 103 | 11.7 | 49.5 | 76 | 11.8 | 52.6 | 212 | 14.2 | 51.4 |
| 6 a.m.–8 p.m. | 1206 | 6.6 | 46.1 | 740 | 7.2 | 47.0 | 466 | 5.6 | 44.6 | 220 | 8.2 | 57.7 | 743 | 6.7 | 45.2 |
| Straight | 1034 | 8.8 | 47.8 | 604 | 9.9 | 48.0 | 430 | 7.2 | 47.4 | 183 | 10.4 | 60.1 | 637 | 9.6 | 46.8 |
| Turning | 457 | 6.6 | 48.1 | 330 | 7.0 | 50.9 | 127 | 5.5 | 40.9 | 113 | 7.1 | 50.4 | 300 | 6.4 | 47.6 |
| All Bicyclists | Not at Fault | At Fault | On Facility | Off Facility | |||||||||||
|---|---|---|---|---|---|---|---|---|---|---|---|---|---|---|---|
| N | KA | KAB | N | KA | KAB | N | KA | KAB | N | KA | KAB | N | KA | KAB | |
| Overall | 1539 | 7.9 | 47.6 | 966 | 8.6 | 48.7 | 573 | 6.6 | 45.6 | 296 | 9.1 | 56.4 | 963 | 8.4 | 46.6 |
| Helmet/Yes | 224 | 7.1 | 44.2 | 173 | 8.7 | 46.8 | 51 | 2.0 | 35.3 | 61 | 6.6 | 50.8 | 134 | 9.0 | 42.5 |
| Helmet/No | 1156 | 8.4 | 49.7 | 684 | 8.9 | 49.7 | 472 | 7.6 | 49.6 | 210 | 10.5 | 60.0 | 719 | 8.6 | 49.1 |
| Helmet/NA | 159 | 5.0 | 37.1 | 109 | 6.4 | 45.0 | 50 | 2.0 | 20.0 | 25 | 4.0 | 40.0 | 110 | 5.5 | 37.3 |
| Gender/M | 1306 | 8.0 | 46.9 | 813 | 8.6 | 47.8 | 493 | 6.9 | 45.2 | 250 | 9.6 | 54.4 | 816 | 8.3 | 46.4 |
| Gender/F | 220 | 7.7 | 54.5 | 149 | 8.7 | 54.4 | 71 | 5.6 | 54.9 | 44 | 6.8 | 70.5 | 136 | 8.8 | 52.9 |
| Age/≤ 18 | 450 | 4.5 | 47.9 | 254 | 4.7 | 47.1 | 193 | 4.7 | 49.7 | 73 | 4.1 | 57.5 | 286 | 5.2 | 47.9 |
| Age/19–64 | 977 | 9.7 | 49.6 | 655 | 10.2 | 50.1 | 317 | 8.5 | 48.6 | 195 | 12.3 | 59.0 | 604 | 9.9 | 47.2 |
| Age/≥ 65 | 39 | 12.8 | 53.8 | 24 | 12.5 | 54.2 | 15 | 13.3 | 53.3 | 11 | NA | 63.6 | 25 | 20.0 | 44.0 |
| Ethnicity/Non-Hisp | 666 | 10.2 | 49.1 | 453 | 11.5 | 50.0 | 213 | 7.5 | 46.5 | 113 | 13.3 | 64.6 | 408 | 11.3 | 49.0 |
| Ethnicity/Hispanic | 827 | 6.2 | 47.4 | 490 | 5.9 | 46.9 | 337 | 6.5 | 48.1 | 174 | 7.0 | 52.3 | 526 | 6.5 | 46.8 |
| All Bicyclists (KA) | All Bicyclists (KAB) | ||||||
|---|---|---|---|---|---|---|---|
| Variable | Reference | Estimates | Std Error | OR | Estimates | Std Error | OR |
| Intercept 1 | −1.90 *** | 0.53 | −0.04 | 0.30 | |||
| Daylight | Dark | −0.51 * | 0.22 | 0.6 | −0.25 . | 0.13 | 0.8 |
| Rain | No-Rain | −0.56 | 0.74 | 0.6 | −0.52 | 0.33 | 0.6 |
| Other roads | Highway/FM | −0.55 . | 0.29 | 0.6 | −0.16 | 0.19 | 0.9 |
| Weekend | Weekday | 0.45 * | 0.22 | 1.6 | 0.06 | 0.13 | 1.1 |
| Speed limit >25 | Speed limit ≤25 | 0.29 | 0.34 | 1.3 | 0.36 * | 0.17 | 1.4 |
| Turning | Straight | −0.30 | 0.24 | 0.7 | 0.06 | 0.12 | 1.1 |
| 8 p.m.–6 a.m. | 6 a.m.–8 p.m. | 0.23 | 0.25 | 1.3 | −0.10 | 0.13 | 0.9 |
| Spring | Fall | −0.04 | 0.29 | 1.0 | −0.07 | 0.15 | 0.9 |
| Summer | Fall | 0.18 | 0.27 | 1.2 | 0.15 | 0.16 | 1.2 |
| Winter | Fall | −0.22 | 0.31 | 0.8 | −0.19 | 0.16 | 0.8 |
| Intersection_Yes | Intersection_No | −0.39 · | 0.21 | 0.7 | 0.03 | 0.11 | 1.0 |
| Intercept 2 | −3.27 *** | 0.35 | 0.19 | 0.17 | |||
| Helmet_Yes | Helmet_No | −0.43 | 0.29 | 0.7 | −0.30 * | 0.15 | 0.7 |
| Helmet_NA | Helmet_No | −0.54 | 0.41 | 0.6 | −0.18 | 0.19 | 0.8 |
| Male | Female | 0.10 | 0.28 | 1.1 | −0.29 · | 0.15 | 0.8 |
| Age 19–64 | Age ≤18 | 0.78 ** | 0.25 | 2.2 | 0.07 | 0.12 | 1.1 |
| Age ≥65 | Age ≤18 | 1.16 * | 0.54 | 3.2 | 0.32 | 0.34 | 1.4 |
| Non-Hispanic | Hispanic | 0.52 ** | 0.20 | 1.7 | 0.08 | 0.11 | 1.1 |
| Bicyclist at Fault | Bicyclist Not at Fault | On Facility | Off Facility | ||||||||||
|---|---|---|---|---|---|---|---|---|---|---|---|---|---|
| Variable | Reference | Estimates | Std Error | OR | Estimates | Std Error | OR | Estimates | Std Error | OR | Estimates | Std Error | OR |
| Intercept 1 | −2.5 ** | 0.93 | −1.71 * | 0.68 | −3.46 * | 1.53 | −2.21 ** | 0.74 | |||||
| Daylight | Dark | −0.34 | 0.36 | 0.7 | −0.57 * | 0.28 | 0.6 | −0.35 | 0.56 | 0.7 | −0.59 * | 0.27 | 0.6 |
| Rain | No-Rain | −0.51 | 1.08 | 0.6 | −0.47 | 1.04 | 0.6 | −0.86 | 1.04 | 0.4 | |||
| Other roads | Highway | −0.57 | 0.50 | 0.6 | −0.54 | 0.38 | 0.6 | 0.27 | 1.09 | 1.3 | −0.56 | 0.38 | 0.6 |
| Weekend | Weekday | 0.78 * | 0.36 | 2.2 | 0.26 | 0.30 | 1.3 | 0.49 | 0.60 | 1.6 | 0.49 . | 0.28 | 1.6 |
| Speed limit >25 | Speed limit ≤25 | 0.58 | 0.56 | 1.8 | 0.07 | 0.43 | 1.1 | −0.20 | 0.69 | 0.8 | 0.89 . | 0.54 | 2.4 |
| Turning | Straight | −0.40 | 0.41 | 0.7 | −0.23 | 0.31 | 0.8 | −1.01 | 0.79 | 0.4 | −0.08 | 0.29 | 0.9 |
| 8 p.m.–6 a.m. | 6 a.m.–8 p.m. | 0.58 | 0.47 | 1.8 | 0.17 | 0.32 | 1.2 | 0.85 | 0.68 | 2.3 | 0.07 | 0.31 | 1.1 |
| Spring | Fall | −0.28 | 0.51 | 0.8 | 0.05 | 0.37 | 1.1 | 0.44 | 0.81 | 1.6 | 0.03 | 0.36 | 1.0 |
| Summer | Fall | 0.51 | 0.43 | 1.7 | −0.04 | 0.36 | 1.0 | 0.87 | 0.76 | 2.4 | 0.07 | 0.35 | 1.1 |
| Winter | Fall | 0.14 | 0.48 | 1.2 | −0.41 | 0.42 | 0.7 | 0.29 | 0.88 | 1.3 | −0.3 | 0.39 | 0.7 |
| Intersection_Yes | Intersection_No | −0.72 * | 0.36 | 0.5 | −0.15 | 0.27 | 0.9 | −0.19 | 0.57 | 0.8 | −0.59 * | 0.27 | 0.6 |
| Intercept 2 | −3.26 *** | 0.62 | −3.32 *** | 0.44 | −3.88 *** | 0.86 | −3.04 *** | 0.41 | |||||
| Helmet_Yes | Helmet_No | −1.61 | 1.03 | 0.2 | −0.29 | 0.31 | 0.8 | −0.84 | 0.58 | 0.4 | −0.24 | 0.34 | 0.8 |
| Helmet_NA | Helmet_No | −0.97 | 1.04 | 0.4 | −0.46 | 0.45 | 0.6 | −0.77 | 1.06 | 0.5 | −0.39 | 0.45 | 0.7 |
| Male | Female | 0.30 | 0.55 | 1.4 | 0.03 | 0.32 | 1.0 | 0.71 | 0.65 | 2.0 | −0.05 | 0.33 | 1.0 |
| Age 19–64 | Age ≤18 | 0.71 · | 0.40 | 2.0 | 0.81 * | 0.33 | 2.3 | 1.25 · | 0.86 | 3.5 | 0.66 * | 0.30 | 1.9 |
| Age ≥65 | Age ≤18 | 1.29 | 0.85 | 3.6 | 1.09 | 0.70 | 3.0 | 1.52 ** | 0.58 | 4.6 | |||
| Non-Hispanic | Hispanic | 0.15 | 0.35 | 1.2 | 0.69 ** | 0.25 | 2.0 | 0.56 | 0.42 | 1.7 | 0.54 * | 0.24 | 1.7 |
| Bicyclist at Fault | Bicyclist not at Fault | On Facility | Off Facility | ||||||||||
|---|---|---|---|---|---|---|---|---|---|---|---|---|---|
| Variable | Reference | Estimates | Std Error | OR | Estimates | Std Error | OR | Estimates | Std Error | OR | Estimates | Std Error | OR |
| Intercept 1 | 0.12 | 0.50 | −0.24 | 0.38 | −1.07 | 0.72 | −0.10 | 0.38 | |||||
| Daylight | Dark | −0.34 | 0.21 | 0.7 | −0.20 | 0.16 | 1.0 | −0.22 | 0.30 | 0.8 | −0.20 | 0.16 | 0.8 |
| Rain | No-Rain | −0.24 | 0.48 | 0.8 | −0.77 | 0.47 | 0.5 | −0.56 | 0.75 | 0.6 | −0.95 | 0.45 | 0.4 |
| Other roads | Highway | −0.26 | 0.33 | 0.8 | −0.04 | 0.23 | 1.0 | 0.25 | 0.50 | 1.3 | 0.01 | 0.24 | 1.0 |
| Weekend | Weekday | 0.20 | 0.22 | 1.2 | 0.02 | 0.17 | 1.0 | 0.72 * | 0.32 | 2.1 | −0.06 | 0.17 | 1.0 |
| Speed limit >25 | Speed limit ≤25 | 0.23 | 0.28 | 1.3 | 0.45 * | 0.22 | 1.6 | 0.01 | 0.38 | 1.0 | 0.47 | 0.22 | 1.6 |
| Turning | Straight | −0.14 | 0.21 | 0.9 | 0.18 | 0.15 | 1.2 | 0.25 | 0.30 | 1.3 | 0.04 | 0.15 | 1.1 |
| 8 p.m.–6 a.m. | 6 a.m.–8 p.m. | 0.02 | 0.22 | 1.0 | −0.14 | 0.16 | 0.9 | 0.32 | 0.29 | 1.4 | −0.35 | 0.16 | 0.7 |
| Spring | Fall | −0.12 | 0.25 | 0.9 | −0.06 | 0.20 | 1.0 | 0.24 | 0.37 | 1.3 | −0.20 | 0.20 | 0.8 |
| Summer | Fall | 0.35 | 0.26 | 1.4 | 0.08 | 0.20 | 1.1 | 0.37 | 0.37 | 1.5 | 0.26 | 0.20 | 1.3 |
| Winter | Fall | −0.29 | 0.26 | 0.8 | −0.12 | 0.21 | 0.9 | 0.07 | 0.40 | 1.1 | −0.11 | 0.20 | 0.9 |
| Intersection_Yes | Intersection_No | 0.04 | 0.19 | 1.0 | 0.05 | 0.14 | 1.1 | 0.41 | 0.28 | 1.5 | −0.01 | 0.15 | 1.0 |
| Intercept 2 | 0.38 | 0.28 | 0.07 | 0.21 | 0.79 · | 0.42 | 0.14 | 0.21 | |||||
| Helmet_Yes | Helmet_No | −0.61 · | 0.32 | 0.5 | −0.22 | 0.18 | 0.8 | −0.42 | 0.31 | 0.7 | −0.36 · | 0.20 | 0.7 |
| Helmet_NA | Helmet_No | −0.68 · | 0.40 | 0.5 | −0.02 | 0.22 | 1.0 | −0.32 | 0.49 | 0.7 | −0.15 | 0.23 | 0.9 |
| Male | Female | −0.30 | 0.26 | 0.7 | −0.27 | 0.18 | 0.8 | −0.58 | 0.37 | 0.6 | −0.26 | 0.19 | 0.8 |
| Age 19–64 | Age ≤ 18 | 0.01 | 0.19 | 1.0 | 0.12 | 0.15 | 1.1 | −0.07 | 0.29 | 0.9 | 0.08 | 0.15 | 1.1 |
| Age ≥ 65 | Age ≤ 18 | 0.29 | 0.55 | 1.3 | 0.35 | 0.43 | 1.4 | 0.23 | 0.68 | 1.3 | −0.05 | 0.42 | 1.0 |
| Non-Hispanic | Hispanic | −0.09 | 0.18 | 0.9 | 0.16 | 0.13 | 1.2 | 0.57 * | 0.26 | 1.8 | 0.09 | 0.14 | 1.1 |
Publisher’s Note: MDPI stays neutral with regard to jurisdictional claims in published maps and institutional affiliations. |
© 2021 by the authors. Licensee MDPI, Basel, Switzerland. This article is an open access article distributed under the terms and conditions of the Creative Commons Attribution (CC BY) license (https://creativecommons.org/licenses/by/4.0/).
Share and Cite
Billah, K.; Sharif, H.O.; Dessouky, S. Analysis of Bicycle-Motor Vehicle Crashes in San Antonio, Texas. Int. J. Environ. Res. Public Health 2021, 18, 9220. https://doi.org/10.3390/ijerph18179220
Billah K, Sharif HO, Dessouky S. Analysis of Bicycle-Motor Vehicle Crashes in San Antonio, Texas. International Journal of Environmental Research and Public Health. 2021; 18(17):9220. https://doi.org/10.3390/ijerph18179220
Chicago/Turabian StyleBillah, Khondoker, Hatim O. Sharif, and Samer Dessouky. 2021. "Analysis of Bicycle-Motor Vehicle Crashes in San Antonio, Texas" International Journal of Environmental Research and Public Health 18, no. 17: 9220. https://doi.org/10.3390/ijerph18179220
APA StyleBillah, K., Sharif, H. O., & Dessouky, S. (2021). Analysis of Bicycle-Motor Vehicle Crashes in San Antonio, Texas. International Journal of Environmental Research and Public Health, 18(17), 9220. https://doi.org/10.3390/ijerph18179220