
Determining Validity of Critical Power Estimated Using a Three-Minute All-Out Test in Hot Environments


Abstract
:1. Introduction
2. Materials and Methods
2.1. Participants and Protocol
2.2. Procedures
2.3. Incremental Exercise Tests
2.4. Three-Minute All-Out Exercise Tests
2.5. Blood Samples
2.6. Statistical Analysis
3. Results
4. Discussion
5. Conclusions
Author Contributions
Funding
Institutional Review Board Statement
Informed Consent Statement
Data Availability Statement
Acknowledgments
Conflicts of Interest
References
- Arngrímsson, S.A.; Petitt, D.S.; Borrani, F.; Skinner, K.A.; Cureton, K.J. Hyperthermia and maximal oxygen uptake in men and women. Eur. J. Appl. Physiol. 2004, 92, 524–532. [Google Scholar] [CrossRef]
- De Barros, C.L.M.; Mendes, T.T.; Mortimer, L.A.C.F.; Simões, H.G.; Prado, L.S.; Wisloff, U.; Silami-Garcia, E. Maximal lactate steady state is altered in the heat. Int. J. Sports Med. 2011, 32, 749–753. [Google Scholar] [CrossRef] [PubMed]
- González-Alonso, J.; Calbet, J.A. Reductions in systemic and skeletal muscle blood flow and oxygen delivery limit maximal aerobic capacity in humans. Circulation 2003, 107, 824–830. [Google Scholar] [CrossRef] [PubMed] [Green Version]
- Lafrenz, A.J.; Wingo, J.E.; Ganio, M.S.; Cureton, K.J. Effect of ambient temperature on cardiovascular drift and maximal oxygen uptake. Med. Sci. Sports Exerc. 2008, 40, 1065–1071. [Google Scholar] [CrossRef]
- Lorenzo, S.; Minson, C.T.; Babb, T.G.; Halliwill, J.R. Lactate threshold predicting time-trial performance: Impact of heat and acclimation. J. Appl. Physiol. 2011, 111, 221–227. [Google Scholar] [CrossRef] [Green Version]
- No, M.; Kwak, H.B. Effects of environmental temperature on physiological responses during submaximal and maximal exercises in soccer players. Integr. Med. Res. 2016, 5, 216–222. [Google Scholar] [CrossRef] [Green Version]
- Nybo, L.; Jensen, T.; Nielsen, B.; González-Alonso, J. Effects of marked hyperthermia with and without dehydration on VO(2) kinetics during intense exercise. J. Appl. Physiol. 2001, 90, 1057–1064. [Google Scholar]
- Poole, D.C.; Burnley, M.; Vanhatalo, A.; Rossiter, H.B.; Jones, A.M. Critical power: An important fatigue threshold in exercise physiology. Med. Sci. Sports Exerc. 2016, 48, 2320–2334. [Google Scholar] [CrossRef] [Green Version]
- Burnley, M.; Doust, J.H.; Vanhatalo, A. A 3-min all-out test to determine peak oxygen uptake and the maximal steady state. Med. Sci. Sports Exerc. 2006, 38, 1995–2003. [Google Scholar] [CrossRef]
- Cheng, C.F.; Yang, Y.S.; Lin, H.M.; Lee, C.L.; Wang, C.Y. Determination of critical power in trained rowers using a three-minute all-out rowing test. Eur. J. Appl. Physiol. 2012, 112, 1251–1260. [Google Scholar] [CrossRef] [PubMed]
- Vanhatalo, A.; Doust, J.H.; Burnley, M. Determination of critical power using a 3-min all-out cycling test. Med. Sci. Sports Exerc. 2007, 39, 548–555. [Google Scholar] [CrossRef] [PubMed]
- Barker, A.R.; Bond, B.; Toman, C.; Williams, C.A.; Armstrong, N. Critical power in adolescents: Physiological bases and assessment using all-out exercise. Eur. J. Appl. Physiol. 2012, 112, 1359–1370. [Google Scholar] [CrossRef] [PubMed]
- Piatrikova, E.; Sousa, A.C.; Gonzalez, J.T.; Williams, S. Validity and reliability of the 3-minute all-out test in national and international competitive swimmers. Int. J. Sports Physiol. Perform. 2018, 13, 1190–1198. [Google Scholar] [CrossRef] [PubMed]
- Bergstrom, H.C.; Housh, T.J.; Zuniga, J.M.; Traylor, D.A.; Camic, C.L.; Lewis, R.W., Jr.; Schmidt, R.J.; Johnson, G.O. The relationships among critical power determined from a 3-min all-out test, respiratory compensation point, gas exchange threshold, and ventilatory threshold. Res. Q. Exerc. Sport 2013, 84, 232–238. [Google Scholar] [CrossRef] [PubMed]
- Francis, J.T., Jr.; Quinn, T.J.; Amann, M.; LaRoche, D.P. Defining intensity domains from the end power of a 3-min all-out cycling test. Med. Sci. Sports Exerc. 2010, 42, 1769–1775. [Google Scholar] [CrossRef] [PubMed]
- Kuo, Y.H.; Cheng, C.F.; Hsu, W.C.; Wong, D.P. Validity and reliability of the 3-min all-out running test to measure critical velocity in hot environments. Res. Sports Med. 2017, 25, 470–479. [Google Scholar] [CrossRef]
- Backx, K.; Mc Naughton, L.; Crickmore, L.; Palmer, G.; Carlisle, A. Effects of differing heat and humidity on the performance and recovery from multiple high intensity, intermittent exercise bouts. Int. J. Sports Med. 2000, 21, 400–405. [Google Scholar] [CrossRef]
- Bailey, S.J.; Romer, L.M.; Kelly, J.; Wilkerson, D.P.; DiMenna, F.J.; Jones, A.M. Inspiratory muscle training enhances pulmonary O2 uptake kinetics and high-intensity exercise tolerance in humans. J. Appl. Physiol. 2010, 109, 457–468. [Google Scholar] [CrossRef] [Green Version]
- Beaver, W.L.; Wasserman, K.; Whipp, B.J. A new method for detecting anaerobic threshold by gas exchange. J. Appl. Physiol. 1986, 60, 2020–2027. [Google Scholar] [CrossRef]
- Vanhatalo, A.; Poole, D.C.; DiMenna, F.J.; Bailey, S.J.; Jones, A.M. Muscle fiber recruitment and the slow component of O2 uptake: Constant work rate vs. all-out sprint exercise. Am. J. Physiol. Regul. Integr. Comp. Physiol. 2011, 300, 700–707. [Google Scholar] [CrossRef] [Green Version]
- Cohen, J. Statistical Power Analysis for the Behavioral Sciences, 2nd ed.; Lawrence Erlbaum Associates: Hillsdale, NJ, USA, 1988. [Google Scholar]
- Burnley, M.; Jones, A.M. Oxygen uptake kinetics as a determinant of sports performance. Eur. J. Sport Sci. 2007, 7, 63–79. [Google Scholar] [CrossRef]
- Nybo, L.; Nielsen, B. Hyperthermia and central fatigue during prolonged exercise in humans. J. Appl. Physiol. 2001, 90, 1055–1060. [Google Scholar] [CrossRef] [PubMed]
- Girard, O.; Brocherie, F.; Bishop, D.J. Sprint performance under heat stress: A review. Scand. J. Med. Sci. Sports 2015, 25, 79–89. [Google Scholar] [CrossRef] [PubMed]
- Cheung, S.S.; Sleivert, G.G. Multiple triggers for hyperthermic fatigue and exhaustion. Exerc. Sport Sci. Rev. 2004, 32, 100–106. [Google Scholar] [CrossRef] [PubMed]
- Nybo, L.; Rasmussen, P.; Sawka, M.N. Performance in the heatphysiological factors of importance for hyperthermia-induced fatigue. Compr. Physiol. 2014, 4, 657–689. [Google Scholar]
- Mitchell, J.B.; Rogers, M.M.; Basset, J.T.; Hubing, K.A. Fatigue during high-intensity endurance exercise: The interaction between metabolic factors and thermal stress. J. Strength Cond. Res. 2014, 28, 1906–1914. [Google Scholar] [CrossRef] [PubMed]
- Mairbäurl, H. Red blood cells in sports: Effects of exercise and training on oxygen supply by red blood cells. Front. Physiol. 2013, 4, 332–345. [Google Scholar] [CrossRef] [PubMed] [Green Version]
- El-Sayed, M.S.; Ali, N.; Ali, Z.E.S. Haemorheology in exercise and training. Sports Med. 2005, 35, 649–670. [Google Scholar] [CrossRef] [PubMed]
- Cheuvront, S.N.; Kenefick, R.W.; Montain, S.J.; Sawka, M.N. Mechanisms of aerobic performance impairment with heat stress and dehydration. J. Appl. Physiol. 2010, 109, 1989–1995. [Google Scholar] [CrossRef] [PubMed] [Green Version]
- Périard, J.D.; Travers, G.J.S.; Racinais, S.; Sawka, M.N. Cardiovascular adaptations supporting human exercise-heat acclimation. Auton. Neurosci. 2016, 196, 52–62. [Google Scholar] [CrossRef] [Green Version]
- Tyler, C.J.; Reeve, T.; Hodges, G.J.; Cheung, S.S. The effects of heat adaptation on physiology, perception and exercise performance in the heat: A meta-analysis. Sports Med. 2016, 46, 1699–1724. [Google Scholar] [CrossRef]
- Lorenzo, S.; Halliwill, J.R.; Sawka, M.N.; Minson, C.T. Heat acclimation improves exercise performance. J. Appl. Physiol. 2010, 109, 1140–1147. [Google Scholar] [CrossRef] [PubMed] [Green Version]
- Kramer, M.; Thomas, E.J.; Pettitt, R.W. Critical speed and finite distance capacity: Norms for athletic and non-athletic groups. Eur. J. Appl. Physiol. 2020, 120, 861–872. [Google Scholar] [CrossRef] [PubMed]
- Pettitt, R.W.; Jamnick, N.; Clark, I.E. 3-min all-out exercise test for running. Int. J. Sports Med. 2012, 33, 426–431. [Google Scholar] [CrossRef] [PubMed]
- Kenney, W.L. A review of comparative responses of men and women to heat stress. Environ. Res. 1985, 37, 1–11. [Google Scholar] [CrossRef]

| 95% Confidence Limits | ||||||
|---|---|---|---|---|---|---|
| NT | HT | Lower Bound | Upper Bound | p | d | |
| Ambient temperature (°C) | 22.5 ± 0.6 | 35.3 ± 0.9 * | −13.574 | −11.942 | 0.000 | 14.166 |
| Humidity (%RH) | 36.3 ± 5.2 | 41.1 ± 7.5 | −10.786 | 1.120 | 0.101 | 0.780 |
| VO2max (mL·kg−1·min−1) | 59.3 ± 7.6 | 61.3 ± 8.0 * | −3.408 | −0.592 | 0.010 | 1.297 |
| VT1 (mL·kg−1·min−1) | 37.8 ± 5.4 | 36.7 ± 4.9 | −1.636 | 3.880 | 0.390 | 0.367 |
| VT2 (mL·kg−1·min−1) | 44.9 ± 5.8 | 45.0 ± 7.2 | −1.809 | 1.582 | 0.886 | 0.073 |
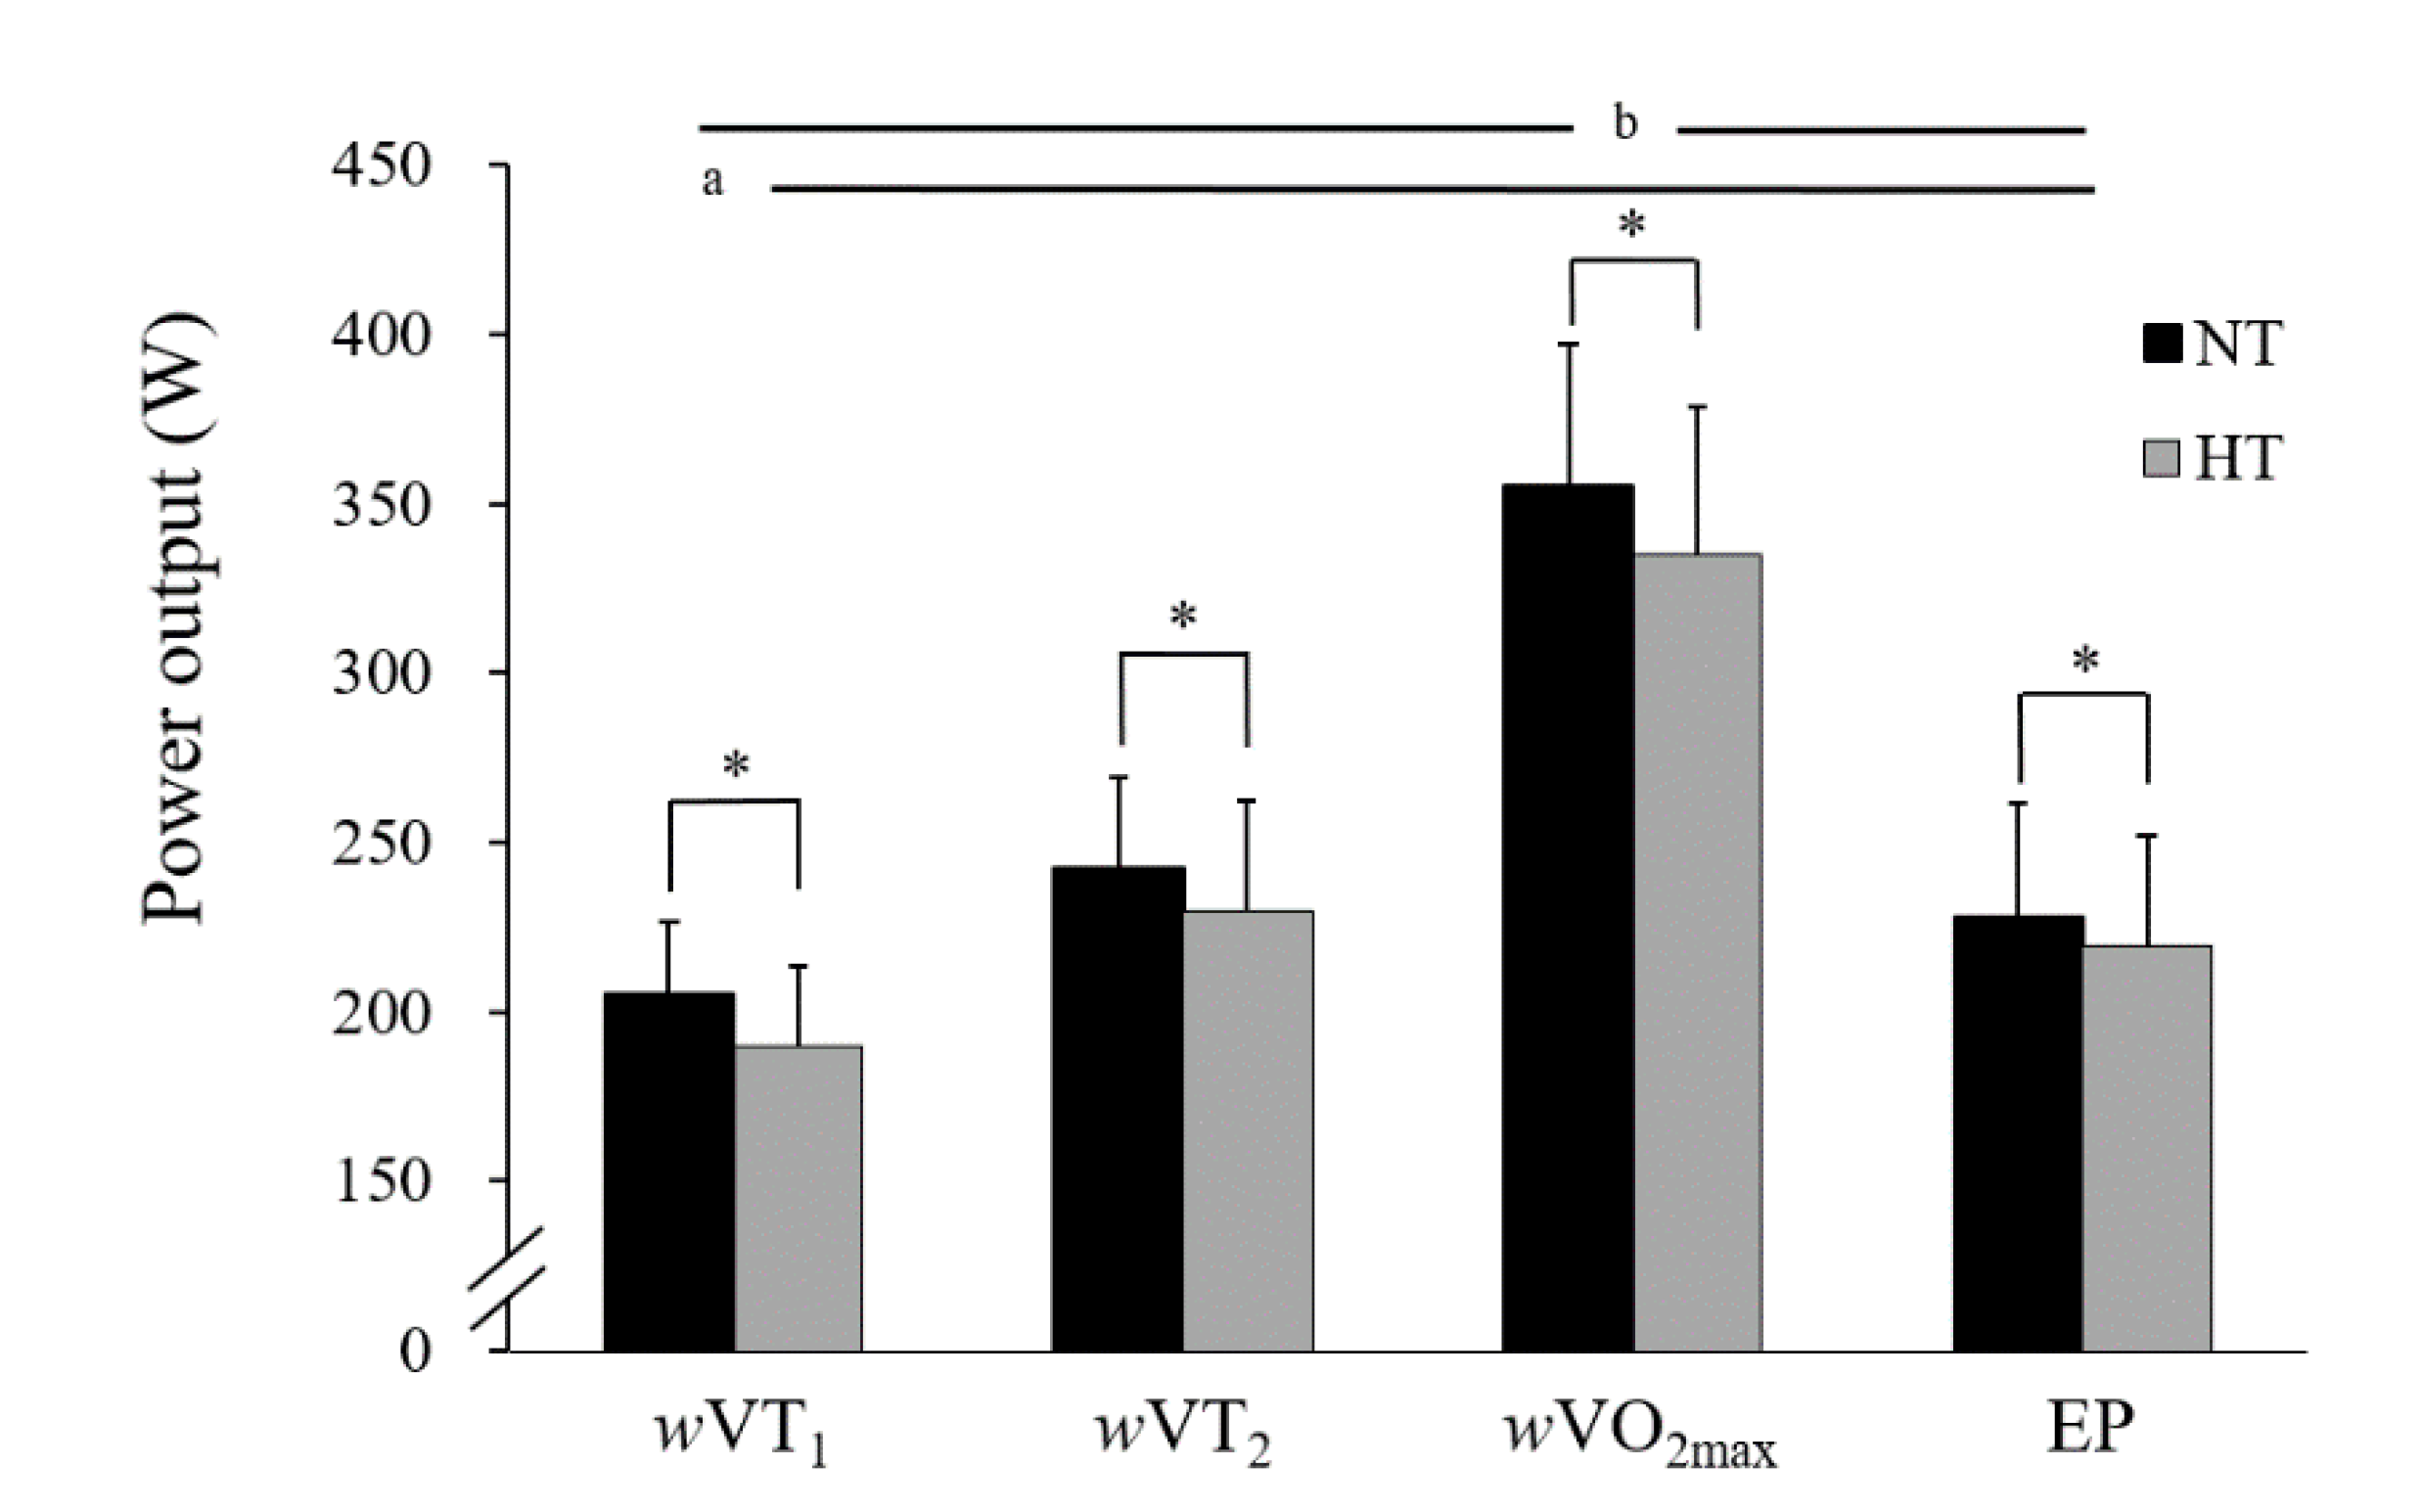
| wVO2max (W) | 355.0 ± 42.1 | 335.0 ± 44.0 * | 10.615 | 29.385 | 0.001 | 1.929 |
| wVT1 (W) | 205.0 ± 21.5 | 190.0 ± 23.4 * | 5.046 | 24.954 | 0.007 | 1.361 |
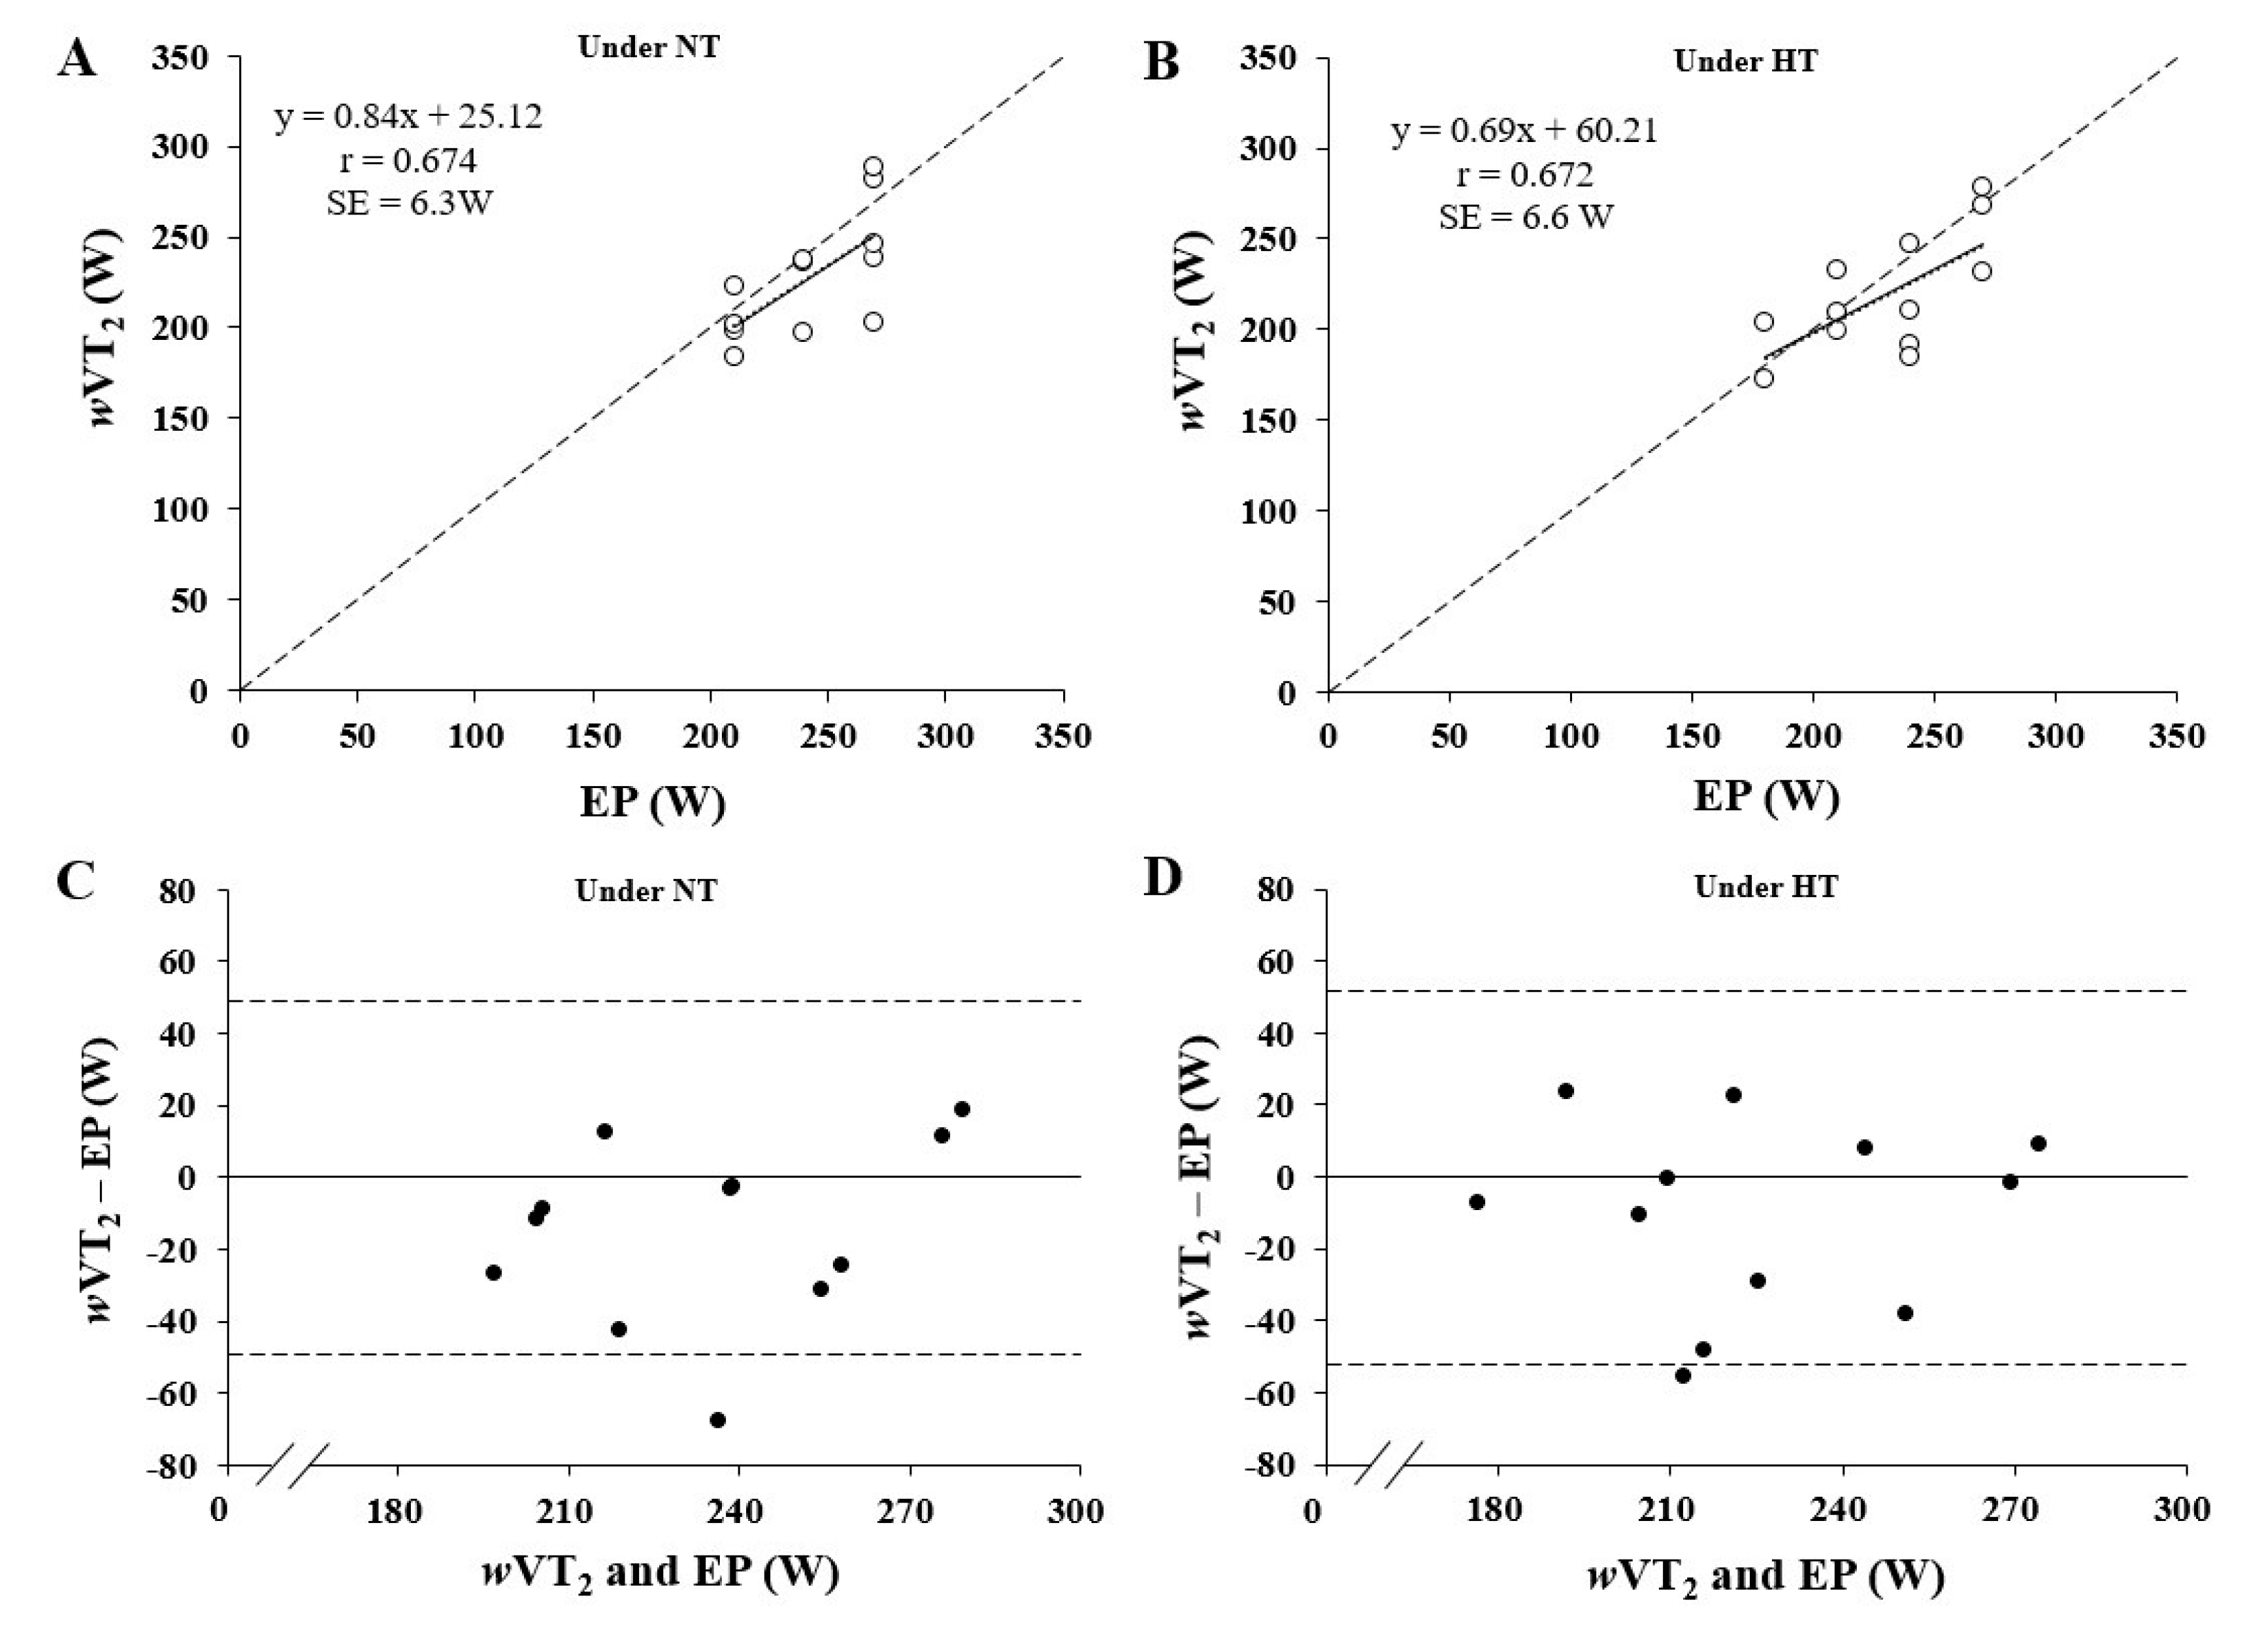
| wVT2 (W) | 242.5 ± 27.0 | 230.0 ± 32.2 * | 2.685 | 22.315 | 0.017 | 1.209 |
| Time to exhaustion (s) | 879.9 ± 76.3 | 846.7 ± 72.8 * | 24.268 | 42.232 | 0.000 | 3.420 |
| 95% Confidence Limits | ||||||
|---|---|---|---|---|---|---|
| NT | HT | Lower Bound | Upper Bound | p | d | |
| Ambient temperature (°C) | 22.1 ± 0.5 | 35.6 ± 0.6 * | −14.144 | −12.840 | 0.000 | 18.613 |
| Humidity (%RH) | 36.1 ± 4.3 | 37.5 ± 4.8 | −5.412 | 2.578 | 0.452 | 0.319 |
| Load (N) | 280.0 ± 30.9 | 262.5 ± 32.9 * | 9.543 | 25.457 | 0.001 | 2.002 |
| VO2peak (mL·kg−1·min−1) | 57.8 ± 8.4 | 61.3 ± 7.4 * | −5.161 | −1.672 | 0.001 | 1.860 |
| VE (L·min−1) | 146.6 ± 18.3 | 151.7 ± 20.3 * | −8.653 | −1.587 | 0.009 | 1.842 |
| HR peak (bpm) | 182.1 ± 9.7 | 187.9 ± 12.4 * | −9.786 | −1.881 | 0.008 | 1.452 |
| EP (W) | 227.9 ± 33.5 | 219.3 ± 33.1 * | 1.990 | 15.332 | 0.016 | 1.163 |
| WEP (kJ) | 14.4 ± 3.0 | 14.6 ± 3.0 | −1.641 | 1.145 | 0.702 | 0.160 |
| Peak power (W) | 606.3 ± 82.0 | 587.5 ± 86.7 * | 0.633 | 37.033 | 0.044 | 0.944 |
| Mean power (W) | 307.9 ± 31.7 | 300.4 ± 34.2 * | 4.256 | 10.635 | 0.000 | 2.384 |
| IET | 3MT | |||||||
|---|---|---|---|---|---|---|---|---|
| NT | HT | NT | HT | |||||
| Pre-Test | Post-Test | Pre-Test | Post-Test | Pre-Test | Post-Test | Pre-Test | Post-Test | |
| Body weight (kg) | 67.7 ± 8.8 | 67.4 ± 8.8 † | 67.7 ± 8.6 | 67.3 ± 8.6 † | 67.7 ± 8.7 | 67.3 ± 8.7 † | 67.4 ± 8.6 | 66.7 ± 8.5 †* |
| Hct (%) | 49.0 ± 3.7 | 53.8 ± 3.6 † | 48.2 ± 3.5 | 52.3 ± 3.4 †* | 49.8 ± 3.8 | 54.7 ± 3.5 † | 49.6 ± 2.6 | 54.2 ± 2.7 † |
| Lac (mmol·L−1) | 0.9 ± 0.2 | 11.0 ± 2.4 † | 1.1 ± 0.2 | 11.4 ± 2.4 † | 0.9 ± 0.2 | 13.2 ± 2.4 † | 1.2 ± 0.2 | 14.1 ± 2.6 † |
| RPE | 6.7 ± 0.8 | 18.5 ± 2.8 † | 6.9 ± 0.5 | 19.4 ± 0.7 † | 6.7 ± 0.7 | 20.0 ± 0.0 † | 6.9 ± 0.8 | 19.9 ± 0.3 † |
Publisher’s Note: MDPI stays neutral with regard to jurisdictional claims in published maps and institutional affiliations. |
© 2021 by the authors. Licensee MDPI, Basel, Switzerland. This article is an open access article distributed under the terms and conditions of the Creative Commons Attribution (CC BY) license (https://creativecommons.org/licenses/by/4.0/).
Share and Cite
Kuo, Y.-H.; Cheng, C.-F.; Kuo, Y.-C. Determining Validity of Critical Power Estimated Using a Three-Minute All-Out Test in Hot Environments. Int. J. Environ. Res. Public Health 2021, 18, 9193. https://doi.org/10.3390/ijerph18179193
Kuo Y-H, Cheng C-F, Kuo Y-C. Determining Validity of Critical Power Estimated Using a Three-Minute All-Out Test in Hot Environments. International Journal of Environmental Research and Public Health. 2021; 18(17):9193. https://doi.org/10.3390/ijerph18179193
Chicago/Turabian StyleKuo, Yu-Hsuan, Ching-Feng Cheng, and Yu-Chi Kuo. 2021. "Determining Validity of Critical Power Estimated Using a Three-Minute All-Out Test in Hot Environments" International Journal of Environmental Research and Public Health 18, no. 17: 9193. https://doi.org/10.3390/ijerph18179193
APA StyleKuo, Y.-H., Cheng, C.-F., & Kuo, Y.-C. (2021). Determining Validity of Critical Power Estimated Using a Three-Minute All-Out Test in Hot Environments. International Journal of Environmental Research and Public Health, 18(17), 9193. https://doi.org/10.3390/ijerph18179193