New Tools to Support the Risk Assessment Process of Nanomaterials in the Insurance Sector

 ,
,
Abstract
:1. Introduction
2. Methodology
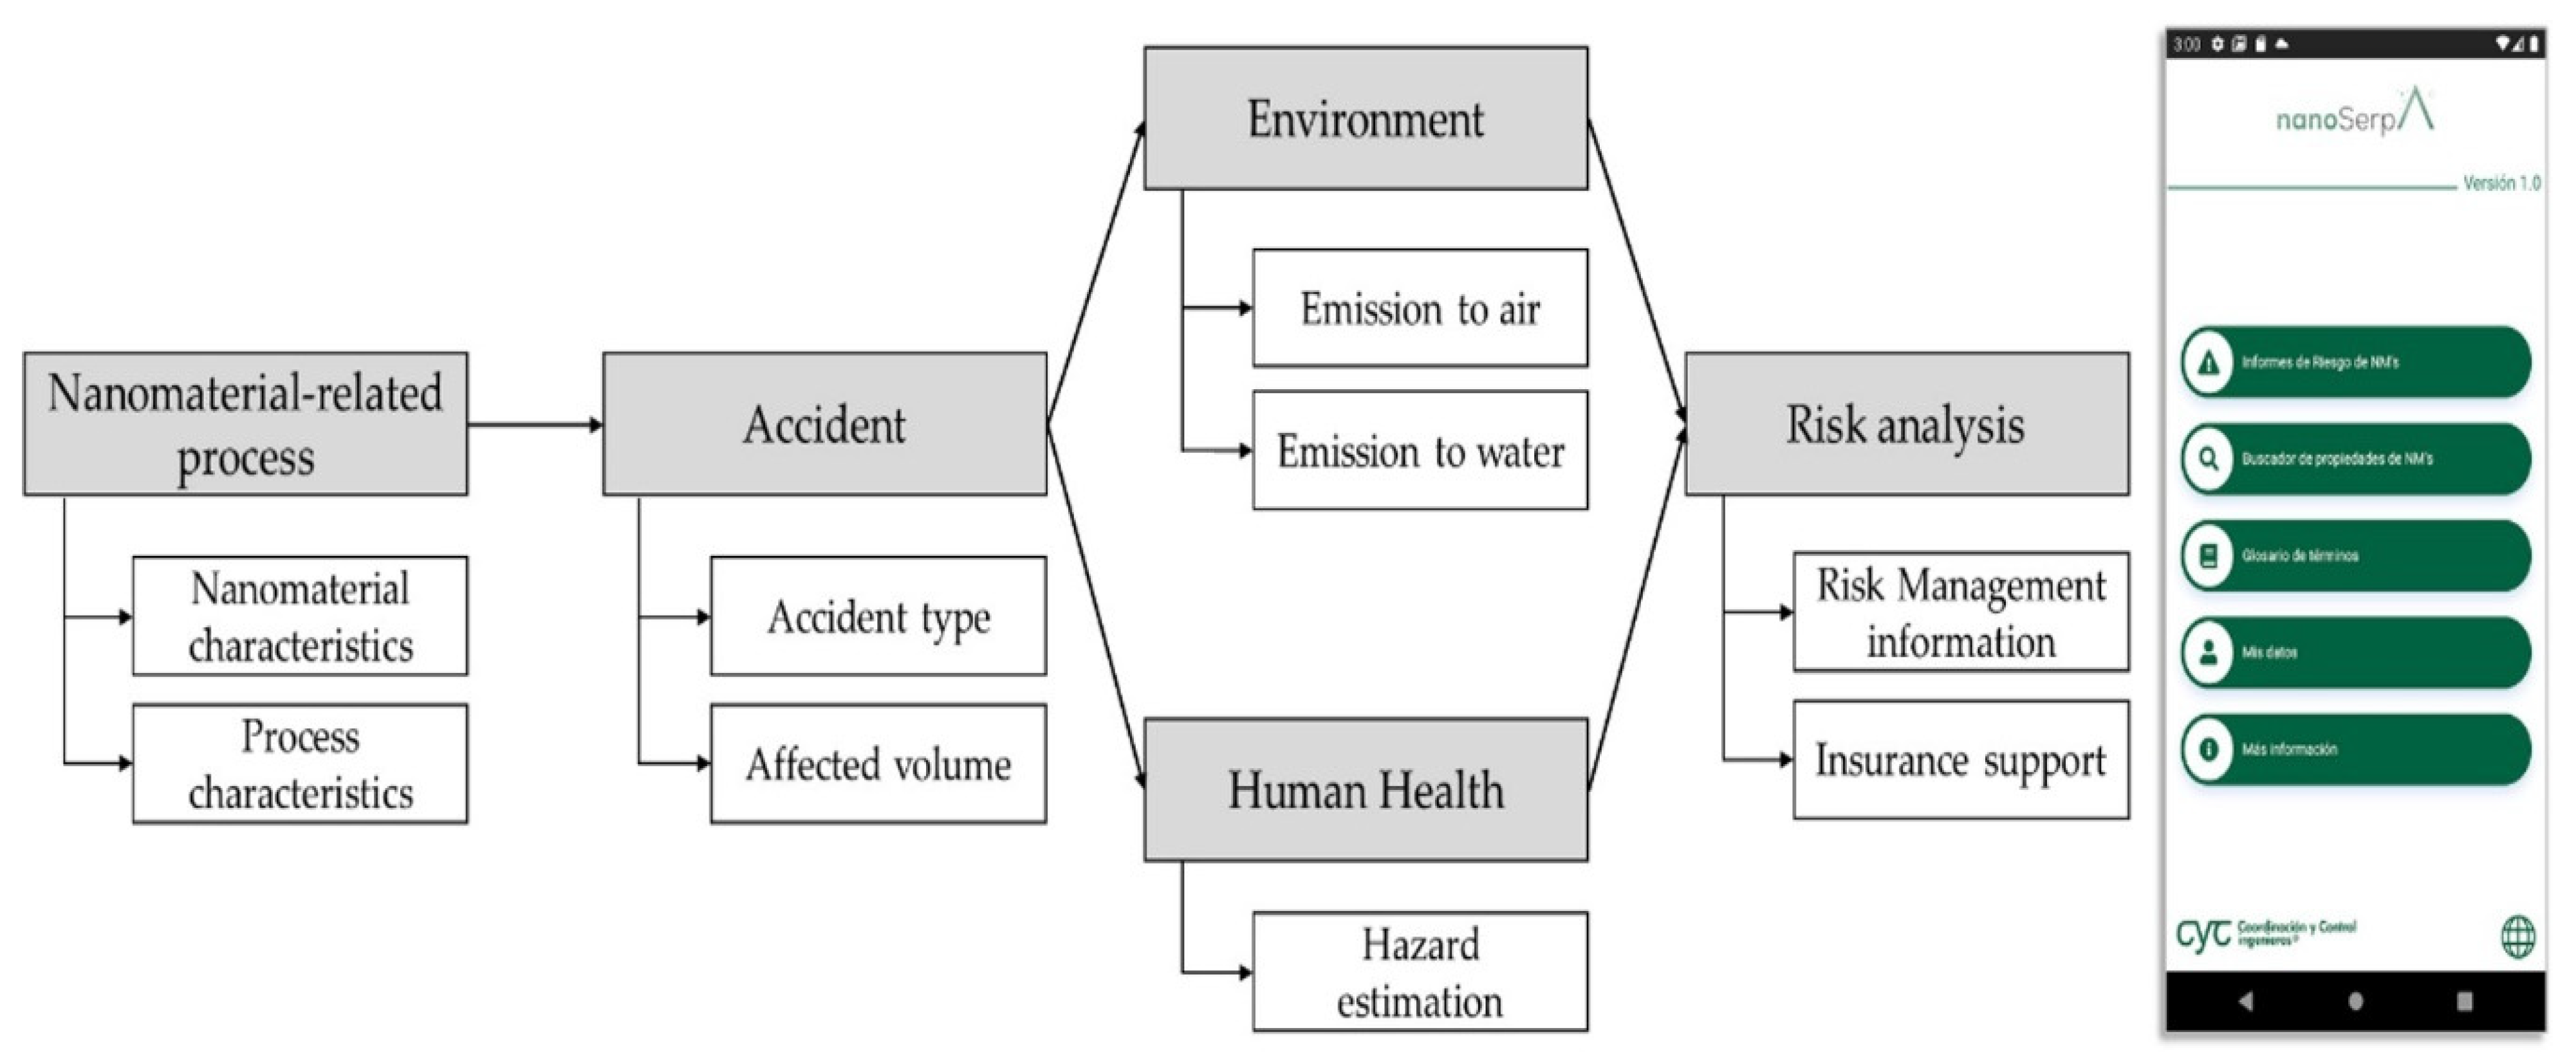
2.1. Development of the NanoSerpa Application
- Release and emissions to the environment: A material flow model (MFM) has been implemented for the estimation of emissions into the environment. This model has included the most common processes when working with nanomaterials: synthesis, manufacturing, use, sludge treatment disposal, incineration removal and filtration. In addition, different types of accidents such as explosions, burning or fire, gas escapes and spillovers have been introduced.
- Health hazard: This model considers 10 different endpoints when analyzing the health hazards of nanomaterials. This information is available in the NanoSerpa database, which contains information from different data sources, highlighting the eNanoMapper database [29]. eNanoMapper is the biggest European public database hosting nanomaterial characterization data and biological and toxicological information.
- Risk index: The risk index is estimated based on the two models mentioned above. This type of band model is widely used in the field of nanoparticle risk calculation.
2.1.1. Emission/Release Estimation Model
2.1.2. Hazard Estimation Model
2.1.3. Risk Index Characterization
2.2. NanoSerpa Case Studies
- SiO2 nanoparticle leak from a vacuum cleaner
- Release of TiO2 nanopowder from a bag filter system
- Fall of eight TiO2 bulk bags on the road
- Leak of black carbon during transportation
- Spillage of paint containing graphene during spraying
- Accidental spillage of a dry mortar
3. Results and Discussion
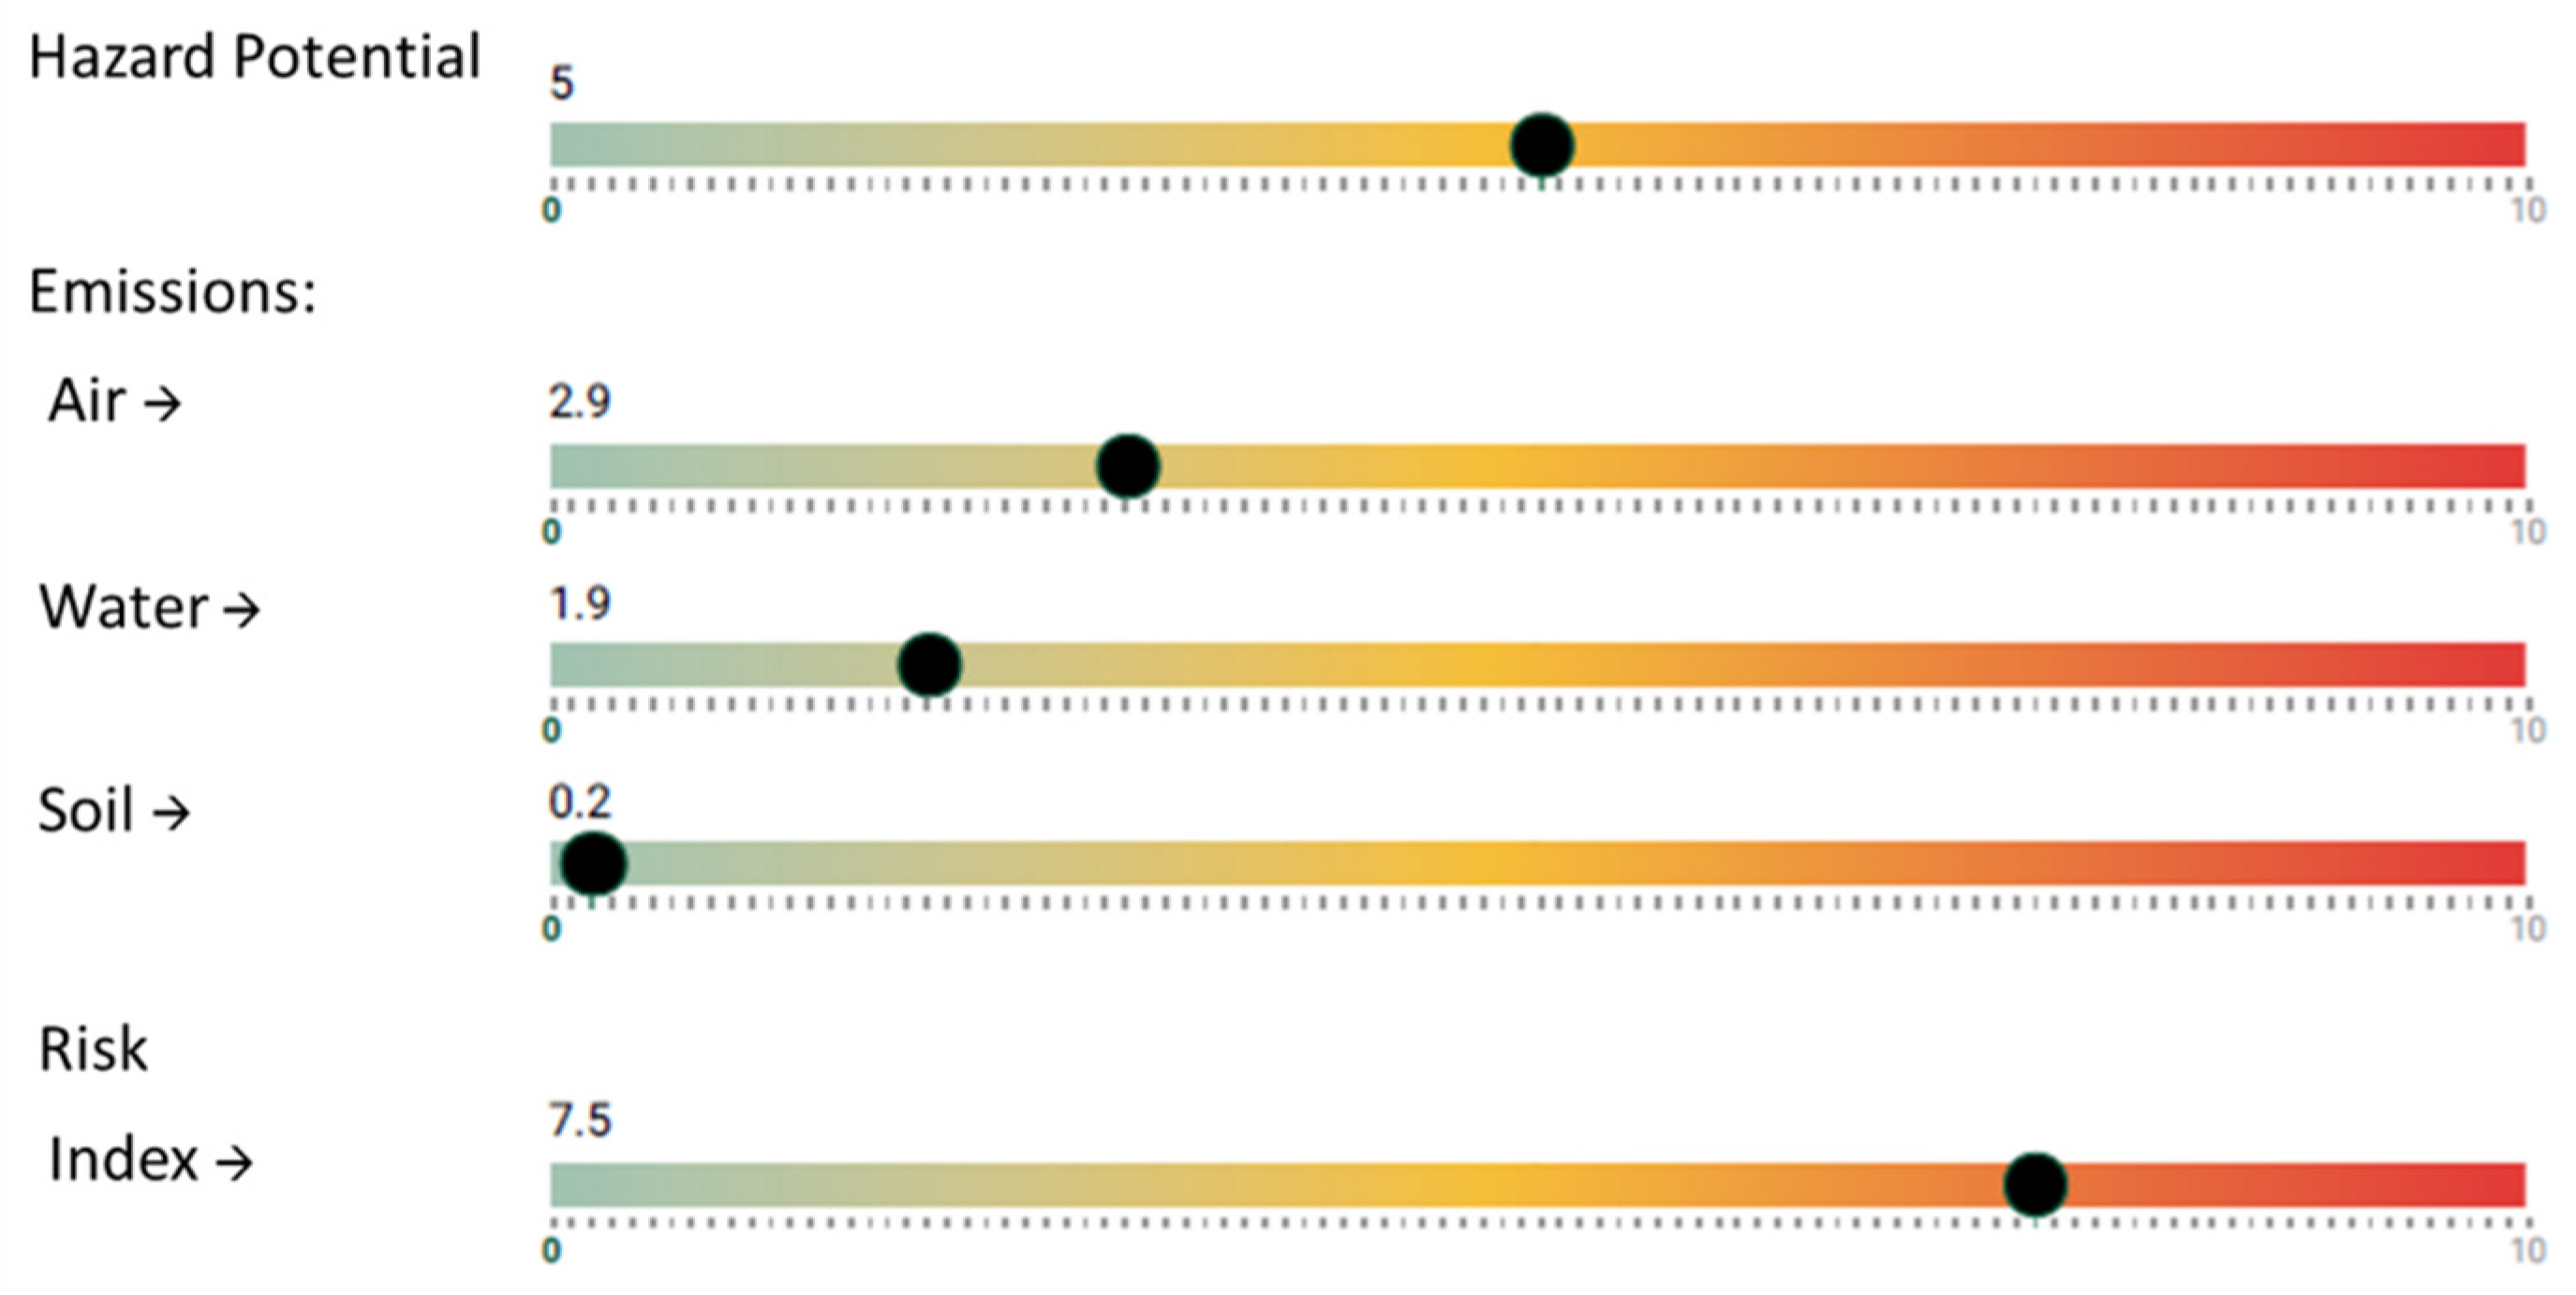
3.1. Accidental Spillage of Paint Containing Graphene during Low-Density Paint Spraying
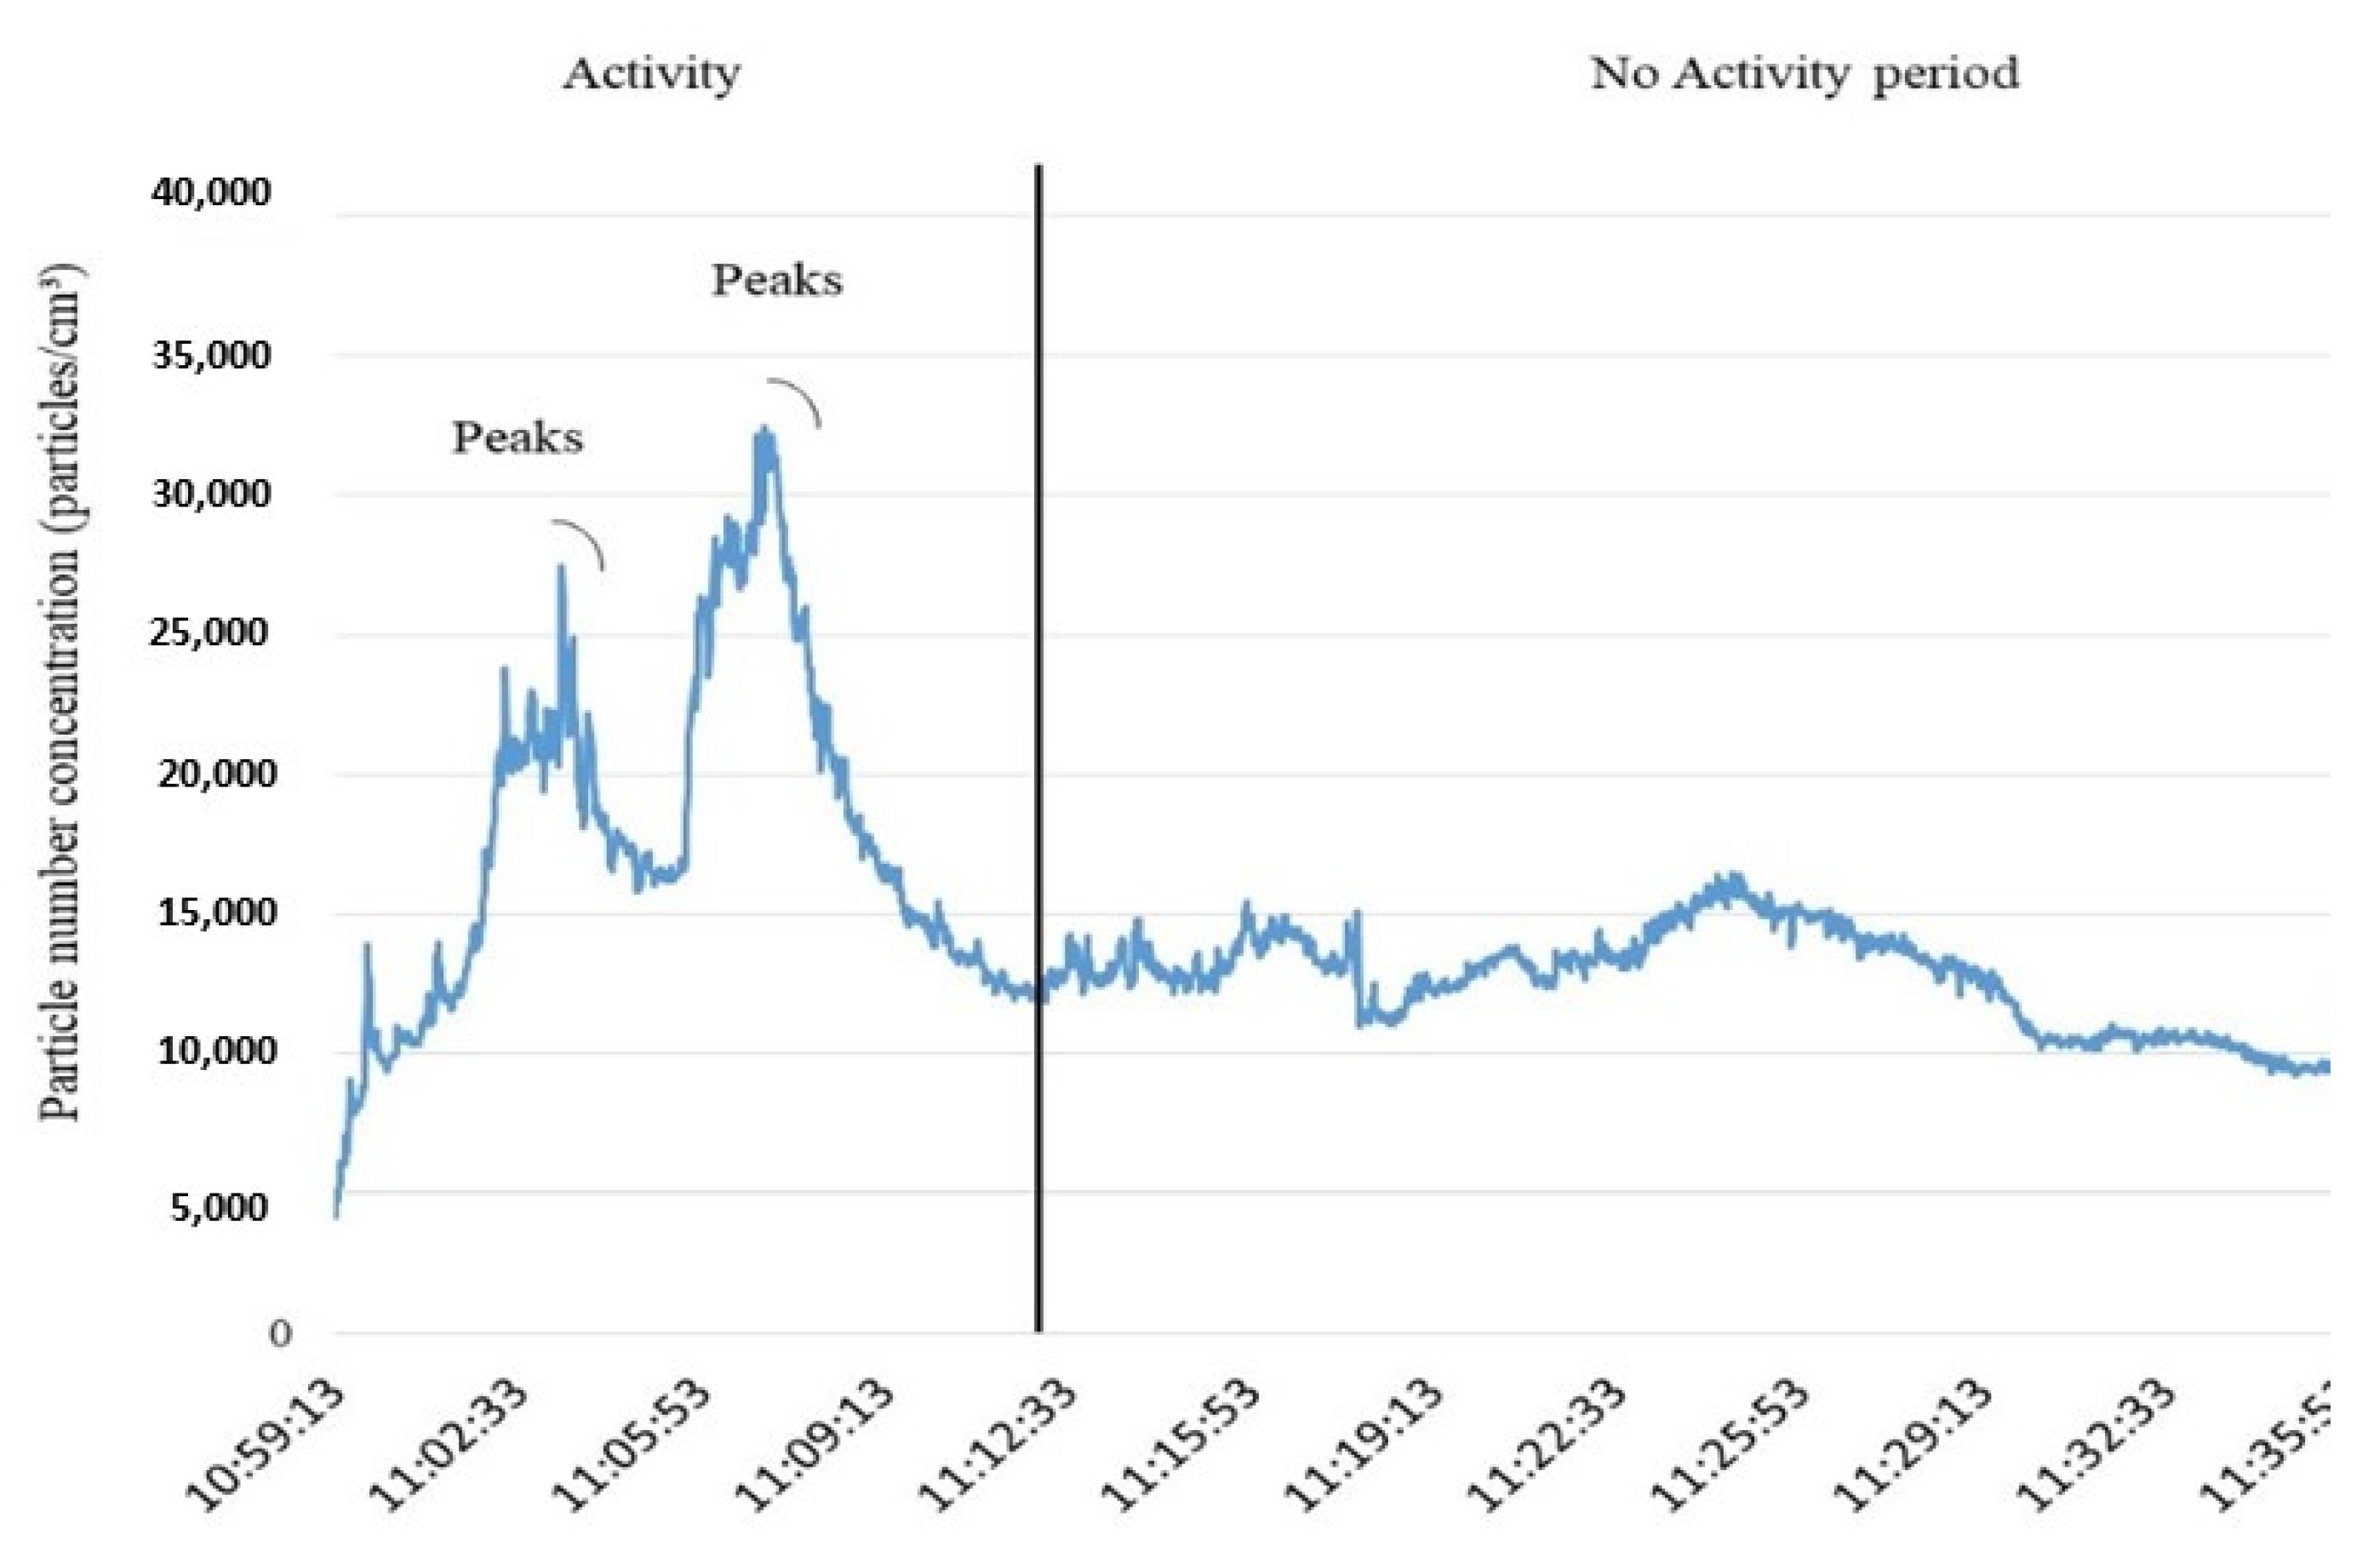
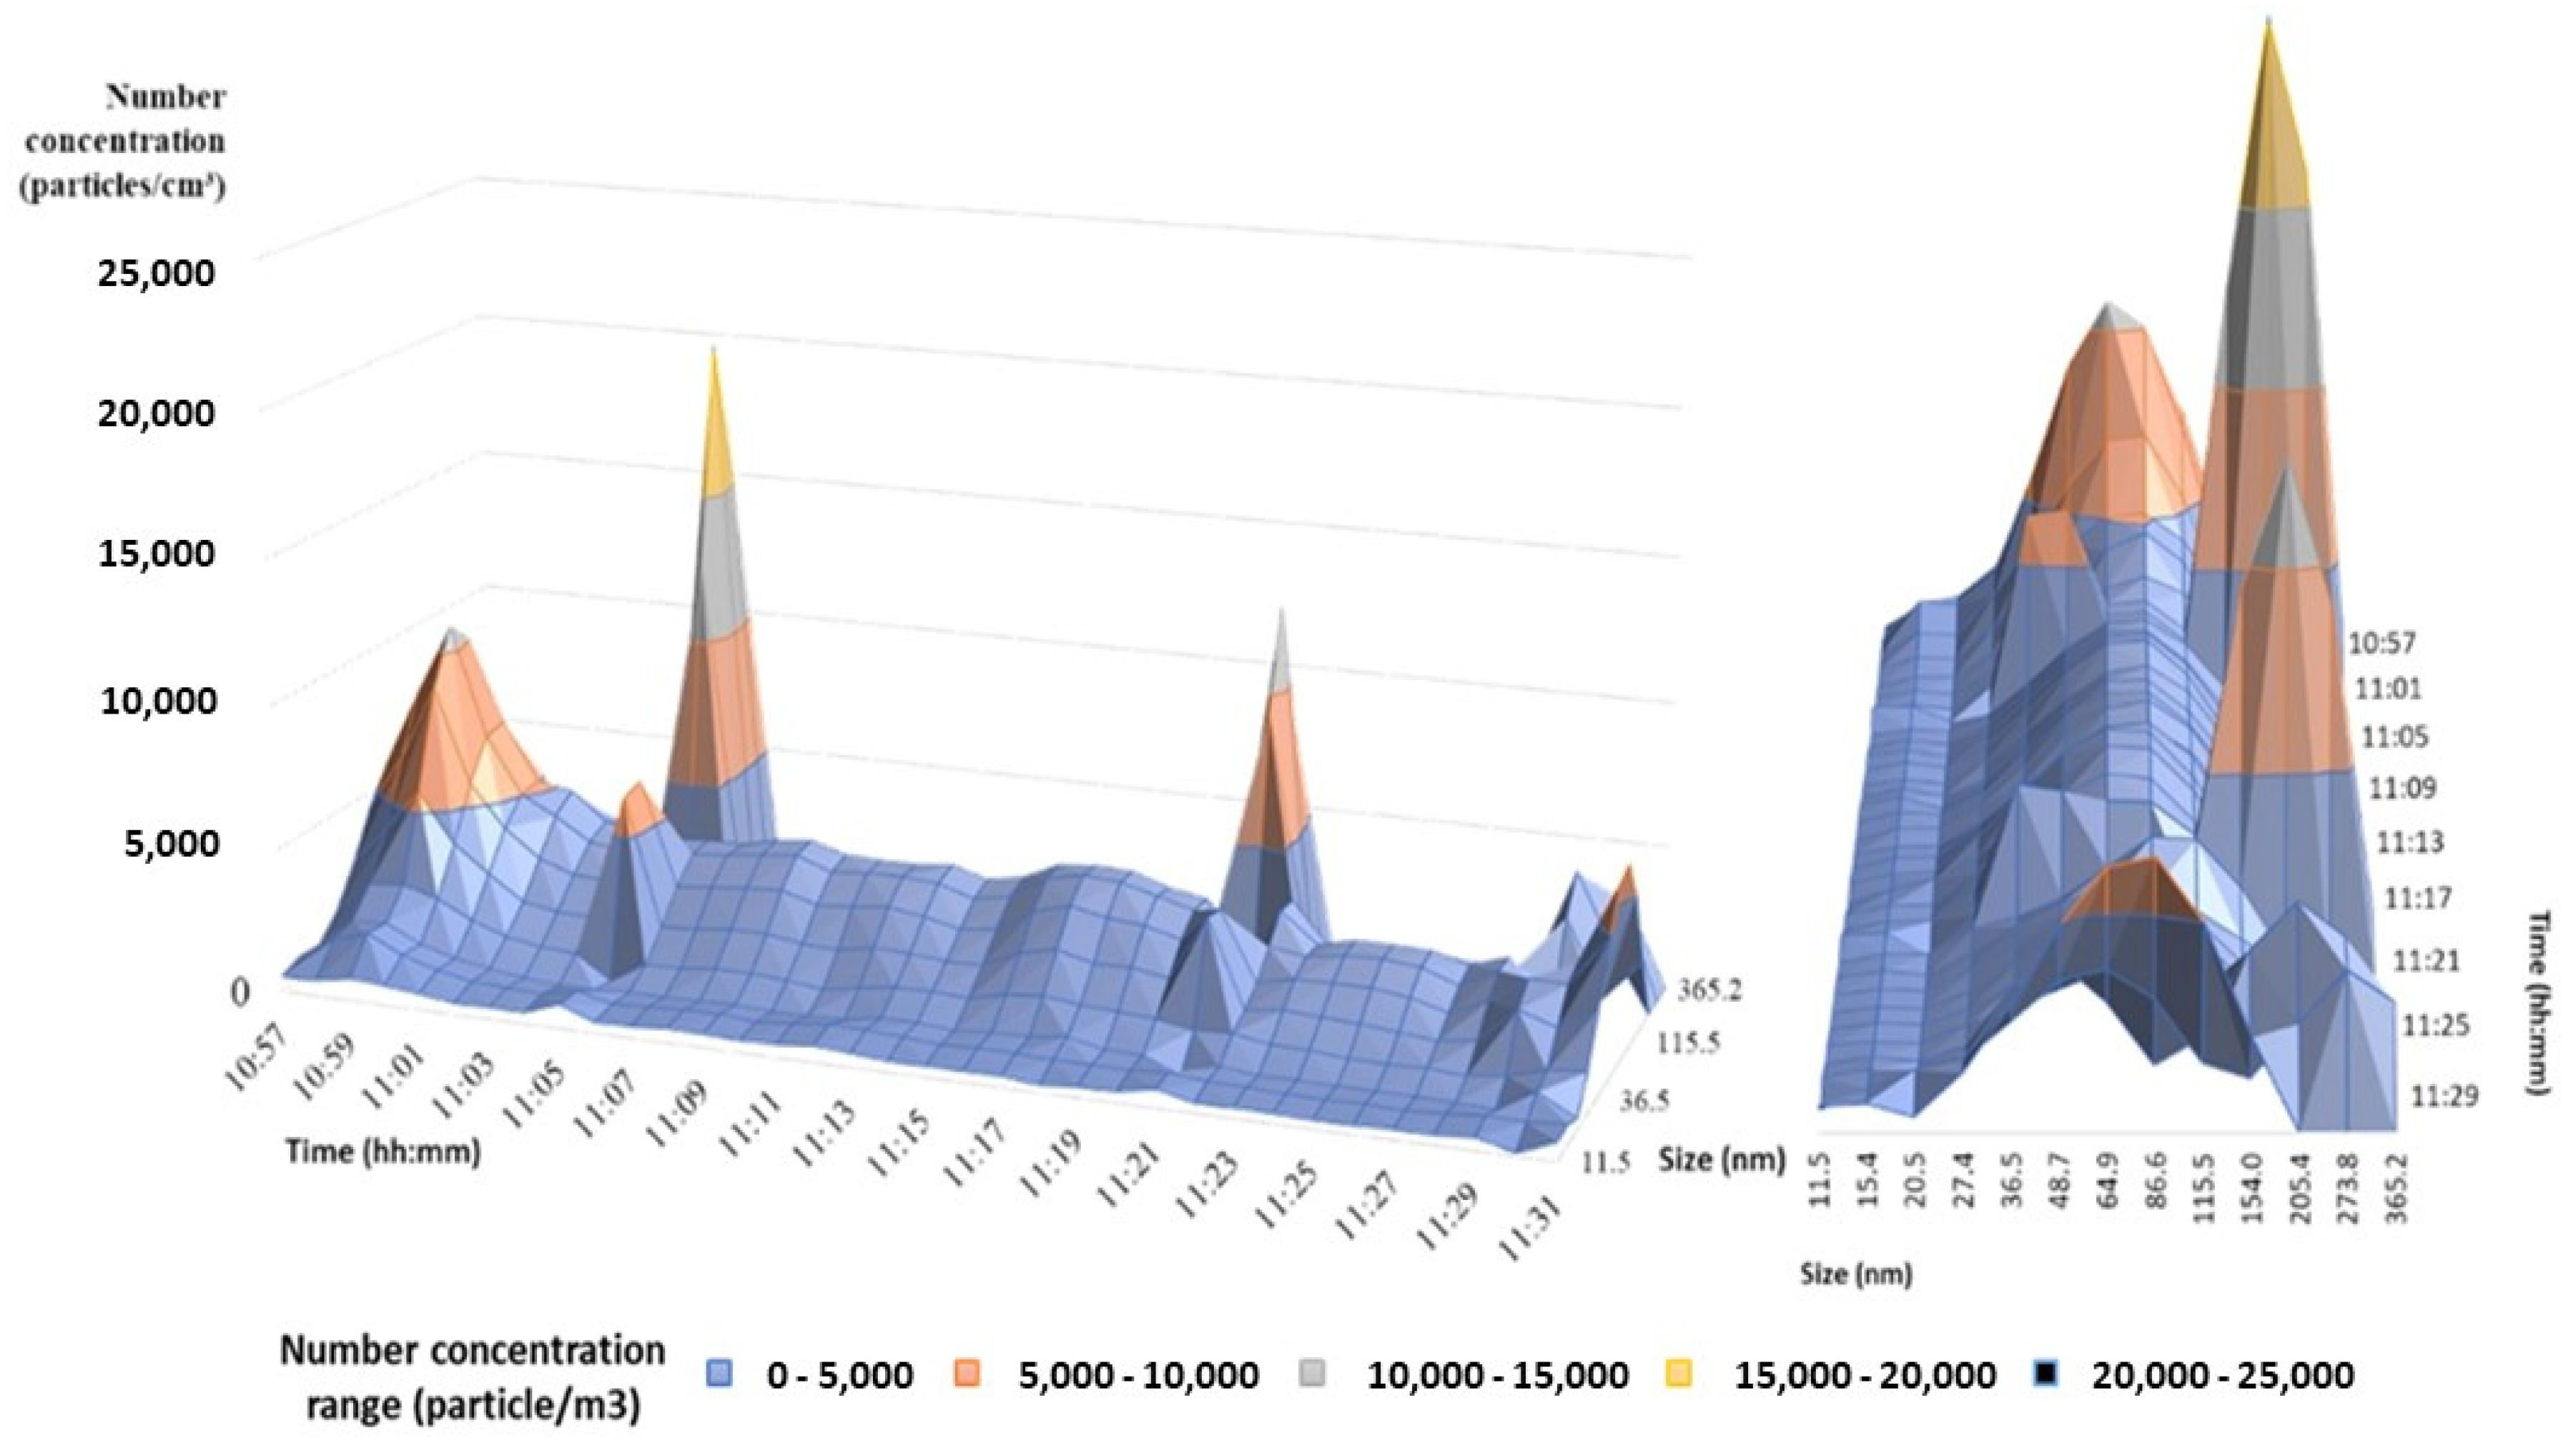
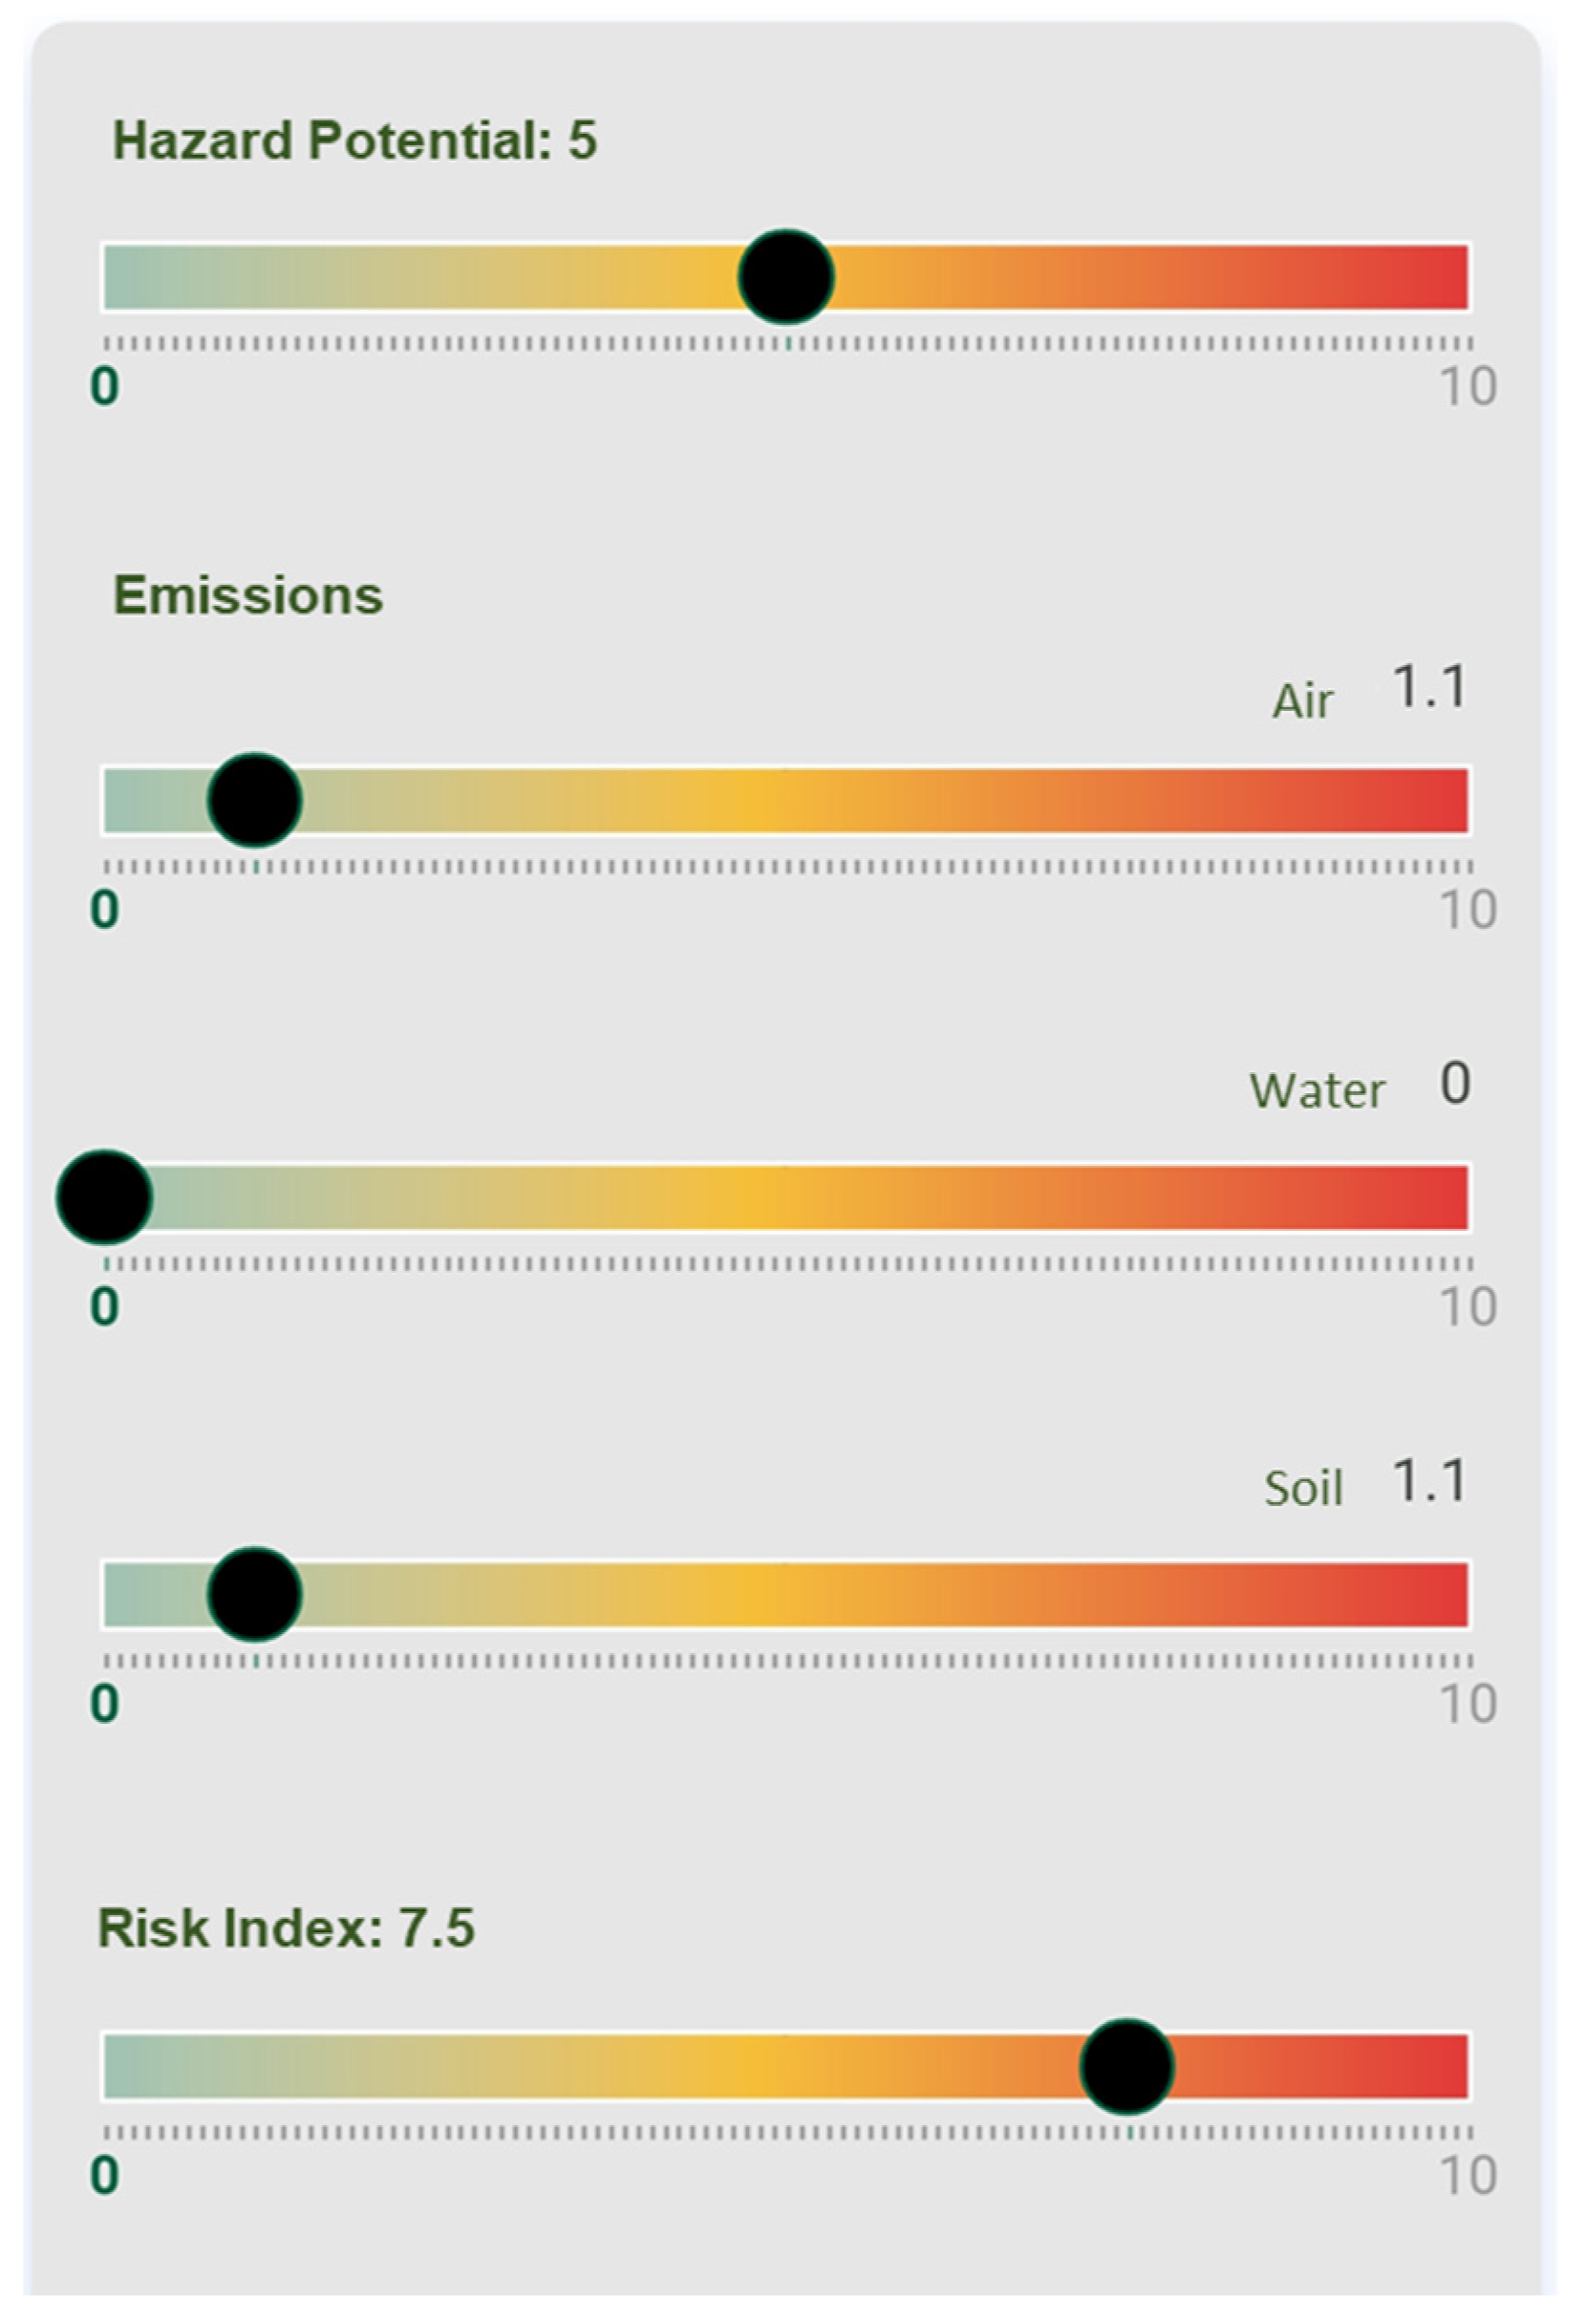
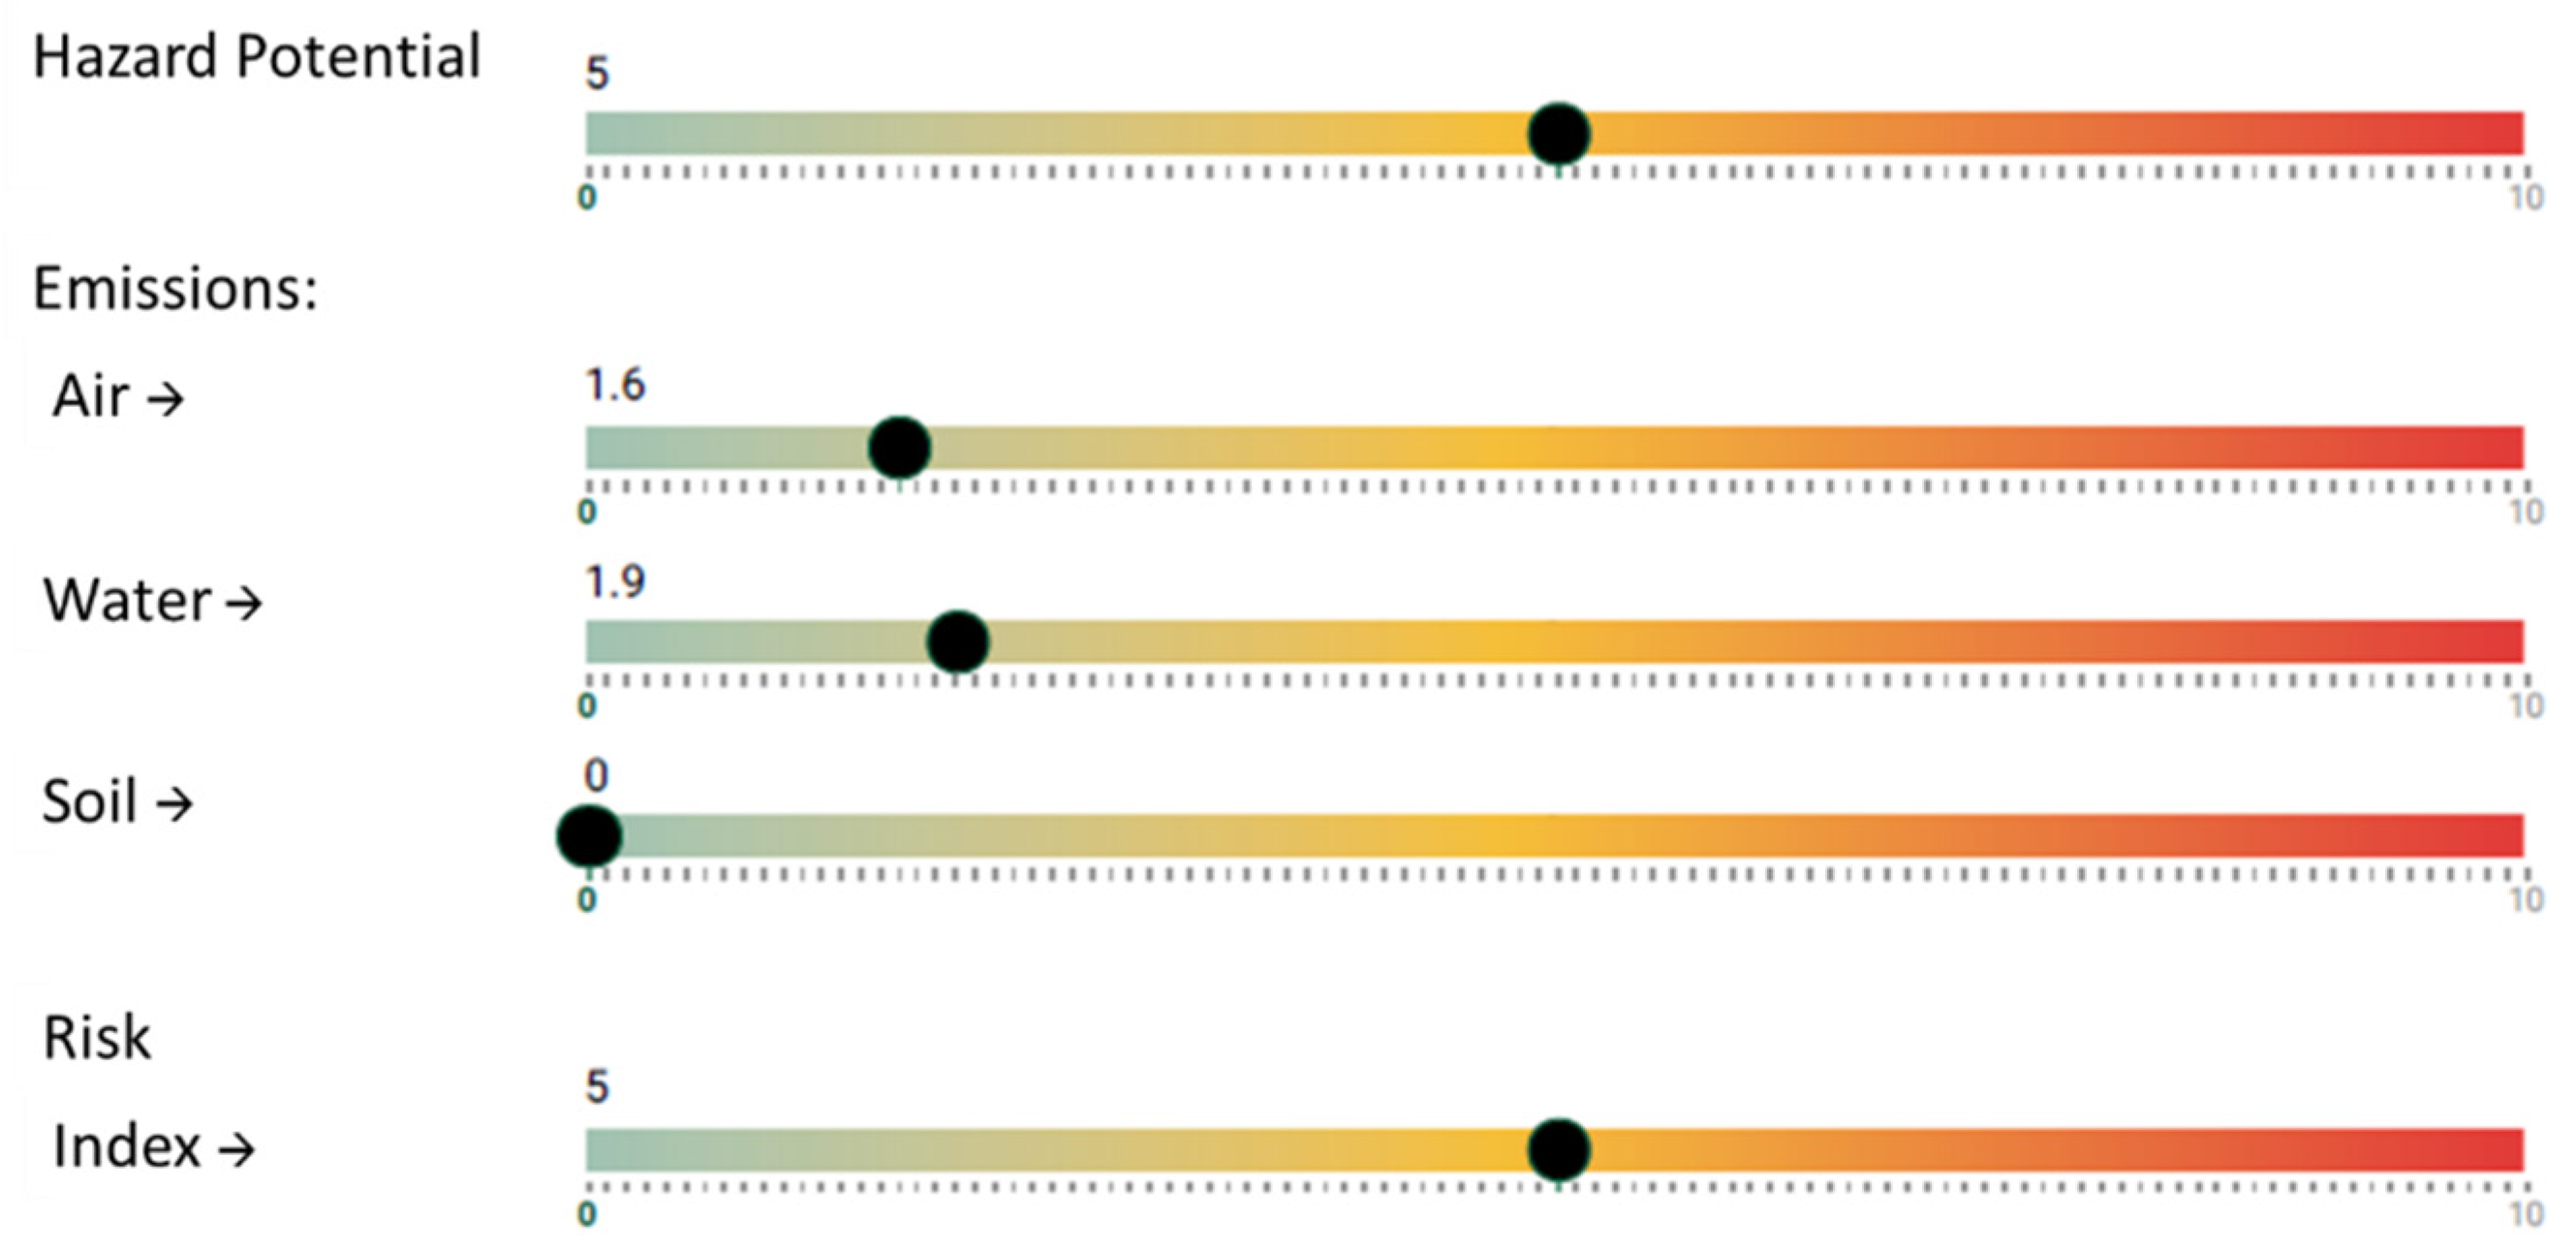
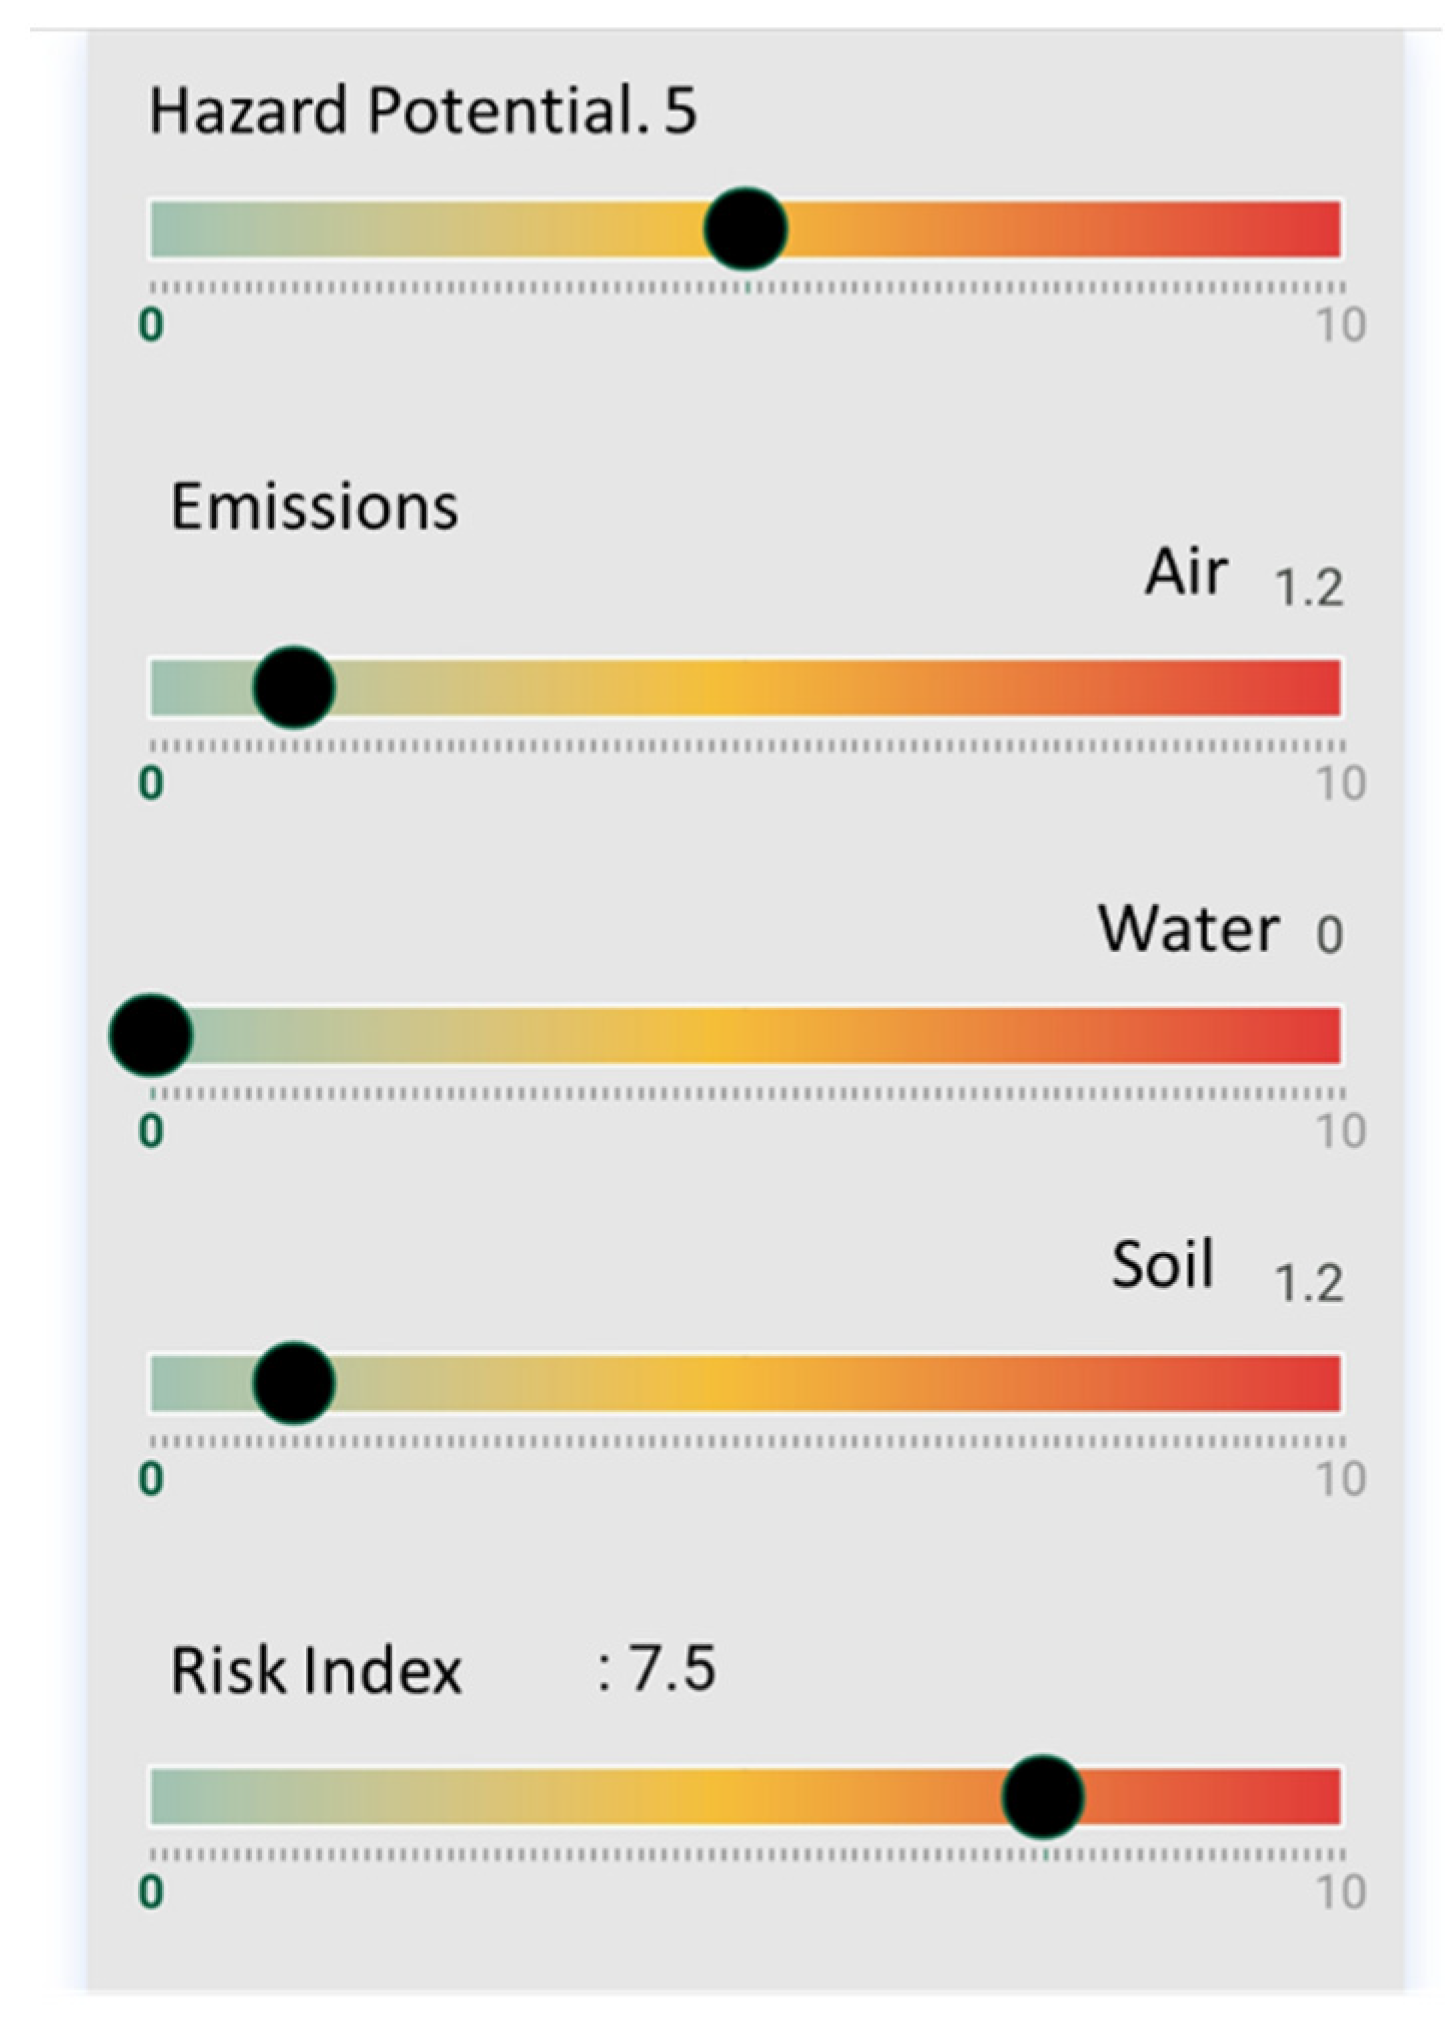
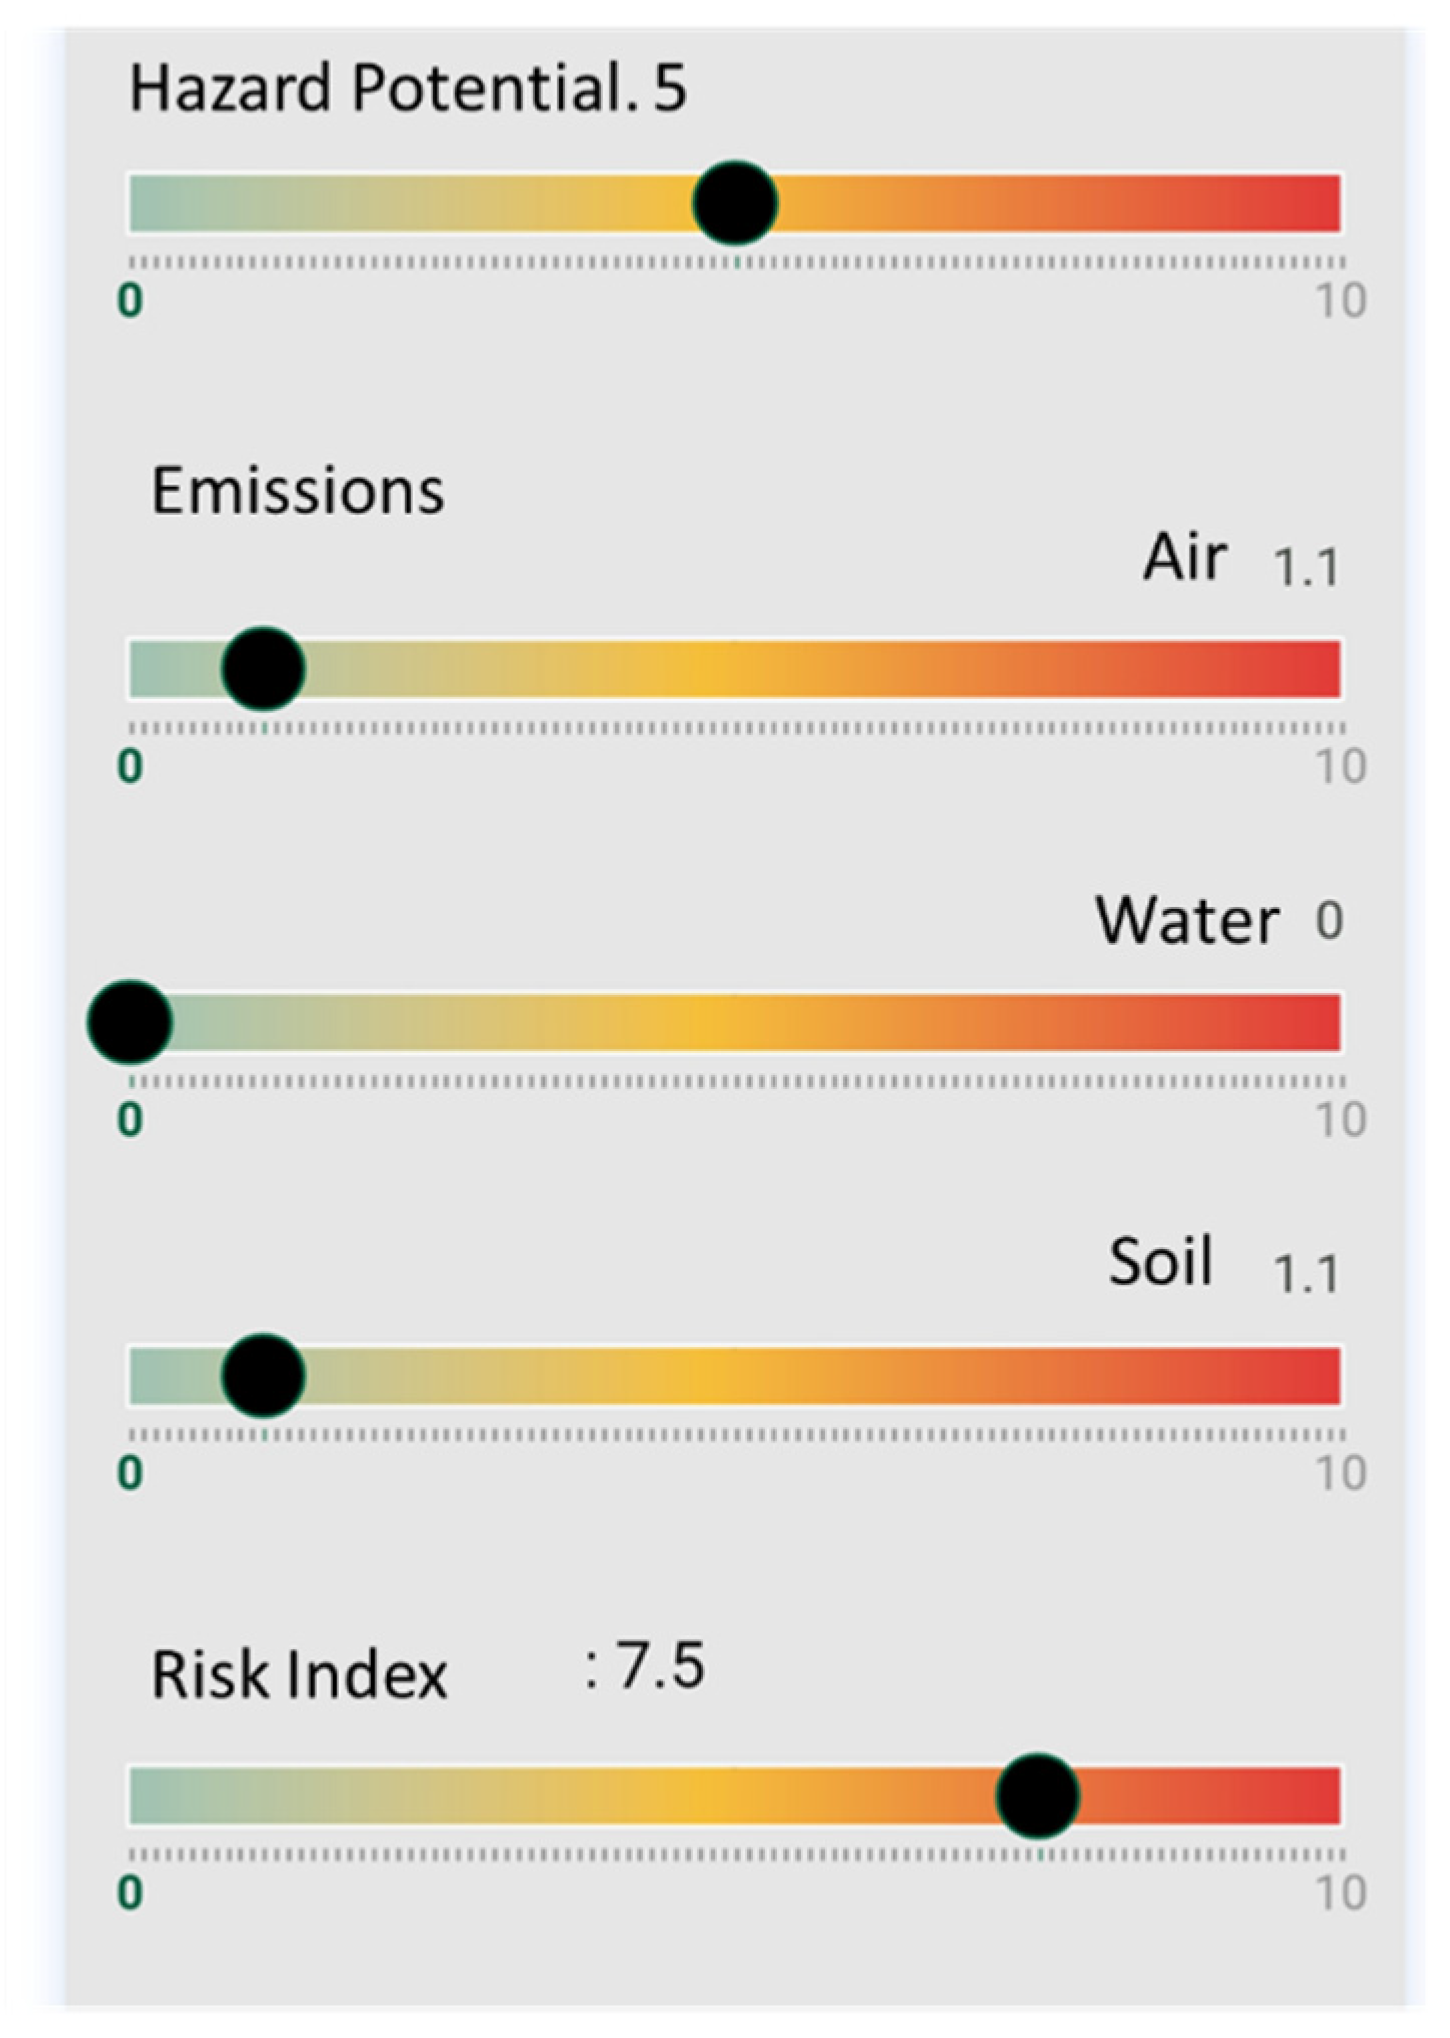
3.2. Accidental Spillage of a Dry Mortar
- Implementation of engineering controls, including forced ventilation and/or containment systems.
- Use of individual protective equipment according to the route of exposure.
- Any technical assistance that, due to the characteristics of the situation and the material, the inspector technician considers necessary to apply.
3.3. Literature-Based Scenarios
3.3.1. SiO2 Nanoparticle Leak from a Vacuum Cleaner
3.3.2. Release of TiO2 Nanopowder from a Bag Filter System
3.3.3. Leak of Black Carbon during Transportation
3.3.4. Fall of Eight TiO2 Bulk Bags on the Road
4. Conclusions
Author Contributions
Funding
Institutional Review Board Statement
Informed Consent Statement
Conflicts of Interest
Appendix A

| AVAILABLE TOOLS | Criteria | ||||||||
|---|---|---|---|---|---|---|---|---|---|
| Applicable for Workplace Safety | Applicable for Consumer Risk Assessment | Applicable for Environmental Risk Assessment | Comparison with Risk Control Cost | Quantitative Estimation/Information | Uncertainty Analysis | Life Cycle Perspective | Documented Applications | Assessment Tier | |
| Nanomaterials Control Banding Tool | + | − | − | − | − | − | − | − | Low |
| NanoSafer | + | − | − | − | + | − | + | + | Low |
| Advanced REACH Tool (ART) | + | − | − | − | + | − | − | + | High |
| Precautionary Matrix for Synthetic Nanomaterials | + | + | + | − | − | ± | ± | − | Low |
| Tool for ENM-Application Pair Risk Ranking (TEARR) | + | + | − | − | ± | − | ± | − | Low |
| Dermal Advanced REACH Tool (DART) | + | + | − | − | + | − | − | − | Low/high |
| SUN Tiered Occupational and Consumer Exposure Model | + | + | − | − | ± | + | − | + | Low/high |
| LICARA | + | + | + | + | ± | − | + | − | Low |
| SUN DSS | + | + | + | Performs socioeconomic analysis (SEA) to check if the benefits of using certain nanoproducts significantly outweigh their risks | + | + | + | + | Low/high |
| GUIDEnano DSS | + | + | + | − | + | + | + | − | Low/high |
References
- Impact of Engineered Nanomaterials on Health: Considerations for Benefit Risk Assessment; EASAC Policy Report, JRC Reference Report; Publications Office of the European Union: Luxembourg, 2011.
- Jeevanandam, J.; Barhoum, A.; Chan, Y.S.; Dufresne, A.; Danquah, M.K. Review on nanoparticles and nanostructured materials: History, sources, toxicity and regulations. Beilstein J. Nanotechnol. 2018, 9, 1050–1074. [Google Scholar] [CrossRef] [PubMed] [Green Version]
- Baalousha, M.; Cornelis, G.; Kuhlbusch, T.; Lynch, I.; Nickel, C.; Peijnenburg, W.; Brink, N.V.D. Modeling nanomaterial fate and uptake in the environment: Current knowledge and future trends. Environ. Sci. Nano 2016, 3, 323–345. [Google Scholar] [CrossRef]
- Gutleb, A.C.; Cambier, S.; Fernandes, T.; Georgantzopoulou, A.; Kuhlbusch, T.A.J.; Lynch, I.; Macken, A.; Mehennaoui, K.; Mowller, R.; Nickel, C.; et al. Chapter 4: Environmental Fate and Effects of Nanomaterials in Aquatic Freshwater Environments. In Nanomaterials—A Guide to Fabrication and Applications; Krishnamoorthy, S., Ed.; CRC Press: Boca Raton, FL, USA, 2015. [Google Scholar]
- Keller, A.A.; McFerran, S.; Lazareva, A.; Suh, S. Global life cycle releases of engineered nanomaterials. J. Nanopart. Res. 2013, 15, 1–17. [Google Scholar] [CrossRef]
- Baron, M. Safe Handling of Nano Materials and Other Advanced Materials at Workplaces; Project Number: F 2268; Bundesanstalt für Arbeitsschutz und Arbeitsmedizin: Dortmund, Germany, 2015; p. 52. [Google Scholar]
- John, A.; Küpper, M.; Manders-Groot, A.; Debray, B.; Lacome, J.-M.; Kuhlbusch, T. Emissions and Possible Environmental Implication of Engineered Nanomaterials (ENMs) in the Atmosphere. Atmosphere 2017, 8, 84. [Google Scholar] [CrossRef] [Green Version]
- Giese, B.; Klaessig, F.; Park, B.; Kaegi, R.; Steinfeldt, M.; Wigger, H.; Von Gleich, A.; Gottschalk, F. Risks, Release and Concentrations of Engineered Nanomaterial in the Environment. Sci. Rep. 2018, 8, 1–18. [Google Scholar] [CrossRef] [PubMed]
- Le Reference du Retour d’Expérience sur Accidents Technologiques. Available online: https://www.aria.developpement-durable.gouv.fr/ (accessed on 16 June 2020).
- Boowook, K.; Hyunwook, K.; Il, J.Y. Assessment of Nanoparticle Exposure in Nansilica Handling Process: Including Characteristics of Nanoparticles Leaking from a Vacuum Cleaner. Ind. Health 2014, 52, 152–162. [Google Scholar]
- Ji, J.H.; Kim, J.B.; Lee, G.; Noh, J.-H.; Yook, S.-J.; Cho, S.-H.; Bae, G.-N. Workplace Exposure to Titanium Dioxide Nanopowder Released from a Bag Filter System. Biomed Res. Int. 2015, 2015, 1–9. [Google Scholar] [CrossRef] [PubMed]
- NIOSH 2011. Occupational Exposure to Titanium Dioxide; Publication No. 2011-160; DHHS (NIOSH) Publication: Cincinnati, OH, USA, 2011. [Google Scholar]
- NIOSH 2013. Occupational Exposure to Carbon Nanotubes and Nanofibers; Publication No.2013-145; DHHS (NIOSH) Publication: Cincinnati, OH, USA, 2013. [Google Scholar]
- Zalk, D.M.; Kamerzell, R.; Paik, S.; Kapp, J.; Harrington, D.; Swuste, P. Risk Level Based Management System: A Control Banding Model for Occupational Health and Safety Risk Management in a Highly Regulated Environment. Ind. Health 2010, 48, 18–28. [Google Scholar] [CrossRef] [PubMed]
- Stoffen Manager Nano. Available online: http://nano.stoffenmanager.nl./ (accessed on 19 November 2020).
- ISO/TS 12901-2:2014. Available online: http://iso.org/ (accessed on 18 September 2020).
- Hristozov, D.; Gottardo, S.; Semenzin, E.; Oomen, A.; Bos, P.; Peijnenburg, W.; van Tongeren, M.; Nowack, B.; Hunt, N.; Brunelli, A.; et al. Frameworks and tools for risk assessment of manufactured nanomaterials. Environ. Int. 2016, 95, 36–53. [Google Scholar] [CrossRef] [PubMed]
- West, G.H.; Lippy, B.E.; Cooper, M.R.; Marsick, D.; Burrelli, L.G.; Griffin, K.N.; Segrave, A.M. Toward responsible development and effective risk management of nano-enabled products in the U.S. construction industry. J. Nanopart. Res. 2016, 18, 1–27. [Google Scholar] [CrossRef]
- Pietroiusti, A.; Stockmann-Juvala, H.; Lucaroni, F.; Savolainen, K. Nanomaterial exposure, toxicity, and impact on human health. Wiley Interdiscip. Rev. Nanomed. Nanobiotechnol. 2018, 10, e1513. [Google Scholar] [CrossRef] [PubMed]
- Höck, J.; Hofmann, H.; Krug, H.; Lorenz, C.; Limbach, L.; Nowack, B. Guidelines on the Precautionary Matrix for Synthetic Nanomaterials; Federal Office for Public Health and Federal Office for the Environment: Berne, Switzerland, 2008. [Google Scholar]
- Höck, J.; Epprecht, T.; Furrer, E.; Hofmann, H.; Höhner, K.; Krug, H. Guidelines on the Precautionary Matrix for Synthetic Nanomaterials; Version 2.1.; Federal Office of Public Health and Federal Office for the Environment: Berne, Switzerland, 2011. [Google Scholar]
- Hansen, S.F.; Alstrup-Jensen, K.; Baun, A. NanoRiskCat—A Conceptual Model for Risk Classification of Nanomaterials; Environmental Project No. 1372 2011; Danish Environmental Protection Agency: Copenhagen, Denmark, 2011. [Google Scholar]
- Hansen, S.F.; Jensen, K.A.; Baun, A. NanoRiskCat: A conceptual tool for categorization and communication of exposure potentials and hazards of nanomaterials in consumer products. J. Nanopart. Res. 2013, 16, 2195. [Google Scholar] [CrossRef]
- Paik, S.Y.; Zalk, D.M.; Swuste, P. Application of a Pilot Control Banding Tool for Risk Level Assessment and Control of Nanoparticle Exposures. Ann. Occup. Hyg. 2008, 52, 419–428. [Google Scholar] [CrossRef] [PubMed] [Green Version]
- Kristensen, H.V.; Hansen, S.V.; Holm, G.R. Nanopartikler i Arbejdsmiljøet—Viden og Inspiration om Håndtering af Nanomaterialer; Teknologisk Institut, Center for Arbejdsliv: Copenhagen, Denmark, 2010; ISBN 978-87-92141-28-6. [Google Scholar]
- Widler, T.; Meili, C.; Semenzin, E.; Subramanian, V.; Zabeo, A.; Hristozov, D.; Marcomini, A. Organisational Risk Management of Nanomaterials Using SUNDS: The Contribution of CENARIOS®. Innovation, Technology, and Knowledge Management. In Managing Risk in Nanotechnology; Murphy, F., McAlea, E.M., Mullins, M., Eds.; Springer: Berlin/Heidelberg, Germany, 2016; pp. 219–235. [Google Scholar]
- Som, C.; Zondervan-van den Beuken, E.; Van Harmelen, T.; Güttinger, J.; Bodmer, M.; Brouwer, D.; Buist, H.E.; Carroll, R.; Coll, C.; Fransman, W.; et al. LICARA Guidelines for the Sustainable Competitiveness of Nanoproducts; Dübendorf: St. Gallen, Switzerland, 2014. [Google Scholar]
- IRGC. Risk Governance: Towards an Integrative Approach. 2005. Available online: http://www.irgc.org/publications/coreconcepts-of-risk-governance/IRGC(2007)Nanotechnologyrisk (accessed on 16 September 2020).
- eNanoMapper Database. Available online: https://data.enanomapper.net (accessed on 24 October 2020).
- Nanodesk Tools: The Platform. Available online: http://sudoenanodesk.net/elearning (accessed on 17 September 2020).
- Nowack, B. Evaluation of environmental exposure models for engineered nanomaterials in a regulatory context. NanoImpact 2017, 8, 38–47, ISSN 2452-0748. [Google Scholar] [CrossRef]
- Monteiro, J.V.D.; Banerjee, S.; Ramachandran, G. B2Z: An R Package for Bayesian Two-Zone Models. J. Stat. Softw. 2011, 43, 1–23. [Google Scholar] [CrossRef] [Green Version]
- Nicas, M. Mathematical Models for Estimating Occupational Exposure to Chemicals, Chapter Two-Zone Model; AIHA Press: Fairfax, VA, USA, 2000; pp. 51–56. [Google Scholar]
- Python. Available online: https://www.python.org/ (accessed on 29 November 2020).
- Schneider, T.; Brouwer, D.H.; Koponen, I.K.; Jensen, K.A.; Fransman, W.; Van Duuren-Stuurman, B.; Van Tongeren, M.; Tielemans, E. Conceptual model for assessment of inhalation exposure to manufactured nanoparticles. J. Expo. Sci. Environ. Epidemiol. 2011, 21, 450–463. [Google Scholar] [CrossRef] [PubMed]
- Tsang, M.P.; Li, D.; Garner, K.L.; Keller, A.A.; Suh, S.; Sonnemann, G.W. Modeling human health characterization factors for indoor nanomaterial emissions in life cycle assessment: A case-study of titanium dioxide. Environ. Sci. Nano 2017, 4, 1705–1721. [Google Scholar] [CrossRef] [Green Version]
- Ganser, G.H.; Hewett, P. Models for nearly every occasion: Part II—Two box models. J. Occup. Environ. Hyg. 2016, 14, 58–71. [Google Scholar] [CrossRef] [PubMed]
- Gottschalk, F.; Scholz, R.W.; Nowack, B. Probabilistic material flow modeling for assessing the environmental exposure to compounds: Methodology and an application to engineered nano-TiO2 particles. Environ. Model. Softw. 2010, 25, 320–332. [Google Scholar] [CrossRef]
- Spinazzè, A.; Cattaneo, A.; Borghi, F.; Del Buono, L.; Campagnolo, D.; Rovelli, S.; Cavallo, D.M. Probabilistic approach for the risk assessment of nanomaterials: A case study for graphene nanoplatelets. Int. J. Hyg. Environ. Health 2019, 222, 76–83. [Google Scholar] [CrossRef] [PubMed]
- Air Quality Index (AQI) Basics. Available online: https://www.airnow.gov/aqi/aqi-basics/ (accessed on 24 September 2020).
- Simple European Calculator of DNEL Tool (SECO). Characterisation of Dose [Concentration]-Response for Human Health R.8; ECHA: Bern, Switzerland, 2012. [Google Scholar]
- ACGIH. TLVs® and BEIs® Based on the Documentation of the Threshold Limit Values for Chemical Substances and Physical Agents and Biological Exposure Indices; American Conference of Governmental Industrial Hygienists: Cincinnati, OH, USA, 2009. [Google Scholar]


| Flow | TCs (%) |
|---|---|
| ENPP->Air | 5.00 |
| ENPP->Water | 6.00 |
| ENPP->Soil | 0.01 |
| ENPP->NAMF | 88.99 |
| NAMF->Air | 10.87 |
| NAMF->Water | 7.15 |
| NAMF->Soil | 0.58 |
| NAMF->Products | 81.40 |
| Products->Air | 5.00% |
| Products->Water | 0.00% |
| Products->Soil | 5.00% |
| Products->WIP | 50.00% |
| Products->STP | 5.00% |
| Products->Export | 35.00% |
| STP->Air | 0.00% |
| STP->Water | 3.00% |
| STP->Soil | 0.00% |
| STP->WIP | 97.00% |
| WIP->Filter | 30.00% |
| WIP->Export | 70.00% |
| Filter->Air | 1.00% |
| Filter->Export | 99.00% |
| Air->Water | 3.00% |
| Air->Soil | 97.00% |
| Emission Hazard | Very Low | Low | Medium | High | Very High |
|---|---|---|---|---|---|
| Very low | 0 | 2.5 | 2.5 | 5 | 5 |
| Low | 2.5 | 2.5 | 5 | 5 | 7.5 |
| Medium | 2.5 | 5 | 5 | 7.5 | 7.5 |
| High | 5 | 5 | 7.5 | 7.5 | 10 |
| Very high | 5 | 7.5 | 7.5 | 10 | 10 |
| Equipment | Weight Fraction | Time of Exposure (BG/Act/Pers) | Averaged Graphene Content—8 h TWA Workplace | Averaged Graphene Content—8 h TWA Personal | Units | Corrected RCR Graphene (Workplace) | Corrected RCR Graphene (Personal) |
|---|---|---|---|---|---|---|---|
| CPC 3007 TSI | 0.% | 10 min | 1.53 × 100 | 2.41 × 100 | #/cm3 | 1.63 × 10⁻⁵ | 2.57 × 10⁻⁵ |
| OPS 3330 TSI | 0.1% | 10 min | 1.05 × 10⁻² | 1.65 × 100 | #/cm3 | 1.12 × 10⁻⁷ | 1.76 × 10⁻⁵ |
| 0.1% | 10 min | 5.32 × 10⁻³ | 1.72 × 100 | µg/m3 | 1.19 × 10⁻⁴ | 3.84 × 10⁻² | |
| CPC 3007 TSI | 0.5% | 10 min | 7.44 | 8.03 × 100 | #/cm3 | 7.94 × 10⁻⁵ | 8.57 × 10⁻⁵ |
| OPS 3330 TSI | 0.5% | 10 min | 6.37 × 10⁻² | 4.11 × 10⁻² | #/cm3 | 6.80 × 10⁻⁷ | 4.39 × 10⁻⁷ |
| 0.5% | 10 min | 2.66 × 10⁻² | 3.47 × 10⁻² | µg/m3 | 5.96 × 10⁻⁴ | 7.76 × 10⁻⁴ |
| Input Data for NanoSerpa v1.0 Simulated Scenarios | |
|---|---|
| Group | Graphene |
| Nanomaterial | Graphene m-GO |
| Quantity | 10 mg |
| EHP | High |
| State | Liquid |
| Dustiness | - |
| Humidity | - |
| Viscosity | Low |
| Solubility | Low |
| Physical-Chemical Properties | Thickness: 0.9 nm |
| Toxicology | Size: 430 nm |
| Type of Information | No data |
| Measurement | Direct measurement |
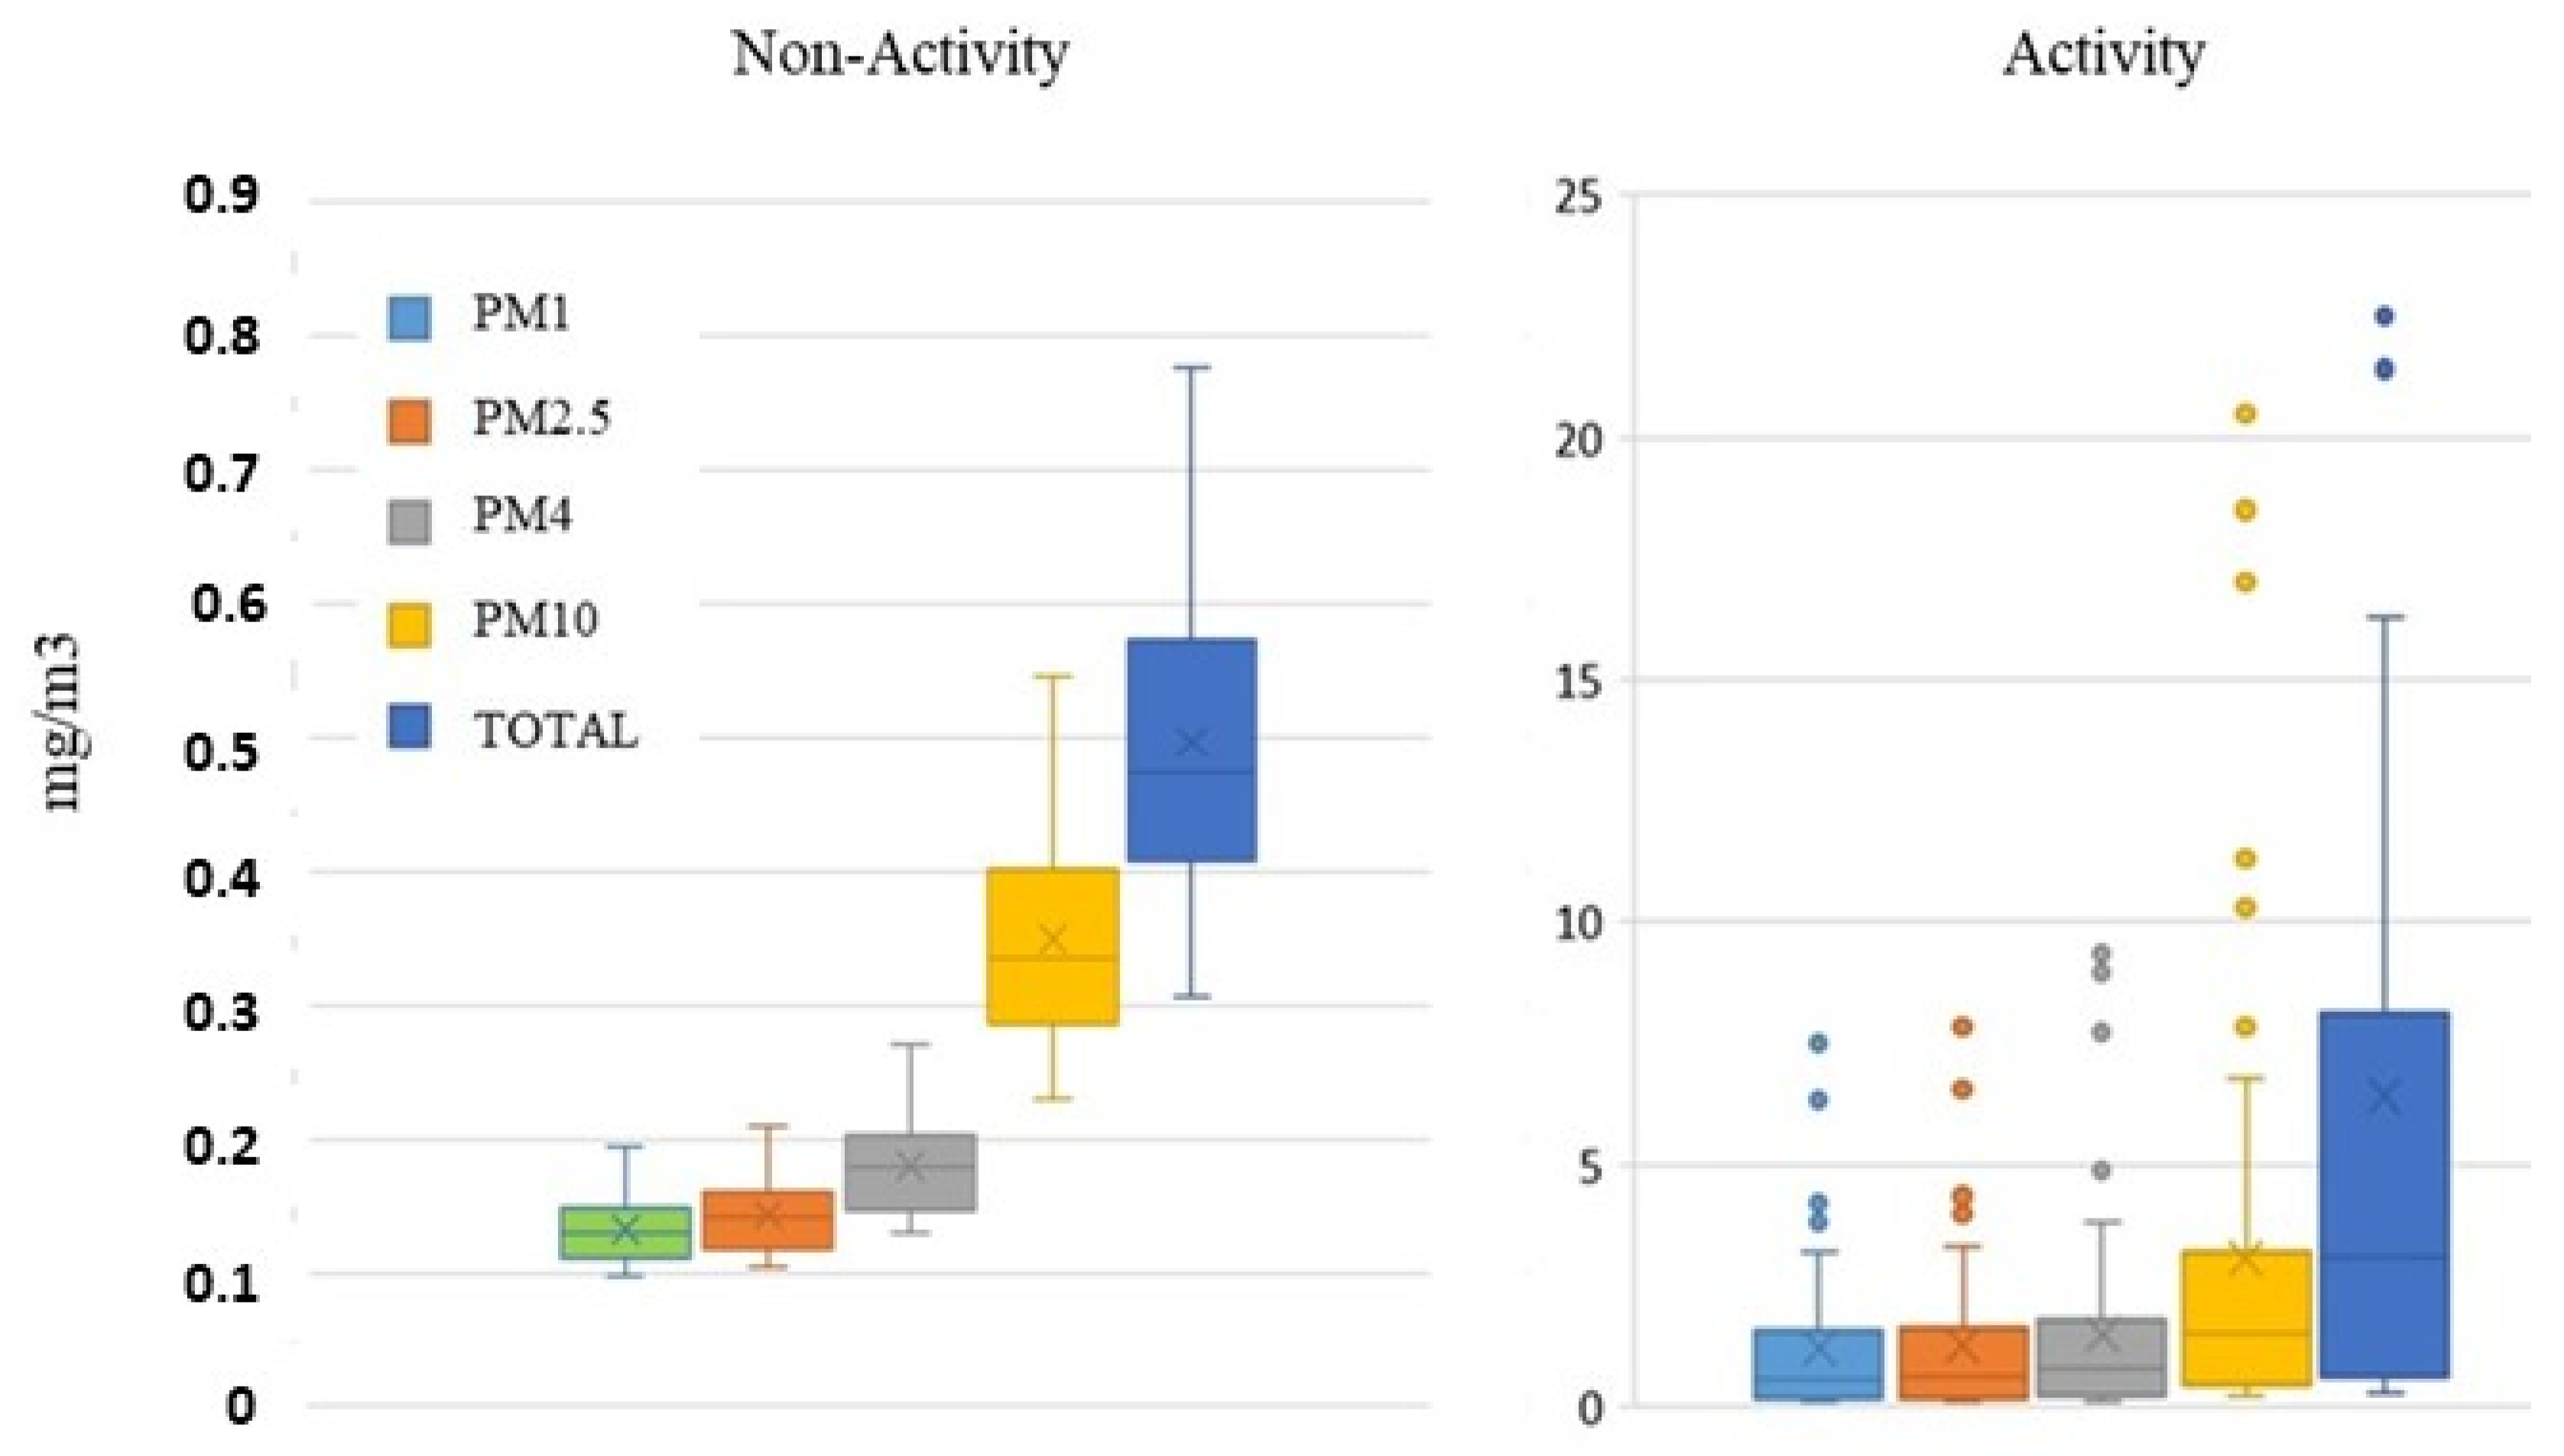
| PM1 | PM2.5 | PM4 | PM10 | Total | |
|---|---|---|---|---|---|
| Non-activity (mg/cm3) | 0.133 | 0.143 | 0.180 | 0.350 | 0.496 |
| Accidental spillage (mg/cm3) | 1.210 | 1.260 | 1.479 | 3.041 | 6.415 |
| Input Data for NanoSerpa v1.0 Simulated Scenarios | |
|---|---|
| Group | TiO2 |
| Nanomaterial | TiO2 |
| Quantity | 25 kg |
| EHP | Low |
| State | Solid |
| Dustiness | Medium |
| Humidity | Low |
| Physical-Chemical Properties | Particle size: 65 nm |
| Toxicology | No data |
| Type of Information | Documental |
| Measurement | Direct measurement |
| Scenario | RCREXPERIMENTAL | NanoSerpa App RISK |
|---|---|---|
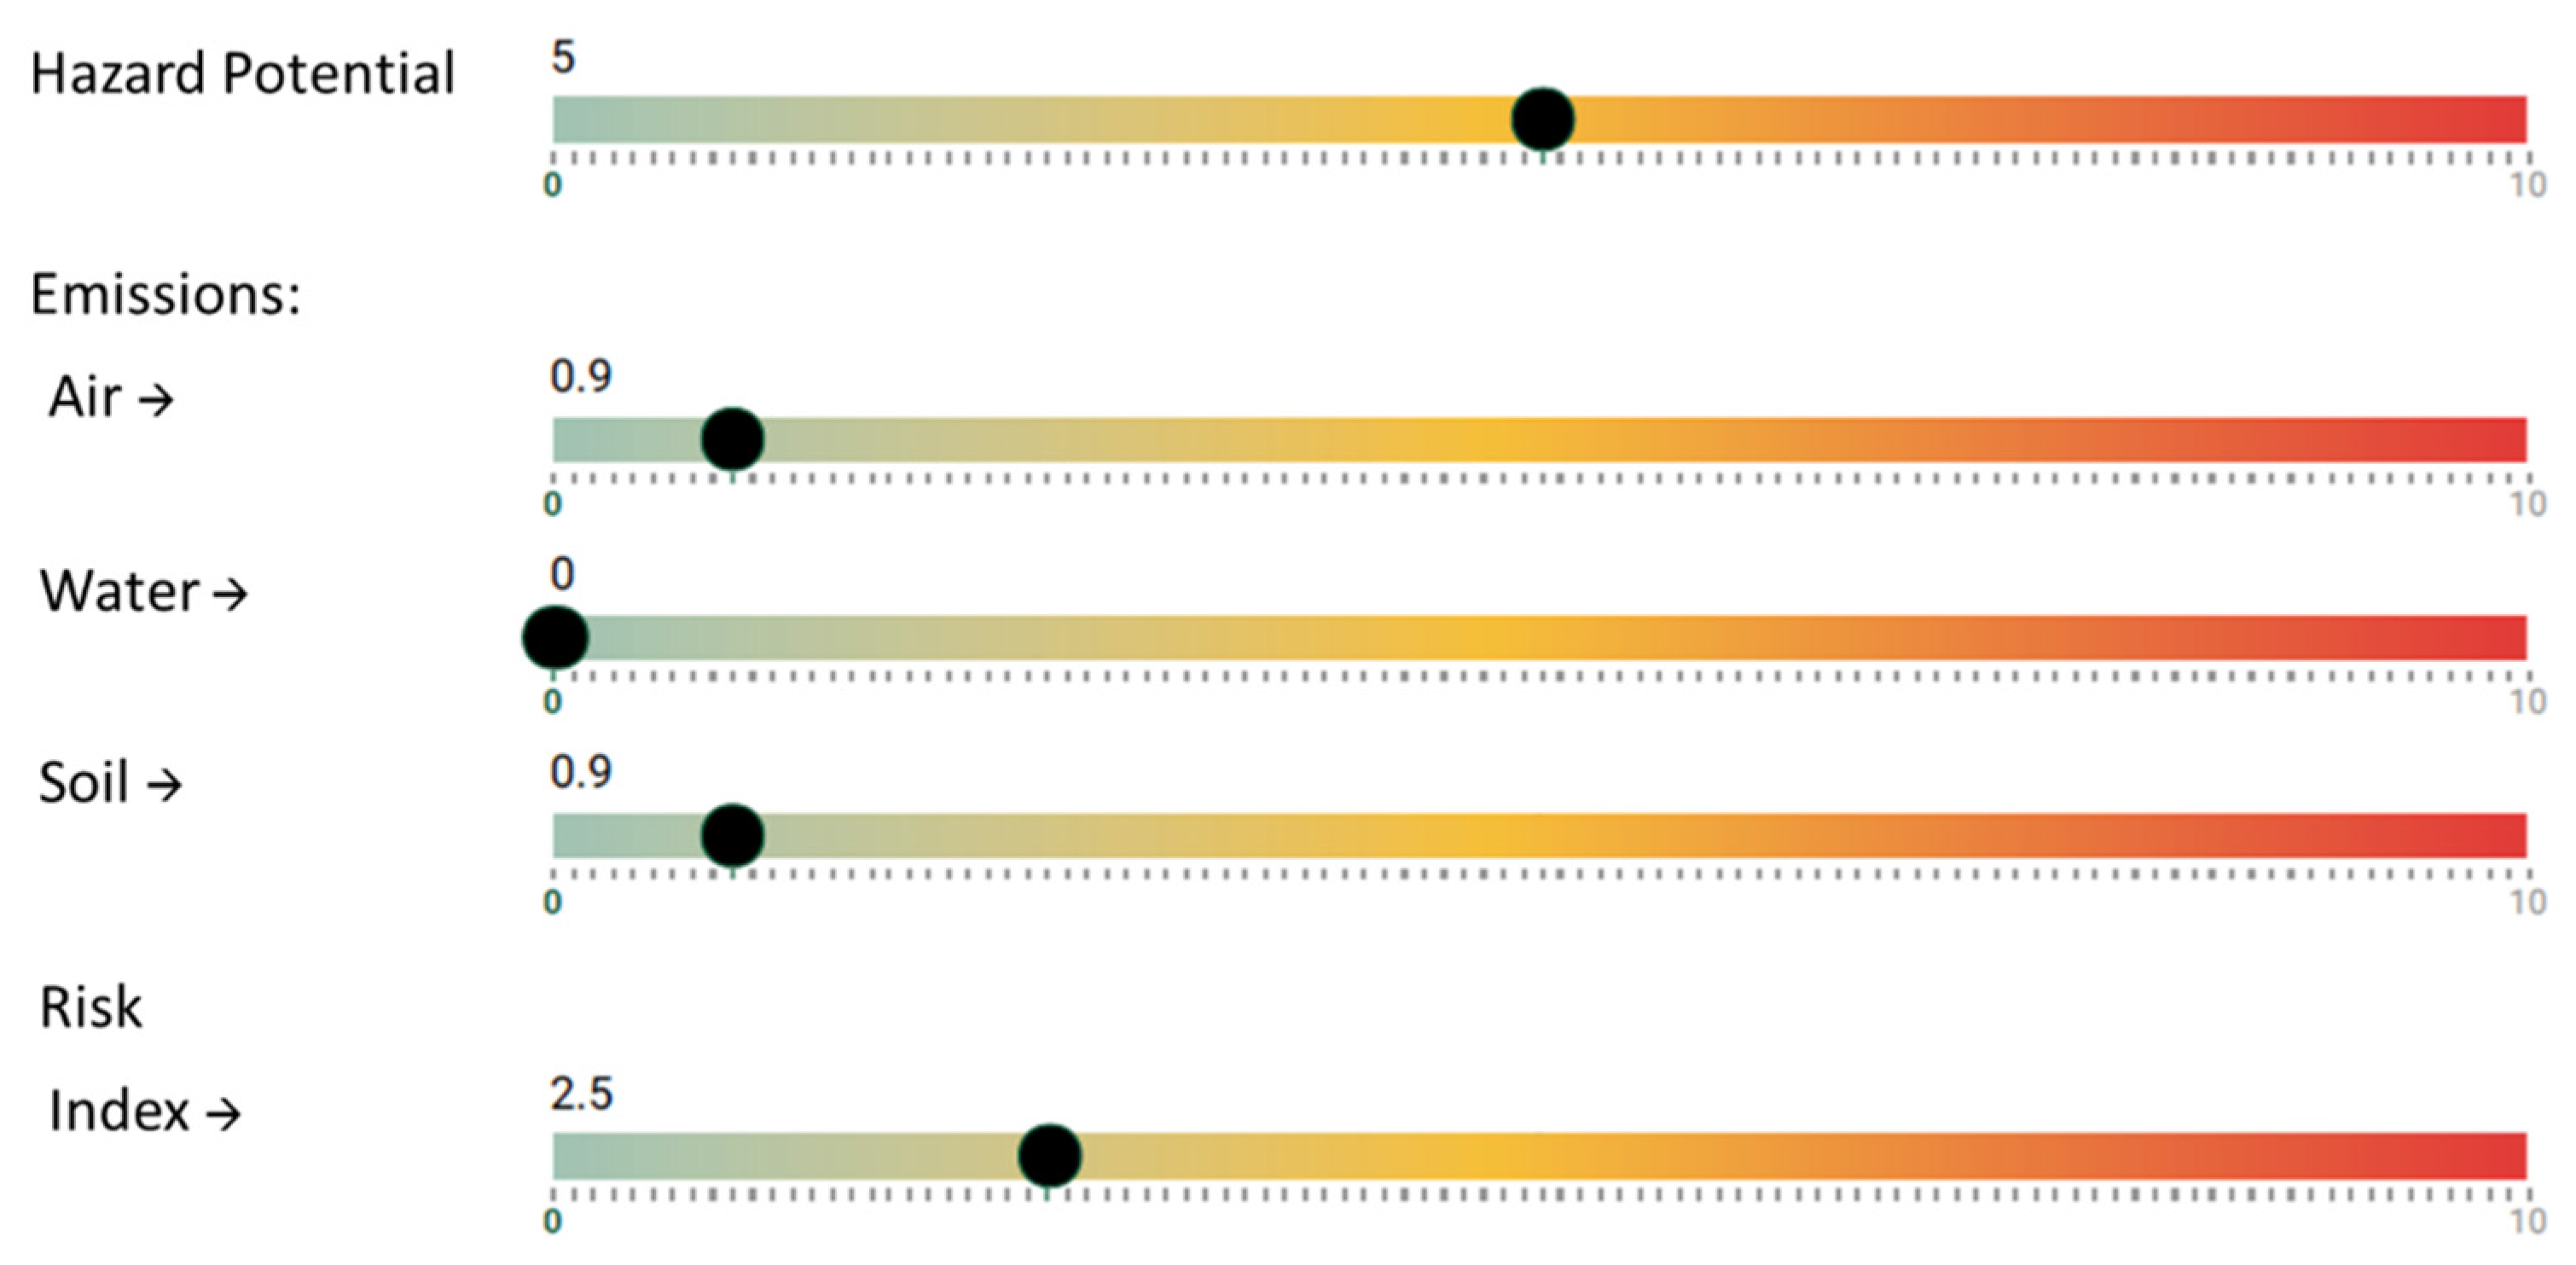
| Paint spill containing graphene | Workplace: 1.12 × 10⁻⁷–5.96 × 10⁻⁴ (<<<1): Very low risk Personal: 4.39 × 10⁻⁷–3.84 × 10⁻² (<<<1): Very low risk | Air emissions: 0.9 (very low risk) Risk index: 2.5 (low risk) |
| Accidental spillage of a dry mortar containing TiO2 particles | Workplace: 0.64 (<1) low risk Personal: Not directly evaluated but a higher risk could be expected for the peak concentrations observed during measurements | Air emissions: 1.1 (low risk) Risk index: 7.5 (medium–high risk) |
| SiO2 Nanoparticle Leak from a Vacuum Cleaner | Release of TiO2 from a Bag Filter System | Fall of Eight TiO2 Bulk Bags on the Road | Leak of Black Carbon during Transportation | |
|---|---|---|---|---|
| Group | SiO2 | TiO2 | TiO2 | Black carbon |
| Nanomaterial | SiO2 | TiO2 | TiO2 | Black carbon |
| Quantity | 25 kg | 1 kg | 100 kg | 5 tons |
| EHP | High | Medium | Low | Medium |
| State | Solid | Solid | Solid | Solid |
| Dustiness | High | Medium | Medium | Medium |
| Humidity | Low | Low | Low | Low |
| Viscosity | - | - | - | |
| Solubility | - | - | - | |
| Physical-Chemical Properties | Z-potential: −25.85 mV | |||
| Toxicology | Specific surface: 200 m2/g | |||
| Type of Information | Size: 16 nm | Size: 65 nm | Size: 65 nm | Size: 14 nm |
| Measurement | Specific surface: 300 m2/g |
Publisher’s Note: MDPI stays neutral with regard to jurisdictional claims in published maps and institutional affiliations. |
© 2021 by the authors. Licensee MDPI, Basel, Switzerland. This article is an open access article distributed under the terms and conditions of the Creative Commons Attribution (CC BY) license (https://creativecommons.org/licenses/by/4.0/).
Share and Cite
Aznar Mollá, F.; Fito-López, C.; Heredia Alvaro, J.A.; Huertas-López, F. New Tools to Support the Risk Assessment Process of Nanomaterials in the Insurance Sector. Int. J. Environ. Res. Public Health 2021, 18, 6985. https://doi.org/10.3390/ijerph18136985
Aznar Mollá F, Fito-López C, Heredia Alvaro JA, Huertas-López F. New Tools to Support the Risk Assessment Process of Nanomaterials in the Insurance Sector. International Journal of Environmental Research and Public Health. 2021; 18(13):6985. https://doi.org/10.3390/ijerph18136985
Chicago/Turabian StyleAznar Mollá, Francisco, Carlos Fito-López, Jose Antonio Heredia Alvaro, and Francisco Huertas-López. 2021. "New Tools to Support the Risk Assessment Process of Nanomaterials in the Insurance Sector" International Journal of Environmental Research and Public Health 18, no. 13: 6985. https://doi.org/10.3390/ijerph18136985
APA StyleAznar Mollá, F., Fito-López, C., Heredia Alvaro, J. A., & Huertas-López, F. (2021). New Tools to Support the Risk Assessment Process of Nanomaterials in the Insurance Sector. International Journal of Environmental Research and Public Health, 18(13), 6985. https://doi.org/10.3390/ijerph18136985