
The Premium of Public Perceived Greenery: A Framework Using Multiscale GWR and Deep Learning


Abstract
:1. Introduction
1.1. Measuring Large-Scale Perceived Greenery Using Street Views and Deep Learning
1.2. A Novel Hedonic Price Modeling Framework Based on MGWR
2. Materials and Methods
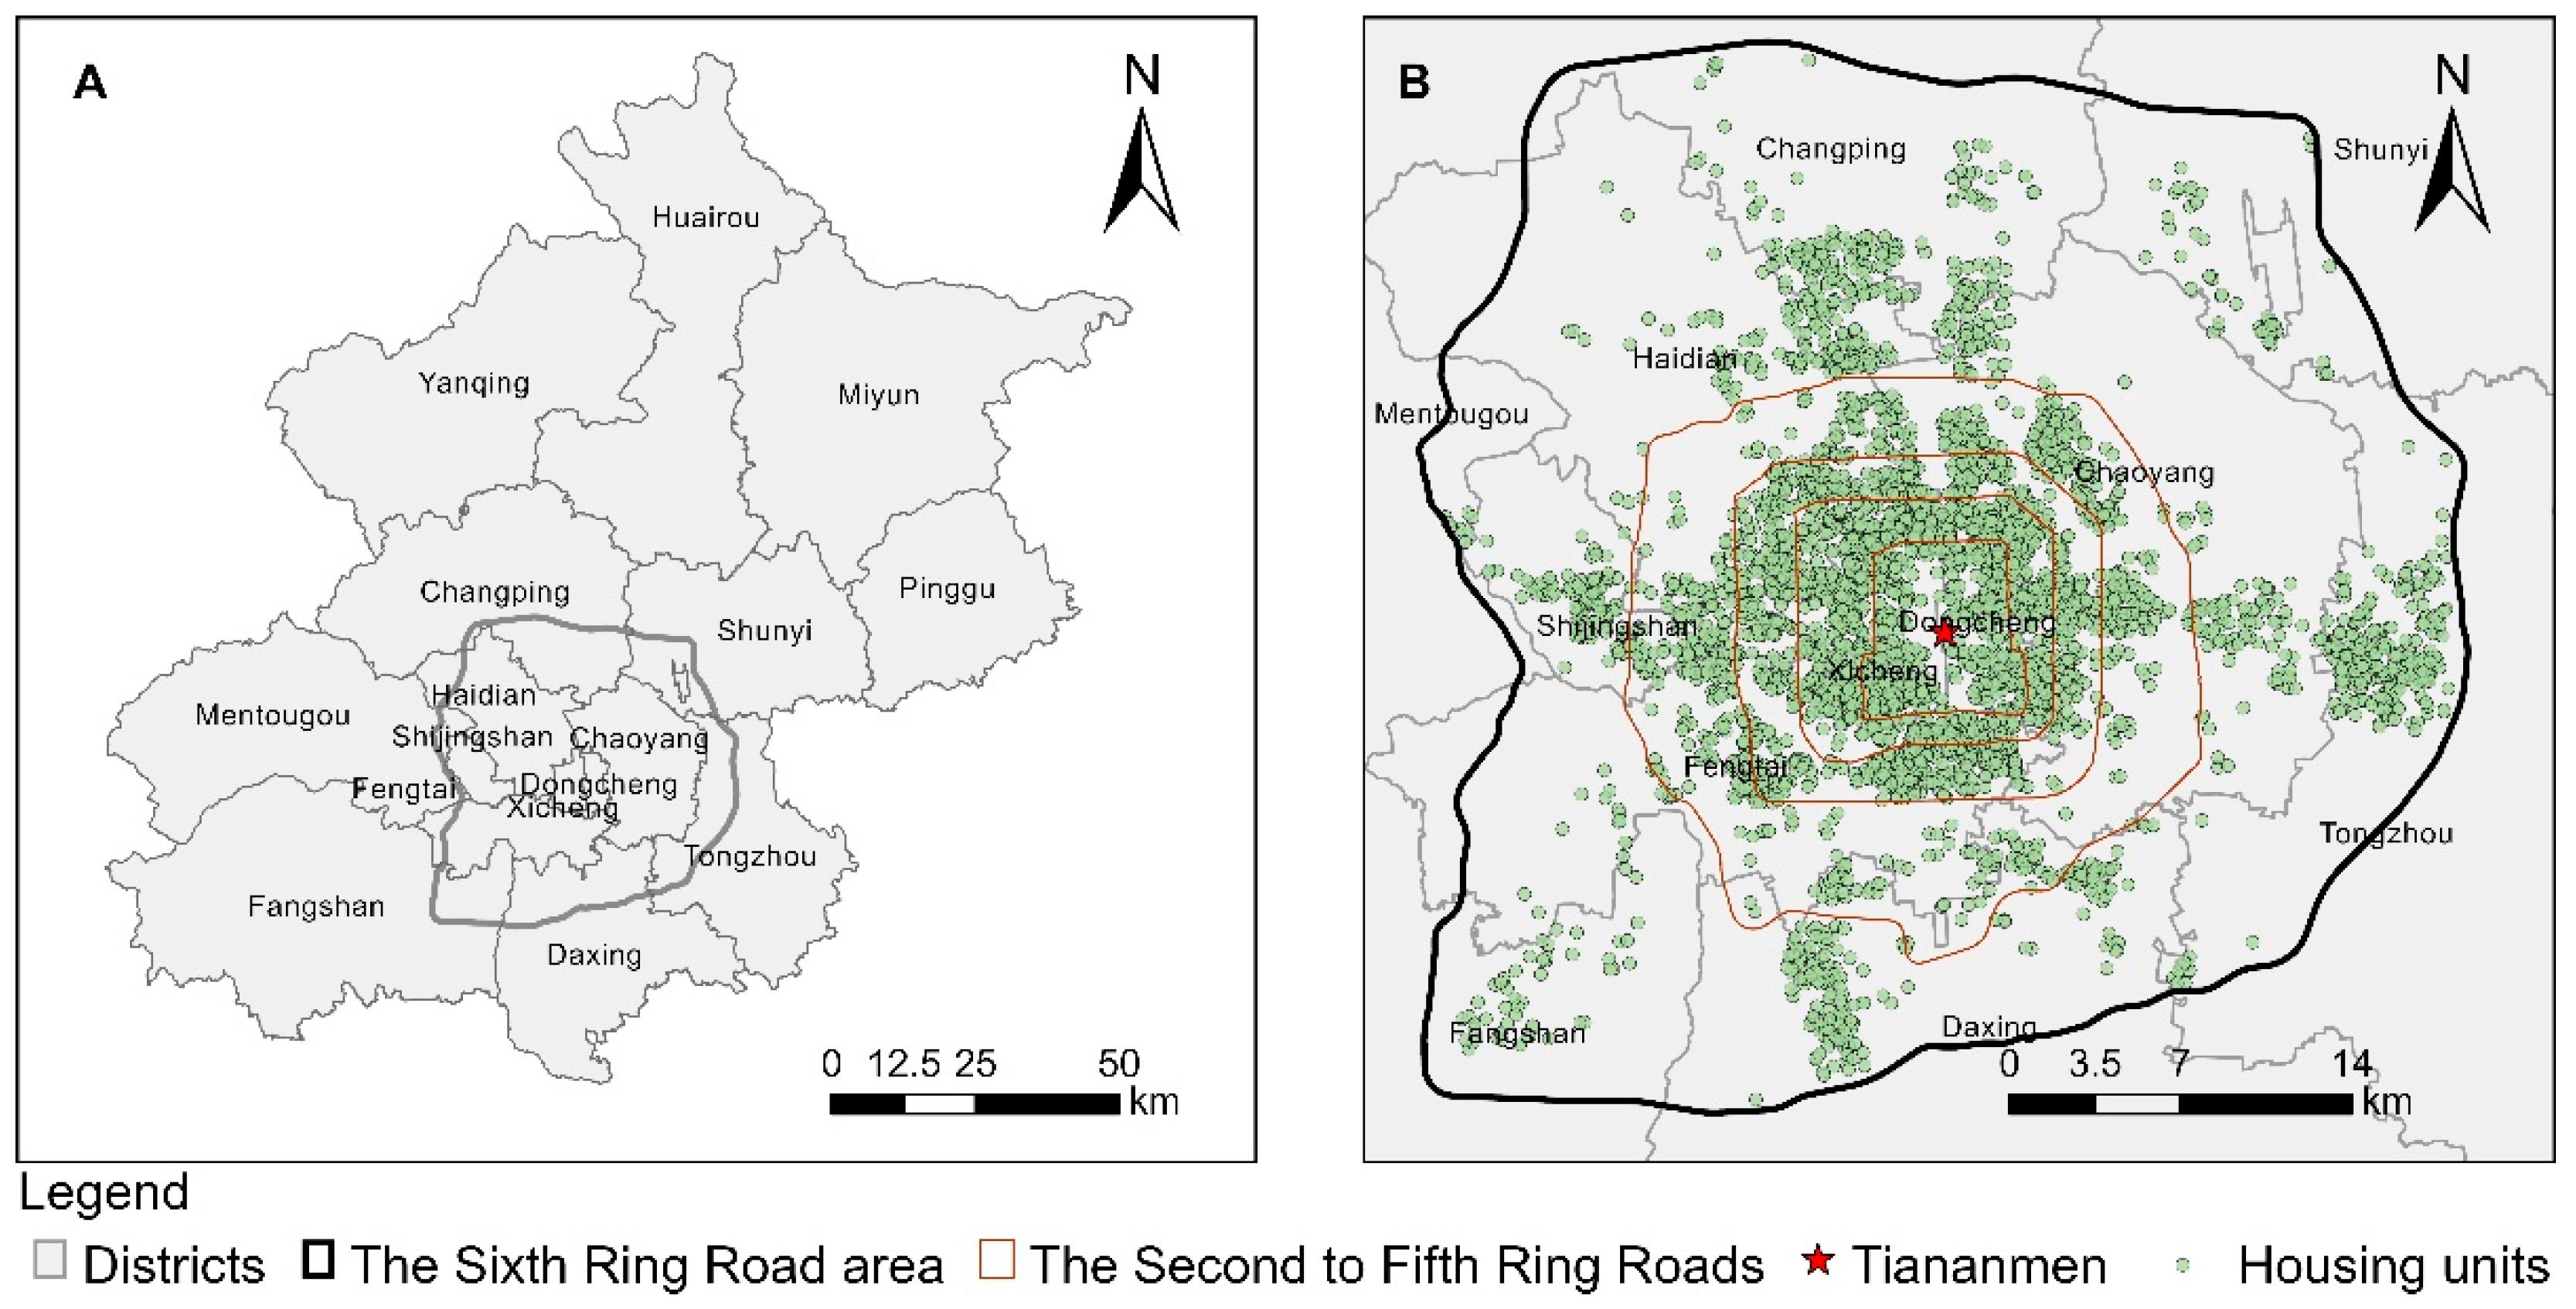
2.1. Study Area
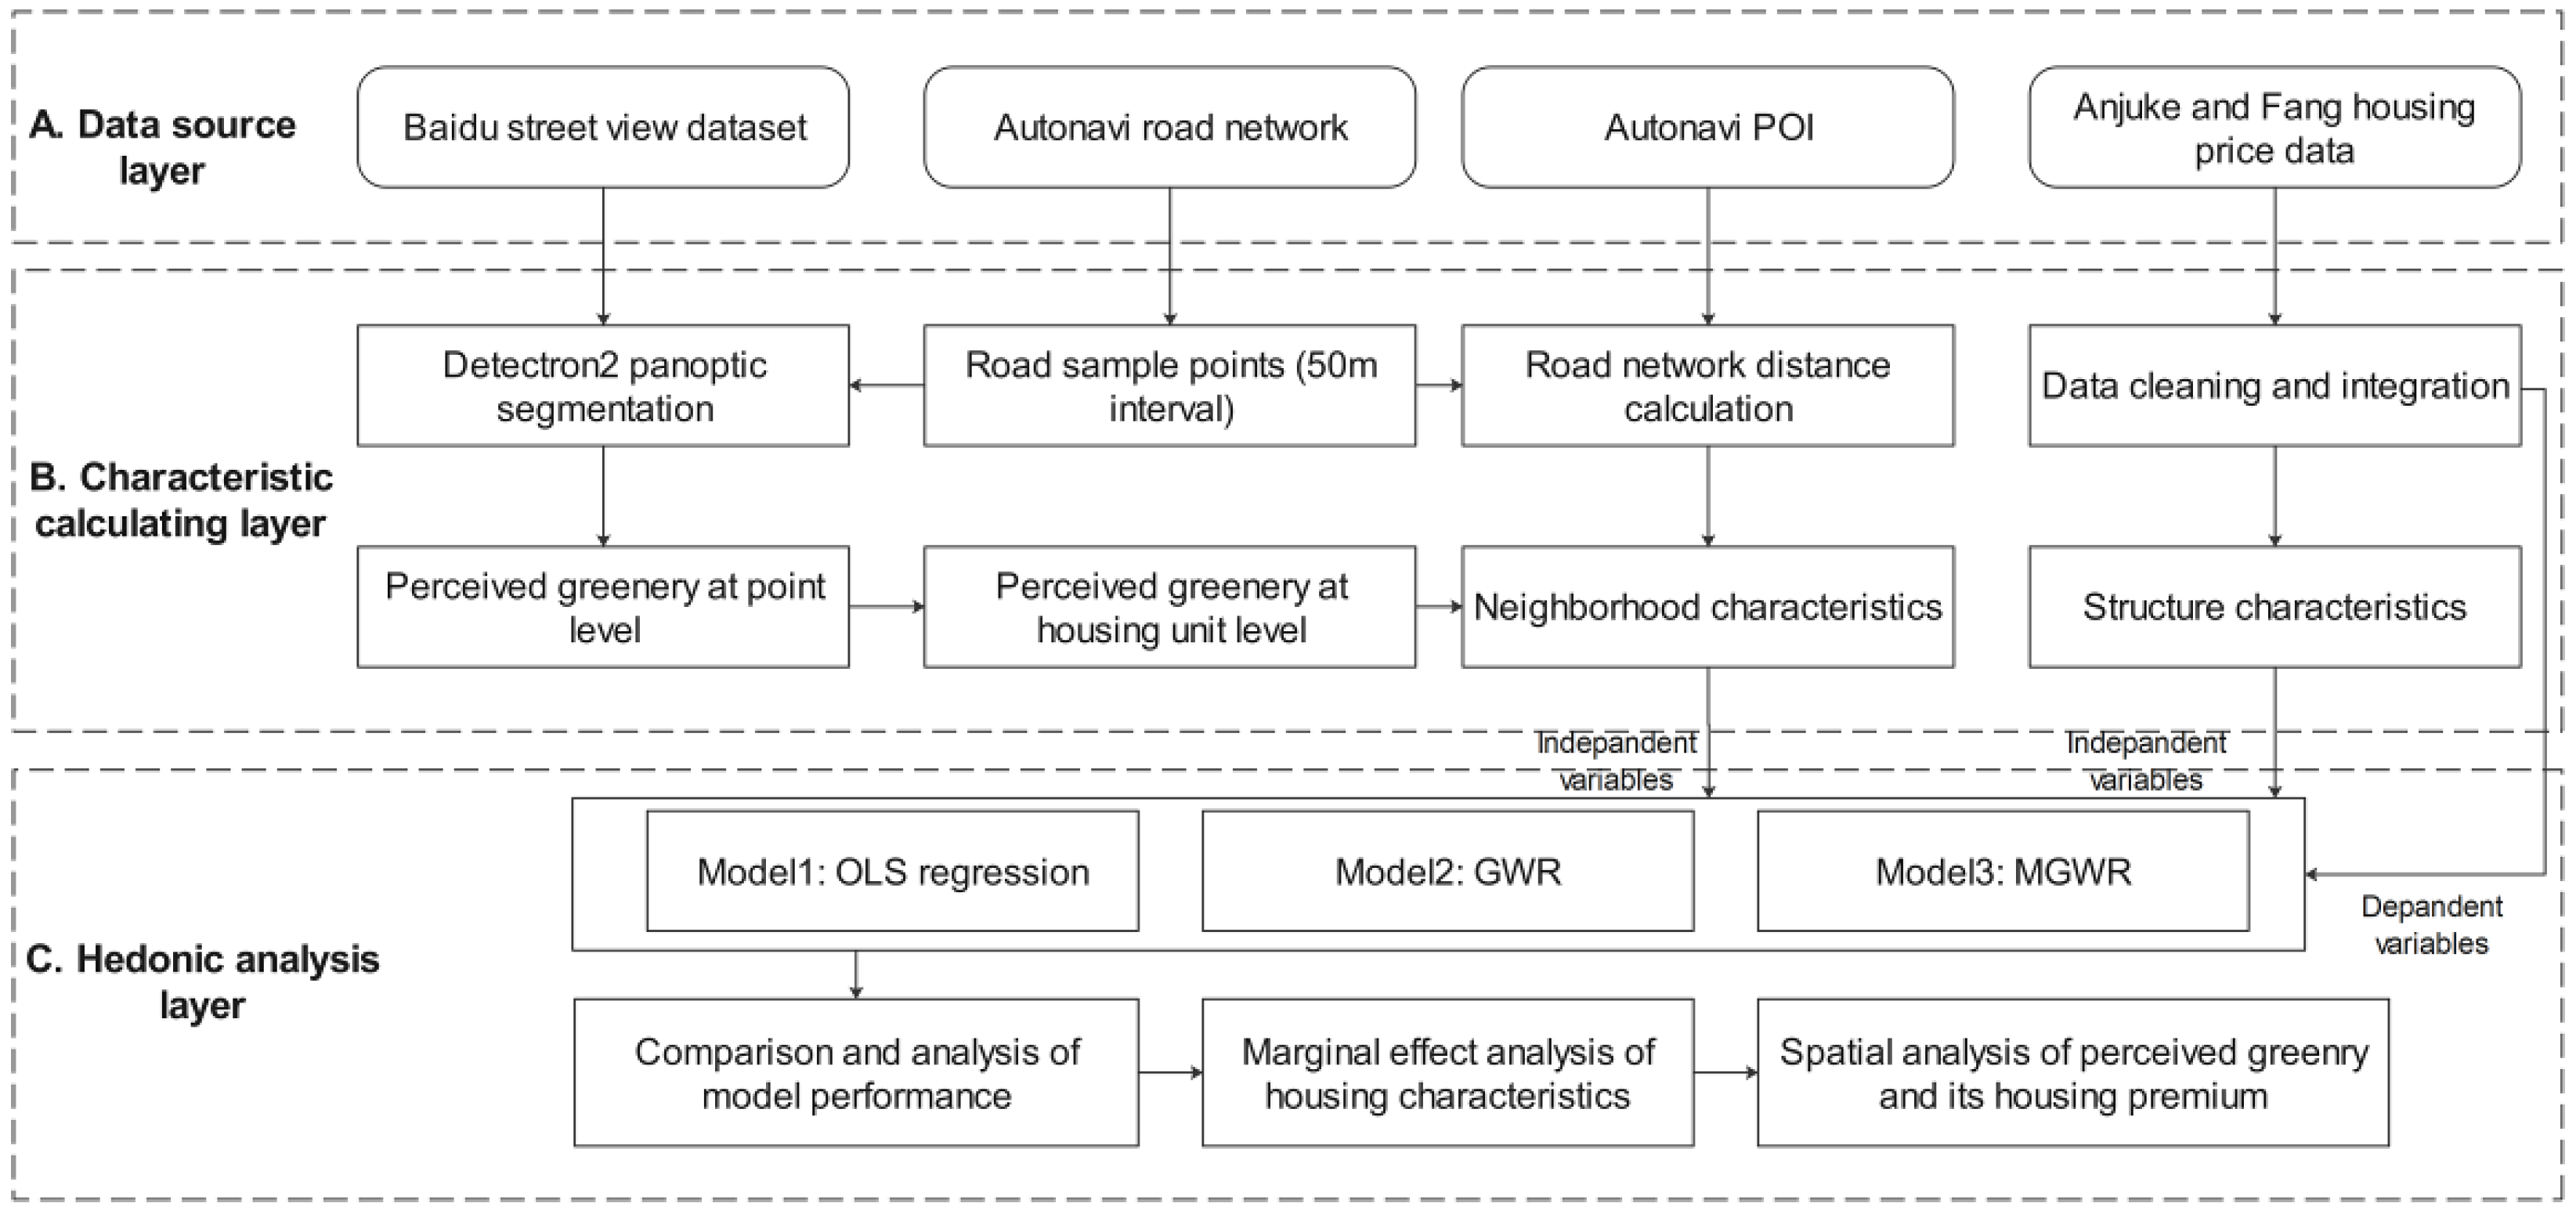
2.2. Analytical Framework
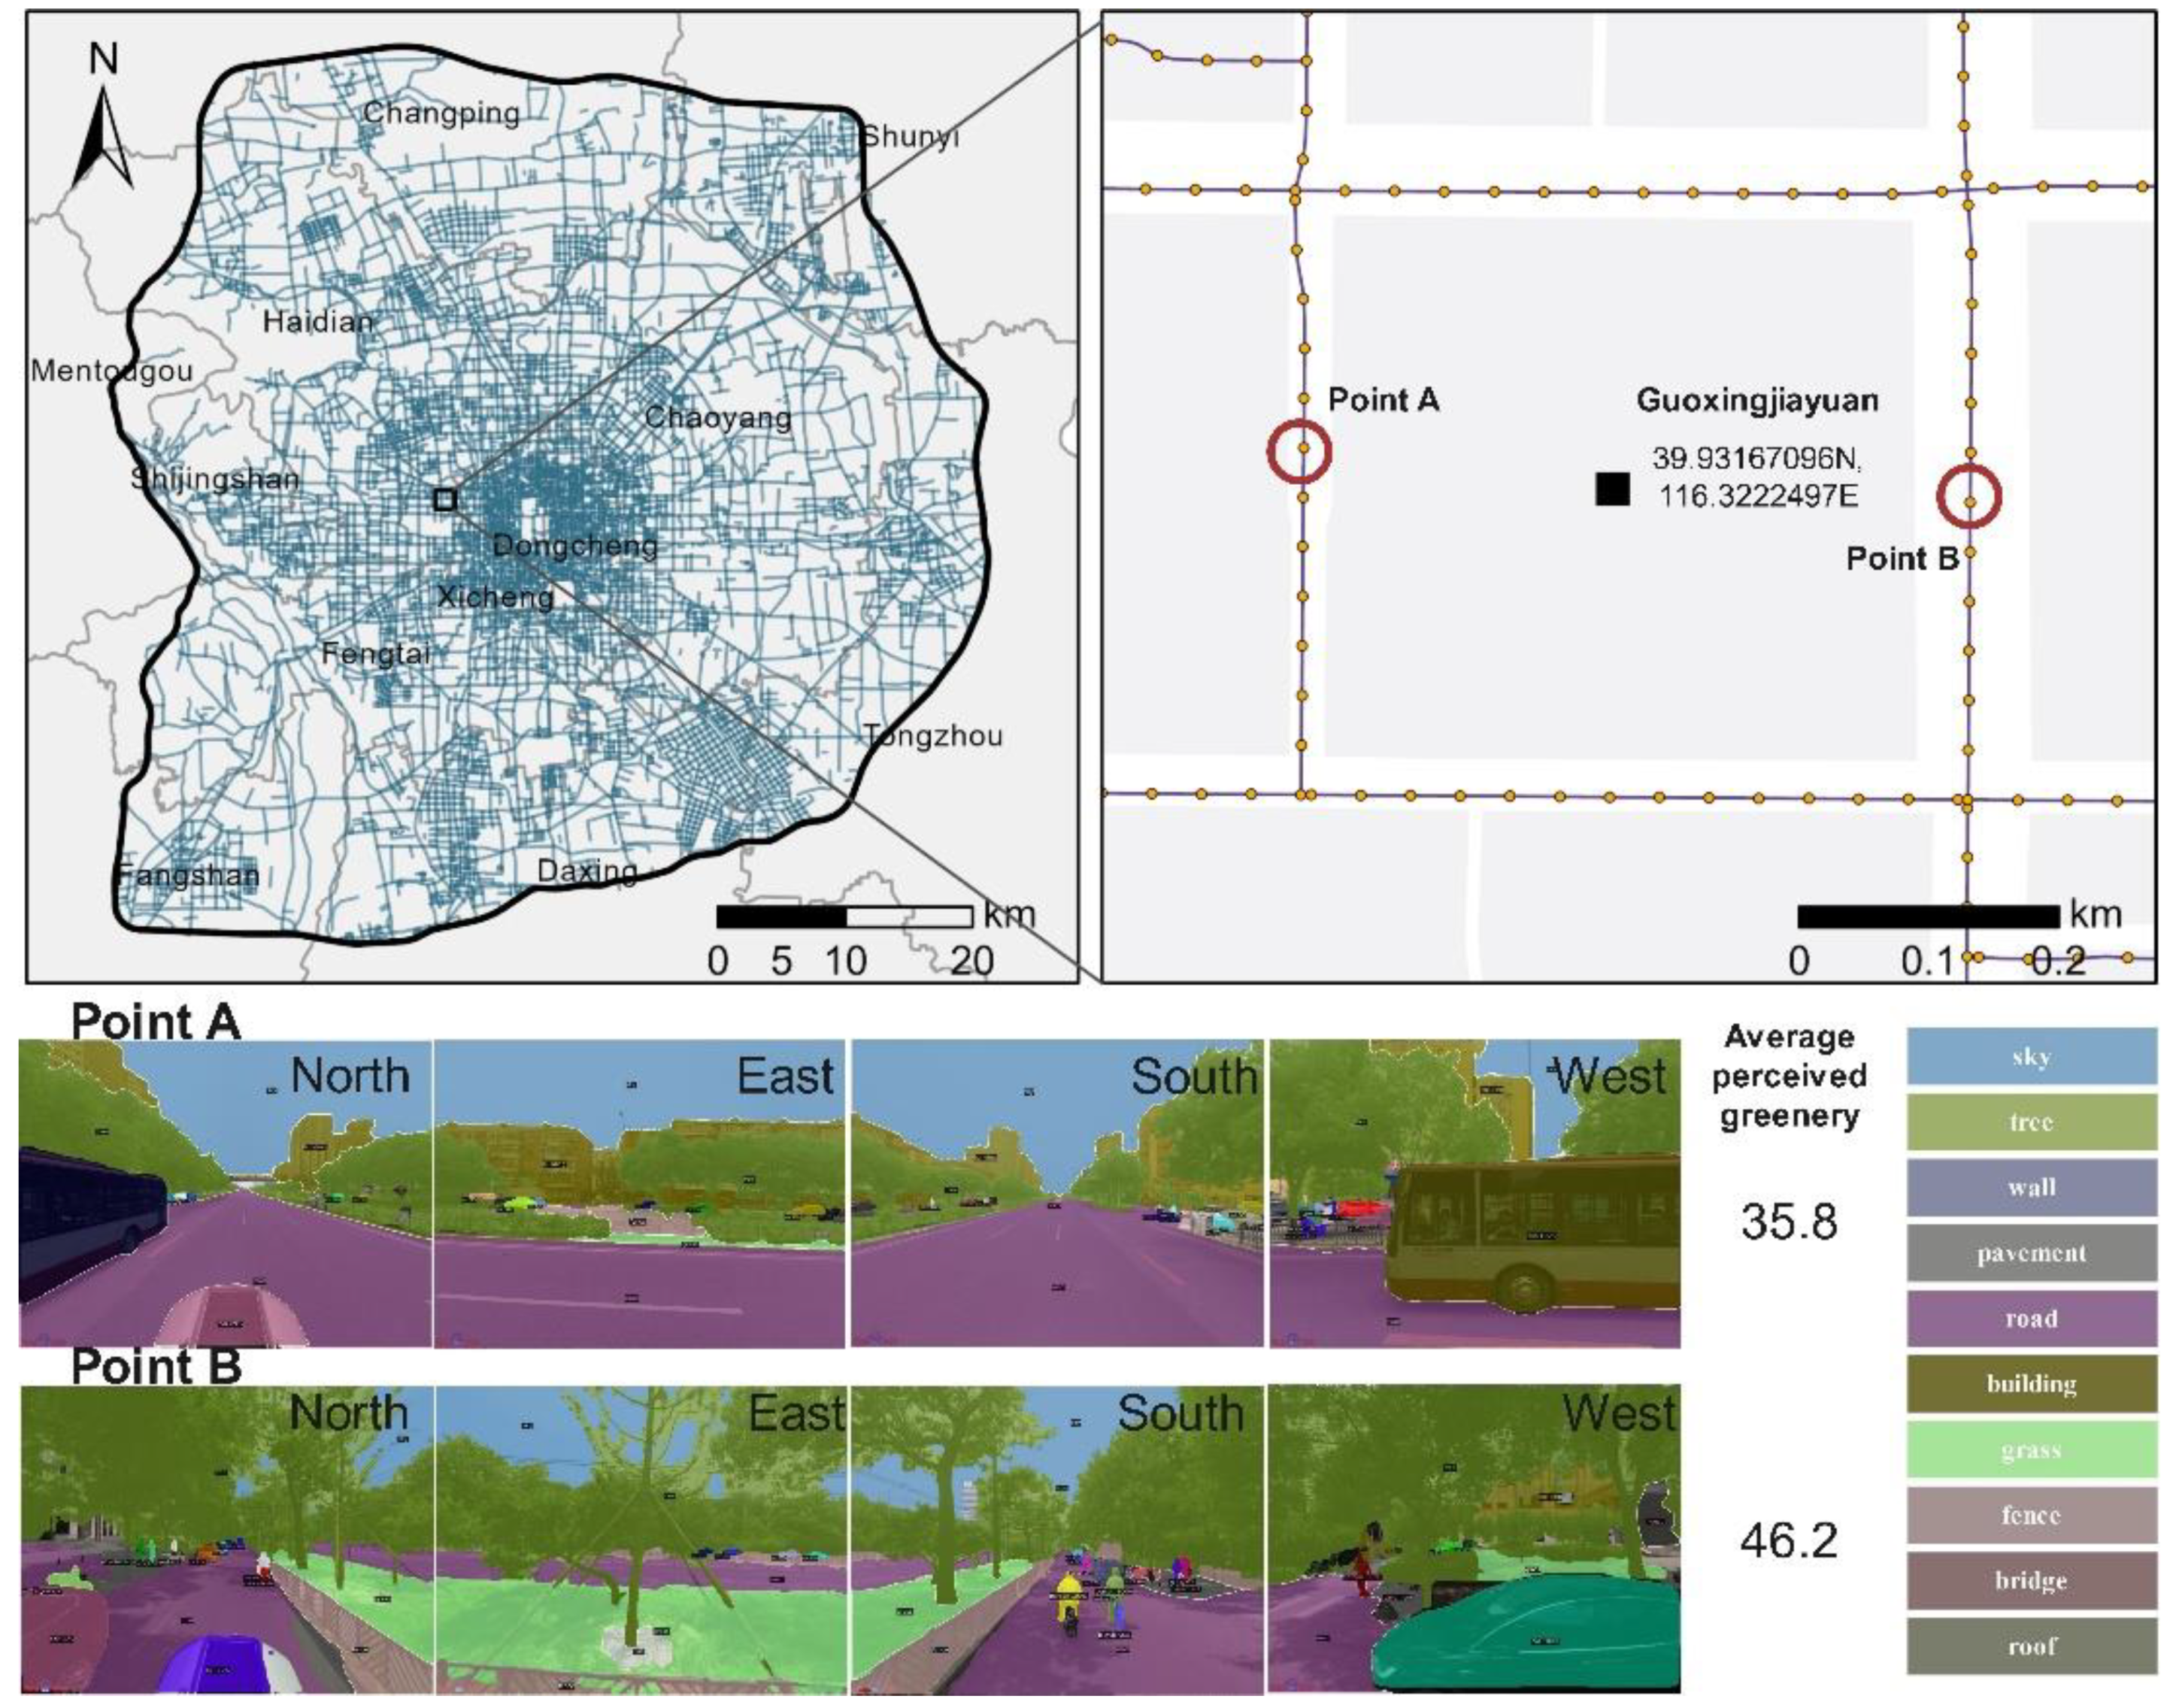
2.3. The Calculation of Neighborhood-Level Perceived Greenery
2.4. Hedonic Price Models (HPMs) and Characteristic Statistics
2.4.1. The Ordinary Least Square (OLS) Model
2.4.2. The Geographical Weighted Regression (GWR) Model
2.4.3. The Multiscale GWR Model
2.4.4. Characteristic Description and Statistics
3. Results and Discussion
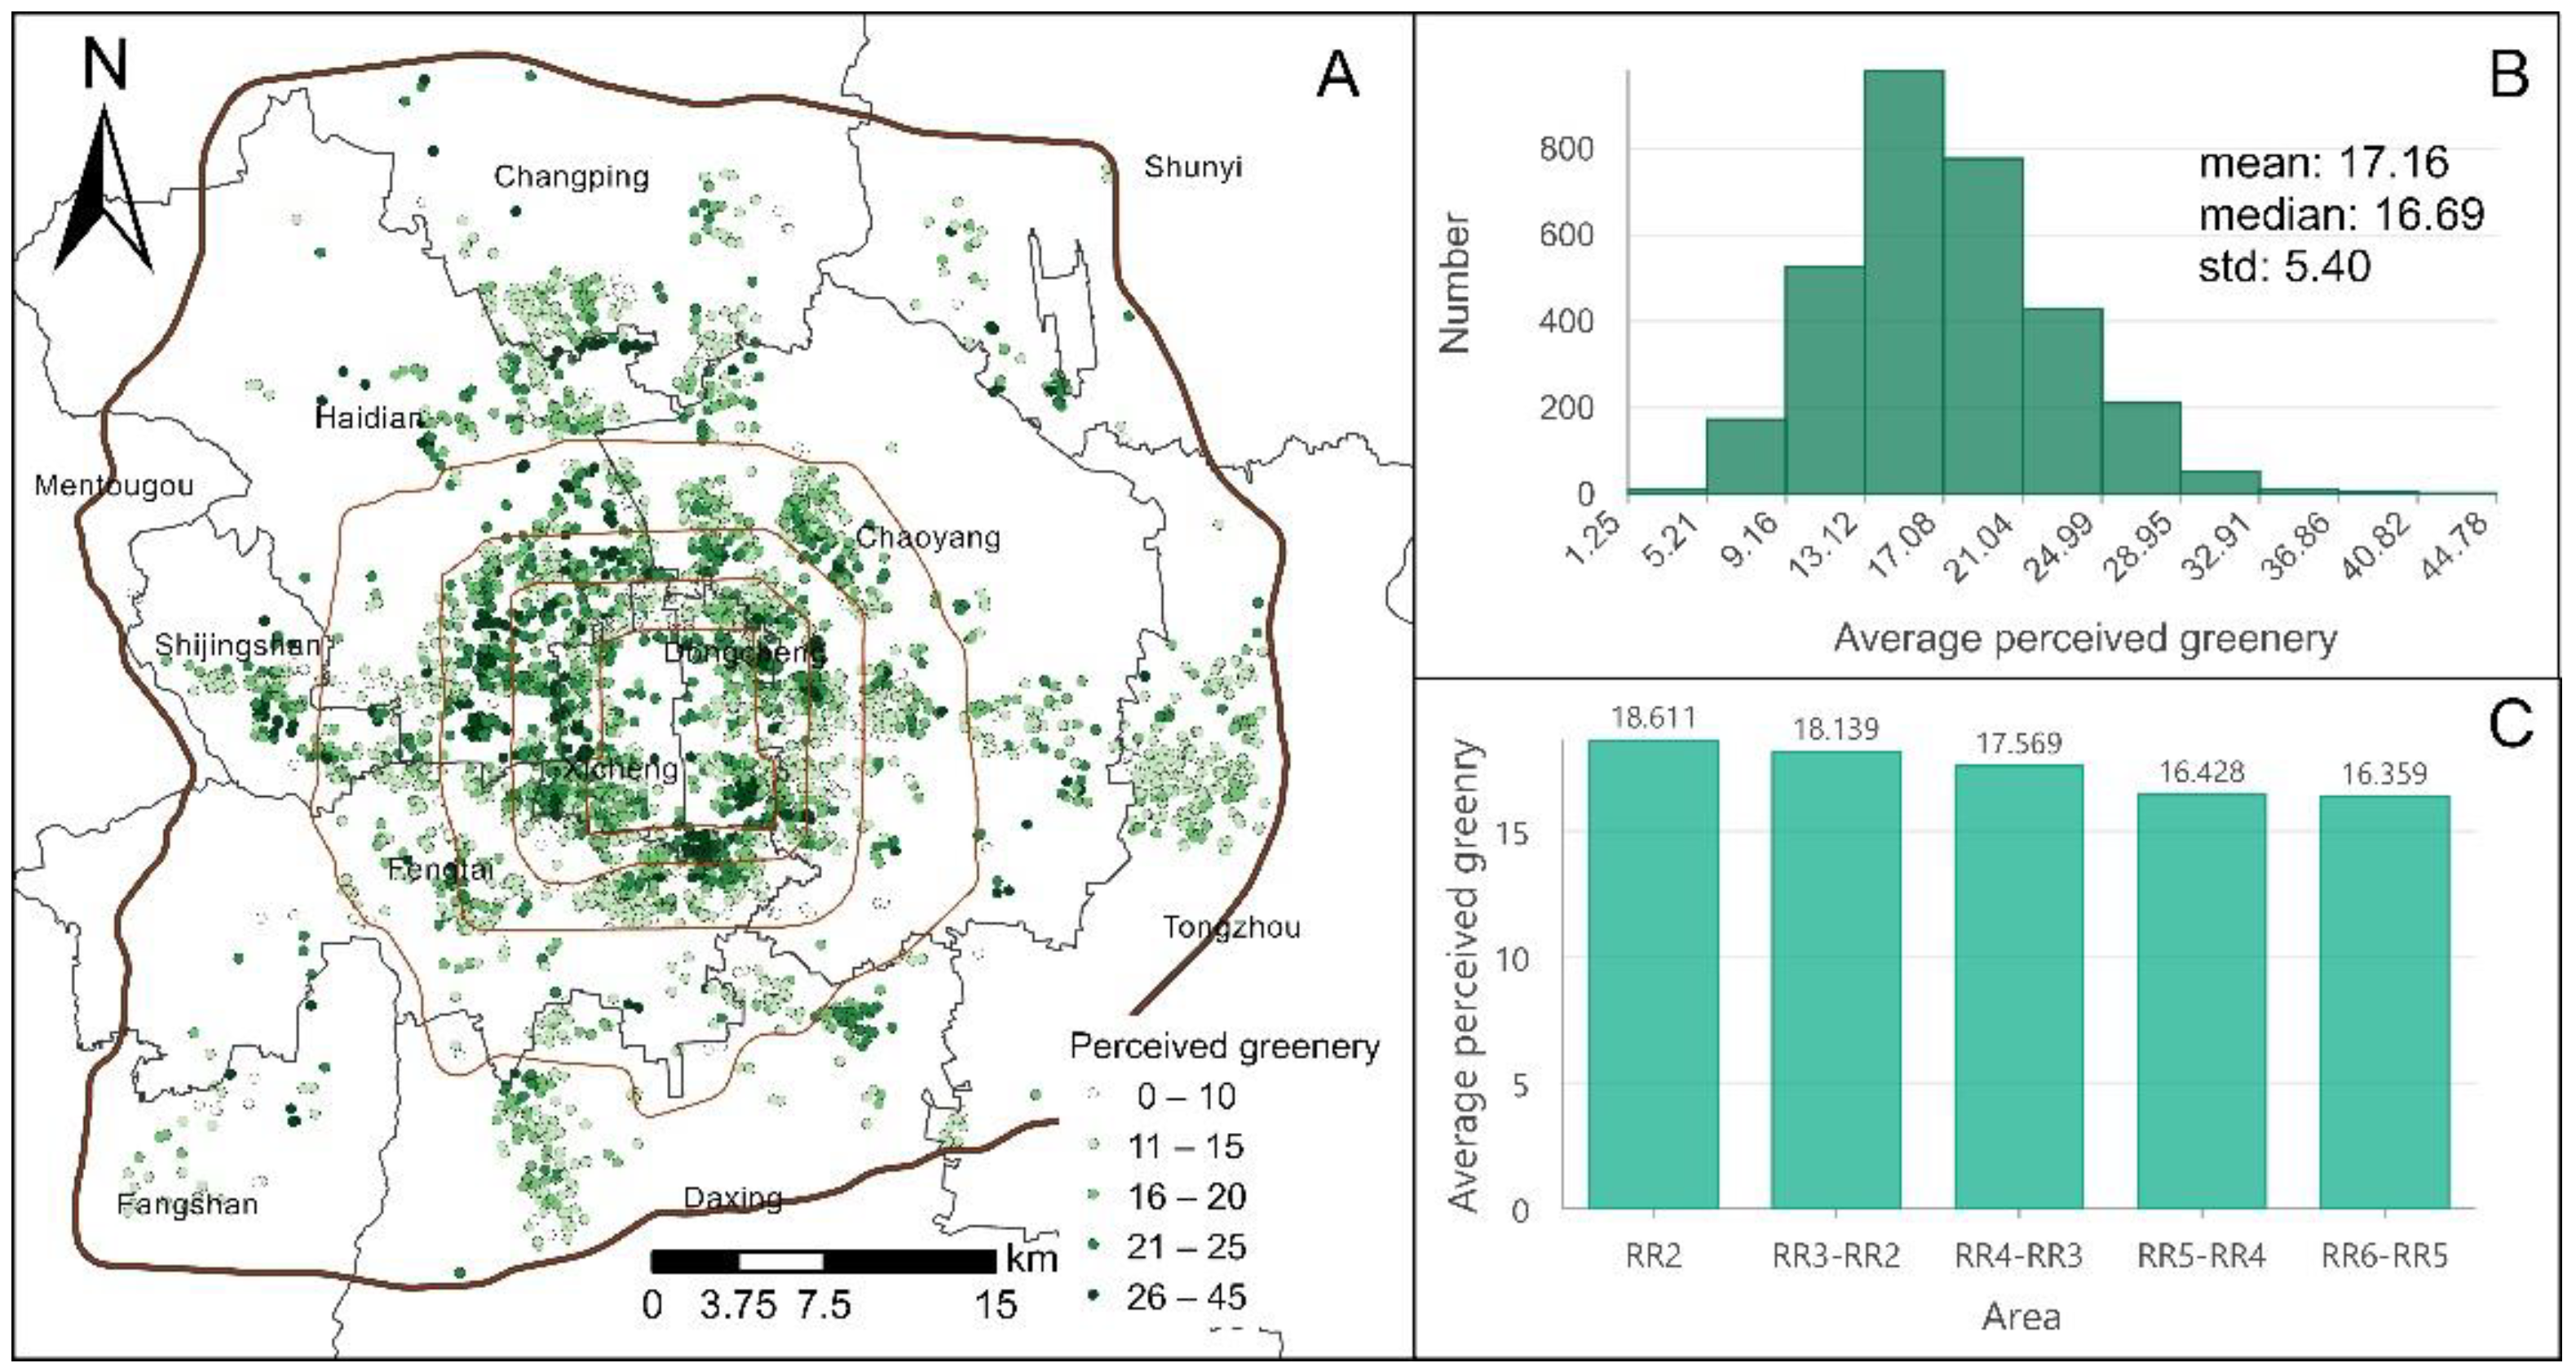
3.1. Distribution Map of Neighborhood-Level Perceived Greenery
3.2. The Empirical Results and Hedonic Premium Analysis
3.2.1. The Regression Result of the Global OLS Model
3.2.2. Performance Comparison
3.2.3. Explanation of Marginal Premiums
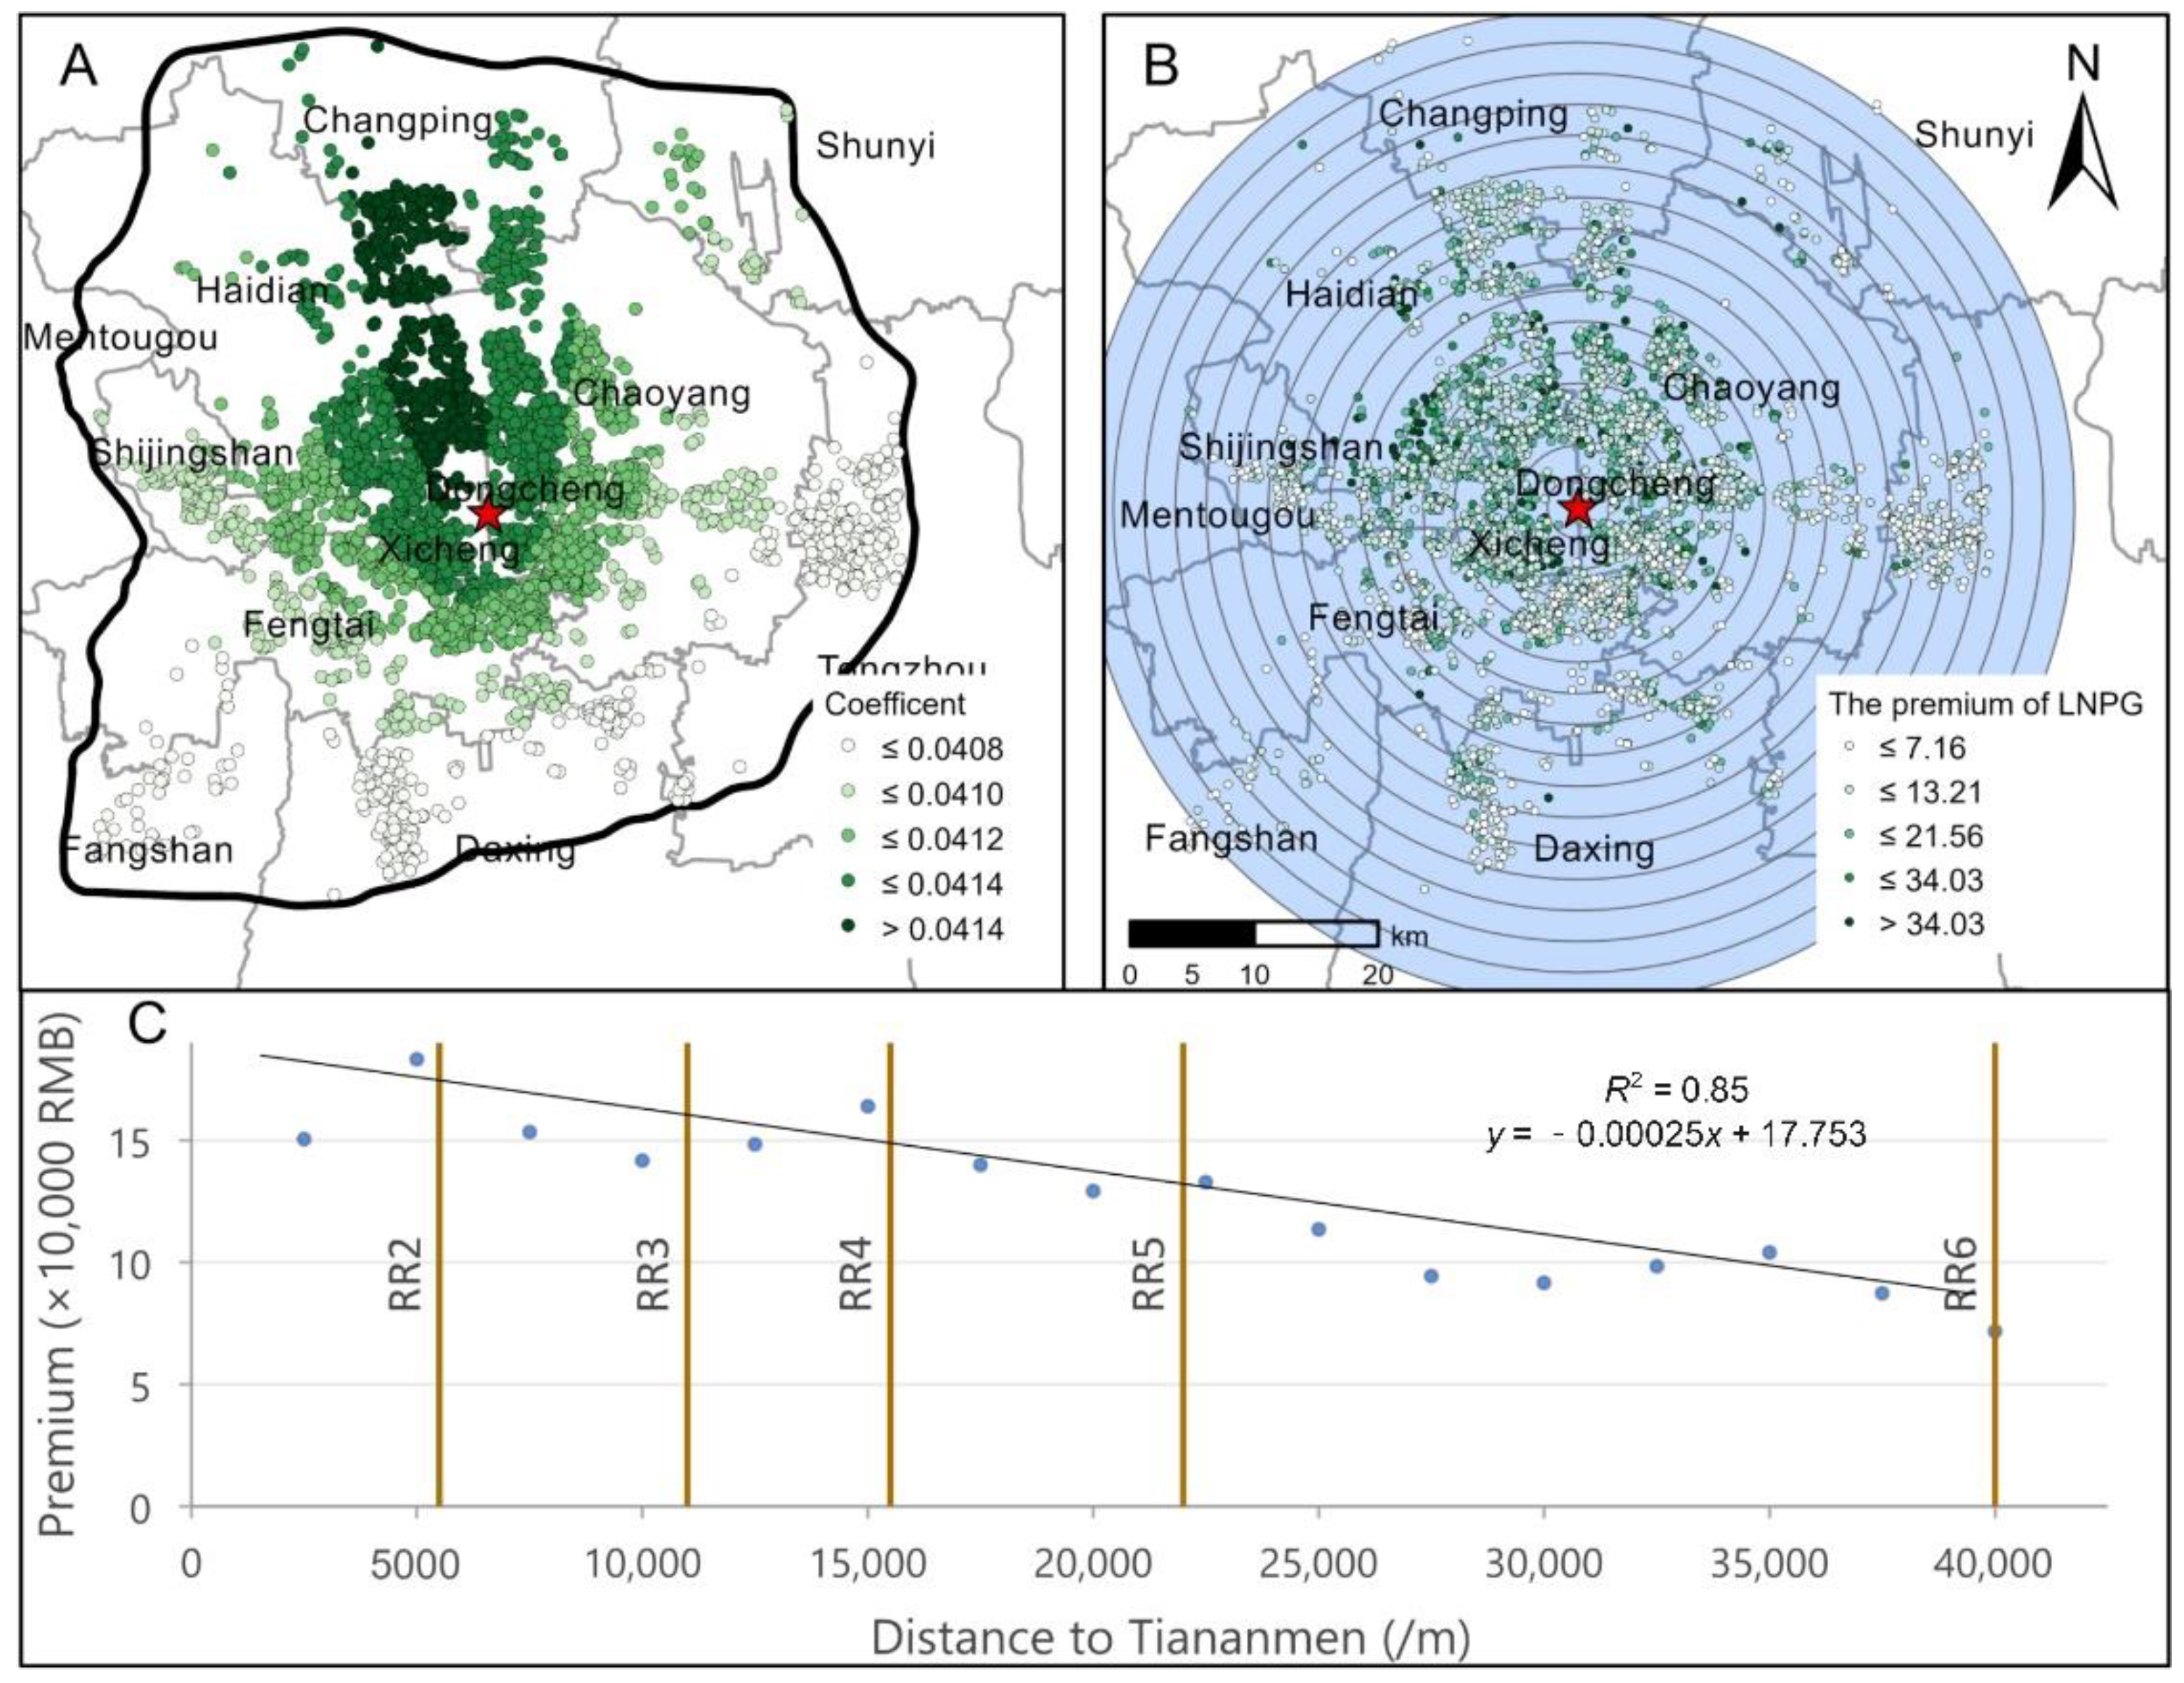
3.3. The Spatial Patterns of Perceived Greenery Premiums
3.4. Policy Recommendations
3.5. Limitations and Future Work
4. Conclusions
Author Contributions
Funding
Institutional Review Board Statement
Informed Consent Statement
Data Availability Statement
Acknowledgments
Conflicts of Interest
References
- Wang, R.; Li, F.; Hu, D.; Larry Li, B. Understanding eco-complexity: Social-economic-natural complex ecosystem approach. Ecol. Complex. 2011, 8, 15–29. [Google Scholar] [CrossRef]
- Cornelis, J.; Hermy, M. Biodiversity relationships in urban and suburban parks in Flanders. Landsc. Urban Plan. 2004, 69, 385–401. [Google Scholar] [CrossRef]
- Myeong, S.; Nowak, D.J.; Duggin, M.J. A temporal analysis of urban forest carbon storage using remote sensing. Remote Sens. Environ. 2006, 101, 277–282. [Google Scholar] [CrossRef]
- Richards, D.R.; Edwards, P.J. Quantifying street tree regulating ecosystem services using Google Street View. Ecol. Indic. 2017, 77, 31–40. [Google Scholar] [CrossRef]
- Akbari, H.; Pomerantz, M.; Taha, H. Cool surfaces and shade trees to reduce energy use and improve air quality in urban areas. Sol. Energy 2001, 70, 295–310. [Google Scholar] [CrossRef]
- Georgi, J.N.; Dimitriou, D. The contribution of urban green spaces to the improvement of environment in cities: Case study of Chania, Greece. Build. Environ. 2010, 45, 1401–1414. [Google Scholar] [CrossRef] [Green Version]
- Middel, A.; Chhetri, N.; Quay, R. Urban forestry and cool roofs: Assessment of heat mitigation strategies in Phoenix residential neighborhoods. Urban For. Urban Green. 2015, 14, 178–186. [Google Scholar] [CrossRef]
- McAlexander, T.P.; Gershon, R.R.M.; Neitzel, R.L. Street-level noise in an urban setting: Assessment and contribution to personal exposure. Environ. Health 2015, 14, 18. [Google Scholar] [CrossRef] [Green Version]
- Poudyal, N.C.; Siry, J.P.; Bowker, J.M. Quality of urban forest carbon credits. Urban For. Urban Green. 2011, 10, 223–230. [Google Scholar] [CrossRef]
- Landry, S.M.; Chakraborty, J. Street trees and equity: Evaluating the spatial distribution of an urban amenity. Environ. Plan. A Econ. Space 2009, 41, 2651–2670. [Google Scholar] [CrossRef]
- Lu, Y.; Sarkar, C.; Xiao, Y. The effect of street-level greenery on walking behavior: Evidence from Hong Kong. Soc. Sci. Med. 2018, 208, 41–49. [Google Scholar] [CrossRef] [PubMed]
- Sarkar, C.; Webster, C.; Pryor, M.; Tang, D.; Melbourne, S.; Zhang, X.; Jianzheng, L. Exploring associations between urban green, street design and walking: Results from the Greater London boroughs. Landsc. Urban Plan. 2015, 143, 112–125. [Google Scholar] [CrossRef]
- Bertram, C.; Rehdanz, K. The role of urban green space for human well-being. Ecol. Econ. 2015, 120, 139–152. [Google Scholar] [CrossRef] [Green Version]
- Bratman, G.N.; Anderson, C.B.; Berman, M.G.; Cochran, B.; de Vries, S.; Flanders, J.; Folke, C.; Frumkin, H.; Gross, J.J.; Hartig, T.; et al. Nature and mental health: An ecosystem service perspective. Sci. Adv. 2019, 5, eaax0903. [Google Scholar] [CrossRef] [PubMed] [Green Version]
- Jiao, L.; Liu, Y. Geographic field model based hedonic valuation of urban open spaces in Wuhan, China. Landsc. Urban Plan. 2010, 98, 47–55. [Google Scholar] [CrossRef]
- Shen, Y.; Karimi, K. The economic value of streets: Mix-scale spatio-functional interaction and housing price patterns. Appl. Geogr. 2017, 79, 187–202. [Google Scholar] [CrossRef]
- Forczek-Brataniec, U. Visible Space. A Visual Analysis in the Landscape Planning and Designing; Wydawnictwo PK: Kraków, Poland, 2018. [Google Scholar]
- Ozimek, A.; Ozimek, P.; Böhm, A.; Wańkowicz, W. Planning Spaces with High Scenic Values by Means of Digital Terrain Analyses and Economic Evaluation; Wydawnictwo PK: Kraków, Poland, 2017. [Google Scholar]
- Ozimek, A. Measure of the landscape. In Objectification of View and Panorama Assessment Supported with Digital Tools; Wydawnictwo PK: Kraków, Poland, 2019. [Google Scholar]
- Zhao, J.; Yan, Y.; Deng, H.; Liu, G.; Dai, L.; Tang, L.; Shi, L.; Shao, G. Remarks about landsenses ecology and ecosystem services. Int. J. Sustain. Dev. World Ecol. 2020, 27, 196–201. [Google Scholar] [CrossRef] [Green Version]
- Kong, F.; Yin, H.; Nakagoshi, N. Using GIS and landscape metrics in the hedonic price modeling of the amenity value of urban green space: A case study in Jinan City, China. Landsc. Urban Plan. 2007, 79, 240–252. [Google Scholar] [CrossRef]
- Sander, H.; Polasky, S.; Haight, R.G. The value of urban tree cover: A hedonic property price model in Ramsey and Dakota Counties, Minnesota, USA. Ecol. Econ. 2010, 69, 1646–1656. [Google Scholar] [CrossRef]
- Wu, C.; Ye, X.; Du, Q.; Luo, P. Spatial effects of accessibility to parks on housing prices in Shenzhen, China. Habitat Int. 2017, 63, 45–54. [Google Scholar] [CrossRef]
- Daams, M.N.; Sijtsma, F.J.; Veneri, P. Mixed monetary and non-monetary valuation of attractive urban green space: A case study using Amsterdam house prices. Ecol. Econ. 2019, 166, 106430. [Google Scholar] [CrossRef]
- Zambrano-Monserrate, M.A.; Ruano, M.A.; Yoong-Parraga, C.; Silva, C.A. Urban green spaces and housing prices in developing countries: A Two-stage quantile spatial regression analysis. For. Policy Econ. 2021, 125, 102420. [Google Scholar] [CrossRef]
- Tyrväinen, L.; Miettinen, A. Property prices and urban forest amenities. J. Environ. Econ. Manag. 2000, 39, 205–223. [Google Scholar] [CrossRef] [Green Version]
- Jim, C.Y.; Chen, W.Y. Impacts of urban environmental elements on residential housing prices in Guangzhou (China). Landsc. Urban Plan. 2006, 78, 422–434. [Google Scholar] [CrossRef]
- Belcher, R.N.; Chisholm, R.A. Tropical Vegetation and Residential Property Value: A Hedonic Pricing Analysis in Singapore. Ecol. Econ. 2018, 149, 149–159. [Google Scholar] [CrossRef]
- Kang, Y.; Zhang, F.; Peng, W.; Gao, S.; Rao, J.; Duarte, F.; Ratti, C. Understanding house price appreciation using multi-source big geo-data and machine learning. Land Use Policy 2020, 104919. [Google Scholar] [CrossRef]
- Li, S.; Jiang, Y.; Ke, S.; Nie, K.; Wu, C. Understanding the Effects of Influential Factors on Housing Prices by Combining Extreme Gradient Boosting and a Hedonic Price Model (XGBoost-HPM). Land 2021, 10, 533. [Google Scholar] [CrossRef]
- Chen, L.; Yao, X.; Liu, Y.; Zhu, Y.; Chen, W.; Zhao, X.; Chi, T. Measuring Impacts of Urban Environmental Elements on Housing Prices Based on Multisource Data—A Case Study of Shanghai, China. ISPRS Int. J. Geo-Inf. 2020, 9, 106. [Google Scholar] [CrossRef] [Green Version]
- Li, X.; Zhang, C.; Li, W.; Ricard, R.; Meng, Q.; Zhang, W. Assessing street-level urban greenery using Google Street View and a modified green view index. Urban For. Urban Green. 2015, 14, 675–685. [Google Scholar] [CrossRef]
- Zhang, Y.; Li, S.; Fu, X.; Dong, R. Quantification of urban greenery using hemisphere-view panoramas with a green cover index. Ecosyst. Health Sustain. 2021, 1929502. [Google Scholar] [CrossRef]
- Yang, J.; Zhao, L.; McBride, J.; Gong, P. Can you see green? Assessing the visibility of urban forests in cities. Landsc. Urban Plan. 2009, 91, 97–104. [Google Scholar] [CrossRef]
- Zhang, F.; Zhang, D.; Liu, Y.; Lin, H. Representing place locales using scene elements. Comput. Environ. Urban Syst. 2018, 71, 153–164. [Google Scholar] [CrossRef]
- Zhou, B.; Lapedriza, A.; Khosla, A.; Oliva, A.; Torralba, A. Places: A 10 Million image database for scene recognition. IEEE Trans. Pattern Anal. Mach. Intell. 2018, 40, 1452–1464. [Google Scholar] [CrossRef] [Green Version]
- Zhang, Y.; Dong, R. Impacts of street-visible greenery on housing prices: Evidence from a hedonic price model and a massive street view image dataset in Beijing. ISPRS Int. J. Geo-Inf. 2018, 7, 104. [Google Scholar] [CrossRef] [Green Version]
- Fu, X.; Jia, T.; Zhang, X.; Li, S.; Zhang, Y. Do street-level scene perceptions affect housing prices in Chinese megacities? An analysis using open access datasets and deep learning. PLoS ONE 2019, 14, e0217505. [Google Scholar] [CrossRef] [PubMed]
- Ye, Y.; Xie, H.; Fang, J.; Jiang, H.; Wang, D. Daily accessed street greenery and housing price: Measuring economic performance of human-scale streetscapes via new urban data. Sustainability 2019, 11, 1741. [Google Scholar] [CrossRef] [Green Version]
- Stubbings, P.; Peskett, J.; Rowe, F.; Arribas-Bel, D. A Hierarchical Urban Forest Index Using Street-Level Imagery and Deep Learning. Remote Sens. 2019, 11, 1395. [Google Scholar] [CrossRef] [Green Version]
- Yoshimura, N.; Hiura, T. Demand and supply of cultural ecosystem services: Use of geotagged photos to map the aesthetic value of landscapes in Hokkaido. Ecosyst. Serv. 2017, 24, 68–78. [Google Scholar] [CrossRef]
- Dong, R.; Zhang, Y.; Zhao, J. How green are the streets within the sixth ring road of Beijing? An analysis based on tencent street view pictures and the green view index. Int. J. Environ. Res. Public Health 2018, 15, 1367. [Google Scholar] [CrossRef] [Green Version]
- Zhao, H.; Shi, J.; Qi, X.; Wang, X.; Jia, J. Pyramid Scene Parsing Network. In Proceedings of the 2017 IEEE Conference on Computer Vision and Pattern Recognition (CVPR), Honolulu, HI, USA, 21–26 July 2017; pp. 6230–6239. [Google Scholar]
- Rosen, S. Hedonic prices and implicit markets: Product differentiation in pure competition. J. Political Econ. 1974, 82, 34–55. [Google Scholar] [CrossRef]
- Lancaster, K.J. A New Approach to Consumer Theory. In Mathematical Models in Marketing: A Collection of Abstracts; Funke, U.H., Ed.; Springer: Berlin/Heidelberg, Germany, 1976; pp. 106–107. [Google Scholar] [CrossRef] [Green Version]
- Helbich, M.; Brunauer, W.; Vaz, E.; Nijkamp, P. Spatial heterogeneity in hedonic house price models: The case of Austria. Urban Stud. 2013, 51, 390–411. [Google Scholar] [CrossRef] [Green Version]
- Fotheringham, A.S.; Charlton, M.E.; Brunsdon, C. Geographically weighted regression: A natural evolution of the expansion method for spatial data analysis. Environ. Plan. A Econ. Space 1998, 30, 1905–1927. [Google Scholar] [CrossRef]
- Vichiensan, V.; Miyamoto, K. Influence of urban rail transit on house value: Spatial hedonic analysis in Bangkok. Proc. East. Asia Soc. Transp. Stud. 2009, 2009, 192. [Google Scholar] [CrossRef]
- Goodman, A.; Thibodeau, T. Age-related heteroskedasticity in hedonic house price equations. J. Hous. Res. 1995, 6, 25–42. [Google Scholar]
- Goodman, A.; Thibodeau, T. Dwelling age heteroskedasticity in hedonic house price equations: An extension. J. Hous. Res. 1997, 8, 299–317. [Google Scholar]
- Fotheringham, A.S.; Yang, W.; Kang, W. Multiscale geographically weighted regression (MGWR). Ann. Am. Assoc. Geogr. 2017, 107, 1247–1265. [Google Scholar] [CrossRef]
- Oshan, T.; Li, Z.; Kang, W.; Wolf, L.; Fotheringham, A. mgwr: A python implementation of multiscale geographically weighted regression for investigating process spatial heterogeneity and scale. ISPRS Int. J. Geo Inf. 2019, 8, 269. [Google Scholar] [CrossRef] [Green Version]
- Zhou, B.; Zhao, H.; Puig, X.; Fidler, S.; Barriuso, A.; Torralba, A. Scene Parsing through ADE20K Dataset. In Proceedings of the 2017 IEEE Conference on Computer Vision and Pattern Recognition (CVPR), Honolulu, HI, USA, 21–26 July 2017; pp. 5122–5130. [Google Scholar]
- Chen, W.Y.; Jim, C.Y. Amenities and disamenities: A hedonic analysis of the heterogeneous urban landscape in Shenzhen (China). Geogr. J. 2010, 176, 227–240. [Google Scholar] [CrossRef]
- Xiao, Y.; Chen, X.; Li, Q.; Yu, X.; Chen, J.; Guo, J. Exploring determinants of housing prices in Beijing: An enhanced hedonic regression with open access POI data. ISPRS Int. J. Geo-Inf. 2017, 6, 358. [Google Scholar] [CrossRef] [Green Version]
- Jim, C.Y.; Chen, W.Y. Value of scenic views: Hedonic assessment of private housing in Hong Kong. Landsc. Urban Plan. 2009, 91, 226–234. [Google Scholar] [CrossRef]
- Luttik, J. The value of trees, water and open space as reflected by house prices in the Netherlands. Landsc. Urban Plan. 2000, 48, 161–167. [Google Scholar] [CrossRef]
- Huang, Y.; Jiang, L. Housing inequality in transitional Beijing. Int. J. Urban Reg. Res. 2009, 33, 936–956. [Google Scholar] [CrossRef]
- Zheng, S.; Kahn, M.E. Land and residential property markets in a booming economy: New evidence from Beijing. J. Urban Econ. 2008, 63, 743–757. [Google Scholar] [CrossRef]
- Yang, Z. An application of the hedonic price model with uncertain attribute–The case of the People’s Republic of China. Prop. Manag. 2001, 19, 50–63. [Google Scholar] [CrossRef]


| Category | Variables | Description | Mean | Standard Error |
|---|---|---|---|---|
| Dependent variable | LNHP | Log selling price in 10,000 RMB (Chinese currency, US $1 = RMB 6.497) | 5.667 | 0.536 |
| Structure characteristics | AREA | Average usable area in the home (m2) | 88.450 | 46.84 |
| ORI | Dummy variable; 1 if the building windows face south | 0.783 | 0.412 | |
| FLOOR | Average number of floors in the building | 11.539 | 11.861 | |
| AGE | 2021 minus the year of construction of the building | 19.641 | 13.747 | |
| PR | Floor-area ratio | 2.524 | 1.549 | |
| GR | Green coverage rate (%) | 32.462 | 7.486 | |
| PF | Property management fee (RMB/m2/ month) | 1.764 | 1.419 | |
| Neighborhood characteristics | BUS_D | Road distance to the nearest bus station (km) | 0.236 | 0.205 |
| ENT_D | Road distance to the nearest entertainment facility (km) | 0.132 | 0.215 | |
| HSP_D | Road distance to the nearest hospital (km) | 0.182 | 0.219 | |
| EDU_D | Road distance to the nearest school (km) | 0.182 | 0.239 | |
| SOP_D | Road distance to the nearest store (km) | 0.097 | 0.172 | |
| SUB_D | Road distance to the nearest subway station (km) | 1.471 | 1.334 | |
| GRE_D | Road distance to the nearest green space (km) | 0.253 | 0.245 | |
| WAT_D | Road distance to the nearest water body (km) | 0.732 | 0.503 | |
| LNPG | Logarithmic of average perceived greenery at the house level | 2.798 | 0.337 |
| Variables | Model 1: OLS Regression | ||
|---|---|---|---|
| Unstandardized Coefficients | Standard Error | p-Value | |
| Constant | 4.752 ** | 0.071 | 0.000 |
| Structure characteristics | |||
| AREA | 0.007 ** | 0.000 | 0.000 |
| ORI | 0.012 | 0.017 | 0.484 |
| FLOOR | 0.004 ** | 0.001 | 0.000 |
| AGE | 0.001 ** | 0.001 | 0.001 |
| PR | 0.005 | 0.004 | 0.248 |
| GR | 0.003 * | 0.001 | 0.003 |
| PF | 0.056 ** | 0.006 | 0.000 |
| Neighborhood characteristics | |||
| BUS_DIS | 0.173 ** | 0.034 | 0.000 |
| ENT_DIS | −0.075 | 0.040 | 0.061 |
| HSP_DIS | −0.104 * | 0.040 | 0.010 |
| EDU_DIS | −0.091 * | 0.031 | 0.004 |
| SOP_DIS | −0.102 | 0.057 | 0.072 |
| SUB_DIS | −0.069 ** | 0.005 | 0.000 |
| GRE_DIS | −0.012 * | 0.028 | 0.010 |
| WAT_DIS | 0.060 ** | 0.013 | 0.000 |
| LNPG | 0.105 ** | 0.020 | 0.000 |
| R2 | 0.653 | ||
| Adjusted R2 | 0.650 | ||
| AICc | 2723 | ||
| RSS | 433 | ||
| Model 2: GWR | Model 3: MGWR | |||||
|---|---|---|---|---|---|---|
| Variables | Unstandardized Coefficients (Mean) | Standard Error | Bandwidth | Unstandardized Coefficients (Mean) | Standard Error | Bandwidth |
| Constant | 4.750 ** | 0.446 | 360 | 4.560 ** | 0.240 | 54 |
| Structure characteristics | ||||||
| AREA | 0.008 ** | 0.001 | - | 0.008 ** | 0.001 | 122 |
| ORI | 0.073 | 0.005 | - | 0.007 | 0.001 | 3175 |
| FLOOR | 0.002 ** | 0.005 | - | 0.004 ** | 0.000 | 3175 |
| AGE | −0.002 ** | 0.003 | - | −0.002 ** | 0.000 | 3175 |
| PR | −0.007 | 0.011 | - | −0.009 | 0.000 | 3175 |
| GR | 0.002 ** | 0.004 | - | 0.003 ** | 0.000 | 3175 |
| PF | 0.044 ** | 0.037 | - | 0.020 ** | 0.000 | 3175 |
| Neighborhood characteristics | ||||||
| BUS_D | 0.034 ** | 0.117 | - | 0.031 ** | 0.004 | 3172 |
| ENT_D | 0.045 * | 0.219 | - | 0.062 * | 0.056 | 1735 |
| HSP_D | 0.035 * | 0.144 | - | 0.026 * | 0.003 | 3175 |
| EDU_D | −0.039 * | 0.173 | - | −0.028 * | 0.003 | 519 |
| SOP_D | 0.038 | 0.235 | - | 0.028 | 0.009 | 3132 |
| SUB_D | −0.016 ** | 0.052 | - | −0.019 ** | 0.001 | 3175 |
| GRE_D | −0.003 ** | 0.124 | - | −0.019 ** | 0.003 | 3175 |
| WAT_D | 0.024 ** | 0.107 | - | 0.083 ** | 0.029 | 1063 |
| LNPG | 0.019 ** | 0.121 | - | 0.041 ** | 0.000 | 3175 |
| R2 | 0.810 | 0.814 | ||||
| Adjusted R2 | 0.782 | 0.802 | ||||
| AICc | 883 | 378 | ||||
| RSS | 185 | 179 | ||||
Publisher’s Note: MDPI stays neutral with regard to jurisdictional claims in published maps and institutional affiliations. |
© 2021 by the authors. Licensee MDPI, Basel, Switzerland. This article is an open access article distributed under the terms and conditions of the Creative Commons Attribution (CC BY) license (https://creativecommons.org/licenses/by/4.0/).
Share and Cite
Zhang, Y.; Fu, X.; Lv, C.; Li, S. The Premium of Public Perceived Greenery: A Framework Using Multiscale GWR and Deep Learning. Int. J. Environ. Res. Public Health 2021, 18, 6809. https://doi.org/10.3390/ijerph18136809
Zhang Y, Fu X, Lv C, Li S. The Premium of Public Perceived Greenery: A Framework Using Multiscale GWR and Deep Learning. International Journal of Environmental Research and Public Health. 2021; 18(13):6809. https://doi.org/10.3390/ijerph18136809
Chicago/Turabian StyleZhang, Yonglin, Xiao Fu, Chencan Lv, and Shanlin Li. 2021. "The Premium of Public Perceived Greenery: A Framework Using Multiscale GWR and Deep Learning" International Journal of Environmental Research and Public Health 18, no. 13: 6809. https://doi.org/10.3390/ijerph18136809
APA StyleZhang, Y., Fu, X., Lv, C., & Li, S. (2021). The Premium of Public Perceived Greenery: A Framework Using Multiscale GWR and Deep Learning. International Journal of Environmental Research and Public Health, 18(13), 6809. https://doi.org/10.3390/ijerph18136809