
Equation for Tooth Size Prediction from Mixed Dentition Analysis for Taiwanese Population: A Pilot Study

 ,
, 
Abstract
1. Introduction
2. Materials and Methods
2.1. Subjects
2.2. Sample Size Calculation
2.3. Inclusion and Exclusion Criteria
2.4. Experimental Procedure
2.5. Statistics
3. Results
4. Discussion
5. Conclusions
- Male
- Female
- (x = combined mesiodistal width of the lower incisors; y = combined mesiodistal width of canines and premolars)
Author Contributions
Funding
Institutional Review Board Statement
Informed Consent Statement
Data Availability Statement
Conflicts of Interest
References
- Araújo, E.A.; Buschang, P.H. Recognizing and Correcting Developing Malocclusions: A Problem-Oriented Approach to Orthodontics; Wiley: Hoboken, NJ, USA, 2016. [Google Scholar]
- Graber, L.W.; Vanarsdall, R.L.; Vig, K.W.L. Orthodontics—E-Book: Current Principles and Techniques; Elsevier Health Sciences: Amsterdam, The Netherlands, 2011. [Google Scholar]
- Al-Abdallah, M.; Sandler, J.; O’Brien, K. Is the Royal London Space Analysis Reliable and Does it Influence Orthodontic Treatment Decisions? Eur. J. Orthod. 2008, 30, 503–507. [Google Scholar] [CrossRef]
- Bahreman, A. Early-age Orthodontic Treatment; Quintessence: Batavia, IL, USA, 2013. [Google Scholar]
- Yuen, K.K.; Tang, E.L.; So, L.L. Mixed Dentition Analysis for Hong Kong Chinese. Angle Orthod. 1998, 68, 21–28. [Google Scholar] [PubMed]
- Cobourne, M.T.; DiBiase, A.T. Handbook of Orthodontics; Elsevier Health Sciences: Amsterdam, The Netherlands, 2015. [Google Scholar]
- Tanaka, M.M.; Johnston, L.E. The Prediction of the Size of Unerupted Canines and Premolars in a Contemporary Orthodontic Population. J. Am. Dent. Assoc. 1974, 88, 798–801. [Google Scholar] [CrossRef]
- Dean, J.A. McDonald and Avery’s Dentistry for the Child and Adolescent; Elsevier Health Sciences: Amsterdam, The Netherlands, 2021. [Google Scholar]
- Al-Khadra, B.H. Prediction of the size of unerupted canines and premolars in a Saudi Arab population. Am. J. Orthod. Dentofac. Orthop. 1993, 104, 369–372. [Google Scholar] [CrossRef]
- Bishara, S.E.; Jakobsen, J.R.; Abdallah, E.M.; Garcia, A.F. Comparisons of mesiodistal and buccolingual crown dimensions of the permanent teeth in three populations from Egypt, Mexico, and the United States. Am. J. Orthod. Dentofac. Orthop. 1989, 96, 416–422. [Google Scholar] [CrossRef]
- Otuyemi, O.D.; Noar, J.H. A comparison of crown size dimensions of the permanent teeth in a Nigerian and a British population. Eur. J. Orthod. 1996, 18, 623–628. [Google Scholar] [CrossRef] [PubMed]
- Al-Bitar, Z.B.; Al-Omari, I.K.; Sonbol, H.N.; Al-Ahmad, H.T.; Hamdan, A.M. Mixed dentition analysis in a Jordanian population. Angle Orthod. 2008, 78, 670–675. [Google Scholar] [CrossRef]
- Arslan, S.G.; Dildeş, N.; Kama, J.D.; Genç, C. Mixed-dentition analysis in a Turkish population. World J. Orthod. 2009, 10, 135–140. [Google Scholar] [PubMed]
- Hashim, H.A.; Al-Shalan, T.A. Prediction of the size of un-erupted permanent cuspids and bicuspids in a Saudi sample: A pilot study. J. Contemp. Dent Pract. 2003, 4, 40–53. [Google Scholar] [CrossRef]
- Jaroontham, J.; Godfrey, K. Mixed dentition space analysis in a Thai population. Eur. J. Orthod. 2000, 22, 127–134. [Google Scholar] [CrossRef]
- Durgekar, S.G.; Naik, V. Evaluation of Moyers mixed dentition analysis in school children. Indian J. Dent. Res. 2009, 20, 26–30. [Google Scholar] [CrossRef]
- Memon, S.; Fida, M. Comparison of three mixed dentition analysis methods in orthodontic patients at AKUH. J. Coll. Physicians Surg. Pak. 2010, 20, 533–537. [Google Scholar] [PubMed]
- Tome, W.; Ohyama, Y.; Yagi, M.; Takada, K. Demonstration of a sex difference in the predictability of widths of unerupted permanent canines and premolars in a Japanese population. Angle Orthod. 2011, 81, 938–944. [Google Scholar] [CrossRef] [PubMed]
- Legović, M.; Novosel, A.; Legović, A. Regression equations for determining mesiodistal crown diameters of canines and premolars. Angle Orthod. 2003, 73, 314–318. [Google Scholar]
- Asiry, M.A.; Albarakati, S.F.; Al-Maflehi, N.S.; Sunqurah, A.A.; Almohrij, M.I. Is Tanaka-Johnston mixed dentition analysis an applicable method for a Saudi population? Saudi Med. J. 2014, 35, 988–992. [Google Scholar] [PubMed]
- Altherr, E.R.; Koroluk, L.D.; Phillips, C. Influence of sex and ethnic tooth-size differences on mixed-dentition space analysis. Am. J. Orthod. Dentofac. Orthop. 2007, 132, 332–339. [Google Scholar] [CrossRef] [PubMed]
- Thimmegowda, U.; Niwlikar, K.B.; Khare, V.; Prabhakar, A.C. Applicability of Tanaka Jhonston Method and Prediction of Mesiodistal Width of Canines and Premolars in Children. J. Clin. Diagn. Res. 2017, 11, ZC16–ZC19. [Google Scholar] [CrossRef] [PubMed]
- Sonahita, A.; Dharma, R.M.; Dinesh, M.R.; Amarnath, B.C.; Prashanth, C.S.; Akshai, S.; Sathyadeep, V. Applicability of two methods of mixed dentition analysis in a contemporary Indian population sample. Eur. J. Pediatric Dent. 2012, 13, 29–34. [Google Scholar]
- Nourallah, A.W.; Gesch, D.; Nabieh Khordaji, M.; Splieth, C. New regression equations for predicting the size of unerupted canines and premolars in a contemporary population. Angle Orthod. 2002, 72, 216–221. [Google Scholar]
- Vilella, O.D.V.; Assunção, P.S.D.; Assunção, R.L.D. The Tanaka-Johnston orthodontic analysis for Brazilian individuals. Rev. Odonto Ciência 2012, 27, 16–19. [Google Scholar] [CrossRef]
- Toodehzaeim, M.H.; Haerian, A.; Alesaeidi, A. Prediction of Mesiodistal Width of Unerupted Lateral Incisors, Canines and Premolars in Orthodontic Patients in Early Mixed Dentition Period. J. Dent. 2016, 13, 383–387. [Google Scholar]
- Ling, J.Y.; Wong, R.W. Tanaka-Johnston mixed dentition analysis for southern Chinese in Hong Kong. Angle Orthod. 2006, 76, 632–636. [Google Scholar] [PubMed]
- Bishara, S.E.; Staley, R.N. Mixed-dentition mandibular arch length analysis: A step-by-step approach using the revised Hixon-Oldfather prediction method. Am. J. Orthod. 1984, 86, 130–135. [Google Scholar] [CrossRef]
- Hammad, S.M.; Abdellatif, A.M. Mixed dentition space analysis in Egyptian children. Pediatric Dent. J. 2010, 20, 115–121. [Google Scholar] [CrossRef]
- Kim, H.-Y. Statistical Notes for Clinical Researchers: Evaluation of Measurement Error 2: Dahlberg’s Error, Bland-Altman Method, and Kappa Coefficient. Restor. Dent. Endod. 2013, 38, 182–185. [Google Scholar] [CrossRef]
- Arif, A.N.; Rasheed, T.A.; Ali, A.J. Dental crowding and its relationship to tooth size and arch dimensions. J. Nat. Sci. Res. 2014, 4, 113–136. [Google Scholar]
- Perillo, L.; Padricelli, G.; Isola, G.; Femiano, F.; Chiodini, P.; Mataresei, G. Class II malocclusion division 1: A new classification method by cephalometric analysis. Eur. J. Pediatric Dent. 2012, 13, 192–196. [Google Scholar]
- Perillo, L.; Isola, G.; Esercizio, D.; Iovane, M.; Triolo, G.; Matarese, G. Differences in craniofacial characteristics in Southern Italian children from Naples: A retrospective study by cephalometric analysis. Eur. J. Pediatric Dent. 2013, 14, 195–198. [Google Scholar]
- Melgaço, C.A.; Araújo, M.T.; Ruellas, A.C.O. Applicability of Three Tooth Size Prediction Methods for White Brazilians. Angle Orthod. 2006, 76, 644–649. [Google Scholar]
- Flores-Mir, C.; Rosenblatt, M.R.; Major, P.W.; Carey, J.P.; Heo, G. Measurement accuracy and reliability of tooth length on conventional and CBCT reconstructed panoramic radiographs. Dent. Press J. Orthod. 2014, 19, 45–53. [Google Scholar] [CrossRef]
- Peluso, M.J.; Josell, S.D.; Levine, S.W.; Lorei, B.J. Digital models: An introduction. Semin. Orthod. 2004, 10, 226–238. [Google Scholar] [CrossRef]
- Correia, G.D.C.; Habib, F.A.L.; Vogel, C.J. Tooth-size discrepancy: A comparison between manual and digital methods. Dent. Press J. Orthod. 2014, 19, 107–113. [Google Scholar] [CrossRef] [PubMed][Green Version]
- Fleming, P.S.; Marinho, V.; Johal, A. Orthodontic measurements on digital study models compared with plaster models: A systematic review. Orthod. Craniofac. Res. 2011, 14, 1–16. [Google Scholar] [CrossRef]
- Ahluwalia, P.; Jodhka, S.; Thomas, A.M. Prediction of Mesio-distal width of Canines and premolars in a sample of north Indian population. Indian J. Dent. Adv. 2011, 3, 568–571. [Google Scholar] [CrossRef]
- Ling, Y.-K. A Morphometric Study of the Dentition of 12 Year old Chinese children in Hong Kong. Ph.D. Thesis, The University of Hong Kong, Hong Kong, China, 1992. [Google Scholar]
- Moyers, R.E. Handbook of Orthodontics for the Student and General Practitioner; Year Book Medical Publishers: Maryland Heights, MO, USA, 1973. [Google Scholar]
- Ballard, M.L.; Wylie, W.L. Mixed Dentition Case Analysis-Estimating Size of Unerupted Permanent Teeth. Am. J. Orthod. Oral Surg. 1947, 33, 754–759. [Google Scholar] [CrossRef]
- Staley, R.N.; Hoag, J.F. Prediction of the mesiodistal widths of maxillary permanent canines and premolars. Am. J. Orthod. 1978, 73, 169–177. [Google Scholar] [CrossRef]
- Frankel, H.H.; Benz, E.M. Mixed dentition analysis for black Americans. Pediatric Dent. 1986, 8, 226–230. [Google Scholar]
- Adnani, I.Q.; Shahid, F.; Zaman, S.; Ahmed, F.; Saleem, M. Application of Moyer’s prediction table in a sample of Karachi population. Pak. Orthod. J. 2011, 3, 16–20. [Google Scholar]
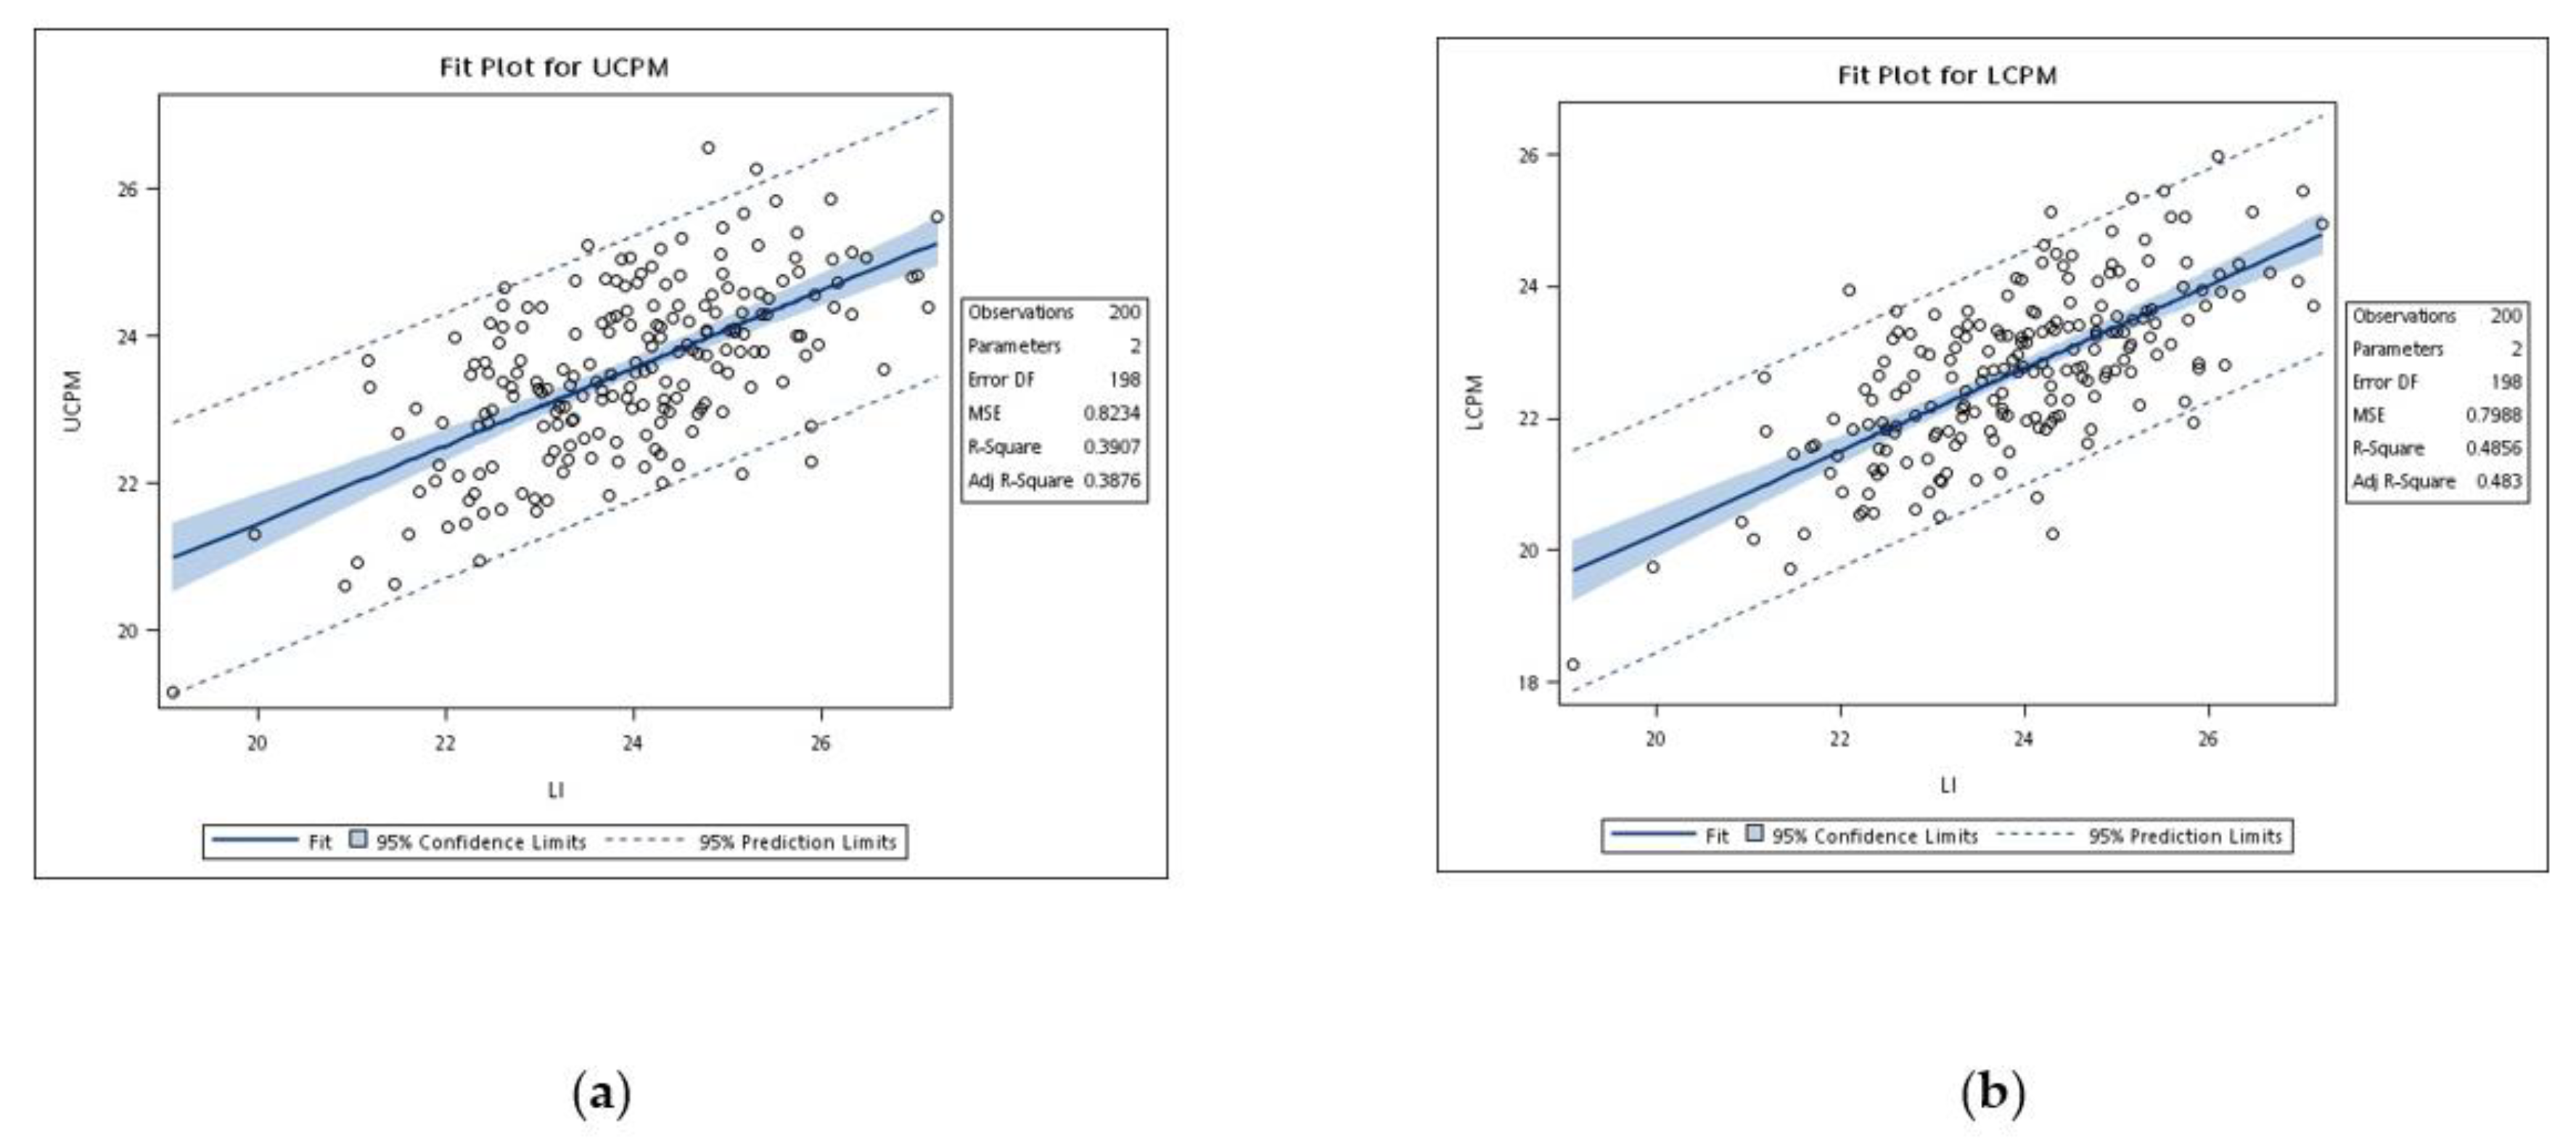
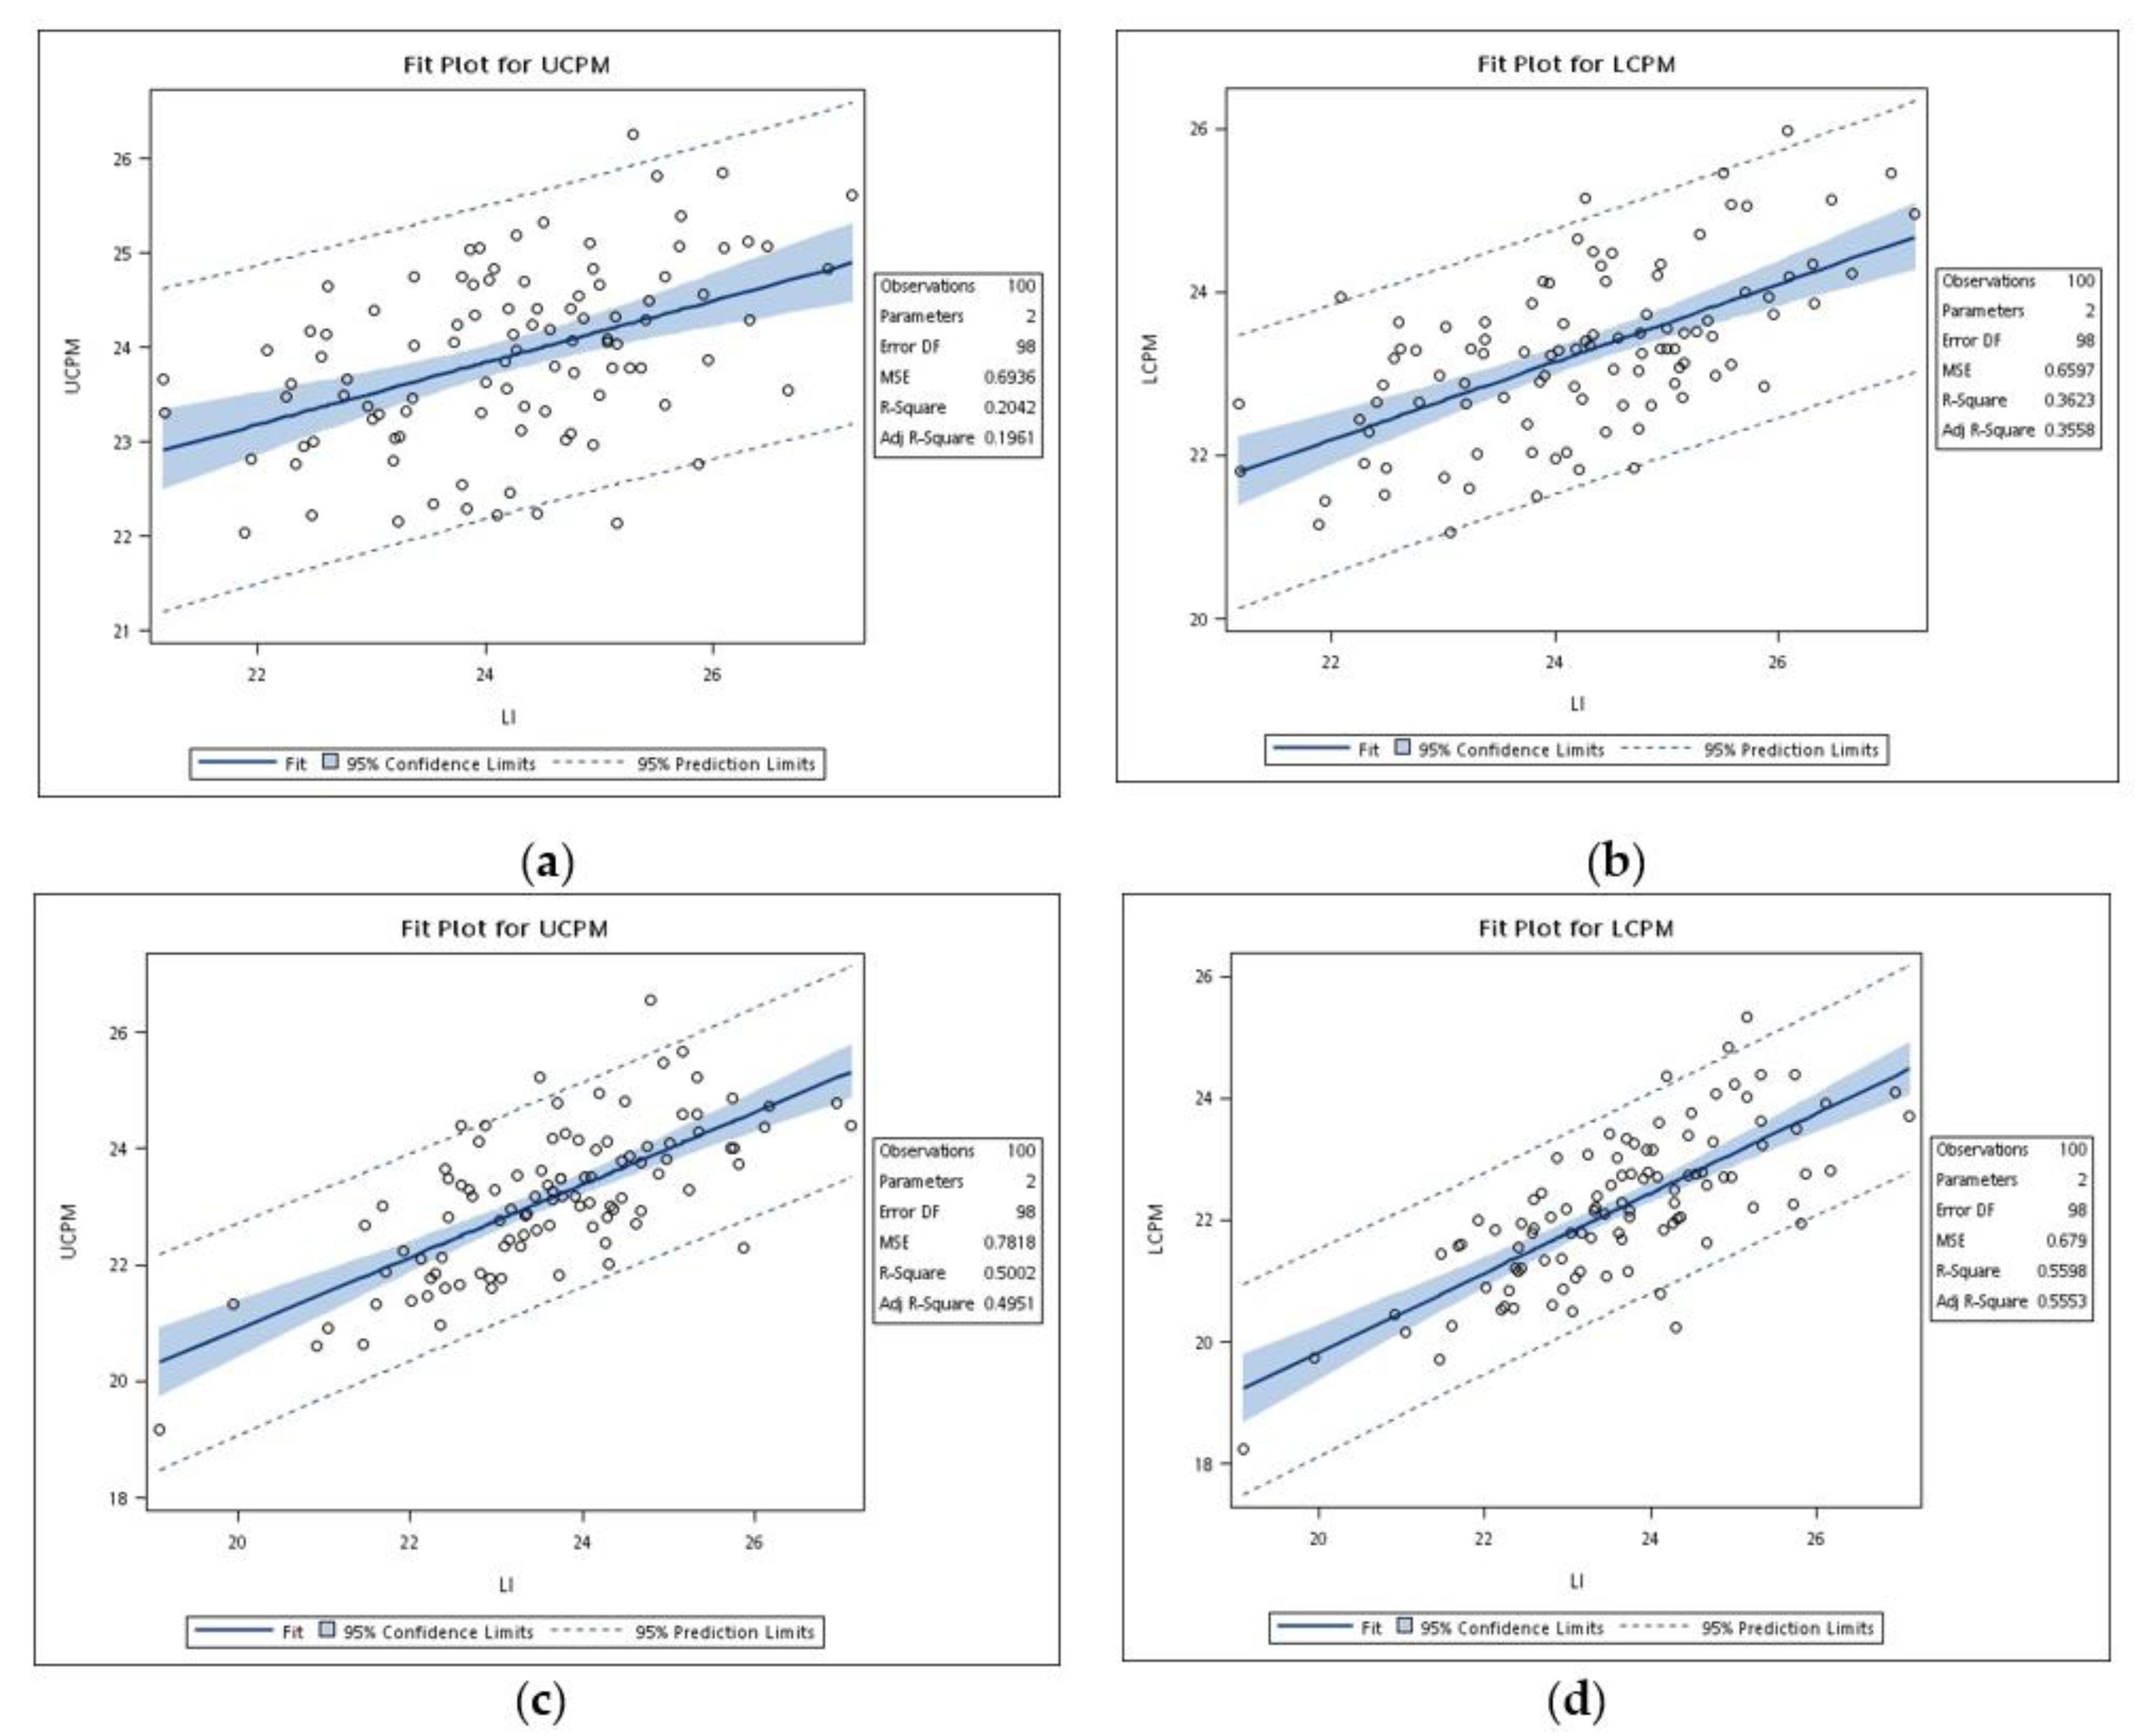
 = p < 0.05; UCPM = combined mesiodistal width of the upper canines and premolars; LCPM = combined mesiodistal width of the lower canines and premolars).
= p < 0.05; UCPM = combined mesiodistal width of the upper canines and premolars; LCPM = combined mesiodistal width of the lower canines and premolars).
= p < 0.05; UCPM = combined mesiodistal width of the upper canines and premolars; LCPM = combined mesiodistal width of the lower canines and premolars).


| Gender | Mean Age (Years Old) | n |
|---|---|---|
| Males | 19.3 ± 5.6 | 100 |
| Females | 20.1 ± 7.0 | 100 |
| Teeth | Male | Female |
|---|---|---|
| 13, 23 | 8.47 ± 0.37 | 8.14 ± 0.43 * |
| 14, 24 | 7.97 ± 0.35 | 7.69 ± 0.48 * |
| 15, 25 | 7.48 ± 0.39 | 7.30 ± 0.48 * |
| 31, 41 | 5.77 ± 0.35 | 5.60 ± 0.34 * |
| 32, 42 | 6.35 ± 0.35 | 6.23 ± 0.40 * |
| 33, 43 | 7.50 ± 0.38 | 7.01 ± 0.40 * |
| 34, 44 | 7.92 ± 0.35 | 7.61 ± 0.44 * |
| 35, 45 | 7.84 ± 0.45 | 7.59 ± 0.51 * |
| Arch | Actual Tooth Size | Tanaka–Johnston Analysis |
|---|---|---|
| Upper | ||
| CPM (M + F) | 23.54 ± 1.16 | 22.97 ± 0.69 * |
| Lower | ||
| CPM (M + F) | 22.73 ± 1.24 | 22.47 ± 0.69 * |
| Upper | ||
| CPM (M) | 23.92 ± 0.92 | 23.11 ± 0.64 * |
| Lower | ||
| CPM (M) | 23.25 ± 1.01 | 22.61 ± 0.64 * |
| Upper | ||
| CPM (F) | 23.16 ± 1.24 | 22.82 ± 0.70 * |
| Lower | ||
| CPM (F) | 22.21 ± 1.23 | 22.32 ± 0.70 |
| Group | Arch | r | a | b | SEE | r2 | |
|---|---|---|---|---|---|---|---|
| Male + Female | Upper | 0.63 | 10.94 | 0.53 | 0.90 | 0.39 | * |
| Lower | 0.70 | 7.68 | 0.63 | 0.90 | 0.49 | * | |
| Male | Upper | 0.45 | 15.99 | 0.33 | 0.83 | 0.20 | * |
| Lower | 0.60 | 11.75 | 0.47 | 0.81 | 0.36 | * | |
| Female | Upper | 0.71 | 8.42 | 0.62 | 0.88 | 0.50 | * |
| Lower | 0.75 | 6.73 | 0.65 | 0.82 | 0.56 | * |
| Arch | Group | Equation |
|---|---|---|
| Upper | Male | Y = 15.99 + 0.33X |
| Female | Y = 8.42 + 0.62X | |
| Lower | Male | Y = 11.75 + 0.47X |
| Female | Y = 6.73 + 0.65X |
| Study | Y | r | a | b | SEE | r2 |
|---|---|---|---|---|---|---|
| Taiwan, 2021 | Md-M | 0.60 | 11.75 | 0.47 | 0.81 | 0.36 |
| Mx-M | 0.45 | 15.99 | 0.33 | 0.83 | 0.20 | |
| Md-F | 0.75 | 6.73 | 0.65 | 0.82 | 0.56 | |
| Mx-F | 0.71 | 8.42 | 0.62 | 0.88 | 0.50 | |
| North America, 1974 [7] | Md | 0.65 | 9.18 | 0.54 | 0.85 | 0.42 |
| Mx | 0.63 | 10.41 | 0.51 | 0.86 | 0.40 | |
| Hong Kong, 1998 [5] | Md-M | 0.77 | 8.82 | 0.58 | 0.61 | 0.60 |
| Mx-M | 0.79 | 7.97 | 0.66 | 0.68 | 0.62 | |
| Md-F | 0.69 | 6.66 | 0.64 | 0.82 | 0.47 | |
| Mx-F | 0.65 | 8.30 | 0.61 | 0.81 | 0.42 | |
| Turkey, 2009 [13] | Md-M | 0.98 | 4.51 | 0.71 | 0.01 | 0.96 |
| Mx-M | 0.98 | 5.32 | 0.71 | 0.01 | 0.96 | |
| Md-F | 0.97 | 4.17 | 0.73 | 0.02 | 0.94 | |
| Mx-F | 0.96 | 3.82 | 0.78 | 0.02 | 0.91 | |
| Karachi, 2011 [45] | Md-M | 0.54 | 12.09 | 0.44 | 0.84 | 0.29 |
| Mx-M | 0.71 | 11.14 | 0.48 | 0.58 | 0.51 | |
| Md-F | 0.88 | 6.65 | 0.65 | 0.55 | 0.77 | |
| Mx-F | 0.88 | 10.22 | 0.51 | 0.42 | 0.77 |
Publisher’s Note: MDPI stays neutral with regard to jurisdictional claims in published maps and institutional affiliations. |
© 2021 by the authors. Licensee MDPI, Basel, Switzerland. This article is an open access article distributed under the terms and conditions of the Creative Commons Attribution (CC BY) license (https://creativecommons.org/licenses/by/4.0/).
Share and Cite
Chong, S.Y.; Aung, L.M.; Pan, Y.-H.; Chang, W.-J.; Tsai, C.-Y. Equation for Tooth Size Prediction from Mixed Dentition Analysis for Taiwanese Population: A Pilot Study. Int. J. Environ. Res. Public Health 2021, 18, 6356. https://doi.org/10.3390/ijerph18126356
Chong SY, Aung LM, Pan Y-H, Chang W-J, Tsai C-Y. Equation for Tooth Size Prediction from Mixed Dentition Analysis for Taiwanese Population: A Pilot Study. International Journal of Environmental Research and Public Health. 2021; 18(12):6356. https://doi.org/10.3390/ijerph18126356
Chicago/Turabian StyleChong, See Yen, Lwin Moe Aung, Yu-Hwa Pan, Wei-Jen Chang, and Chi-Yang Tsai. 2021. "Equation for Tooth Size Prediction from Mixed Dentition Analysis for Taiwanese Population: A Pilot Study" International Journal of Environmental Research and Public Health 18, no. 12: 6356. https://doi.org/10.3390/ijerph18126356
APA StyleChong, S. Y., Aung, L. M., Pan, Y.-H., Chang, W.-J., & Tsai, C.-Y. (2021). Equation for Tooth Size Prediction from Mixed Dentition Analysis for Taiwanese Population: A Pilot Study. International Journal of Environmental Research and Public Health, 18(12), 6356. https://doi.org/10.3390/ijerph18126356