Global Trends in Child Obesity: Are Figures Converging?


Abstract
1. Introduction
2. Methodology
3. Data and Empirical Results
3.1. Data
3.2. Results and Discussion
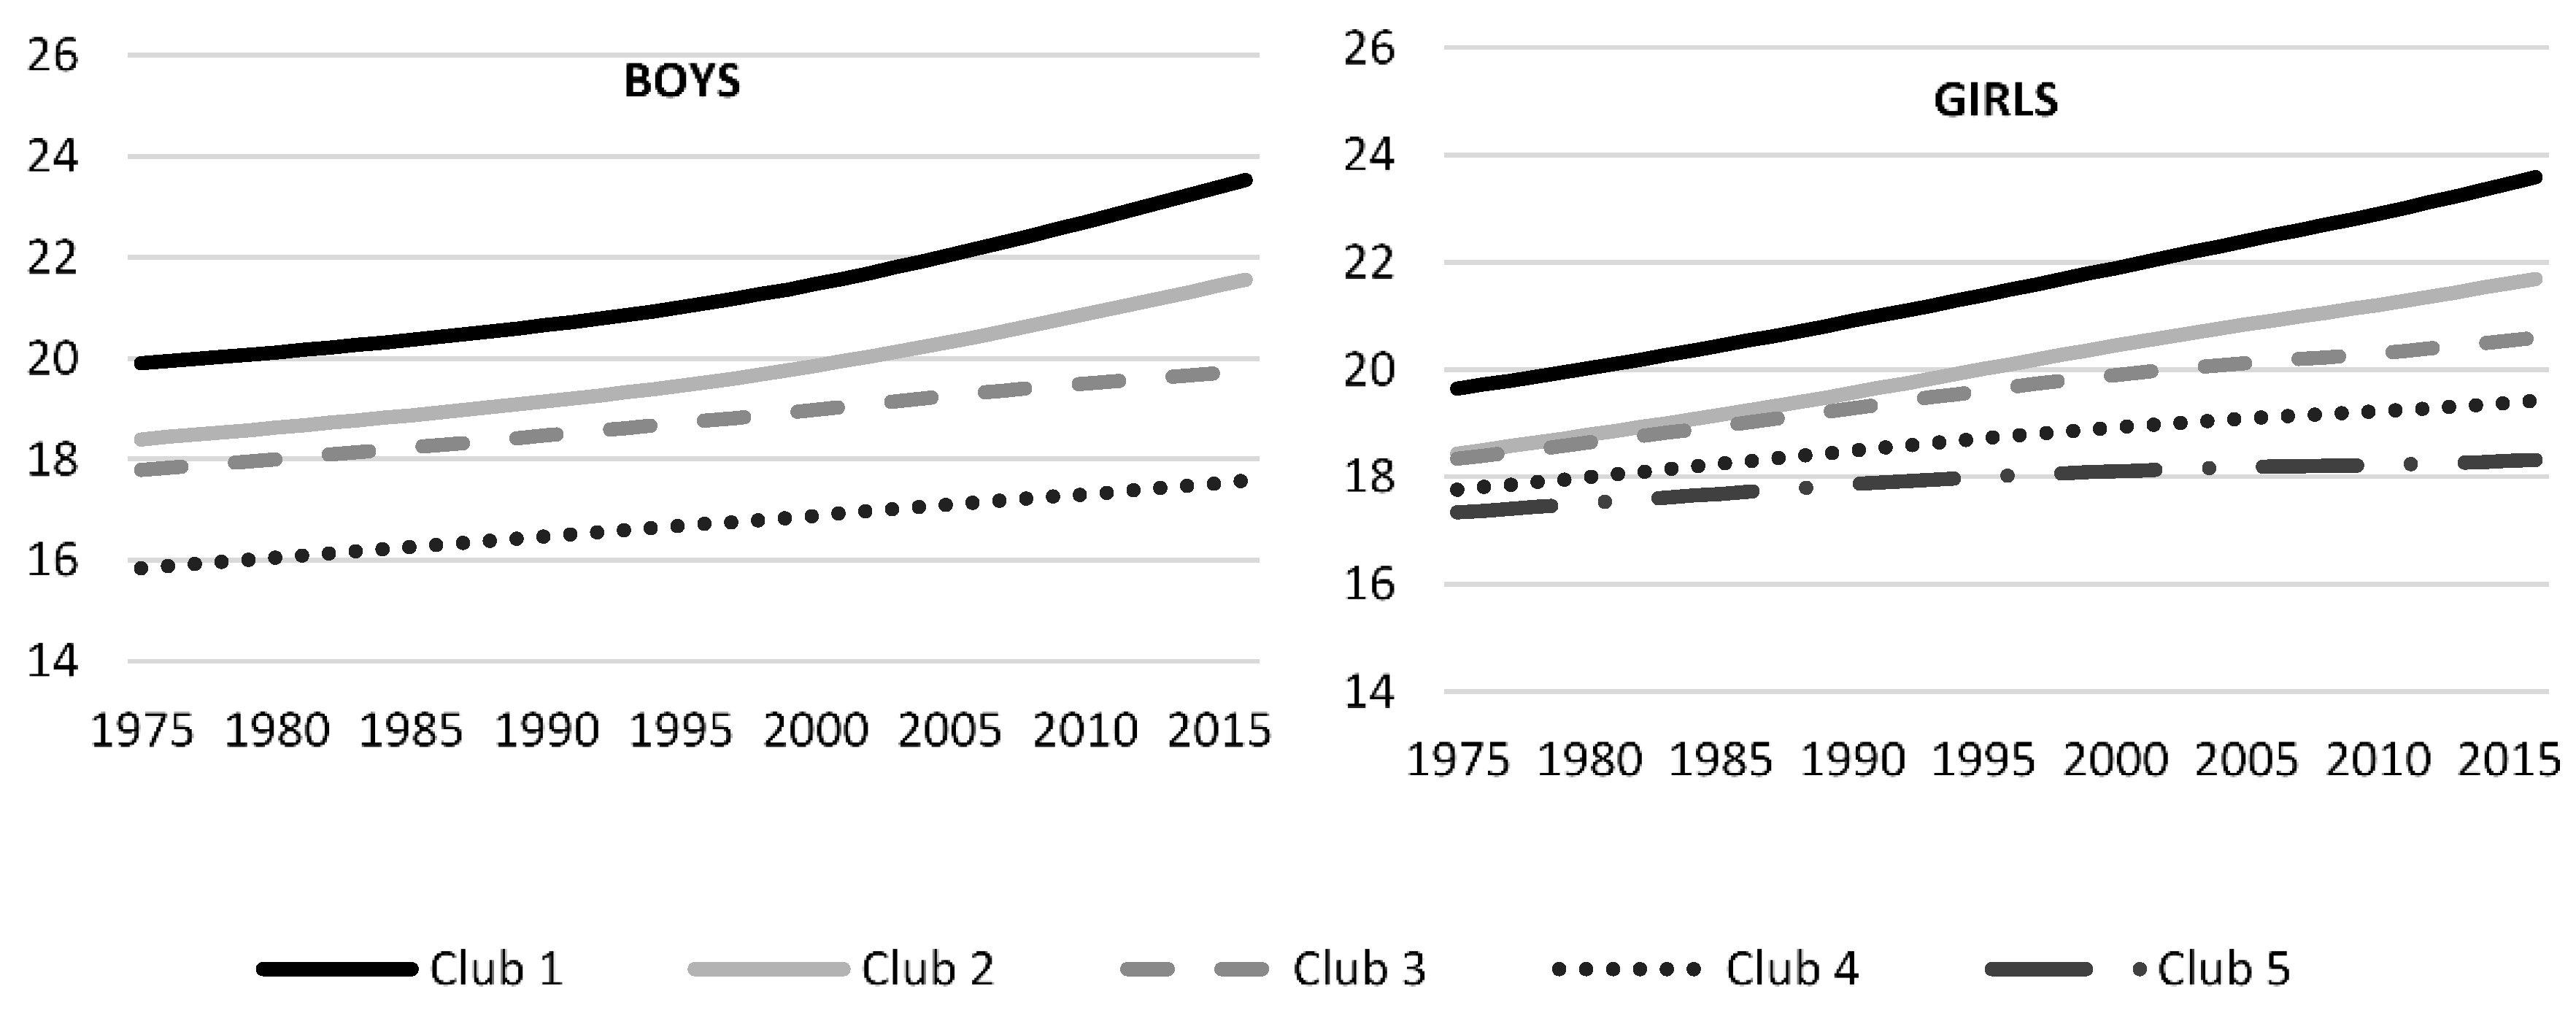
3.2.1. Characterization of the Convergence Clubs
3.2.2. Factors Driving Club Formation
- GDP per capita based on purchasing power parity (PPP) converted to international dollars using purchasing power parity rates. Data are in constant 2017 international dollars. Source: World Development Indicators-World Bank [40].
- Two governance indicators: Political Stability and Voice. Political Stability and Absence of Violence/Terrorism measures perceptions of the likelihood of political instability and/or politically motivated violence, including terrorism. Voice and Accountability captures perceptions of the extent to which a country’s citizens are able to participate in selecting their government, as well as freedom of expression, freedom of association, and a free media. Scores range from −2.5 to 2.5 in both indicators. Source: World Development Indicators-World Bank [40].
- Human Capital Index (HCI) measures the amount of human capital that a child born today can expect to attain by age 18, given the risks of poor health and poor education that prevail in the country where she lives. The index score ranges from zero to one and measures the productivity as a future worker of a child born today relative to the benchmark of full health and complete education. Source: World Development Indicators-World Bank [40].
- Urban rate is the percentage of population living in urban areas as defined by national statistical offices. Source: World Development Indicators-World Bank [40].
- Globalization Index measures the economic, social and political dimensions of globalization. The globalization Index comes from [41].
4. Conclusions
Author Contributions
Funding
Conflicts of Interest
Appendix A
Appendix B

Appendix C


Appendix D
Appendix D.1. Body Mass Index Club Composition

| Africa | Oceania | Asia | Latin | EU & NA | Total | |
|---|---|---|---|---|---|---|
| Boys | ||||||
| Club 1 | 0 | 5 | 0 | 0 | 0 | 5 |
| Club 2 | 0 | 6 | 4 | 9 | 1 | 20 |
| Club 3 | 15 | 5 | 28 | 25 | 41 | 114 |
| Club 4 | 36 | 1 | 18 | 0 | 2 | 57 |
| Girls | ||||||
| Club 1 | 0 | 7 | 0 | 0 | 0 | 7 |
| Club 2 | 1 | 4 | 0 | 4 | 0 | 9 |
| Club 3 | 4 | 3 | 12 | 19 | 8 | 46 |
| Club 4 | 13 | 2 | 14 | 9 | 20 | 58 |
| Club 5 | 35 | 1 | 24 | 2 | 16 | 78 |
Appendix D.2. BMI Club Composition for Boys
Appendix D.3. BMI Club Composition for Girls
Appendix E
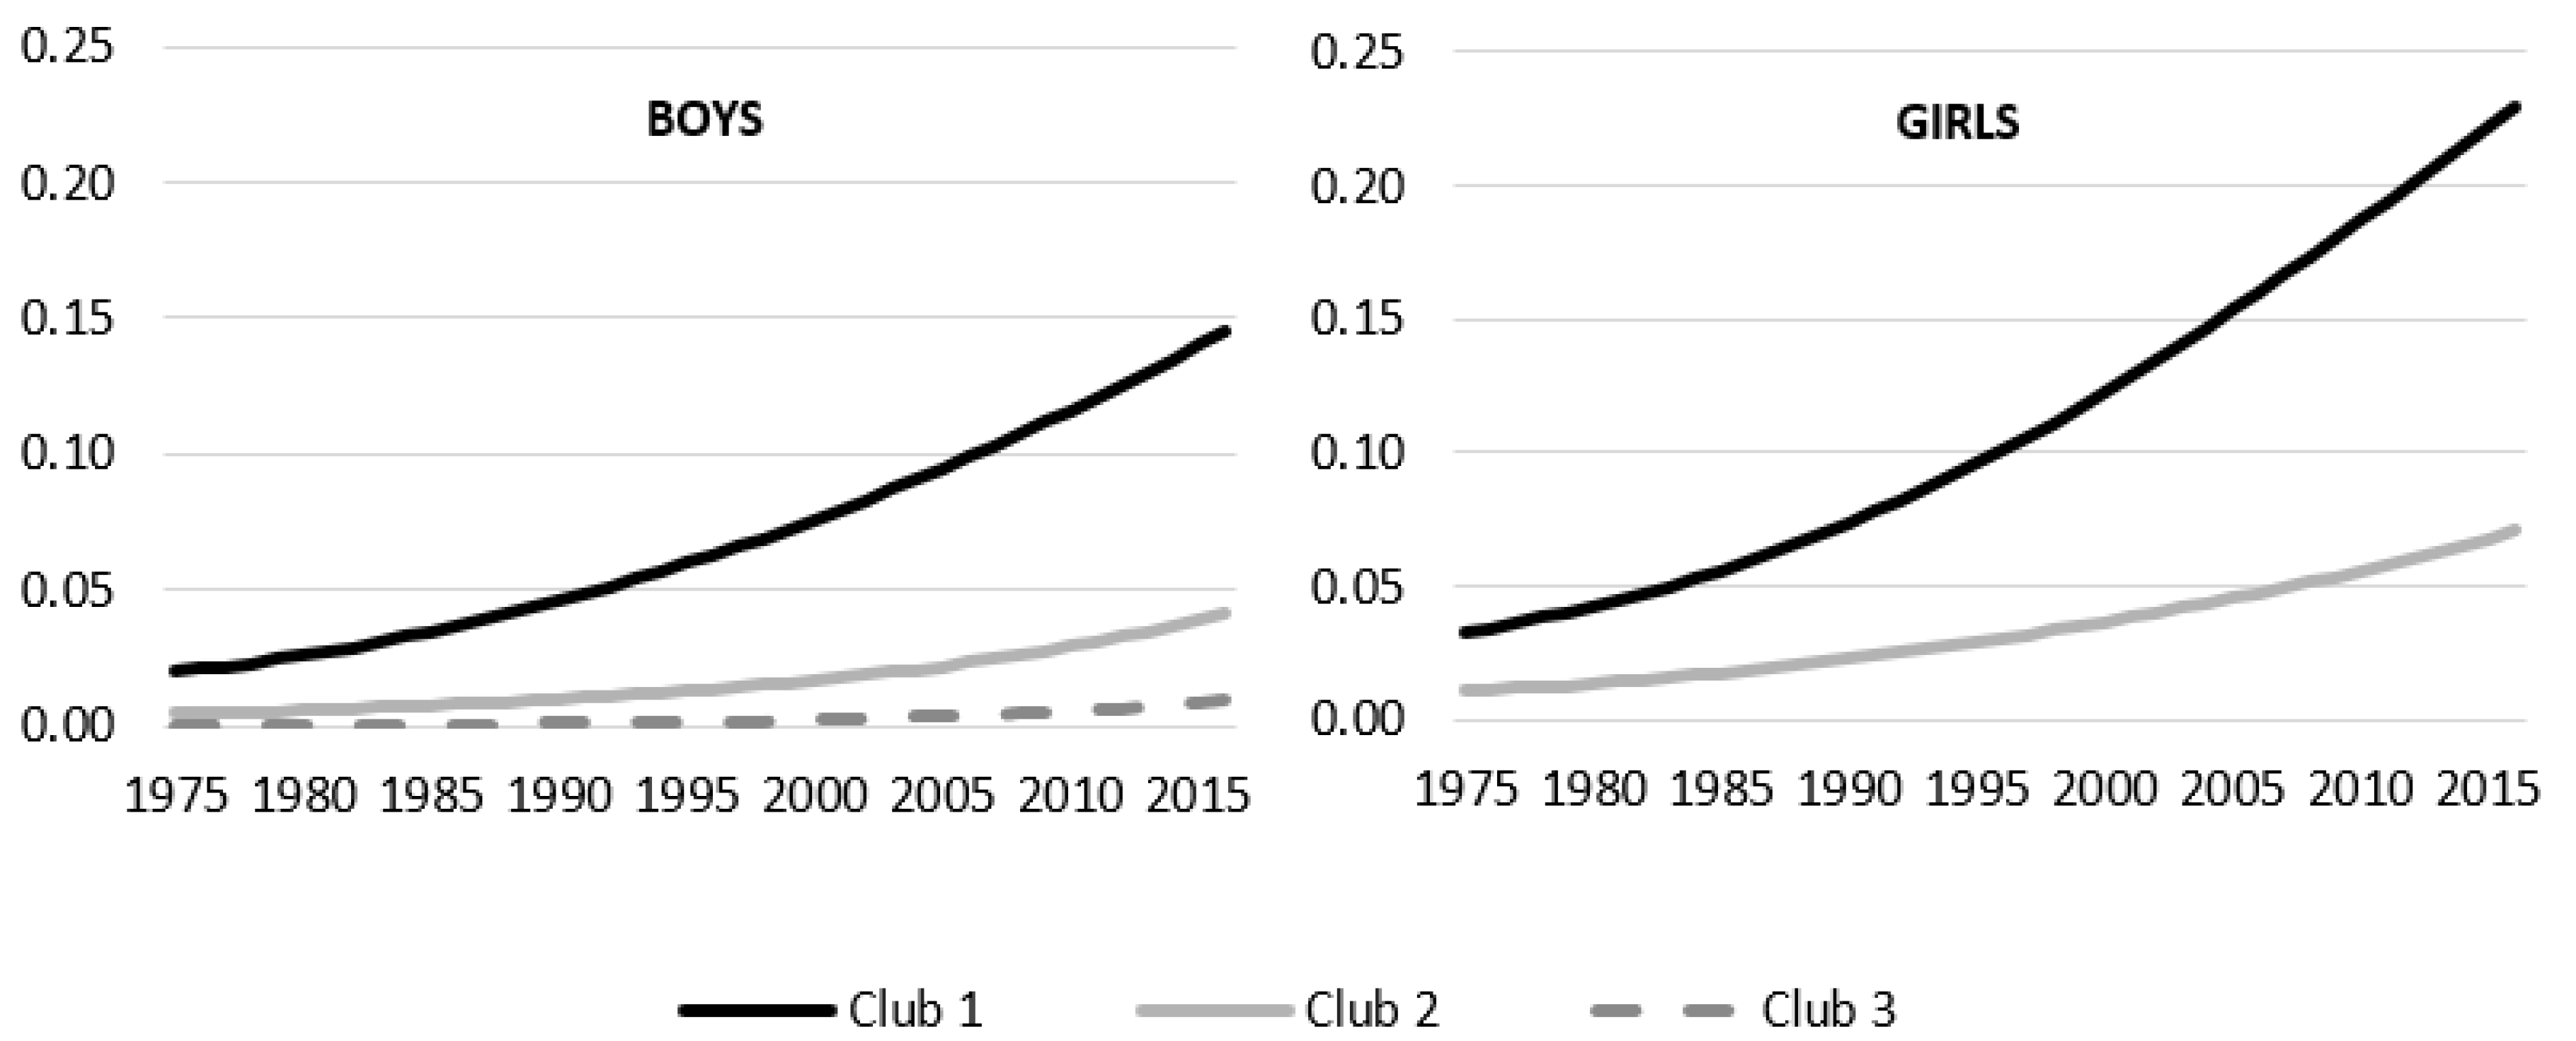
Appendix E.1. Obesity Prevalence Club Composition
| Africa | Oceania | Asia | Latin | EU & NA | Total | |
|---|---|---|---|---|---|---|
| Boys | ||||||
| Club 1 | 7 | 15 | 28 | 31 | 32 | 113 |
| Club 2 | 34 | 2 | 22 | 3 | 12 | 73 |
| Club 3 | 12 | 0 | 0 | 0 | 0 | 12 |
| Girls | ||||||
| Club 1 | 4 | 11 | 1 | 0 | 1 | 17 |
| Club 2 | 49 | 6 | 49 | 34 | 43 | 181 |
Appendix E.2. Obesity Club Composition for Boys
Appendix E.3. Obesity Club Composition for Girls
References
- World Health Statistics 2018: Monitoring Health for the SDGs, Sustainable Development Goals. Available online: https://apps.who.int/iris/bitstream/handle/10665/272596/9789241565585-eng.pdf?sequence=1&isAllowed=y (accessed on 9 December 2020).
- Bentham, J.; Di Cesare, M.; Bilano, V.; Bixby, H.; Zhou, B.; Stevens, G.A.; Riley, L.M.; Taddei, C.; Hajifathalian, K.; Lu, Y.; et al. Worldwide trends in body-mass index, underweight, overweight, and obesity from 1975 to 2016: A pooled analysis of 2416 population-based measurement studies in 128·9 million children, adolescents, and adults. Lancet 2017, 390, 2627–2642. [Google Scholar] [CrossRef]
- Wang, Y.; Beydoun, M.A.; Liang, L.; Caballero, B.; Kumanyika, S.K. Will all Americans become overweight or obese? Estimating the progression and cost of the US obesity epidemic. Obesity 2008, 16, 2323–2330. [Google Scholar] [CrossRef] [PubMed]
- Bollyky, T.J.; Templin, T.; Cohen, M.; Dieleman, J.L. Lower-Income Countries That Face the Most Rapid Shift IN Noncommunicable Disease Burden Are also the Least Prepared. Health Aff. 2017, 36, 1866–1875. [Google Scholar] [CrossRef] [PubMed]
- Wang, Y.; Lobstein, T. Worldwide trends in childhood overweight and obesity. Int. J. Pediatr. Obes. 2006, 1, 11–25. [Google Scholar] [CrossRef]
- Wang, Y.; Beydoun, M.A. The obesity epidemic in the United States—Gender, age, socioeconomic, racial/ethnic, and geographic characteristics: A systematic review and meta-regression analysis. Epidemiol. Rev. 2007, 29, 6–28. [Google Scholar] [CrossRef]
- Monteiro, C.A.; Conde, W.L.; Popkin, B.M. Income-Specific Trends in Obesity in Brazil: 1975–2003. Am. J. Public Health 2007, 97, 1808–1812. [Google Scholar] [CrossRef]
- Noncommunicable Diseases: Childhood Overweight and Obesity. Available online: https://www.who.int/news-room/q-a-detail/noncommunicable-diseases-childhood-overweight-and-obesity (accessed on 5 November 2020).
- Dietz, W.H. Health Consequences of Obesity in Youth: Childhood Predictors of Adult Disease. Pediatrics 1998, 101. [Google Scholar] [CrossRef]
- Must, A.; Strauss, R.S. Risks and consequences of childhood and adolescent obesity. Int. J. Obes. 1999, 23, S2–S11. [Google Scholar] [CrossRef]
- Lasserre, A.M.; Chiolero, A.; Paccaud, F.; Bovet, P. Worldwide trends in childhood obesity. Swiss Med. Wkly. 2007, 137, 16–19. [Google Scholar]
- Swinburn, B.A.; Sacks, G.; Hall, K.D.; McPherson, K.; Finegood, D.T.; Moodie, M.L.; Gortmaker, S.L. The global obesity pandemic: Shaped by global drivers and local environments. Lancet 2011, 378, 804–814. [Google Scholar] [CrossRef]
- Kumah, D.B.; Akuffo, K.O.; Abaka-Cann, J.E.; Affram, D.E.; Osae, E.A. Prevalence of overweight and obesity among students in the Kumasi metropolis. J. Nutr. Metab. 2015, 2015. [Google Scholar] [CrossRef] [PubMed]
- Danquah, F.I.; Ansu-Mensah, M.; Bawontuo, V.; Yeboah, M.; Udoh, R.H.; Tahiru, M.; Kuupiel, D. Risk factors and morbidities associated with childhood obesity in sub-Saharan Africa: A systematic scoping review. BMC Nutr. 2020, 6, 37. [Google Scholar] [CrossRef] [PubMed]
- Ball, K.; Crawford, D. Socioeconomic status and weight change in adults: A review. Soc. Sci. Med. 2005, 60, 1987–2010. [Google Scholar] [CrossRef] [PubMed]
- Ji, C.Y.; Cheng, T.O. Epidemic increase in overweight and obesity in Chinese children from 1985 to 2005. Int. J. Cardiol. 2009, 132, 1–10. [Google Scholar] [CrossRef] [PubMed]
- Jones-Smith, J.C.; Gordon-Larsen, P.; Siddiqi, A.; Popkin, B.M. Cross-national comparisons of time trends in overweight inequality by socioeconomic status among women using repeated cross-sectional surveys from 37 developing countries, 1989–2007. Am. J. Epidemiol. 2011, 173, 667–675. [Google Scholar] [CrossRef]
- Zhang, Q.; Wang, Y. Using concentration index to study changes in socio-economic inequality of overweight among US adolescents between 1971 and 2002. Int. J. Epidemiol. 2007, 36, 916–925. [Google Scholar] [CrossRef]
- Beydoun, M.A.; Wang, Y. Socio-demographic disparities in distribution shifts over time in various adiposity measures among American children and adolescents: What changes in prevalence rates could not reveal. Int. J. Pediatr. Obes. 2011, 6, 21–35. [Google Scholar] [CrossRef]
- Chen, T.-J.; Modin, B.; Ji, C.-Y.; Hjern, A. Regional, socioeconomic and urban-rural disparities in child and adolescent obesity in China: A multilevel analysis. Acta Paediatr. 2011, 100, 1583–1589. [Google Scholar] [CrossRef]
- Murasko, J.E. Trends in the associations between family income, height and body mass index in US children and adolescents: 1971–1980 and 1999–2008. Ann. Hum. Biol. 2011, 38, 290–306. [Google Scholar] [CrossRef]
- Ogden, C.L.; Carroll, M.D.; Kit, B.K.; Flegal, K.M. Prevalence of Obesity and Trends in Body Mass Index Among US Children and Adolescents, 1999–2010. JAMA 2012, 307, 483. [Google Scholar] [CrossRef]
- Phillips, P.C.B.; Sul, D. Transition modeling and econometric convergence tests. Econometrica 2007, 75, 1771–1855. [Google Scholar] [CrossRef]
- Phillips, P.C.B.; Sul, D. Economic transition and growth. J. Appl. Econom. 2009, 24, 1153–1185. [Google Scholar] [CrossRef]
- Duncan, R.; Toledo, P. Inequality in body mass indices across countries: Evidence from convergence tests. Econ. Hum. Biol. 2019, 33, 40–57. [Google Scholar] [CrossRef] [PubMed]
- Kasman, S.; Kasman, A. Convergence in obesity and overweight rates across OECD countries: Evidence from the stochastic and club convergence tests. Empir. Econ. 2020, 1–34. [Google Scholar] [CrossRef]
- Baumol, W.; Baumol, W. Productivity Growth, Convergence, and Welfare: What the Long-run Data Show. Am. Econ. Rev. 1986, 76, 1072–1085. [Google Scholar] [CrossRef]
- Quah, D. Galton’s Fallacy and Tests of the Convergence Hypothesis. Scand. J. Econ. 1993, 95, 427. [Google Scholar] [CrossRef]
- Quah, D.T. Empirics for Growth and Distribution: Stratification, Polarization, and Convergence Clubs. J. Econ. Growth 1997, 2, 27–59. [Google Scholar] [CrossRef]
- Azariadis, C.; Drazen, A. Threshold externalities in economic development. Q. J. Econ. 1990, 105, 501–526. [Google Scholar] [CrossRef]
- Galor, O. Convergence? Inferences from theoretical models. Econ. J. 1996, 106, 1056–1069. [Google Scholar] [CrossRef]
- Sichera, R.; Pizzuto, P. ConvergenceClubs: A package for performing the phillips and sul’s club convergence clustering procedure. R J. 2019, 11, 142–151. [Google Scholar] [CrossRef]
- De Long, J.B. Productivity Growth, Convergence, and Welfare: Comment. Am. Econ. Rev. 1998, 76, 1072–1085. [Google Scholar]
- Schnurbus, J.; Haupt, H.; Meier, V. Economic Transition and Growth: A Replication. J. Appl. Econom. 2017, 32, 1039–1042. [Google Scholar] [CrossRef]
- Du, K. Econometric Convergence Test and Club Clustering Using Stata. Stata J. Promot. Commun. Stat. Stata 2017, 17, 882–900. [Google Scholar] [CrossRef]
- Hodrick, R.J.; Prescott, E.C. Postwar U.S. Business Cycles: An Empirical Investigation. J. Money Credit Bank. 1997, 29. [Google Scholar] [CrossRef]
- Ravn, M.O.; Uhlig, H. On adjusting the Hodrick-Prescott filter for the frequency of observations. Rev. Econ. Stat. 2002, 84, 371–376. [Google Scholar] [CrossRef]
- Nghiem, S.; Vu, X.-B.; Barnett, A. Trends and determinants of weight gains among OECD countries: An ecological study. Public Health 2018, 159, 31–39. [Google Scholar] [CrossRef]
- He, J.; Sun, S.; Zickgraf, H.F.; Lin, Z.; Fan, X. Meta-analysis of gender differences in body appreciation. Body Image 2020, 33, 90–100. [Google Scholar] [CrossRef]
- WDI—Home. Available online: http://datatopics.worldbank.org/world-development-indicators/ (accessed on 5 November 2020).
- Gygli, S.; Haelg, F.; Potrafke, N.; Sturm, J.E. The KOF Globalisation Index—Revisited. Rev. Int. Organ. 2019, 14, 543–574. [Google Scholar] [CrossRef]
- Grecu, A.M.; Rotthoff, K.W. Economic growth and obesity: Findings of an Obesity Kuznets curve. Appl. Econ. Lett. 2015, 22, 539–543. [Google Scholar] [CrossRef]
- Windarti, N.; Hlaing, S.W.; Kakinaka, M. Obesity Kuznets curve: International evidence. Public Health 2019, 169, 26–35. [Google Scholar] [CrossRef]
- Aydin, M. The effect of economic growth on obesity for the most obese countries: New evidence from the obesity Kuznets curve. Eur. J. Health Econ. 2019, 20, 1349–1358. [Google Scholar] [CrossRef] [PubMed]
- Rundle, A.; Diez Roux, A.V.; Freeman, L.M.; Miller, D.; Neckerman, K.M.; Weiss, C.C. The urban built environment and obesity in New York City: A multilevel analysis. Am. J. Health Promot. 2007, 21, 326–334. [Google Scholar] [CrossRef] [PubMed]
- Yang, J.; Zhou, P. The obesity epidemic and the metropolitan-scale built environment: Examining the health effects of polycentric development. Urban Stud. 2020, 57, 39–55. [Google Scholar] [CrossRef]
- An, R.; Shen, J.; Bullard, T.; Han, Y.; Qiu, D.; Wang, S. A scoping review on economic globalization in relation to the obesity epidemic. Obes. Rev. 2020, 21. [Google Scholar] [CrossRef]
- NCD-RisC. BMI > Data Visualisations. Available online: http://ncdrisc.org/data-visualisations-adiposity-ado.html (accessed on 6 November 2020).


| Boys | Girls | |||||
|---|---|---|---|---|---|---|
| BMI | Overweight | Obesity | BMI | Overweight | Obesity | |
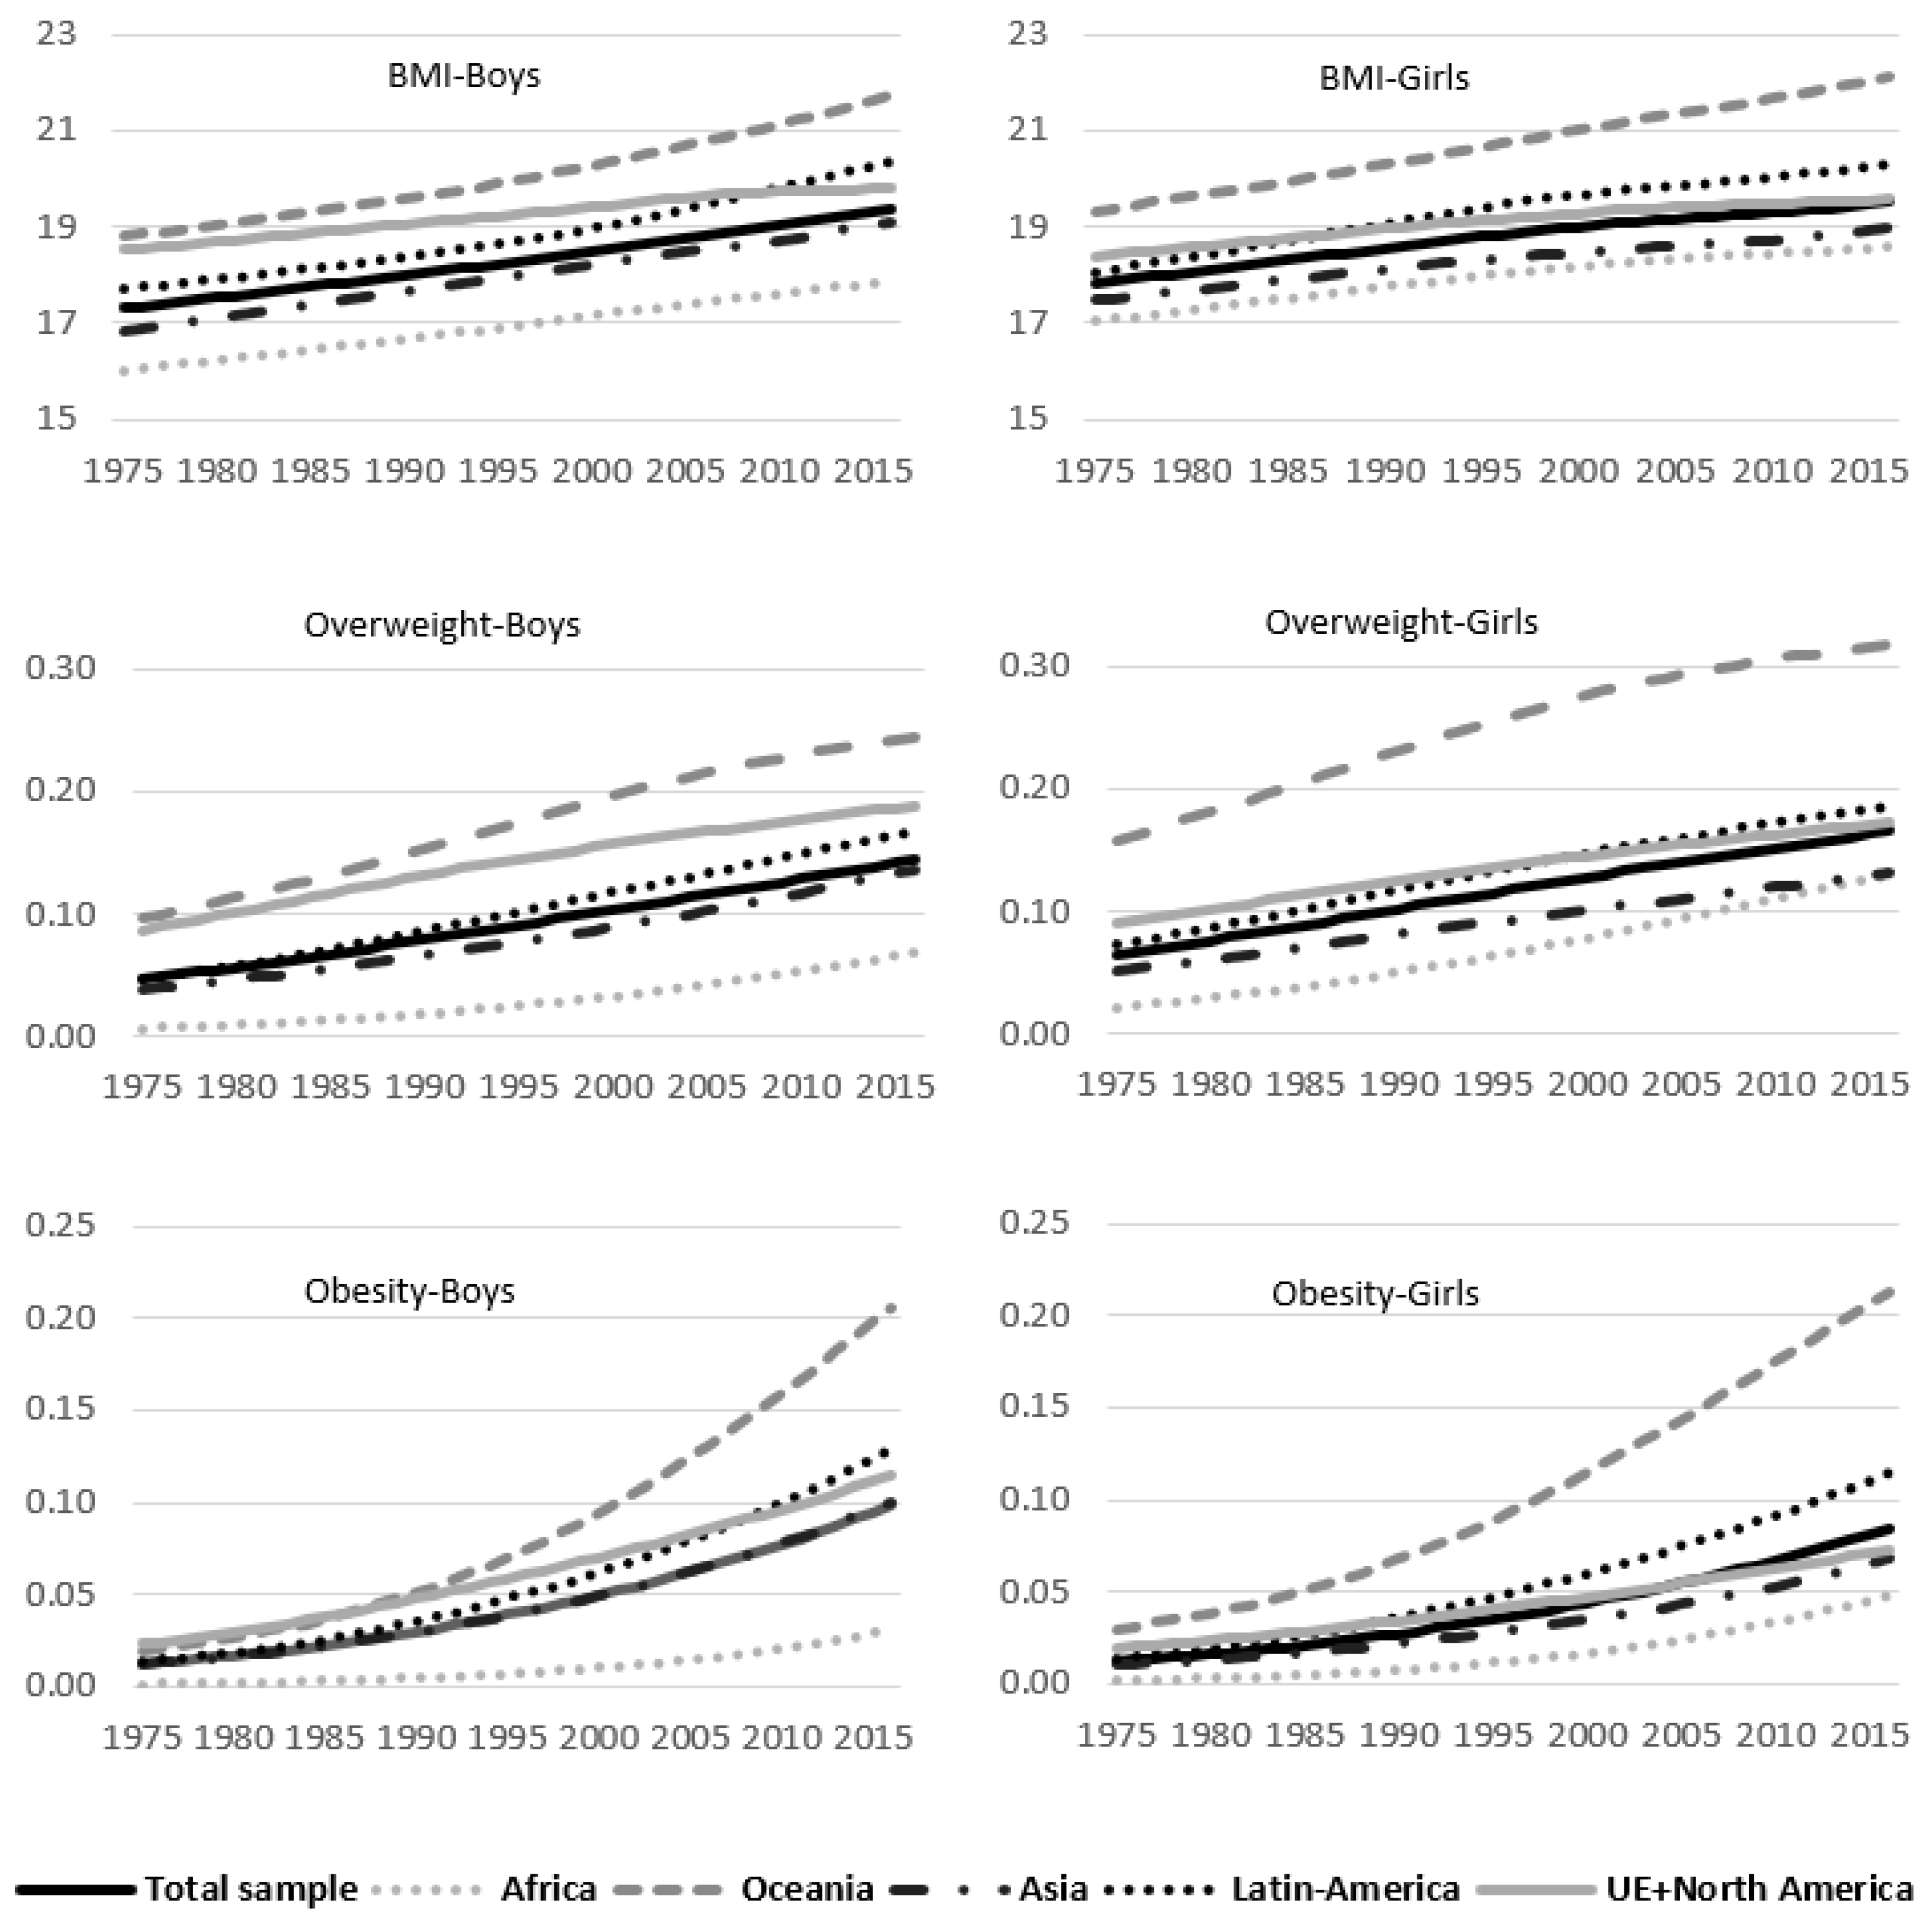
| Total sample | 18.293 | 0.093 | 0.045 | 18.746 | 0.116 | 0.040 |
| Africa | 16.942 | 0.030 | 0.010 | 17.927 | 0.069 | 0.017 |
| Oceania | 20.059 | 0.175 | 0.087 | 20.692 | 0.250 | 0.102 |
| Asia | 17.946 | 0.082 | 0.045 | 18.271 | 0.092 | 0.032 |
| Latin America | 18.814 | 0.105 | 0.057 | 19.307 | 0.132 | 0.054 |
| EU & North America | 19.232 | 0.143 | 0.063 | 19.086 | 0.135 | 0.043 |
| Developing Countries | 17.975 | 0.076 | 0.039 | 18.623 | 0.108 | 0.039 |
| Developed Countries | 19.263 | 0.146 | 0.065 | 19.119 | 0.139 | 0.045 |
| Boys | Girls | |||
|---|---|---|---|---|
| Beta | T-Stat | Beta | T-Stat | |
| Body Mass Index | ||||
| Total sample | −0.736 | −99.27 | −0.954 | −126.43 |
| Africa | −0.912 | −289.28 | −0.939 | −70.54 |
| Oceania | −1.178 | −100.52 | −1.905 | −27.30 |
| Asia | −0.741 | −95.06 | −0.636 | −119.15 |
| Latin America | −0.739 | −36.76 | −1.067 | −82.54 |
| EU & North America | −0.882 | −22.10 | −0.782 | −24.91 |
| Developing Countries | −1.045 | −31.65 | −1.003 | −123.60 |
| Developed Countries | −0.953 | −127.85 | −1.007 | −41.35 |
| Prevalence of Overweight | ||||
| Total sample | 0.032 | 0.98 | 0.229 | 6.09 |
| Africa | −0.264 | −8.74 | 0.284 | 4.95 |
| Oceania | 0.259 | 7.58 | −0.032 | −3.52 |
| Asia | 0.388 | 8.50 | 0.455 | 9.78 |
| Latin America | 1.261 | 15.66 | 0.714 | 10.95 |
| EU & North America | 0.719 | 9.69 | 0.558 | 12.55 |
| Developing Countries | −0.151 | −5.65 | 0.082 | 2.35 |
| Developed Countries | 0.580 | 9.36 | 0.422 | 10.67 |
| Prevalence of Obesity | ||||
| Total sample | −0.529 | −26.85 | −0.239 | −8.51 |
| Africa | −0.765 | −65.57 | −0.714 | −53.82 |
| Oceania | −1.089 | −129.16 | −0.858 | −93.07 |
| Asia | −0.283 | −9.35 | −0.043 | −1.28 |
| Latin America | −0.018 | −0.36 | 0.353 | 5.49 |
| EU & North America | 0.311 | 5.70 | 0.205 | 5.91 |
| Developing Countries | −0.723 | −53.38 | −0.450 | −21.43 |
| Developed Countries | 0.191 | 3.83 | −0.018 | −0.73 |
| Body Mass Index | |||||||
|---|---|---|---|---|---|---|---|
| BMI | GDP | Political Stability | Voice | HCI | Urban Rate | Globalization | |
| Boys | |||||||
| Club 1 | 21.31 | 12,406.0 | 1.02 | 0.93 | 0.51 | 62.73 | 47.99 |
| Club 2 | 19.68 | 24,751.1 | 0.57 | 0.35 | 0.57 | 65.18 | 57.97 |
| Club 3 | 18.76 | 25,345.3 | 0.06 | 0.13 | 0.64 | 67.04 | 68.78 |
| Club 4 | 16.70 | 7122.8 | −0.53 | −0.49 | 0.45 | 41.60 | 52.81 |
| Girls | |||||||
| Club 1 | 21.46 | 8766.9 | 1.13 | 0.93 | 0.53 | 55.04 | 49.70 |
| Club 2 | 20.04 | 19,672.8 | 0.45 | 0.80 | 0.59 | 75.94 | 64.00 |
| Club 3 | 19.55 | 25,483.4 | 0.19 | 0.10 | 0.59 | 67.09 | 62.99 |
| Club 4 | 18.67 | 22,347.0 | 0.04 | 0.16 | 0.62 | 61.76 | 67.20 |
| Club 5 | 17.93 | 14,558.5 | −0.40 | −0.39 | 0.52 | 50.61 | 59.35 |
| Obesity Prevalence | |||||||
| Obesity | GDP | Pol Stabil | Voice | HCI | Urban rate | Globalization | |
| Boys | |||||||
| Club 1 | 0.069 | 26,887.8 | 0.22 | 0.22 | 0.63 | 68.35 | 67.38 |
| Club 2 | 0.016 | 12,044.9 | −0.38 | −0.32 | 0.52 | 48.87 | 58.01 |
| Club 3 | 0.002 | 2147.9 | −0.66 | −0.48 | 0.37 | 34.45 | 49.04 |
| Girls | |||||||
| Club 1 | 0.112 | 15,200.0 | 0.53 | 0.56 | 0.51 | 60.42 | 57.32 |
| Club 2 | 0.034 | 19,904.9 | −0.10 | −0.07 | 0.57 | 58.89 | 63.01 |
| Body Mass Index | Obesity Rate | |||||||||||
|---|---|---|---|---|---|---|---|---|---|---|---|---|
| Boys | Girls | Boys | Girls | |||||||||
| Coefficient | t-Ratio | Coefficient | t-Ratio | Coefficient | t-Ratio | Coefficient | t-Ratio | |||||
| GDP | −0.153 | ** | −2.83 | −0.17 | *** | −4.48 | −0.205 | *** | −2.94 | −0.522 | ** | −2.26 |
| GDP2 | 0.001 | ** | 2.03 | 0.001 | *** | 4.09 | 0.001 | *** | 2.82 | 0.003 | ** | 2.36 |
| Polit. Stability | 0.47 | * | 1.64 | 0.188 | 0.61 | 0.132 | 0.38 | 1.212 | 1.03 | |||
| Voice | 0.751 | ** | 2.01 | 0.404 | 1.02 | 0.731 | * | 1.63 | −2.209 | −1.65 | ||
| Human Capital Index (HCI) | −55.369 | *** | −3.34 | −22.573 | * | −1.75 | −43.13 | *** | −3.22 | −90.137 | ** | −2.00 |
| HCI2 | 48.167 | *** | 3.49 | 21.79 | ** | 2.14 | 40.528 | *** | 3.50 | 107.004 | *** | 2.50 |
| Urban rate | −0.027 | * | −1.89 | −0.003 | −0.26 | −0.017 | −1.16 | 0.022 | 0.59 | |||
| Globalization | 0.011 | 0.25 | −0.006 | −0.14 | −0.019 | −0.50 | 0.075 | 0.79 | ||||
| Regions: | ||||||||||||
| Oceania | −5.396 | ** | −2.08 | −4.13 | *** | −2.93 | −4.373 | *** | −3.84 | −1.715 | −1.04 | |
| Asia | 0.599 | 0.94 | 1.003 | 1.37 | −0.71 | −0.96 | 5.591 | 1.36 | ||||
| Latin Am. | −3.324 | *** | −3.27 | −2.014 | *** | −2.70 | −3.237 | *** | −3.13 | 20.401 | *** | 9.14 |
| EU & NA | −1.17 | −1.21 | 1.03 | 1.19 | −0.581 | −0.62 | 2.246 | 1.75 | ||||
| Not observed | 147 | 149 | 149 | 149 | ||||||||
| R2-adjusted | 0.43 | 0.22 | 0.39 | 0.45 | ||||||||
| Log-ratio | −71.77 | −141.32 | −81.92 | −17.04 | ||||||||
Publisher’s Note: MDPI stays neutral with regard to jurisdictional claims in published maps and institutional affiliations. |
© 2020 by the authors. Licensee MDPI, Basel, Switzerland. This article is an open access article distributed under the terms and conditions of the Creative Commons Attribution (CC BY) license (http://creativecommons.org/licenses/by/4.0/).
Share and Cite
González-Álvarez, M.A.; Lázaro-Alquézar, A.; Simón-Fernández, M.B. Global Trends in Child Obesity: Are Figures Converging? Int. J. Environ. Res. Public Health 2020, 17, 9252. https://doi.org/10.3390/ijerph17249252
González-Álvarez MA, Lázaro-Alquézar A, Simón-Fernández MB. Global Trends in Child Obesity: Are Figures Converging? International Journal of Environmental Research and Public Health. 2020; 17(24):9252. https://doi.org/10.3390/ijerph17249252
Chicago/Turabian StyleGonzález-Álvarez, María A., Angelina Lázaro-Alquézar, and María Blanca Simón-Fernández. 2020. "Global Trends in Child Obesity: Are Figures Converging?" International Journal of Environmental Research and Public Health 17, no. 24: 9252. https://doi.org/10.3390/ijerph17249252
APA StyleGonzález-Álvarez, M. A., Lázaro-Alquézar, A., & Simón-Fernández, M. B. (2020). Global Trends in Child Obesity: Are Figures Converging? International Journal of Environmental Research and Public Health, 17(24), 9252. https://doi.org/10.3390/ijerph17249252