Article

An Improved Passive CR-39-Based Direct 222Rn/220Rn Progeny Detector

1
Institute of Radiation Emergency Medicine, Hirosaki University, 66-1 Hon-cho, Hirosaki 036-8564, Japan
2
National Institutes for Quantum and Radiological Science and Technology, 4-9-1 Anagawa, Inage, Chiba 263-8555, Japan
3
Graduate School of Health Sciences, Hirosaki University, 66-1 Hon-cho, Hirosaki 036-8564, Japan
*
Author to whom correspondence should be addressed.
Int. J. Environ. Res. Public Health 2020, 17(22), 8569; https://doi.org/10.3390/ijerph17228569
Submission received: 23 October 2020 / Revised: 16 November 2020 / Accepted: 16 November 2020 / Published: 18 November 2020

Abstract

:
An improved passive CR-39-based direct 222Rn/220Rn progeny detector with 3 detection channels was designed and tested in this study to measure and calculate equilibrium equivalent concentration (EEC) of both 222Rn and 220Rn without the equilibrium factor. A theoretical model was established to calculate the EEC with optimization. Subsequently, an exposure experiment was carried out to test the performance of this detector, and we compared the chamber experiment and the theoretical model by estimating and measuring various parameters. The deposition flux of progeny derived from the prediction agreed well with the value measured in the exposure chamber. The energy-weighted net track density (NTD) measured by this detector is much more reliable to reflect the linear relation between NTD and time-integrated EEC. Since the detector is sensitive to the exposure environmental condition, it is recommended to apply the detector to measure the EEC after its calibration in a typical indoor environment.

1. Introduction

In the conventional integrating measurements for 222Rn and 220Rn activity concentrations in a large-scale survey, the solid-state nuclear track detector (SSNTD) technique is usually used. Several designs of measuring devices using SSNTD have been used for indoor 222Rn and 220Rn surveys, such as RADUET [1], Pin-hole dosimeter [2,3,4], and so on. In the two different diffusion rate chambers of these measuring devices, because there is a diffusion barrier against 220Rn based on its quite short half-life, the low diffusion rate chamber detects mainly 222Rn and the high diffusion rate chamber detects both 222Rn and 220Rn. However, evaluation of the internal exposure to 222Rn and 220Rn does not directly use the activity concentration of 222Rn and 220Rn gas instead of the equilibrium equivalent concentration (EEC). It should be noted that the equilibrium factor depends on various parameters, such as the radioactive decay, ventilation, and reactions with the structure and the surface of furnishing. Because of the short half-life of 220Rn (55.6 s), the indoor 220Rn concentration distributes heterogeneously, decreasing with distance from the source [5,6]. Therefore, it is not feasible to use the 220Rn concentration directly measured by the integrating detectors to evaluate its internal exposure. Otherwise, study of the behavior of 222Rn and 220Rn decay products indoors is important for assessing the natural background radiation exposures on the public through the inhalation route. Therefore, the direct measurement technique of 222Rn and 220Rn progeny is desirable and necessary for the evaluation of internal indoor 222Rn and 220Rn exposure.
In the recent 20 years, a direct 220Rn progeny measurement technique based on CR-39 detector for EEC of 220Rn was developed and used by Zhuo and Iida [7], Tokonami et al. [8], Zhuo and Tokonami [9], Tokonami [10], Sorimach et al. [11], and Hu et al. [12]. Mishra and Mayya [13] were the first to develop the direct 222Rn and 220Rn progeny measurement techniques using LR-115 detector. CR-39 is the most sensitive and popular detector for recording α-particles [14] and performs stable results; no direct 222Rn and 220Rn progeny detector using CR-39 was developed and applied because its energy windows for recording α-particles is quite wide, and it is unable to distinguish alpha energy directly, although some researchers make great efforts to develop dedicated tools based on the track geometrical characteristics to measure alpha particles. Moreover, the application of the direct measurement technique for determining their progeny concentrations depends on estimation of the effective deposition velocities of combinations of 222Rn and 220Rn progenies in a typical indoor environment. Some researchers [11,15] used the experimental method to estimate the geometric mean deposition velocity and applied the data to actual measurement in an indoor environment. However, the experimental conditions had a lot of limitations on environmental parameters for estimating the deposition velocity. In this study, we developed a passive CR-39-based direct 222Rn/220Rn progeny detector. The 222Rn and 220Rn behavior model and particle deposition model were used to estimate the concentration of each 222Rn and 220Rn progeny as well as the EEC.

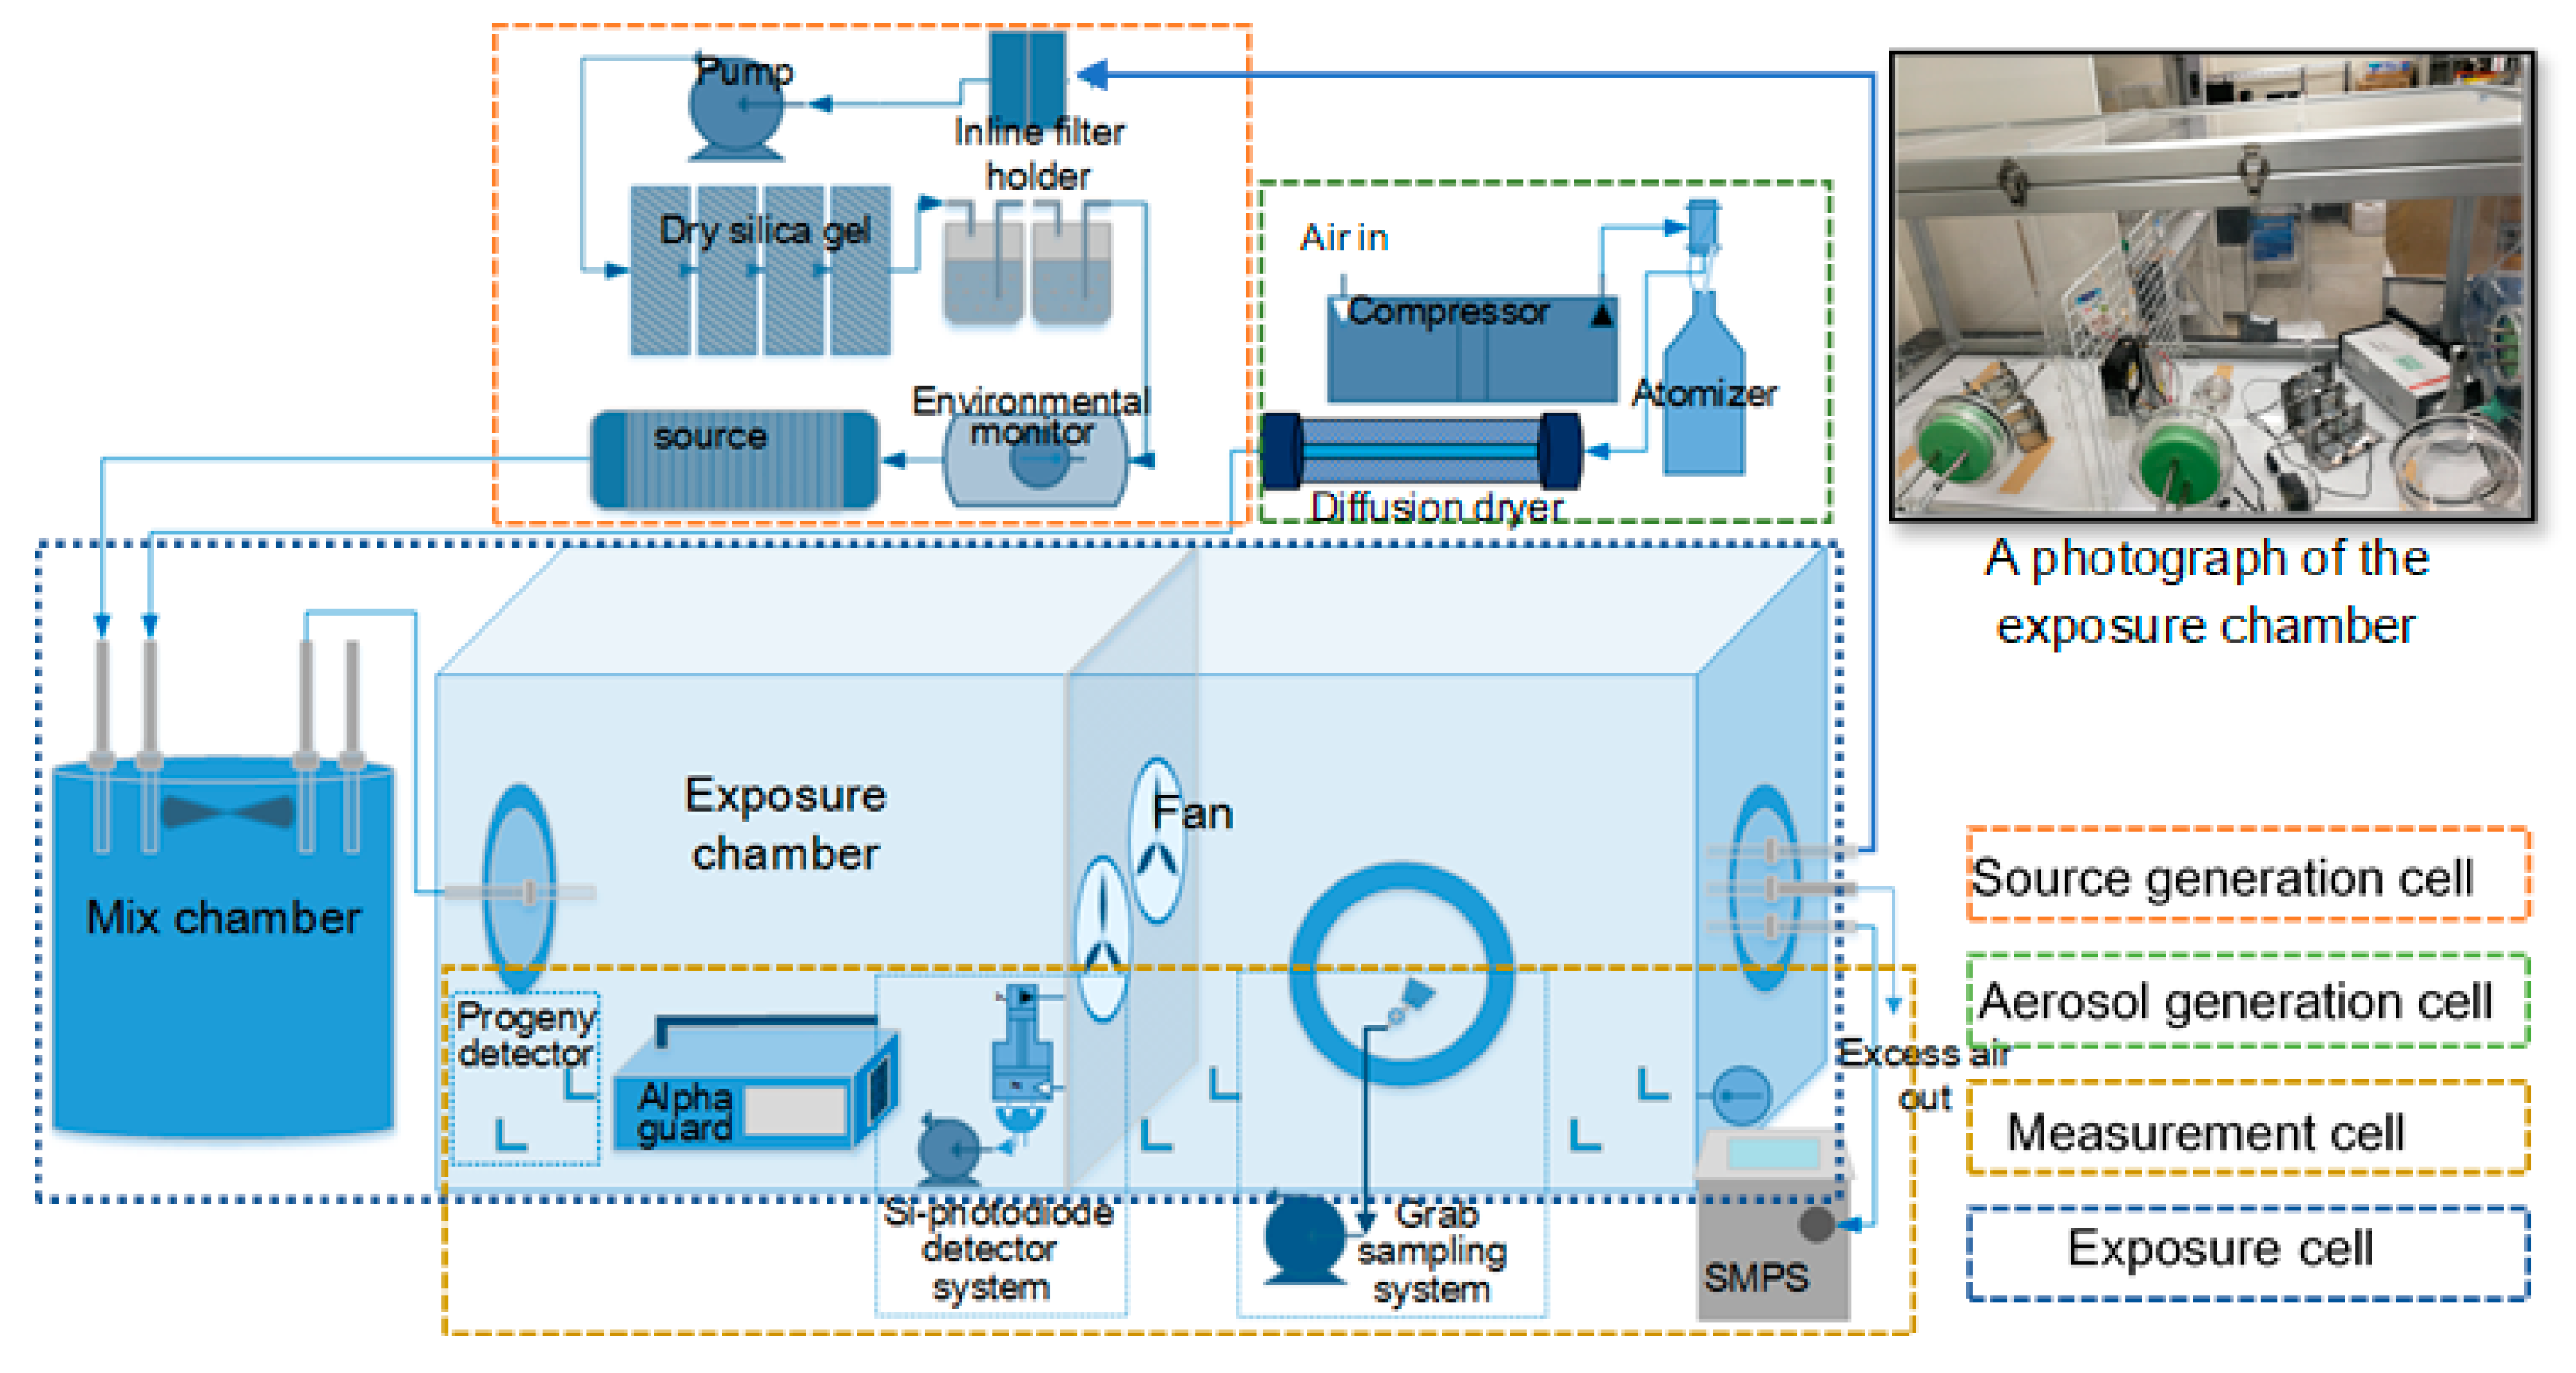
2. Materials and Methods

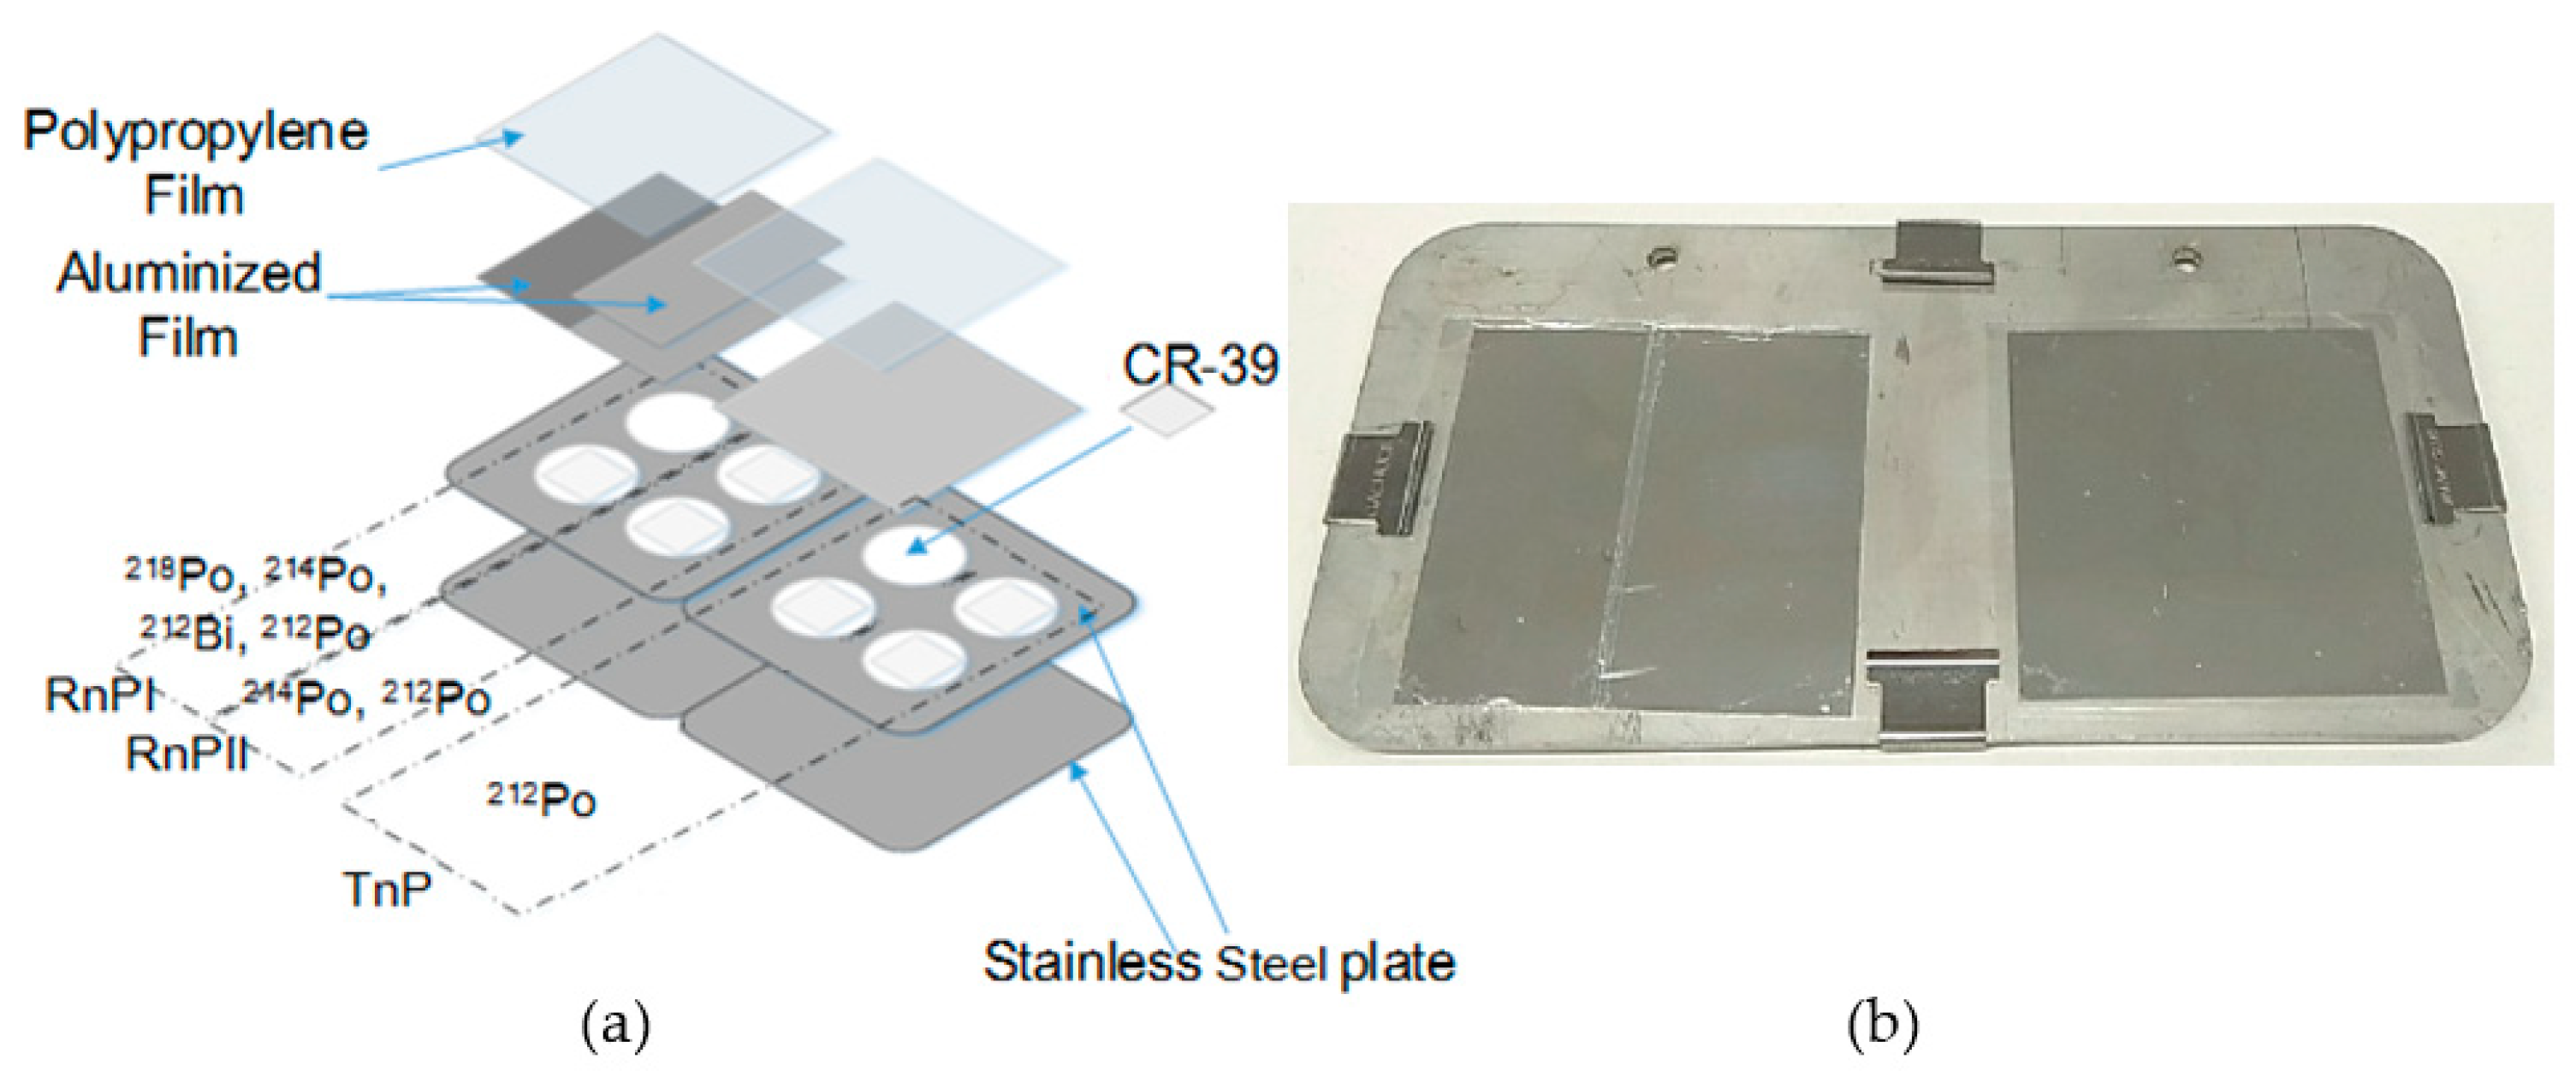
2.1. The Passive CR-39-Based Direct 222Rn/220Rn Progeny Detector

The structure of the detector is shown in Figure 1. The piece of commercially available ally diglycol carbonate (CR-39) (the BARYOTRAK, produced by Fukuvi Chemical Industry Co., Ltd., Fukui, Japan) was used as a detecting material to measure alpha particles emitted from 222Rn and 220Rn progeny. Each detection channel was mounted with a different thickness of aluminum-vaporized polyethylene films (Mylar films), which can only detect the alpha particles emitted from corresponding progeny radionuclides and ensure that lower energy alpha emissions (from the gases and other airborne alpha emitters) do not pass through the absorber. In the conventional passive direct 222Rn/220Rn progeny detector, there are only 2 detecting channels: the 220Rn progeny (TnP) channel and the 222Rn progeny (RnPII) channel. The TnP channel can only detect the 8.78 MeV alpha particles emitted from 212Po atoms, which are formed from the decay of 212Pb and 212Bi atoms deposited on the film surface without any interference from other alpha emissions of natural radioactivity decay series. The RnPII channel selectively detects 212Po and 214Po (7.69 MeV) from the decay of surface deposited 222Rn and 220Rn progeny. In the improved passive detector, we added one more detecting channel RnPI to detect the alpha emission energy higher than that of 218Po (6.0 MeV). The design information is present in Table 1. Since the RnPI and RnPII cthannels are in a mixed 222Rn and 220Rn progeny environment, there are interferences from the high energy alpha particles, which could be subtracted using the tracks on the TnP channel. Therefore, 4 slices of CR-39 detector are used on the TnP channel instead of 2 slices on the other channels to decrease the error.

2.2. The Theoretical Model and Parameters

2.2.1. Theoretical Model

Among the several aspects of indoor behaviors of 222Rn and 220Rn, apart from the decay losses, deposition and ventilation are two major mechanisms to remove the decay products from indoor air. Unlike the removal process by ventilation which depends essentially on the air exchange rate in a given room environment, the removal by deposition depends on the activity size distribution and the structure of turbulence at the air–surface interface. Since this detector is designed using the deposition mode, it is necessary to avoid uncontrolled static charges from affecting the deposition rates. Hence, the aluminized side of the Mylar is chosen to act as the deposition surface.
To describe the behavior of 222Rn and 220Rn progeny, the relationship between the attached 222Rn and 220Rn progeny deposition flux, J (atom cm−2 s−1), and track density, N (tracks cm−2) can be expressed as follows:
J = N η t
where η is the track registration efficiency, which is the multiplier of the branching ratio of its progeny, the geometric efficiency, and etching efficiency. For each channel, the geometric efficiency depends on the energies of incident α-particle, incident angles against the absorbers, and the thickness of the absorbers. The track registration efficiency measured in this study is present in Table 1, which corresponds to the etching condition using 6 N NaOH solutions at 60 °C for 24 h without stirring. t is the exposure period (s).
The effective deposition velocity of the progeny, Ve (cm s−1), is defined as follows:
V e = J C
where C is the atom concentration of the progeny (atom cm−3).
To determine the deposited progeny atoms from the alpha tracks registered in CR-39, we need to check the progeny atoms’ ultimate decay on the surface of the detector, which causes the alpha track to the CR-39. In the case of 222Rn progeny, a fraction of all the alpha particles emitted from the atoms of 218Po, 214Pb, and 214Bi deposited on the absorber can form tracks on the CR-39. Therefore, the tracks counted at the end can be directly proportional to the sum of the 218Po, 214Pb, and 214Bi atoms deposited. Similarly, the total tracks registered by the 220Rn progeny will be proportional to the sum of the 212Pb and 212Bi atoms deposited. Accordingly, we can define the following:
N T n = η T n , P o 212 · V e , T n · C P b 212 + C B i 212 · t
N R n 2 = η R n 2 , P o 212 · V e , T n · C P b 212 + C B i 212 · t + η R n 2 , P o 214 · V e , R n · C P o 218 + C P b 214 + C B i 214 · t
N R n 1 = η R n 1 , P o 212 · V e , T n · C P b 212 + C B i 212 · t + η R n 1 , P o 214 · V e , R n · C P o 218 + C P b 214 + C B i 214 · t                       + η R n 1 , B i 212 · V e , T n · C P b 212 + C B i 212 · t + η R n 1 , P o 218 · V e , R n , P o 218 · C P o 218 · t
where the subscripts of Tn, Rn1, and Rn2 mean the parameters of the TnP channel, RnPI channel, and RnPII channel, respectively, and the subscript of each radionuclide means the corresponding parameter. Some of the parameters used in this study are shown in Table 1. Ve,Tn is the effective deposition velocity of 220Rn progeny, which is a combination of deposition velocities of 212Pb and 212Bi. Ve,Rn is a combination of deposition velocities of 218Po, 214Pb, and 214Bi. Ve,Rn,Po218 is the only effective deposition velocity of 218Po.
In the mixed 222Rn and 220Rn environment, we can easily count the registered tracks on the TnP channel from 212Po decay, which come from the decay of the deposition flux of 212Pb and 212Bi, as shown in Equation (6). Accordingly, from Equations (3)–(5), we can also calculate the counts of registered tracks from 214Po on the RnPII channel and 218Po on the RnPI channel as in Equations (7) and (8).
N P o 212 T n P = η T n , P o 212 · V e , T n · C P b 212 + C B i 212 · t = N T n  
N P o 214 R n P 2 = η R n 2 , P o 214 · V e , R n · C P o 218 + C P b 214 + C B i 214 · t = N R n 2 η R n 2 , P o 212 η T n , P o 212 N T n
N P o 218 R n P 1 = η R n 1 , P o 218 · V e , R n , P o 218 · C P o 218 · t = N R n 1 ( η R n 1 , P o 212 + η R n 1 , B i 212 ) η T n , P o 212 N T n η R n 1 , P o 214 η R n 2 , P o 214 N P o 214 R n P 2
In the atmosphere, a large fraction of 218Po and 212Pb can react with the ions in the air and form clusters in a short time by the neutralization process. Due to the larger diffusion coefficient of these cluster particles, 222Rn and 220Rn progenies can attach themselves to various surfaces, such as the surfaces of aerosol particles and droplets in the atmosphere, thereby giving rise to a consecutive activity size distribution. This distribution is broadly classified into two groups: the unattached fraction and the attached fraction. The effective deposition velocities combine the contribution from both the unattached and attached fractions of each progeny species. Considering the contributions of these two fractions, the deposition velocity of each radionuclide can be demonstrated as follows:
V i = p i · V d u + 1 p i · V d a
where pi denotes the unattached fraction of radionuclide i, and V d u and V d a denote the deposition velocities of the unattached and attached fraction of airborne particles, respectively, which are dependent on the aerodynamic factors instead of the radionuclides themselves.
Since the registered tracks from 212Po decay come from the decay of the deposition flux of 212Pb and 212Bi, according to the concept of the effective deposition velocity, the deposition velocity of TnP channel could be written as follows:
V e , T n = V P b 212 · C P b 212 + V B i 212 · C B i 212 C P b 212 + C B i 212
Similarly, the deposition velocity of the RnPII and RnPI channels could be written as follows:
V e , R n = V P o 218 · C P o 218 + V P b 214 · C P b 214 + V B i 214 · C B i 214 C P o 218 + C P b 214 + C B i 214
V e , R n , P o 218 = V P o 218
The atom concentrations in these equations could also be reexpressed in terms of the activity concentrations (Ai, Bq m−3) by using the decay constant λi, s−1. Subsequently, Equations (6)–(8) could be modified as follows:
N P o 212 T n P = η T n , P o 212 · V P b 212 · λ B i 212 + V B i 212 · λ P b 212 · r 3 λ B i 212 + λ P b 212 · 1 λ P b 212 + r 3 λ B i 212 · A P b 212 · t
where r3 = ABi212/APb212.
N P o 214 R n P 2 = η R n 2 , P o 214 · V P o 218 · λ P b 214 · λ B i 214 + V P b 214 · λ P o 218 · λ B i 214 · r 1 + V B i 214 · λ P o 218 · λ P b 214 · r 2 λ P b 214 · λ B i 214 + λ P o 218 · λ B i 214 · r 1 + λ P o 218 · λ P b 214 · r 2 · 1 λ P o 218 + r 1 λ P b 214 + r 2 λ B i 214 · A P o 218 · t
where r1 = APb214/APo218 and r2 = ABi214/APo218.
N P o 218 R n P 1 = η R n 1 , P o 218 · V P o 218 · A P o 218 λ P o 218 · t
To solve these equations above, we introduced the Jacobi room model [16] for both 222Rn and 220Rn. Because the steady-state Jacobi room model is a system of linear equations, the number of unknowns, such as the unattached fractions of each progeny radionuclide and the ratios of the progeny concentration, is less than the number of equations. The solutions of the unknowns could be deduced by the parameters in the Jacobi room model, which are the attachment rate constant, λa (s−1); the rate constant for deposition of unattached progeny, λdu (s−1); the rate constant for deposition of attached progeny, λda (s−1); and the ventilation rate constant, λv (s−1). The details of the equations of the Jacobi room model for both 222Rn and 220Rn behaviors could be found elsewhere [6]. Finally, the APb212 can be solved by the data of the TnP channel and APo218 can be solved by both the RnPI channel and RnPII channel in the equations.

2.2.2. Parameters Estimation

Deposition Velocity

In the theoretical model, Lai and Nazaroff’s [17] three-layer model was adopted to simulate the particle deposition. Compared to the other existing formulations of such models based on the pioneering work of Corner and Pendlebury [18], lacking a thorough physical foundation, the proposed model involves three mechanisms of particle transport: Brownian diffusion, turbulent diffusion, and gravitational settling. It predicts deposition to smooth surfaces as a function of particle size and density. Therefore, the only required input parameters are enclosure geometry and friction velocity. This deposition velocity estimation method has already been applied for deposition particles in a room and experimentally verified by Mishra et al. [15].

Parameters in the Jacobi Room Model

In practice, the indoor rooms can be regarded as a rectangular cavity. The rate constant for deposition in the Jacobi room model is estimated by using the deposition velocity calculated by Lai and Nazaroff’s three-layer model [17]. For the rectangular cavity, the rate constant for deposition can be written as follows:
λ d i = n c · v d , u i S u + v d , v i S v + v d , d i S d V
where the superscript i, with the allowed values a and u, allows us to distinguish the two important states of 222Rn and 220Rn progeny: attached and unattached. Su, Sv, and Sd are the areas of upward-facing surfaces, vertical surfaces, and downward-facing surfaces, respectively; and nc is the correction coefficient of the surface area [19], which can be used to correct the changes of ratio caused by the increased furnishing surface area in practical application. The deposition velocity of the unattached fraction was interpolated by the result of the numerical integration for fine particles in the reference [17].
The rate constant for attachment in the Jacobi room model reflects the attachment velocity of the unattached 222Rn and 220Rn progeny to the ambient aerosol. The charging process depends on the electric charge distribution of an aerosol in steady state. In most used theories, attachment is diffusion-controlled as a result of electrostatic attraction and follows the gas kinetic laws [20,21,22]. The expression of the rate constant for attachment can be written as follows:
λ a = β ¯ · N o
β ¯ = 0 β d p Z d p d d p
where No is the aerosol concentration, reflecting the concentration of condensation nuclei and where Z(dp) is the number size distribution of aerosol for unit aerosols concentration and can be described as a frequency function of the lognormal distribution with the count median diameter (CMD) and geometric standard deviation (GSD, σg). β(dp) is the attachment coefficient. The rate constant for attachment was estimated by the compound trapezoid formula with the Latin-hypercube sampling method.

3. Results and Discussion

3.1. The Comparison of Chamber Test with a Theoretical Model

To verify the feasibility of measuring the EEC, a verification experiment was conducted in 222Rn and 220Rn exposure chambers located in Hirosaki University, Japan. The chamber verification system includes 4 function cells, as shown in Figure 2. (1) The source generation cell is a 222Rn gas and 220Rn gas generation system, which employs the natural uranium rock and commercially available lantern mantles as the 222Rn and 220Rn sources, respectively, to generate and import 222Rn and 220Rn to the mix chamber. The humidifier in this cell is responsible for maintaining the stability of the inlet gas concentration. (2) The aerosol generation cell contains 3 components, a compressor, a constant output atomizer (TSI, Inc., Aerosol Generator Model 3076), and a diffusion dryer filled with silica gel. The 5000 μg mL−1 NaCl solution is employed to generate droplets with the median diameter of 0.3 μm (GSD < 2.0) to mix with 222Rn gas or 220Rn gas in the mix chamber. (3) The exposure cell includes two chambers: a mix chamber and an exposure chamber. The volumes of the mix chamber and exposure chamber are 150 L and 3.24 m3 (dimensions of 2.25 × 1.2 × 1.2 m3, L × W × H), respectively. The mix chamber provides a buffer to create more chances for the aerosol particles and gas to form a stable progeny flux to the exposure chamber. To maintain stable concentration in the exposure chamber, the experiment adopted a circulating connection that applies the outlet of the exposure chamber as the inlet of the source generation cell with an airflow rate of 3 L min−1. (4) The measurement cell is responsible for measuring progeny concentrations and environmental parameters in the verification experiment. The portable Si-photodiode detector with a sampling flow rate of 0.5 L min−1 and an EMD Millipore MF-Millipore AAWG02500 Mixed Cellulose Ester Filter Membrane were used to measure the EEC of 222Rn in real-time. The details of the Si-photodiode detector can be found elsewhere [23,24]. The periodic grab sampling method was carried out to replace the portable Si-photodiode detector to measure the EEC of 220Rn. The Model 3034 SMPSTM Scanning Mobility Particle Sizer produced by TSI® was adopted to measure the concentration of condensation nuclei, CMD, and its GSD (σg). The concentration of condensation nuclei in the exposure chamber ranged from 2.05 × 10⁴ to 4.32 × 10⁴ particles per cm3. The CMD of the aerosol in the exposure chamber ranged from 0.187 to 0.218 μm. The friction velocity was calculated using a fan-turbulence model [11,25], as follows:
u * = N s d t 2 V 1 / 3
where Ns is the rotation speed of the fan (2300 rotation min−1), dt is the blade length for rotation (5 cm), and V is the volume of the exposure chamber. In this exposure chamber, we set two fans in opposite directions; as a result, we obtained u* as 23.53 cm s−1. In the verification experiment, each channel had 4 slices of CR-39 in the vertical and upward orientations as one group. For the total verification experiment, each exposure period had 3 groups of progeny detectors in the front, middle, and back of the bottom of the exposure chamber. In the theoretical model, the genetic algorithm is adopted to optimize the parameters in the calculation process. The measured values of the concentration of nuclei condensation number, CMD and its GSD, estimated friction velocity, and ventilation rate are the input parameters. Since the friction velocity, ventilation rate, and particle distribution fluctuate and change all the time, the equilibrium value of each parameter during the exposure period should be optimized depending on the different circumstances for each survey.
A genetic algorithm with an improved goodness-of-fit objective function was adopted to optimize the results of the theoretical method [26]. The improved genetic algorithm was used to maximize the goodness-of-fit objective function f(x) as follows:
f x = i = 1 n ω i i = 1 n x 1 , i x 2 , i x i ¯ · ω i
where n is the number of objects of the model; x1,i, and x2,i are the measured data from actual measurement of EEC; and ωi is the weight. The measured ranges of the concentration of nuclei condensation number, CMD, and its GSD are the optimized parameters, and the goodness-of-fit function is carried out to decrease the error of the average EEC of 222Rn calculated by the calibrated portable Si-photodiode detector and the CR-39-based progeny detector. The average track density of detectors deployed in the upward and vertical orientations was used to calculate the EEC of 222Rn by the progeny detector, which is in the same orientation as that placed in use. The same verification experiment was also conducted for 220Rn progeny except for the measurement method for the EEC of 220Rn, which used the periodic grab sampling method to replace the portable Si-photodiode detector. The comparison results of the progeny detector and experiment are shown in Table 2 and Table 3. In the calculation, we estimated the deposition velocity of total condensation nuclei in the vertical and upward orientations, which were in the same orientation as the setting in the experiment, and the total deposition velocity and deposition flux of each channel. As shown in Table 2, for the 220Rn progeny with an exposure time of 36.9 h, the average experimentally estimated deposition velocities in the upward and vertical orientations were 0.193 ± 0.067 and 0.217 ± 0.045 m h−1, respectively. Additionally, the model-simulated deposition velocities were 0.243 and 0.238 m h−1, respectively, which were located in the ranges of the experimental data. In the experiment, the deposition velocity in the upward orientation presented insignificant variation with that of the vertical orientation. The exposure time also presented an insignificant influence on the deposition velocity between 25.5 and 36.9 h. For deposition flux, the variation of deposition flux on the TnP channel estimated by the model showed excellent agreement with experimental values. As shown in Table 3, for the 222Rn progeny, among distinct exposure times of 30, 70, and 102 h, the calibrated deposition velocities varied narrowly in the upward and vertical orientations, with the ranges of 0.123–0.136 and 0.117–0.131 m h−1, respectively. The average deposition fluxes in the theoretical model of 222Rn progeny on the RnPII channel and of 218Po on the RnPI channel were located in the ranges of the experimental values in most cases. The deposition flux was calculated by the net track density (NTD). The calculation process of NTD itself has uncertainty, especially caused by the sensitivity of the CR-39 detector, read-out of the tracks, counting statistics, and assumed background of the CR-39 detectors [11], except for the exposure environment. Additionally, from Equations (6)–(8), the calculation of the tracks registered by lower alpha-energy progeny should exclude the tracks registered by higher alpha- energy progeny on the channel. Therefore, with a thinner absorber filter, a higher uncertainty of the measured deposition flux is present due to propagations of the uncertainty during the calculation of the NTD.

3.2. Comparison of the Estimated Deposition Velocities with Previous Studies

Compared with the deposition velocities of the total 222Rn and 220Rn progeny of the other researchers [7,11,15,27], as shown in Table 4, these values varied widely from 0.117 to 8.64 m h−1 and 0.072 to 19.08 m h−1, respectively. To analyze the impact factors of the deposition velocity of 222Rn and 220Rn progenies, except the deposition velocities measured by Bigu [25], other deposition velocities measured in small-size chambers are much higher than that measured in the test rooms, dwellings, or large-size chambers. This can be explained by the turbulence, caused by the surface roughness, friction velocity, and airflow rate on the surface in a small-size chamber, being much more intense than that in a large room. Similarly, in Bigu’s research, the mixing fan was operated to investigate the effect of strong airflow and turbulence on the deposition velocity [24]. When the fan is on, the surface airflow and turbulence would be more intense, accompanying the increasing deposition velocity of the 222Rn and 220Rn progenies.
The design of TnP detectors from Zhuo and Iida [7] and Sorimachi et al. [11] are the same as that in the present study, and only the measuring environmental conditions are different. The deposition velocity measured in the small-size chamber [11] is significantly higher than that measured in dwellings [7] and the present study. It should be noted that the deposition velocity measured in this study agreed well with that measured in dwellings. Besides, the deposition velocities of the RnP detector measured by Marsh et al. [15] in the test room and dwelling were also comparable to that of the present study. Therefore, the deposition velocities estimated by both experiments and theoretical models are acceptable in this study. Furthermore, the calibration results from this study are suitable to assess the 222Rn and 220Rn progeny exposure in test rooms and dwellings.

3.3. The Relationship between NTD and Time-Integrated EEC

The relationship between the NTD and the time-integrated EEC of 222Rn and 220Rn is shown in Figure 3. Based on the concept of the potential alpha energy concentration of 222Rn and 220Rn progeny, the NTD caused by 212Po on the TnP channel can be used to estimate the total potential alpha energy of 212Po emitted by the deposited 212Pb and 212Bi. The detectors were exposed to a total of 220Rn progeny concentration of 83 ± 20 Bq m−3 during the exposure period from 0.2 to 2.5 d. The time-integrated EEC of 220Rn ranged from approximately 16 to 168 Bq m−3 d, which corresponded to the time-integrated EEC of 220Rn in an exposure period between 1 week to 3 months with the average EEC of ca. 2 Bq m−3 per day indoors [5]. The result demonstrated that the values of NTD increased linearly with an increase of time-integrated EEC of 220Rn. Accordingly, the NTD caused by 218Po on channel RnPI can be used to estimate the atom number of the deposited 218Po on the detector firstly decaying to 214Pb. Furthermore, the NTD of 214Po can be used to calculate the total potential alpha energy of 214Po emitted by the deposited 218Po, 214Pb, and 214Bi during the decay. Therefore, in Figure 3a, the energy-weighted NTD was calculated as follows:
Energy   weighted   NTD   =   ε P 218 o · NTD   of   P 218 o + ε P 214 o · NTD   of   P 214 o   ε P 218 o +   ε P 214 o
where ε (i) is the alpha energy of the radionuclide i emitted during the decay. ε(218Po) is 6.0 MeV, and ε (214Po) is 7.7 MeV. The progeny detectors were exposed to an average EEC of 222Rn of 685 ± 6 Bq m−3 during the exposure period. The time-integrated EEC of 222Rn ranged from approximately 863 to 2839 Bq m−3 d, which corresponds to the time-integrated EEC of 222Rn in an exposure period from 1 month to 3 months with an average EEC of 222Rn of ca. 30 Bq m−3 per day. As a result, the values of the three NTDs increased linearly with the increase of the time-integrated EEC of 222Rn. Thus, it is possible to estimate the EEC of 222Rn indoors during a certain period. To compare the three NTDs as a function of the time-integrated EEC of 222Rn, the R2 of NTD of 218Po, energy-weighted NTD, and NTD of 214Pb were successively decreased from 0.9861 to 0.5625. Therefore, compared to the other deposition-based passive 222Rn progeny detectors which only measure the NTD contributed by 214Po, the detector with two channels is much more reliable. Besides, the progeny detector with 4 slices of CR-39 for the TnP channel designed rather than the same slices of CR-39 for each channel is recommended to decrease the error in calculation.

4. Conclusions

In this study, a 3-channel passive CR-39-based direct 222Rn/220Rn progeny detector was developed and tested to measure and calculate the EEC of both 222Rn and 220Rn without the equilibrium factor. In the verification chamber experiment, the genetic algorithm was implemented to optimize the estimation result of the theoretical model. The optimized deposition fluxes of 220Rn progeny on the TnP channel, the 222Rn progeny on the RnPII channel, and 218Po on the RnPI channel agreed well with the experimental measurements. The EEC of 220Rn and 222Rn measured by the calibrated devices are comparable to the estimated value of the detector. Compared with the two channels’ detectors, the energy-weighted NTD is much more reliable to estimate the EEC of 222Rn rather than only measuring the NTD contributed by 214Po. Moreover, because the exposure conditions, especially the airflow and turbulence in the room, are smaller than that in the small-size chamber, the deposition velocity measured in this study is close to the value measured in the room. Therefore, a detector calibrated in a similar size to the chamber test as in this study is more reliable for assessment of 220Rn and 222Rn progeny exposure. At last, since the detector is sensitive to the exposure environmental condition, in the site survey, it is recommended to use the improved passive CR-39-based direct progeny detector after its calibration in a typical indoor environment.

Author Contributions

Conceptualization, J.H. and S.T.; data curation, J.H. and G.Y.; formal analysis, J.H. and G.Y.; funding acquisition, J.H. and S.T.; investigation, J.H.; methodology, J.H., C.K., and K.I.; project administration, S.T.; resources, M.H.; supervision, S.T.; writing—original draft, J.H.; writing—review and editing, G.Y. and S.T. All authors have read and agreed to the published version of the manuscript.

Funding

This research was funded by JSPS KAKENHI, grant numbers 16K15368, 18KK0261, 19J14291, and 20H00556.

Conflicts of Interest

The authors declare no conflict of interest.

References

  1. Tokonami, S.; Takahashi, H.; Kobayashi, Y.; Zhuo, W.; Hulber, E. Up-to-date radon-thoron discriminative detector for a large scale survey. Rev. Sci. Instrum. 2005, 76, 113505. [Google Scholar] [CrossRef]
  2. Eappen, K.; Mayya, Y. Calibration factors for LR-115 (type-II) based radon thoron discriminating dosimeter. Radiat. Meas. 2004, 38, 5–17. [Google Scholar] [CrossRef]
  3. Sciocchetti, G.; Sciocchetti, A.; Giovannoli, P.; DeFelice, P.; Cardellini, F.; Cotellessa, G.; Pagliari, M. A new passive radon-thoron discriminative measurement system. Radiat. Prot. Dosim. 2010, 141, 462–467. [Google Scholar] [CrossRef] [PubMed]
  4. Sahoo, B.; Sapra, B.; Kanse, S.; Gaware, J.; Mayya, Y. A new pin-hole discriminated 222Rn/220Rn passive measurement device with single entry face. Radiat. Meas. 2013, 58, 52–60. [Google Scholar] [CrossRef]
  5. Guo, Q.; Iida, T.; Okamoto, K.; Yamasaki, T. Measurements of thoron concentration by passive cup method and its application to dose assessment. J. Nucl. Sci. Technol. 1995, 32, 794–803. [Google Scholar] [CrossRef]
  6. Hu, J.; Yang, G.; Hegedűs, M.; Iwaoka, K.; Hosoda, M.; Tokonami, S. Numerical modeling of the sources and behaviors of 222 Rn, 220 Rn and their progenies in the indoor environment—A review. J. Environ. Radioact. 2018, 189, 40–47. [Google Scholar] [CrossRef]
  7. Zhuo, W.; Iida, T. Estimation of thoron progeny concentrations in dwellings with their deposition rate measurements. Jpn. J. Health Phys. 2000, 35, 365–370. [Google Scholar] [CrossRef] [Green Version]
  8. Tokonami, S.; Sun, Q.; Yonehara, H.; Yamada, Y. A Simple Measurement Technique of the Equilibrium Equivalent Thoron Concentration with a CR-39 Detector. Jpn. J. Health Phys. 2002, 37, 59–63. [Google Scholar] [CrossRef] [Green Version]
  9. Zhuo, W.; Tokonami, S. Convenient methods for evaluation of indoor thoron progeny concentrations. Int. Congr. Ser. 2005, 1276, 219–220. [Google Scholar] [CrossRef]
  10. Tokonami, S. Why is 220Rn (thoron) measurement important? Radiat. Prot. Dosim. 2010, 141, 335–339. [Google Scholar] [CrossRef]
  11. Sorimachi, A.; Tokonami, S.; Kranrod, C.; Ishikawa, T. Preliminary Experiments Using a Passive Detector for Measuring Indoor 220Rn Progeny Concentrations with an Aerosol Chamber. Health Phys. 2015, 108, 597–606. [Google Scholar] [CrossRef] [PubMed]
  12. Hu, J.; Hosoda, M.; Tokonami, S. Parameter sensitivity analysis of the theoretical model of a CR-39-based direct 222Rn/220Rn progeny monitor. Nukleonika 2020, 65, 95–98. [Google Scholar] [CrossRef]
  13. Mishra, R.; Mayya, Y.S. Study of a deposition-based direct thoron progeny sensor (DTPS) technique for estimating equilibrium equivalent thoron concentration (EETC) in indoor environment. Radiat. Meas. 2008, 43, 1408–1416. [Google Scholar] [CrossRef]
  14. L’Annunziata, M.F. Handbook of Radioactivity Analysis: Radiation Physics and Detectors, 4th ed.; Academic Press: Cambridge, MA, USA, 2020; pp. 318–332. [Google Scholar]
  15. Mishra, R.; Mayya, Y.; Kushwaha, H. Measurement of 220Rn/222Rn progeny deposition velocities on surfaces and their comparison with theoretical models. J. Aerosol Sci. 2009, 40, 1–15. [Google Scholar] [CrossRef]
  16. Jacobi, W. Activity and potential α-energy of 222Rn and 220Rn-daughters in different air atmospheres. Health Phys. 1972, 22, 441–450. [Google Scholar] [CrossRef] [PubMed]
  17. Lai, A.C.K.; Nazaroff, W.W. Modeling indoor particle deposition from turbulent flow onto smooth surfaces. J. Aerosol Sci. 2000, 31, 463–476. [Google Scholar] [CrossRef]
  18. Corner, J.; Pendlebury, E.D. The coagulation and deposition of a stirred aerosol. Proc. Phys. Soc. B 1951, 64, 645–654. [Google Scholar] [CrossRef]
  19. Porstendörfer, J. Behaviour of radon daughter products in indoor air. Radiat. Prot. Dosim. 1984, 7, 107–113. [Google Scholar] [CrossRef]
  20. Porstendörfer, J.; Röbig, G.; Ahmed, A. Experimental determination of the attachment coefficients of atoms and ions on monodisperse. J. Aerosol Sci. 1979, 10, 21–28. [Google Scholar] [CrossRef]
  21. Porstendörfer, J. Radon: Measurements related to dose. Environ. Int. 1996, 22, 563–583. [Google Scholar] [CrossRef]
  22. Stevanovic, N.; Markovic, V.M.; Nikezic, D. Relationship between deposition and attachment rates in Jacobi room model. J. Environ. Radioact. 2010, 101, 349–352. [Google Scholar] [CrossRef] [PubMed]
  23. Tokonami, S.; Ichiji, T.; Iimoto, T.; Kurosawa, R. Calculation procedure of potential alpha energy concentration with continuous air sampling. Health Phys. 1996, 71, 937–943. [Google Scholar] [CrossRef] [PubMed]
  24. Tamakuma, Y.; Yamada, R.; Iwaoka, K.; Hosoda, M.; Kuroki, T.; Mizuno, H.; Yamada, K.; Furukawa, M.; Tokonami, S. A portable radioactive plume monitor using a silicon photodiode. Perspect. Sci. 2019, 12, 100414. [Google Scholar] [CrossRef]
  25. Shimada, M.; Okuyama, K.; Kousaka, Y.; Seinfeld, J.H. A model calculation of particle deposition onto a rough wall by Brownian and turbulent diffusion. J. Colloid Interface Sci. 1988, 125, 198–211. [Google Scholar] [CrossRef]
  26. Hu, J.; Sun, L.; Li, C.H.; Wang, X.; Jia, X.L.; Cai, Y.P. Water quality risk assessment for the Laoguanhe River of China using a stochastic simulation method. J. Environ. Inform. 2018, 31, 123–136. [Google Scholar] [CrossRef]
  27. Bigu, J. Radon daughter and thoron daughter deposition velocity and unattached fraction under laboratory-controlled conditions and in underground uranium mines. J. Aerosol Sci. 1985, 16, 157–165. [Google Scholar] [CrossRef]
Figure 1. The passive CR-39-based direct 222Rn/220Rn progeny detector: (a) a schematic diagram of the progeny detector showing the detectable radionuclides of each channel and (b) a photo of the actual setup of the progeny detector.
Ijerph 17 08569 g001
Figure 2. A schematic diagram of the chamber verification system.
Ijerph 17 08569 g002
Figure 3. The net track density (NTD) as a function of time-integrated equilibrium equivalent concentration (EEC): (a) the NTD as a function of time-integrated EEC of 222Rn, where the NTD has excluded the contribution of other radionuclides on the CR-39, and (b) the NTD as a function of time-integrated EEC of 220Rn.
Ijerph 17 08569 g003
Table 1. The design information of each detector channel.
ChannelMembrane Thickness
(mg cm−2)
NuclideEnergy of α-Particle
(MeV)
Track Registration Efficiency, ηDeposited Atoms
TnP7.10212Po8.7850.063212Pb, 212Bi
RnPII5.05212Po8.7850.212212Pb, 212Bi
214Po7.6870.182218Po, 214Pb, 214Bi
RnPI3.25212Po and 212Bi8.785 and 6.0510.152212Pb, 212Bi
214Po7.6870.249218Po, 214Pb, 214Bi
218Po6.0030.135218Po
Table 2. The comparison results of the progeny detector and experiment in a 220Rn chamber verification system.
ModelExperimentModelExperiment
Exposure time (h)25.536.9
The number concentration (N cm−3)27,29730,417
GSD, σg1.5061.613
CMD (μm)0.2030.203
Track density
(tr mm−2)
Upward3.92.9
Vertical4.34.8
Deposition velocity
(m h−1)
Upward0.1850.143 ± 0.0290.2430.193 ± 0.067
Vertical0.1690.158 ± 0.0400.2380.217 ± 0.045
212Pb0.185——0.219——
212Bi0.132——0.183——
Deposition flux
(atoms cm−2 s−1)
Upward0.0810.0810.0550.069
Vertical0.0900.0900.0420.042
EEC of 220Rn
(Bq m−3)
Upward237 ± 88244 ± 108 1148 ± 38155 ± 67 1
Vertical263 ± 88188 ± 50
1 The value was calculated by the average equilibrium equivalent concentration (EEC) of 220Rn over the whole exposure period by grab sampling method.
Table 3. The comparison results of the progeny detector and experiment in a 222Rn chamber verification system.
ModelExperimentModelExperimentModelExperiment
Exposure time (h)3070102
Concentration of nuclei number (N cm−3)34,52833,83333,278
GSD, σg1.7141.7611.768
CMD (μm)0.2330.2000.191
Track density
(tr mm−2)
UpwardRnPI6.3 ± 1.316.4 ± 2.514.9 ± 2.3
RnPII4.5 ± 1.26.2 ± 1.64.9 ± 1.1
VerticalRnPI7.4 ± 1.513.6 ± 2.117.2 ± 2.7
RnPII1.1 ± 0.87.1 ± 1.85.9 ± 1.3
Deposition velocity
(m h−1)
Upward0.136——0.123——0.125——
Vertical0.131——0.117——0.119——
218Po0.290——0.248——0.230——
214Pb0.155——0.135——0.112——
214Bi0.101——0.091——0.092——
Deposition flux
(atoms cm−2 s−1)
218Po to RnPIUpward0.0410.051 ± 0.0100.0220.048 ± 0.0170.0180.030 ± 0.016
Vertical0.043 ± 0.0090.040 ± 0.0140.035 ± 0.019
218Po, 214Pb, 214Bi to RnPIIUpward0.0140.005 ± 0.0040.0110.014 ± 0.0080.0080.007 ± 0.006
Vertical0.023 ± 0.0060.016 ± 0.0090.009 ± 0.007
EEC of 222Rn
(Bq m−3)
Upward1214 ± 322740 ± 27 1730 ±290693 ±16 1758 ± 370686 ± 31 1
Vertical267 ± 187603 ±312630 ± 375
1 The value was calculated by the average EEC of 222Rn over the whole exposure period by the continuous portable Si-photodiode detector.
Table 4. Summary of the deposition velocities of 222Rn and 220Rn progenies in previous studies.
ReferenceDeposition Velocity (m h−1)Remark
RnP DetectorTnP Detector
[27]8.6419.08Fan on, 26 m3 test facility
3.242.16Fan off, 26 m3 test facility
[7] 0.19 ± 0.04Dwelling, the same structure of TnP detector as this study
[15]0.132 ± 0.00360.075 ± 0.007222.5 m3 test room
2.37 ± 0.785 0.5 m3 chamber
0.1170.072Dwelling
[11] 0.828 ±0.072150 L chamber, same TnP detector as this study
This study0.125 ± 0.0070.178 ± 0.0453.24 m3 chamber
Publisher’s Note: MDPI stays neutral with regard to jurisdictional claims in published maps and institutional affiliations.

