Comparative Analysis of PM2.5-Bound Polycyclic Aromatic Hydrocarbons (PAHs), Nitro-PAHs (NPAHs), and Water-Soluble Inorganic Ions (WSIIs) at Two Background Sites in Japan


 , ,
, ,  ,
,
Abstract

1. Introduction
2. Materials and Methods
2.1. PM2.5 Sampling
2.2. PAH, NPAH, and WSII Analysis
2.3. Data Analysis
3. Results
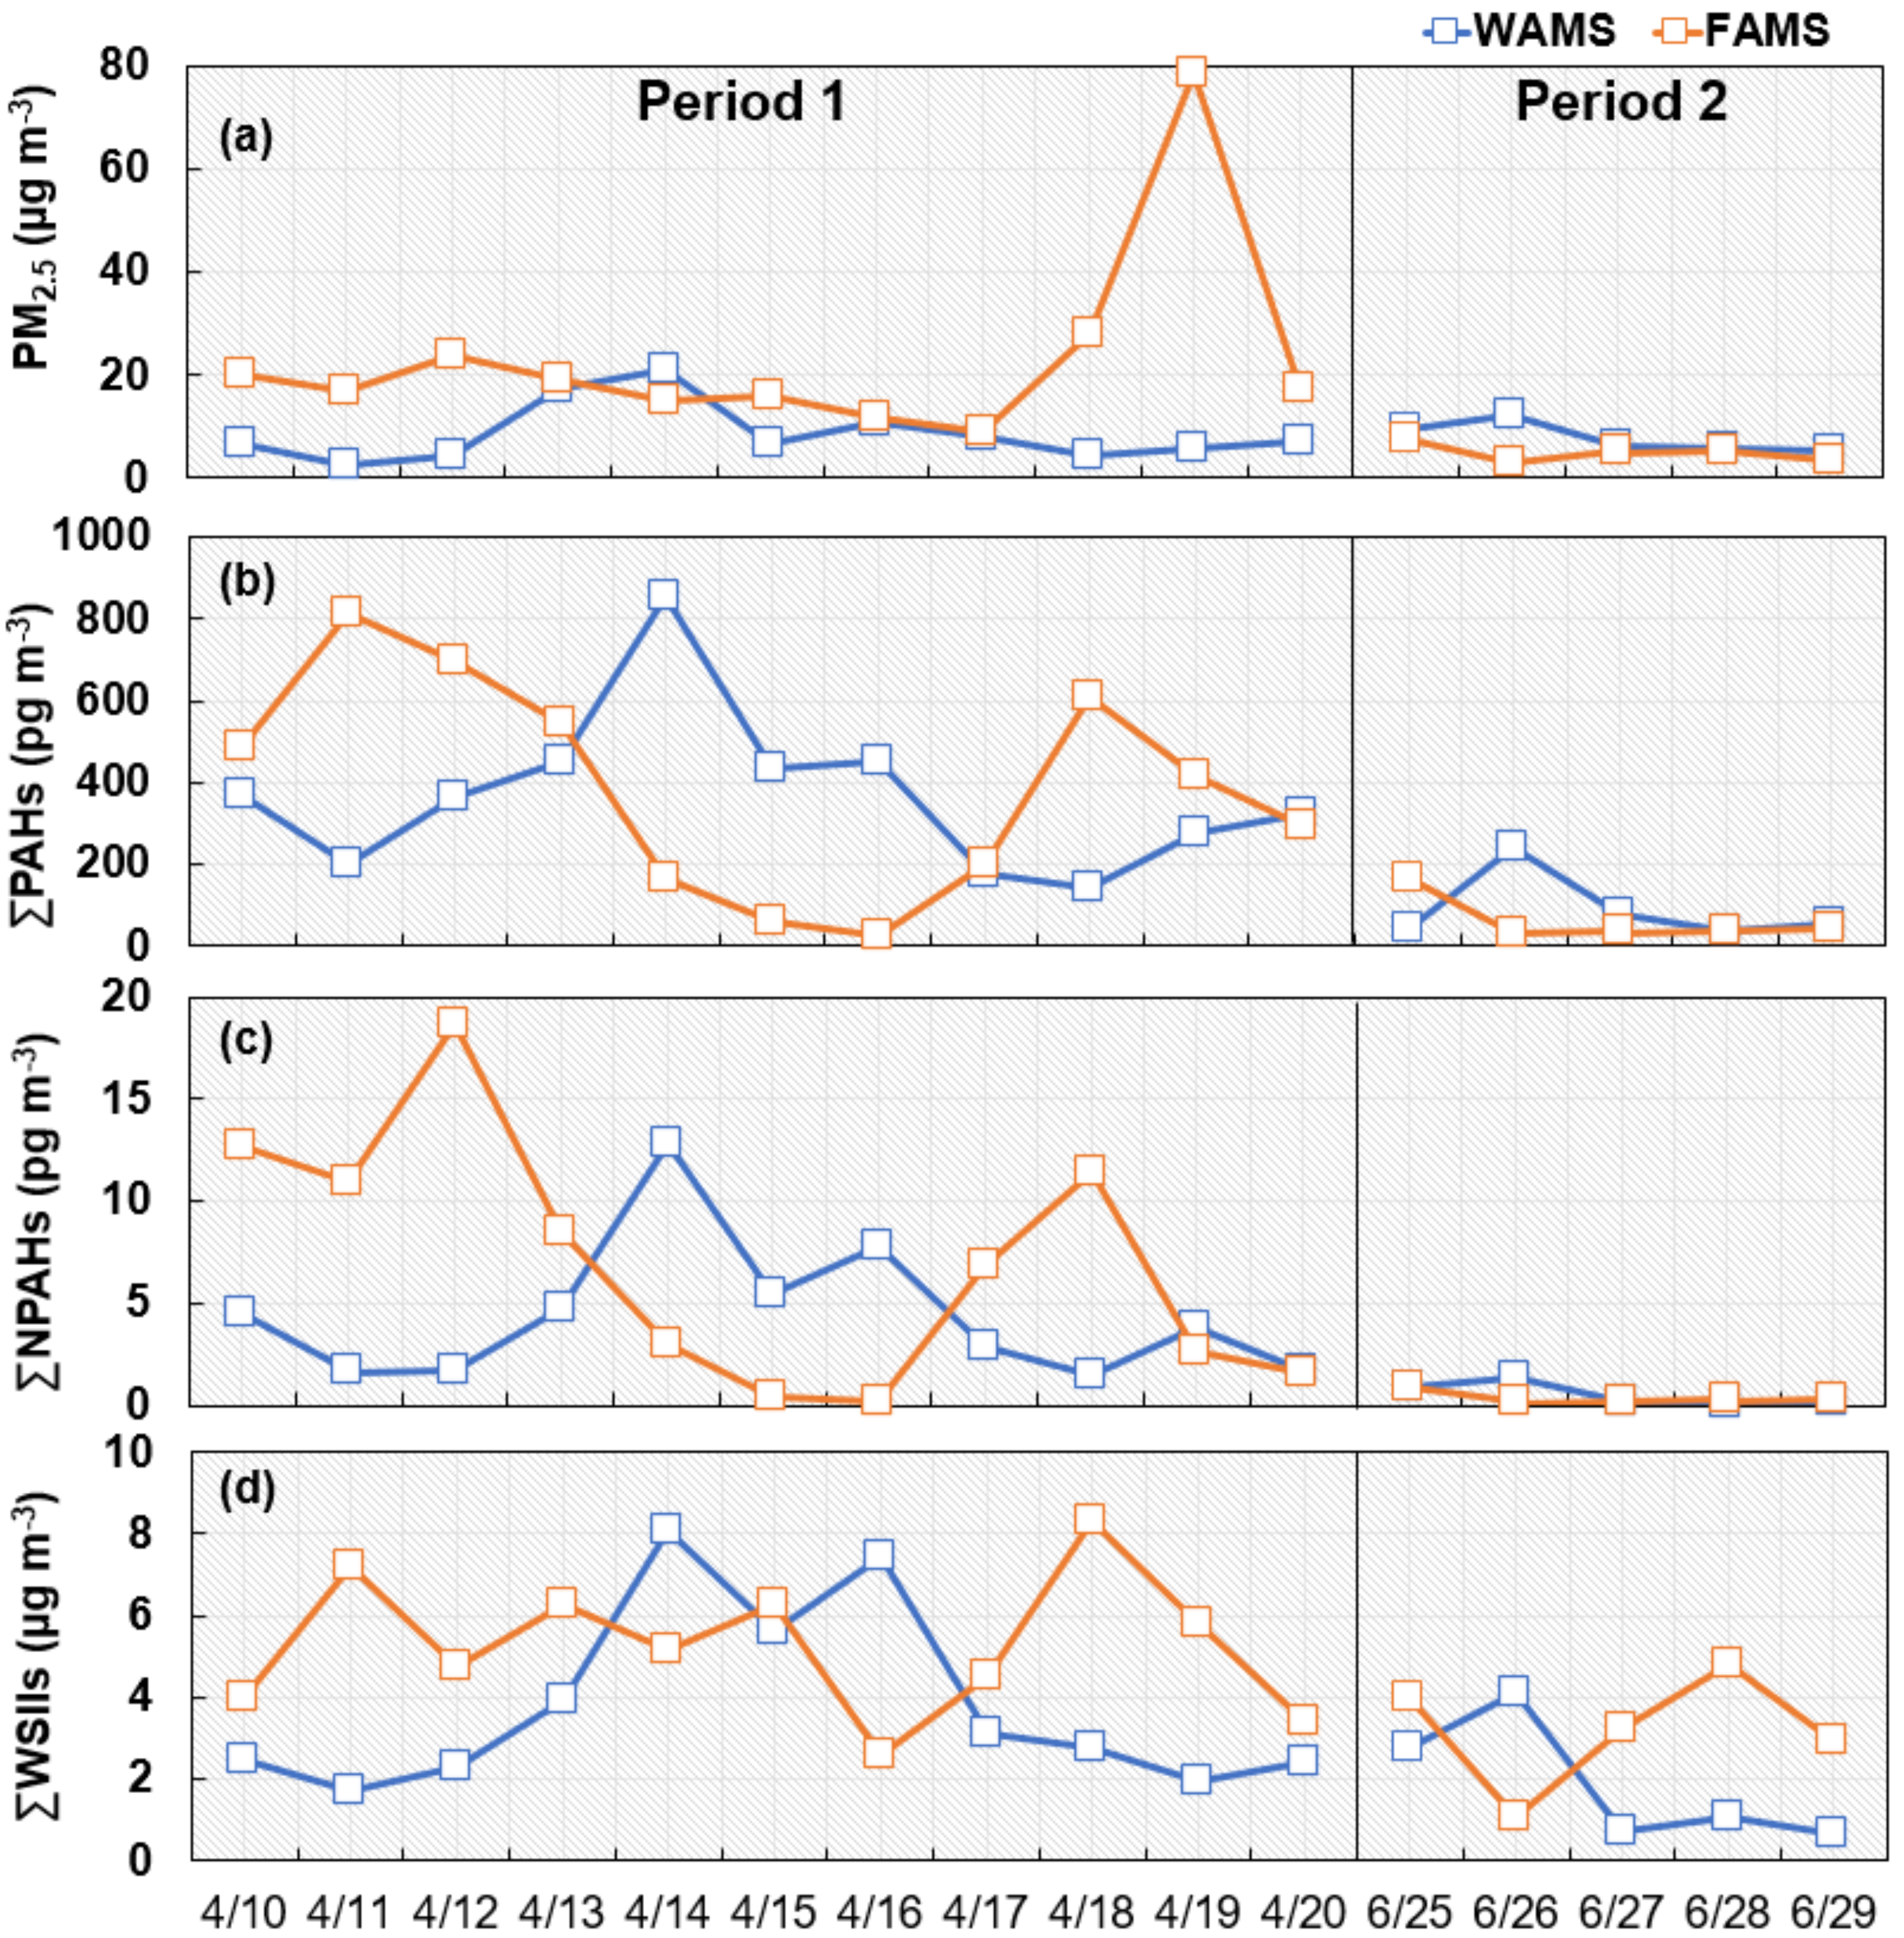
3.1. Concentrations
3.2. Compositions
4. Discussion
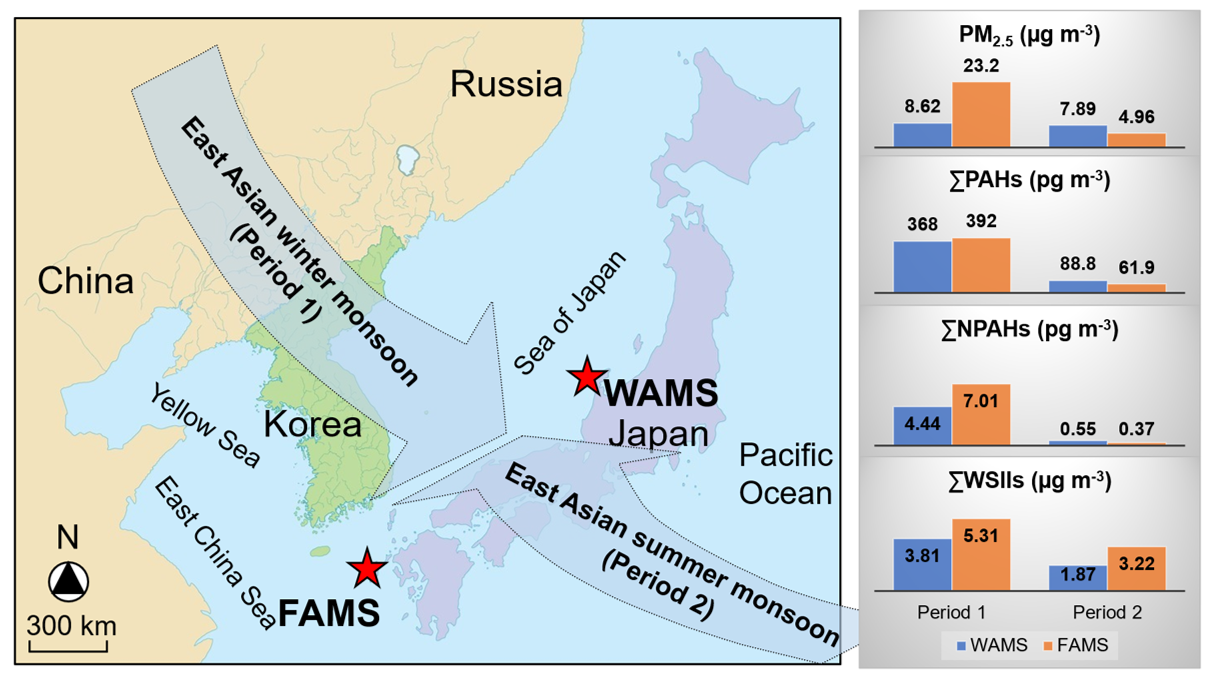
4.1. Meteorological Conditions
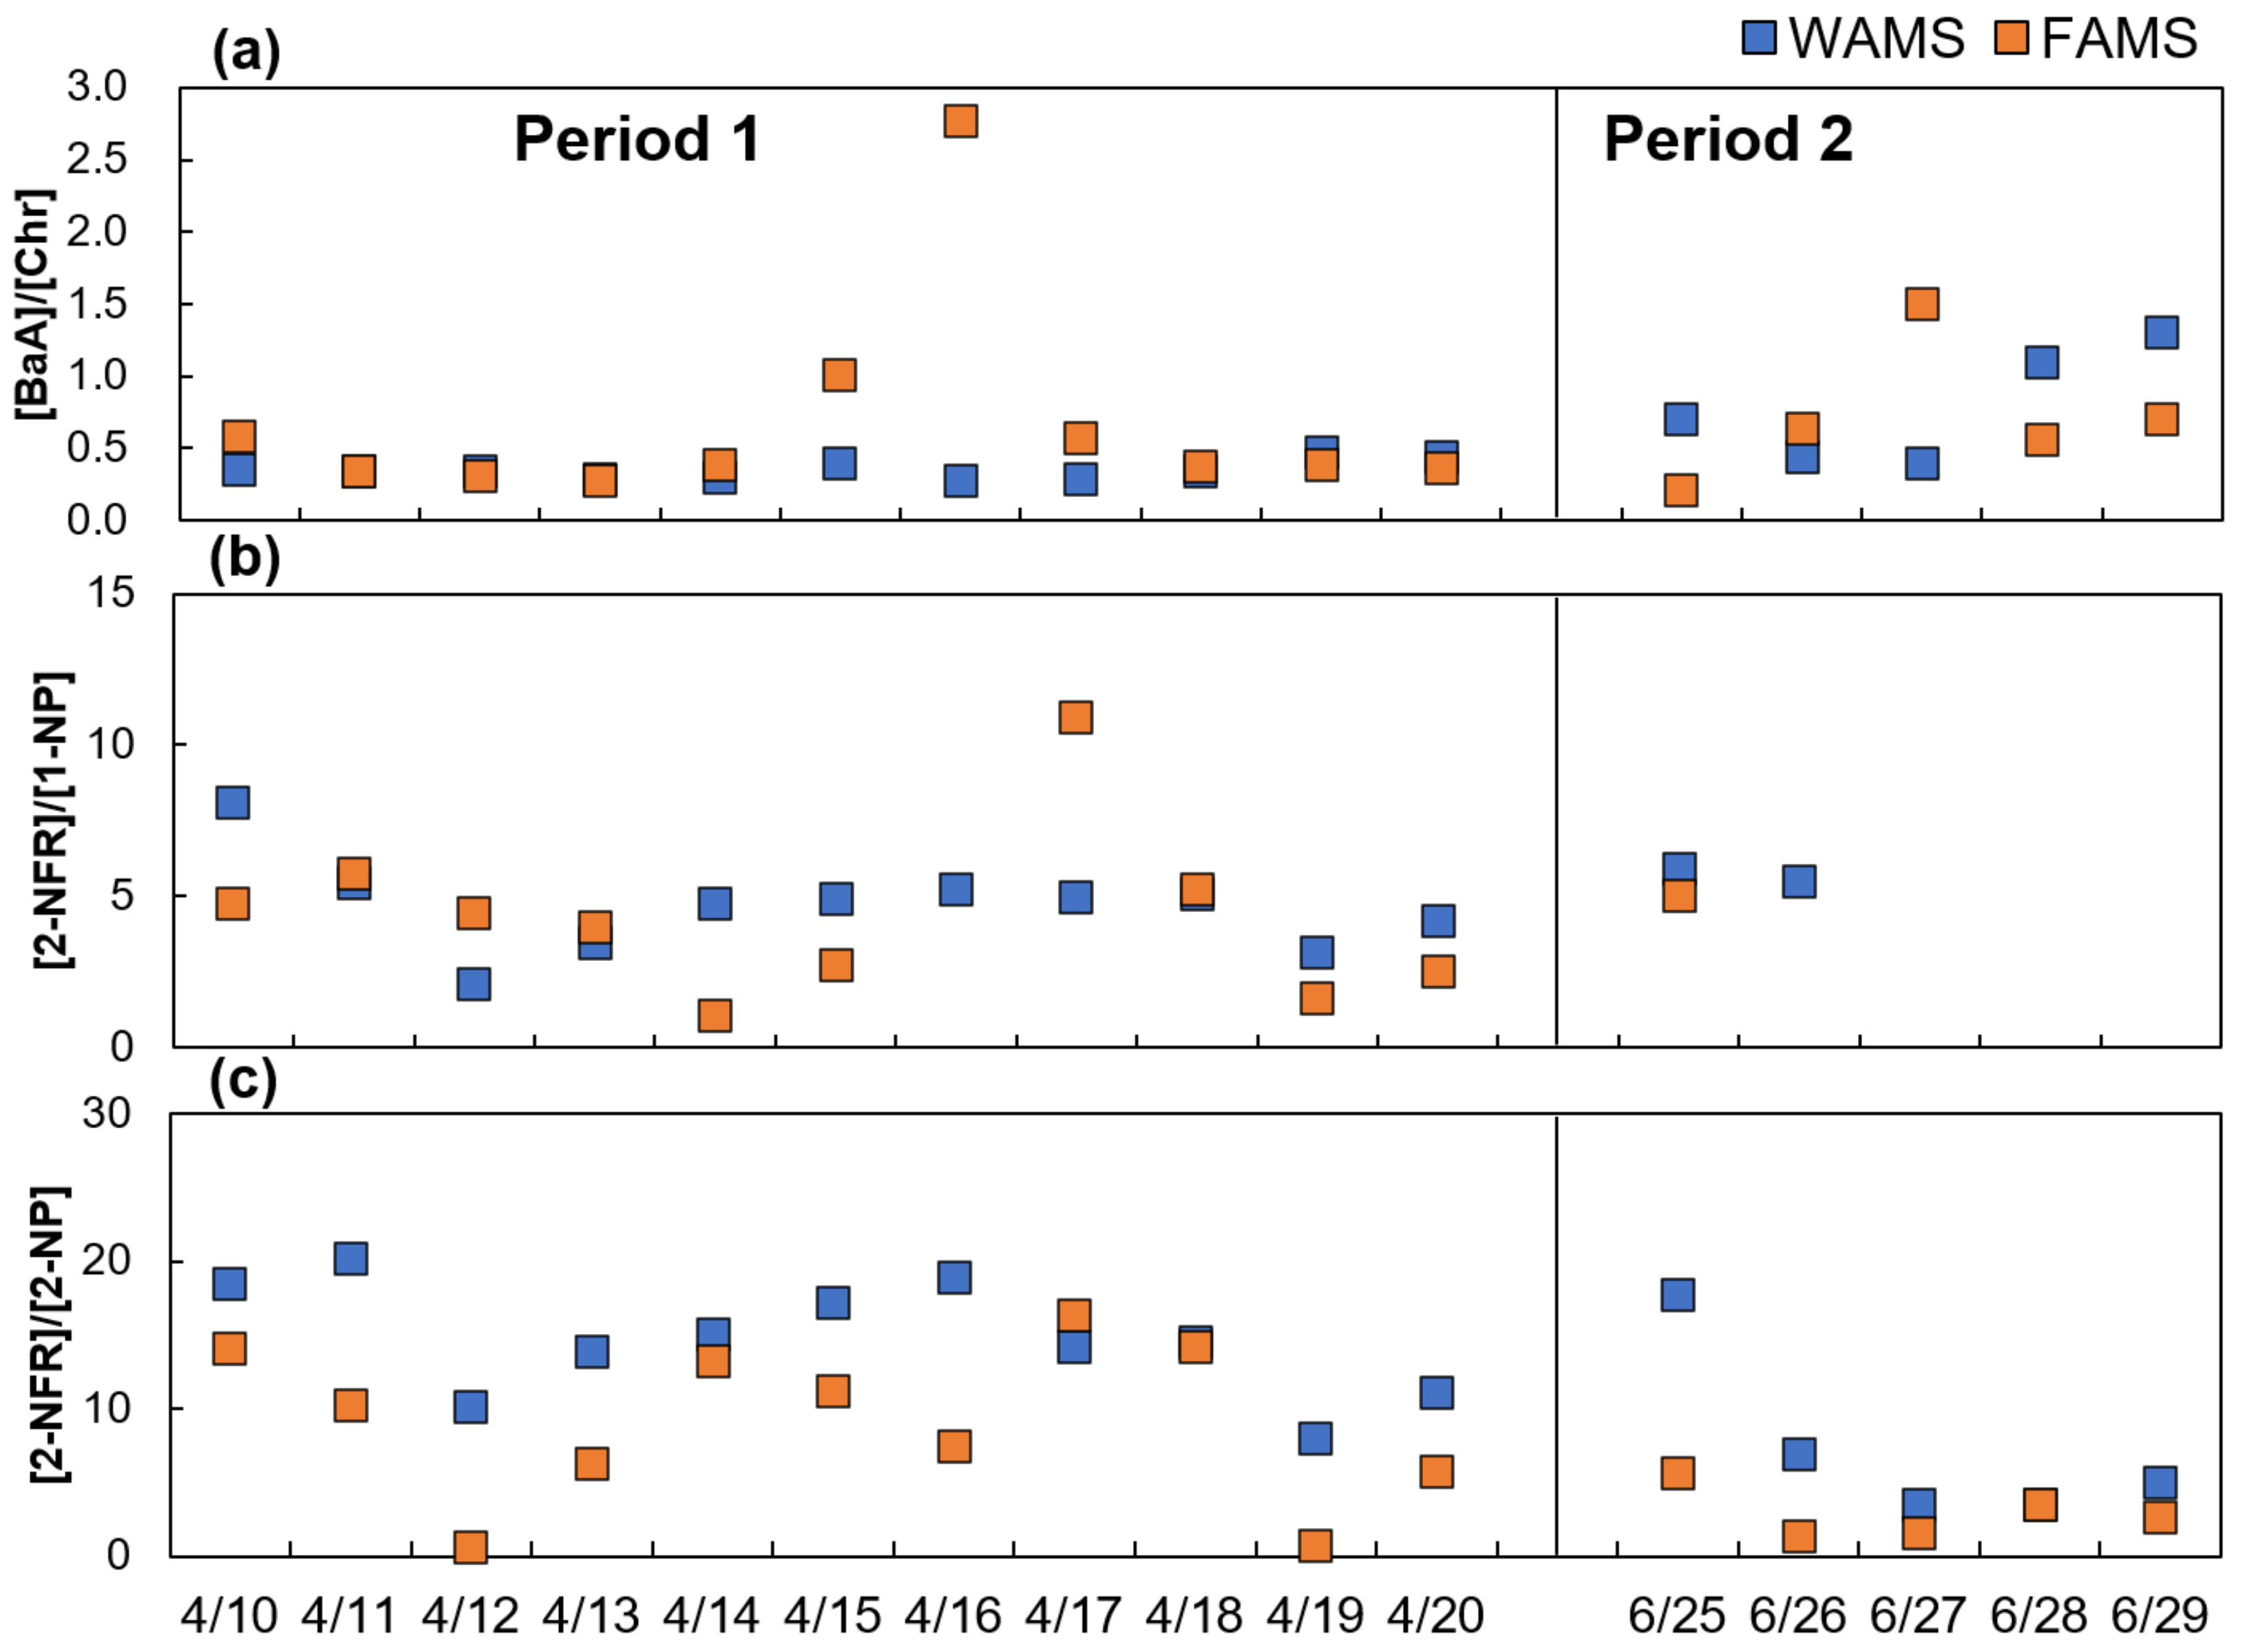
4.2. Diagnostic Ratios
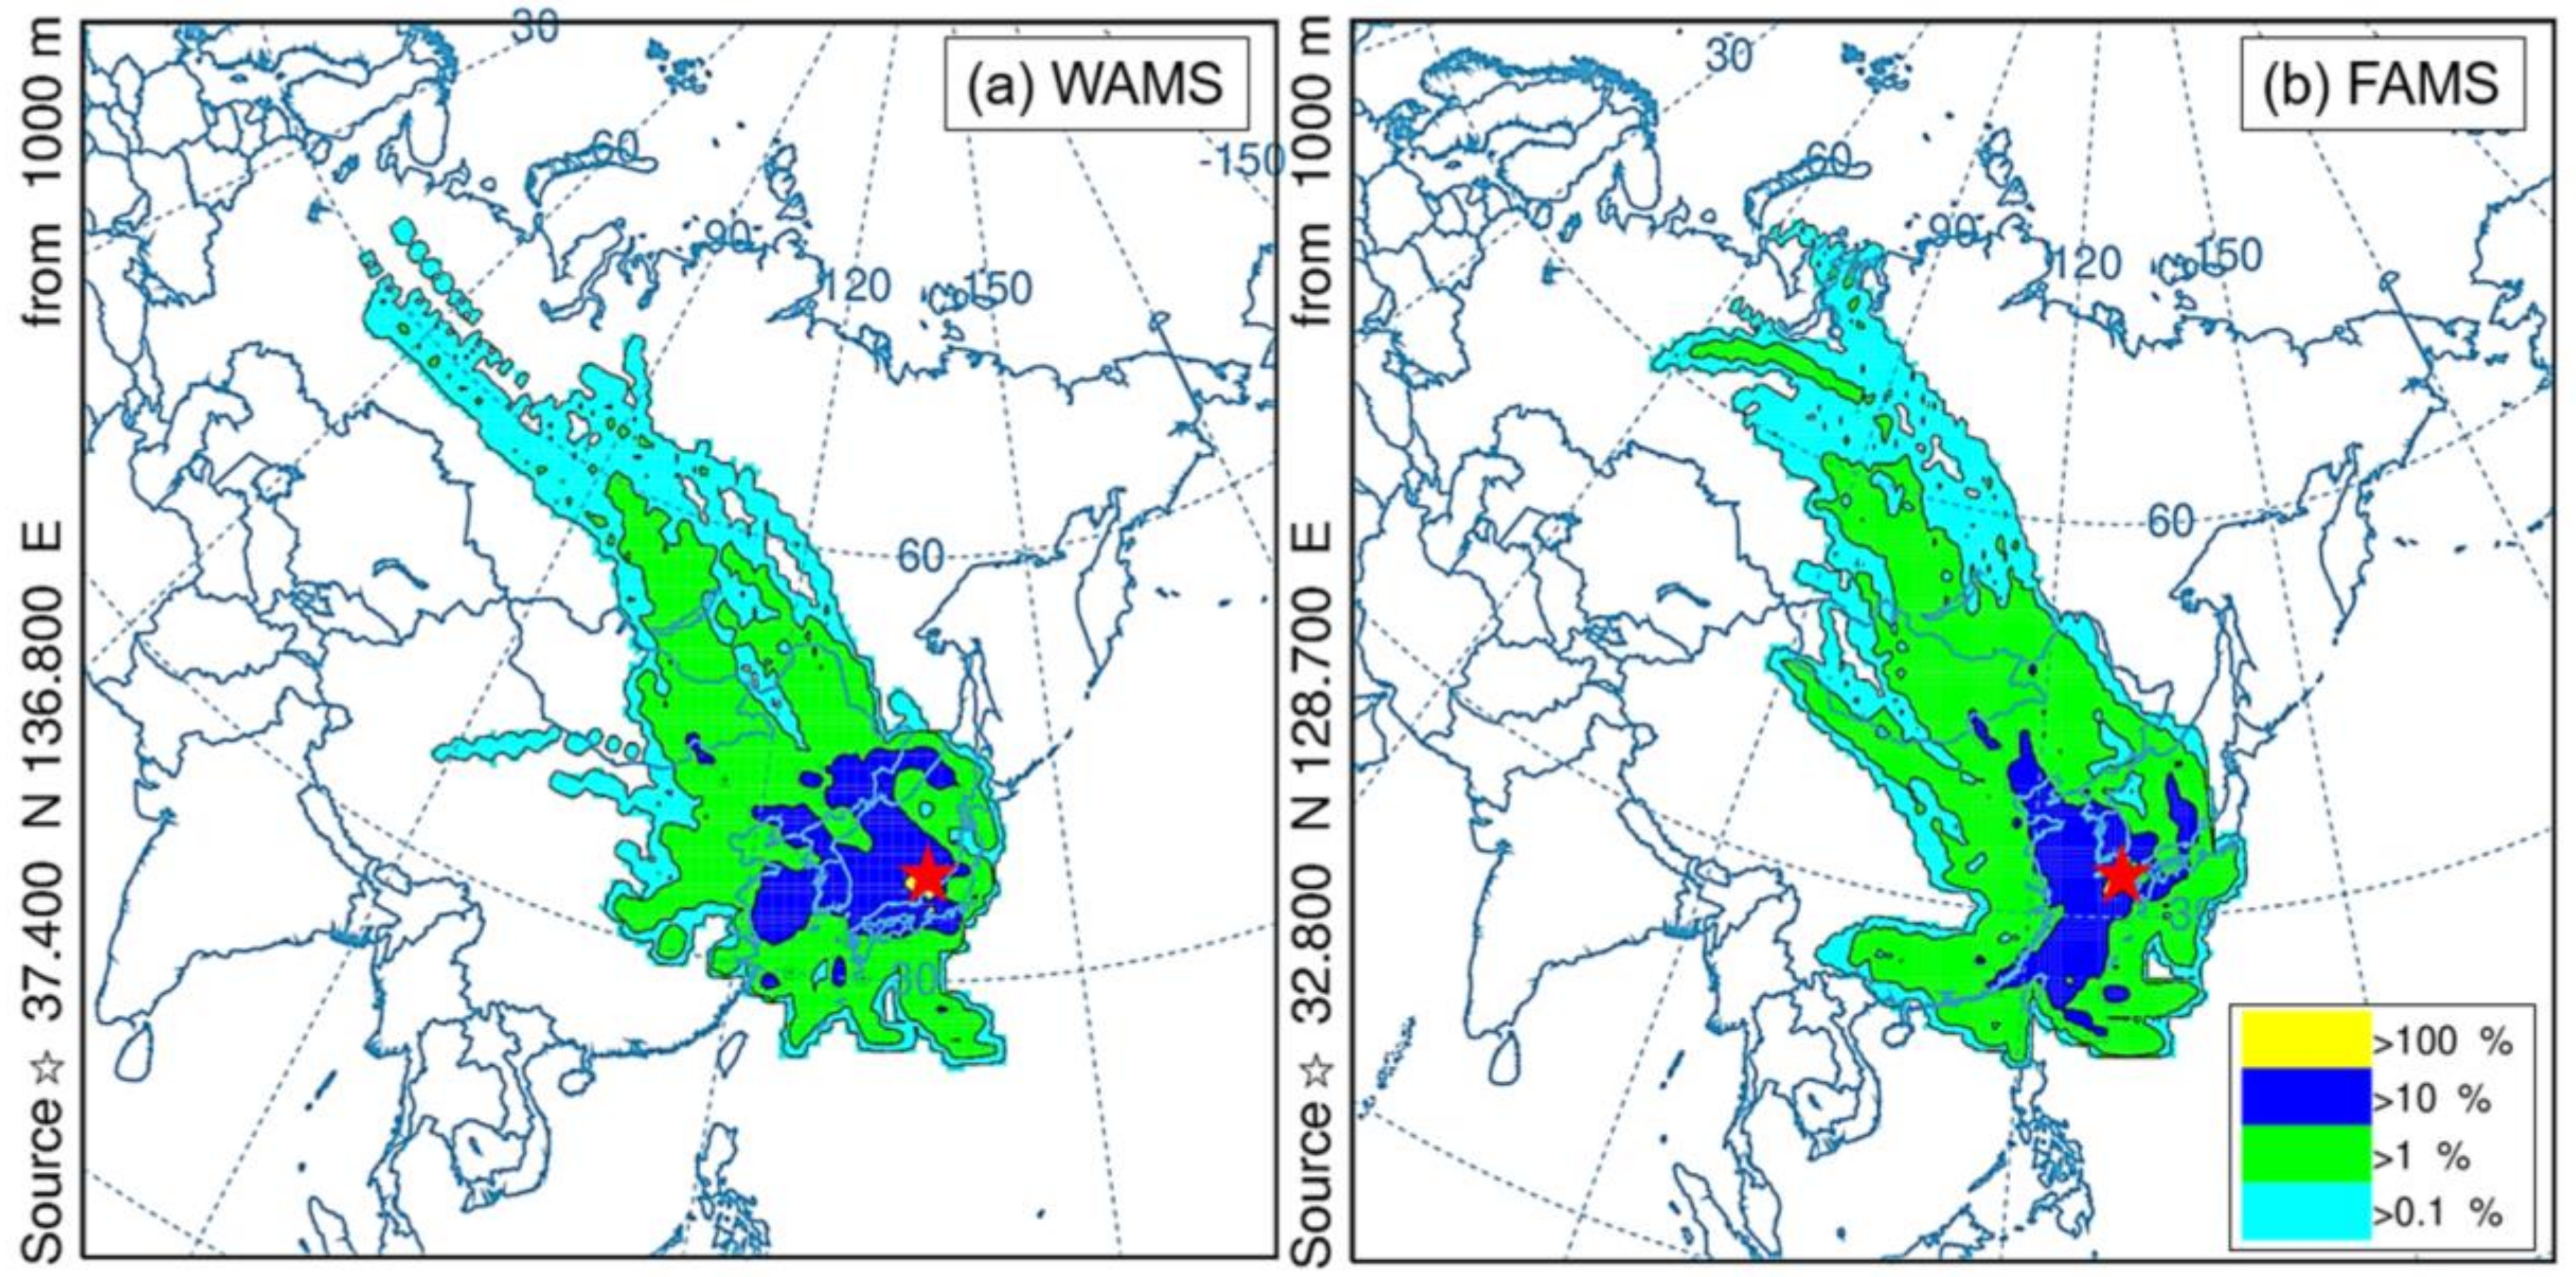
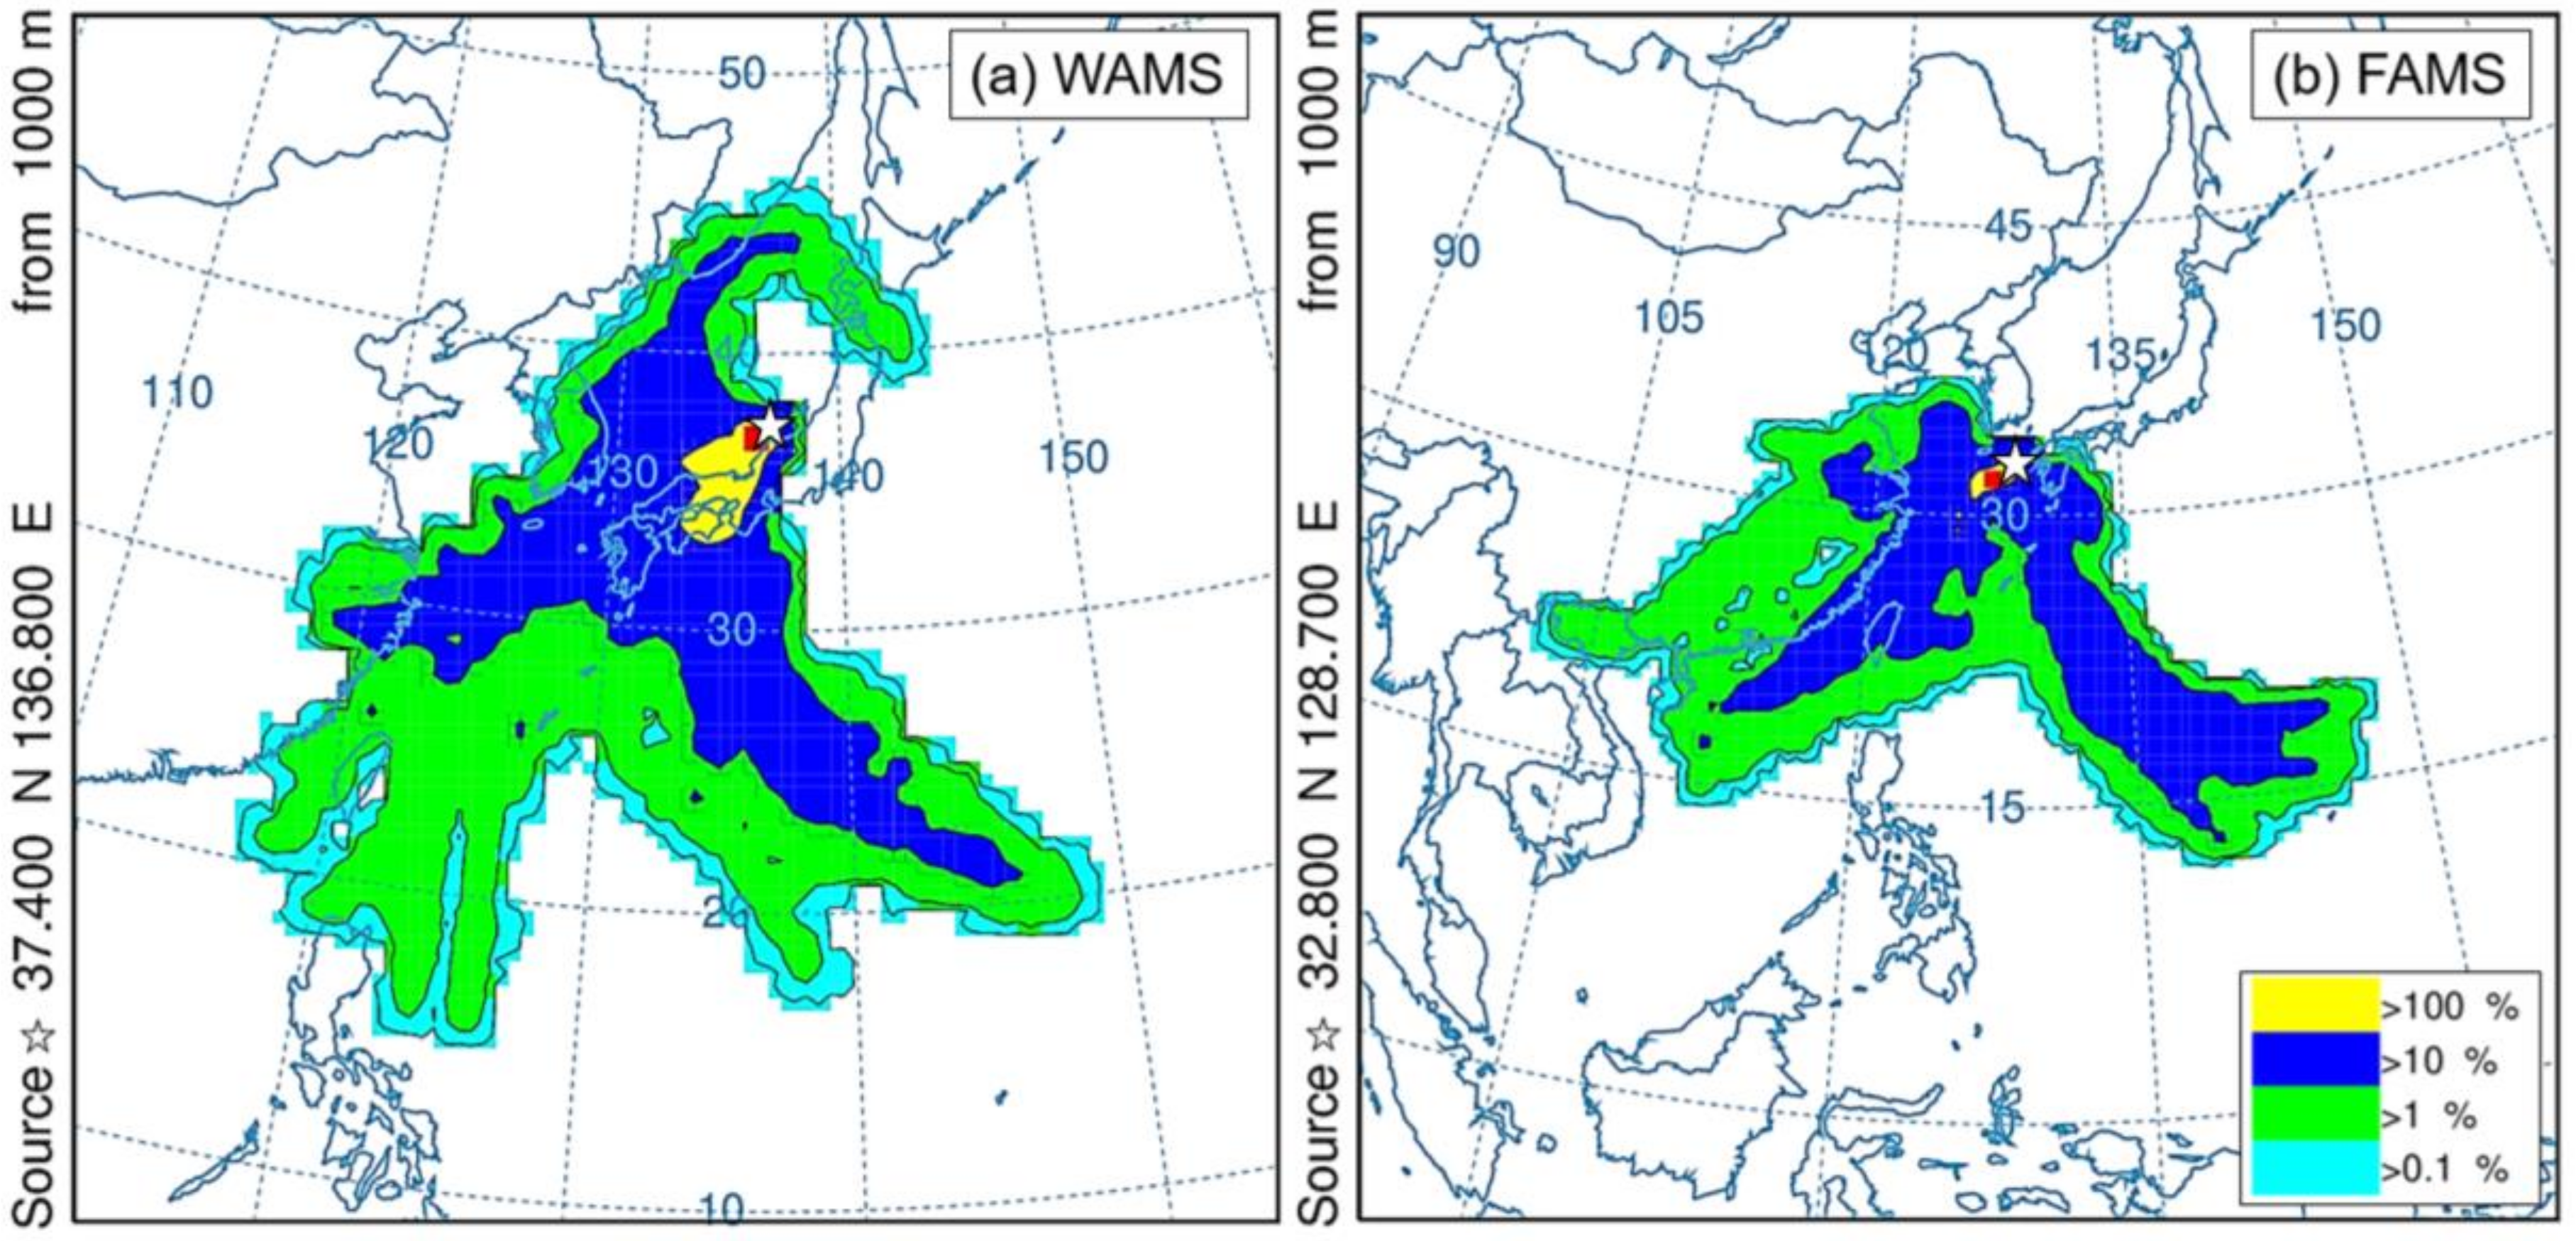
4.3. Backward Trajectory Analysis
4.4. Acid–Base Balance of WSIIs
4.5. Potential Sources
5. Conclusions
Supplementary Materials
Author Contributions
Funding
Conflicts of Interest
References
- Lelieveld, J.; Evans, J.S.; Fnais, M.; Giannadaki, D.; Pozzer, A. The contribution of outdoor air pollution sources to premature mortality on a global scale. Nat. Cell Biol. 2015, 525, 367–371. [Google Scholar] [CrossRef] [PubMed]
- Kim, K.-H.; Kabir, E.; Kabir, S. A review on the human health impact of airborne particulate matter. Environ. Int. 2015, 74, 136–143. [Google Scholar] [CrossRef] [PubMed]
- WHO. Health Effects of Particulate Matter. Policy Implications for Countries In Eastern Europe. Caucasus And Central Asia; World Health Organization Regional Office for Europe: Copenhagen, Denmark, 2013. [Google Scholar]
- Xing, W.; Zhang, L.; Yang, L.; Zhou, Q.; Zhang, X.; Toriba, A.; Hayakawa, K.; Tang, N. Characteristics of PM2.5-Bound Polycyclic Aromatic Hydrocarbons and Nitro-Polycyclic Aromatic Hydrocarbons at A Roadside Air Pollution Monitoring Station in Kanazawa, Japan. Int. J. Environ. Res. Public Health. 2020, 17, 805. [Google Scholar] [CrossRef] [PubMed]
- Byambaa, B.; Yang, L.; Matsuki, A.; Nagato, E.G.; Gankhuyag, K.; Chuluunpurev, B.; Banzragch, L.; Chonokhuu, S.; Tang, N.; Hayakawa, K. Sources and Characteristics of Polycyclic Aromatic Hydrocarbons in Ambient Total Suspended Particles in Ulaanbaatar City, Mongolia. Int. J. Environ. Res. Public Health 2019, 16, 442. [Google Scholar] [CrossRef] [PubMed]
- Zhang, L.; Tokuda, T.; Yang, L.; Zhou, Q.; Zhang, X.; Xing, W.; Wu, Q.; Zhou, Z.; Chen, R.; Kameda, T.; et al. Characteristics and Health Risks of Particulate Polycyclic Aromatic Hydrocarbons and Nitro-polycyclic Aromatic Hydrocarbons at Urban and Suburban Elementary Schools in Shanghai, China. Asian J. Atmos. Environ. 2019, 13, 266–275. [Google Scholar] [CrossRef]
- Yang, L.; Suzuki, G.; Zhang, L.; Zhou, Q.; Zhang, X.; Xing, W.; Shima, M.; Yoda, Y.; Nakatsubo, R.; Hiraki, T.; et al. The Characteristics of Polycyclic Aromatic Hydrocarbons in Different Emission Source Areas in Shenyang, China. Int. J. Environ. Res. Public Heal. 2019, 16, 2817. [Google Scholar] [CrossRef]
- Zhang, L.; Morisaki, H.; Wei, Y.; Li, Z.; Yang, L.; Zhou, Q.; Zhang, X.; Xing, W.; Hu, M.; Shima, M.; et al. Characteristics of air pollutants inside and outside a primary school classroom in Beijing and respiratory health impact on children. Environ. Pollut. 2019, 255, 113147. [Google Scholar] [CrossRef]
- Sun, Y.; Zhuang, G.; Wang, Y.; Han, L.; Guo, J.; Dan, M.; Zhang, W.; Wang, Z.; Hao, Z. The air-borne particulate pollution in Beijing—Concentration, composition, distribution and sources. Atmos. Environ. 2004, 38, 5991–6004. [Google Scholar] [CrossRef]
- Jacobson, M.C.; Hansson, H.-C.; Noone, K.J.; Charlson, R.J. Organic Atmos. aerosols: Review and state of the science. Rev. Geophys. 2000, 38, 267–294. [Google Scholar] [CrossRef]
- Durant, J.L.; Busby, W.F.; LaFleur, A.L.; Penman, B.W.; Crespi, C.L. Human cell mutagenicity of oxygenated, nitrated and unsubstituted polycyclic aromatic hydrocarbons associated with urban aerosols. Mutat. Res. Toxicol. 1996, 371, 123–157. [Google Scholar] [CrossRef]
- Nisbet, I.C.; Lagoy, P.K. Toxic equivalency factors (TEFs) for polycyclic aromatic hydrocarbons (PAHs). Regul. Toxicol. Pharmacol. 1992, 16, 290–300. [Google Scholar] [CrossRef]
- Taga, R.; Tang, N.; Hattori, T.; Tamura, K.; Sakai, S.; Toriba, A.; Kizu, R.; Hayakawa, K. Direct-acting mutagenicity of extracts of coal burning-derived particulates and contribution of nitropolycyclic aromatic hydrocarbons. Mutat. Res. Toxicol. Environ. Mutagen. 2005, 581, 91–95. [Google Scholar] [CrossRef] [PubMed]
- Jiang, N.; Duan, S.; Yu, X.; Zhang, R.; Wang, K. Comparative major components and health risks of toxic elements and polycyclic aromatic hydrocarbons of PM2.5 in winter and summer in Zhengzhou: Based on three-year data. Atmos. Res. 2018, 213, 173–184. [Google Scholar] [CrossRef]
- Zhang, L.; Morisaki, H.; Wei, Y.; Li, Z.; Yang, L.; Zhou, Q.; Zhang, X.; Xing, W.; Hu, M.; Shima, M.; et al. PM2.5-bound polycyclic aromatic hydrocarbons and nitro-polycyclic aromatic hydrocarbons inside and outside a primary school classroom in Beijing: Concentration, composition, and inhalation cancer risk. Sci. Total. Environ. 2020, 705, 135840. [Google Scholar] [CrossRef] [PubMed]
- Zhou, J.; Xing, Z.; Deng, J.; Du, K. Characterizing and sourcing ambient PM2.5 over key emission regions in China I: Water-soluble ions and carbonaceous fractions. Atmos. Environ. 2016, 135, 20–30. [Google Scholar] [CrossRef]
- Tian, M.; Wang, H.; Chen, Y.; Yang, F.; Zhang, X.; Zou, Q.; Zhang, R.; Ma, Y.; He, K. Characteristics of aerosol pollution during heavy haze events in Suzhou, China. Atmos. Chem. Phys. Discuss. 2016, 16, 7357–7371. [Google Scholar] [CrossRef]
- Esworthy, R. Air Quality: EPA’s 2013 Changes To The Particulate Matter (PM) Standard; Library of Congress, Congressional Research Service: Washington, DC, USA, 2013. [Google Scholar]
- Keyte, I.J.; Harrison, R.M.; Lammel, G. Chemical reactivity and long-range transport potential of polycyclic aromatic hydrocarbons—A review. Chem. Soc. Rev. 2013, 42, 9333–9391. [Google Scholar] [CrossRef]
- Inomata, Y.; Kajino, M.; Sato, K.; Ohara, T.; Kurokawa, J.-I.; Ueda, H.; Tang, N.; Hayakawa, K.; Ohizumi, T.; Akimoto, H. Emission and Atmos. Transport of Particulate PAHs in Northeast Asia. Environ. Sci. Technol. 2012, 46, 4941–4949. [Google Scholar] [CrossRef]
- Sato, K.; Takami, A.; Irei, S.; Miyoshi, T.; Ogawa, Y.; Yoshino, A.; Nakayama, H.; Maeda, M.; Hayakeyama, S.; Hara, K.; et al. Transported and Local Organic Aerosols over Fukuoka, Japan. Aerosol Air Qual. Res. 2013, 13, 1263–1272. [Google Scholar] [CrossRef]
- Zhang, X.; Zhang, L.; Yang, L.; Zhou, Q.; Xing, W.; Toriba, A.; Hayakawa, K.; Wei, Y.; Tang, N. Characteristics of Polycyclic Aromatic Hydrocarbons (PAHs) and Common Air Pollutants at Wajima, a Remote Background Site in Japan. Int. J. Environ. Res. Public Heal. 2020, 17, 957. [Google Scholar] [CrossRef] [PubMed]
- Zhang, L.; Yang, L.; Zhou, Q.; Zhang, X.; Xing, W.; Zhang, H.; Toriba, A.; Hayakawa, K.; Tang, N. Impact of the COVID-19 Outbreak on the Long-range Transport of Particulate PAHs in East Asia. Aerosol Air Qual. Res. 2020, 20, 2035–2046. [Google Scholar] [CrossRef]
- Hidemori, T.; Nakayama, T.; Matsumi, Y.; Kinugawa, T.; Yabushita, A.; Ohashi, M.; Miyoshi, T.; Irei, S.; Takami, A.; Kaneyasu, N.; et al. Characteristics of Atmos. aerosols containing heavy metals measured on Fukue Island, Japan. Atmos. Environ. 2014, 97, 447–455. [Google Scholar] [CrossRef]
- Kaneyasu, N.; Yamamoto, S.; Sato, K.; Takami, A.; Hayashi, M.; Hara, K.; Kawamoto, K.; Okuda, T.; Hatakeyama, S. Impact of long-range transport of aerosols on the PM2.5 composition at a major metropolitan area in the northern Kyushu area of Japan. Atmos. Environ. 2014, 97, 416–425. [Google Scholar] [CrossRef]
- Tang, N.; Hakamata, M.; Sato, K.; Okada, Y.; Yang, X.; Tatematsu, M.; Toriba, A.; Kameda, T.; Hayakawa, K. Atmos. behaviors of polycyclic aromatic hydrocarbons at a Japanese remote background site, Noto peninsula, from 2004 to 2014. Atmos. Environ. 2015, 120, 144–151. [Google Scholar] [CrossRef]
- Yang, L.; Tang, N.; Matsuki, A.; Takami, A.; Hatakeyama, S.; Kaneyasu, N.; Nagato, E.G.; Sato, K.; Yoshino, A.; Hayakawa, K. A Comparison of Particulate-Bound Polycyclic Aromatic Hydrocarbons Long-Range Transported from the Asian Continent to the Noto Peninsula and Fukue Island, Japan. Asian J. Atmos. Environ. 2018, 12, 369–376. [Google Scholar] [CrossRef]
- Yang, X.-Y.; Okada, Y.; Tang, N.; Matsunaga, S.; Tamura, K.; Lin, J.-M.; Kameda, T.; Toriba3, A.; Hayakawa, K. Long-range transport of polycyclic aromatic hydrocarbons from China to Japan. Atmos. Environ. 2007, 41, 2710–2718. [Google Scholar] [CrossRef]
- Yang, X.-Y.; Yamada, M.; Tang, N.; Lin, J.-M.; Wang, W.; Kameda, T.; Toriba, A.; Hayakawa, K. Long-range transport of fluoride in East Asia monitored at Noto Peninsula, Japan. Sci. Total. Environ. 2009, 407, 4681–4686. [Google Scholar] [CrossRef]
- Yang, L.; Zhang, X.; Xing, W.; Zhou, Q.; Zhang, L.; Wu, Q.; Zhou, Z.; Chen, R.; Toriba, A.; Hayakawa, K.; et al. Yearly variation in characteristics and health risk of polycyclic aromatic hydrocarbons and nitro-PAHs in urban shanghai from 2010–2018. J. Environ. Sci. 2021, 99, 72–79. [Google Scholar] [CrossRef]
- Zhou, Q.; Zhang, L.; Yang, L.; Zhang, X.; Xing, W.; Hu, M.; Chen, B.; Han, C.; Toriba, A.; Hayakawa, K.; et al. Long-term variability of inorganic ions in TSP at a remote background site in Japan (Wajima) from 2005 to 2015. Chemosphere 2021, 264, 128427. [Google Scholar] [CrossRef]
- Ogawa, Y.; Kaneyasu, N.; Sato, K.; Takami, A.; Hayashi, M.; Hara, K.; Hatakeyama, S. PAH and n-Allkanes Transported Long-range—from the observation at Cape Hedo, Fukue Island and Fukuoka City in spring and autumn, 2009. J. Japan Soc. Atmos. Environ. 2012, 47, 18–25. [Google Scholar]
- Zhang, L.; Zhang, X.; Xing, W.; Zhou, Q.; Yang, L.; Nakatsubo, R.; Wei, Y.; Bi, J.; Shima, M.; Toriba, A.; et al. Natural aeolian dust particles have no substantial effect on Atmos. polycyclic aromatic hydrocarbons (PAHs): A laboratory study based on naphthalene. Environ. Pollut. 2020, 263, 114454. [Google Scholar] [CrossRef]
- Amarillo, A.C.; Carreras, H. Quantifying the influence of meteorological variables on particle-bound PAHs in urban environments. Atmos. Pollut. Res. 2016, 7, 597–602. [Google Scholar] [CrossRef]
- Ray, D.; Ghosh, S.K.; Raha, S. Impacts of photochemical ageing on the half-lives and diagnostic ratio of polycyclic aromatic hydrocarbons intrinsic to PM2.5 collected from ‘real-world’ like combustion events of wood and rice straw burning. J. Hazard. Mater. 2019, 366, 10–15. [Google Scholar] [CrossRef]
- Ding, X.; Wang, X.-M.; Xie, Z.-Q.; Xiang, C.-H.; Mai, B.-X.; Sun, L.; Zheng, M.; Sheng, G.; Fu, J.-M.; Pöschl, U. Atmos. polycyclic aromatic hydrocarbons observed over the North Pacific Ocean and the Arctic area: Spatial distribution and source identification. Atmos. Environ. 2007, 41, 2061–2072. [Google Scholar] [CrossRef]
- Khalili, N.R.; Scheff, P.A.; Holsen, T.M. PAH source fingerprints for coke ovens, diesel and, gasoline engines, highway tunnels, and wood combustion emissions. Atmos. Environ. 1995, 29, 533–542. [Google Scholar] [CrossRef]
- Bamford, H.; Baker, J.E. Nitro-polycyclic aromatic hydrocarbon concentrations and sources in urban and suburban atmospheres of the Mid-Atlantic region. Atmos. Environ. 2003, 37, 2077–2091. [Google Scholar] [CrossRef]
- Tang, N.; Hattori, T.; Taga, R.; Igarashi, K.; Yang, X.; Tamura, K.; Kakimoto, H.; Mishukov, V.F.; Toriba, A.; Kizu, R.; et al. Polycyclic aromatic hydrocarbons and nitropolycyclic aromatic hydrocarbons in urban air particulates and their relationship to emission sources in the Pan–Japan Sea countries. Atmos. Environ. 2005, 39, 5817–5826. [Google Scholar] [CrossRef]
- Tang, N.; Sato, K.; Tokuda, T.; Tatematsu, M.; Hama, H.; Suematsu, C.; Kameda, T.; Toriba, A.; Hayakawa, K. Factors affecting Atmos. 1-, 2-nitropyrenes and 2-nitrofluoranthene in winter at Noto peninsula, a remote background site, Japan. Chemosphere 2014, 107, 324–330. [Google Scholar] [CrossRef]
- Zhang, J.; Tong, L.; Huang, Z.; Zhang, H.; He, M.; Dai, X.; Zheng, J.; Xiao, H. Seasonal variation and size distributions of water-soluble inorganic ions and carbonaceous aerosols at a coastal site in Ningbo, China. Sci. Total. Environ. 2018, 639, 793–803. [Google Scholar] [CrossRef]
- Ye, Z.; Liu, J.; Gu, A.; Feng, F.; Liu, Y.; Bi, C.; Xu, J.; Li, L.; Chen, H.; Chen, Y.; et al. Chemical characterization of fine particulate matter in Changzhou, China, and source apportionment with offline aerosol mass spectrometry. Atmos. Chem. Phys. Discuss. 2017, 17, 2573–2592. [Google Scholar] [CrossRef]
- Park, S.H.; Song, C.B.; Kim, M.C.; Kwon, S.B.; Lee, K.W. Study on Size Distribution of Total Aerosol and Water-Soluble Ions During an Asian Dust Storm Event at Jeju Island, Korea. Environ. Monit. Assess. 2004, 93, 157–183. [Google Scholar] [CrossRef] [PubMed]
- Farren, N.J.; Dunmore, R.E.; Mead, M.I.; Nadzir, M.S.M.; Abu Samah, A.; Phang, S.-M.; Bandy, B.J.; Sturges, W.T.; Hamilton, J.F. Chemical characterisation of water-soluble ions in Atmos. particulate matter on the east coast of Peninsular Malaysia. Atmos. Chem. Phys. Discuss. 2019, 19, 1537–1553. [Google Scholar] [CrossRef]
- Krueger, B.J.; Grassian, V.H.; Laskin, A.; Cowin, J.P. The transformation of solid Atmos. particles into liquid droplets through heterogeneous chemistry: Laboratory insights into the processing of calcium containing mineral dust aerosol in the troposphere. Geophys. Res. Lett. 2003, 30, 30. [Google Scholar] [CrossRef]
- Huang, X.H.H.; Bian, Q.; Ng, W.M.; Louie, P.K.K.; Yu, J.Z. Characterization of PM2.5 Major Components and Source Investigation in Suburban Hong Kong: A One Year Monitoring Study. Aerosol Air Qual. Res. 2014, 14, 237–250. [Google Scholar] [CrossRef]
- Ravindra, K.; Sokhi, R.; Van Grieken, R. Atmos. polycyclic aromatic hydrocarbons: Source attribution, emission factors and regulation. Atmos. Environ. 2008, 42, 2895–2921. [Google Scholar] [CrossRef]
- Zhang, L.; Yang, L.; Zhou, Q.; Zhang, X.; Xing, W.; Wei, Y.; Hu, M.; Zhao, L.; Toriba, A.; Hayakawa, K.; et al. Size distribution of particulate polycyclic aromatic hydrocarbons in fresh combustion smoke and ambient air: A review. J. Environ. Sci. 2020, 88, 370–384. [Google Scholar] [CrossRef]
- Enami, S.; Vecitis, C.D.; Cheng, J.; Hoffmann, M.R.; Colussi, A.J. Global Inorganic Source of Atmos. Bromine. J. Phys. Chem. A 2007, 111, 8749–8752. [Google Scholar] [CrossRef]
- Yunker, M.B.; Macdonald, R.W.; Vingarzan, R.; Mitchell, R.H.; Goyette, D.; Sylvestre, S. PAHs in the Fraser River basin: A critical appraisal of PAH ratios as indicators of PAH source and composition. Org. Geochem. 2002, 33, 489–515. [Google Scholar] [CrossRef]


| WAMS | FAMS | ||||||||
|---|---|---|---|---|---|---|---|---|---|
| PC 1 | PC 2 | PC 3 | PC 4 | PC 1 | PC 2 | PC 3 | PC 4 | PC 5 | |
| FR | 0.91 | 0.26 | −0.15 | 0.29 | 0.73 | 0.00 | 0.58 | 0.06 | 0.35 |
| Pyr | 0.91 | 0.31 | −0.13 | 0.22 | 0.75 | 0.04 | 0.58 | 0.08 | 0.31 |
| BaA | 0.87 | 0.44 | −0.11 | 0.02 | 0.96 | 0.14 | 0.14 | 0.07 | 0.15 |
| Chr | 0.80 | 0.54 | −0.11 | 0.22 | 0.85 | 0.05 | 0.44 | 0.10 | 0.27 |
| BbF | 0.83 | 0.49 | −0.09 | 0.22 | 0.96 | 0.16 | 0.21 | −0.03 | 0.08 |
| BkF | 0.83 | 0.52 | −0.11 | 0.14 | 0.96 | 0.17 | 0.18 | 0.02 | 0.08 |
| BaP | 0.85 | 0.50 | −0.11 | 0.06 | 0.96 | 0.05 | 0.22 | 0.07 | 0.13 |
| BgPe | 0.87 | 0.47 | −0.08 | 0.13 | 0.95 | 0.24 | 0.17 | 0.04 | 0.03 |
| IDP | 0.85 | 0.48 | −0.10 | 0.18 | 0.94 | 0.16 | 0.22 | 0.02 | 0.02 |
| 2-NFR | 0.69 | 0.68 | 0.02 | 0.12 | 0.92 | −0.09 | −0.16 | 0.24 | 0.10 |
| 2-NP | 0.77 | 0.52 | 0.18 | 0.09 | 0.25 | 0.07 | 0.14 | −0.19 | 0.93 |
| 1-NP | 0.74 | 0.58 | 0.08 | 0.22 | 0.84 | 0.02 | −0.11 | 0.25 | 0.15 |
| Na+ | −0.13 | 0.11 | 0.95 | −0.07 | 0.58 | 0.54 | 0.06 | 0.18 | 0.56 |
| NH4+ | 0.46 | 0.86 | −0.14 | 0.07 | 0.16 | −0.26 | 0.35 | 0.88 | −0.06 |
| K+ | 0.77 | −0.09 | 0.12 | 0.47 | 0.09 | 0.27 | 0.90 | 0.13 | 0.14 |
| Ca2+ | 0.32 | 0.16 | 0.13 | 0.91 | −0.04 | 0.87 | 0.40 | −0.21 | −0.05 |
| Mg2+ | − * | 0.09 | 0.87 | 0.30 | −0.03 | 0.33 | |||
| Cl− | 0.02 | −0.28 | 0.89 | 0.26 | 0.35 | 0.86 | −0.13 | −0.27 | −0.09 |
| Br− | − * | − * | |||||||
| NO3− | 0.83 | 0.25 | 0.10 | 0.44 | 0.54 | 0.28 | 0.74 | 0.09 | −0.06 |
| SO42− | 0.36 | 0.91 | −0.07 | 0.07 | 0.17 | −0.11 | −0.06 | 0.96 | −0.09 |
| % of Variance | 75.1% | 11.3% | 6.81% | 3.12% | 58.5% | 16.5% | 10.1% | 6.58% | 5.05% |
Publisher’s Note: MDPI stays neutral with regard to jurisdictional claims in published maps and institutional affiliations. |
© 2020 by the authors. Licensee MDPI, Basel, Switzerland. This article is an open access article distributed under the terms and conditions of the Creative Commons Attribution (CC BY) license (http://creativecommons.org/licenses/by/4.0/).
Share and Cite
Yang, L.; Zhang, L.; Zhang, H.; Zhou, Q.; Zhang, X.; Xing, W.; Takami, A.; Sato, K.; Shimizu, A.; Yoshino, A.; et al. Comparative Analysis of PM2.5-Bound Polycyclic Aromatic Hydrocarbons (PAHs), Nitro-PAHs (NPAHs), and Water-Soluble Inorganic Ions (WSIIs) at Two Background Sites in Japan. Int. J. Environ. Res. Public Health 2020, 17, 8224. https://doi.org/10.3390/ijerph17218224
Yang L, Zhang L, Zhang H, Zhou Q, Zhang X, Xing W, Takami A, Sato K, Shimizu A, Yoshino A, et al. Comparative Analysis of PM2.5-Bound Polycyclic Aromatic Hydrocarbons (PAHs), Nitro-PAHs (NPAHs), and Water-Soluble Inorganic Ions (WSIIs) at Two Background Sites in Japan. International Journal of Environmental Research and Public Health. 2020; 17(21):8224. https://doi.org/10.3390/ijerph17218224
Chicago/Turabian StyleYang, Lu, Lulu Zhang, Hao Zhang, Quanyu Zhou, Xuan Zhang, Wanli Xing, Akinori Takami, Kei Sato, Atsushi Shimizu, Ayako Yoshino, and et al. 2020. "Comparative Analysis of PM2.5-Bound Polycyclic Aromatic Hydrocarbons (PAHs), Nitro-PAHs (NPAHs), and Water-Soluble Inorganic Ions (WSIIs) at Two Background Sites in Japan" International Journal of Environmental Research and Public Health 17, no. 21: 8224. https://doi.org/10.3390/ijerph17218224
APA StyleYang, L., Zhang, L., Zhang, H., Zhou, Q., Zhang, X., Xing, W., Takami, A., Sato, K., Shimizu, A., Yoshino, A., Kaneyasu, N., Matsuki, A., Hayakawa, K., Toriba, A., & Tang, N. (2020). Comparative Analysis of PM2.5-Bound Polycyclic Aromatic Hydrocarbons (PAHs), Nitro-PAHs (NPAHs), and Water-Soluble Inorganic Ions (WSIIs) at Two Background Sites in Japan. International Journal of Environmental Research and Public Health, 17(21), 8224. https://doi.org/10.3390/ijerph17218224