The Food Bank of Madrid: A Linear Model for Optimal Nutrition


Abstract
1. Introduction
- Allow computing the weekly investment basket to be made to match the nutritional needs of the beneficiaries with the available economic resources.
- Identify supply strategies that reduce the nutritional gap of the disadvantaged population from a precarious situation to values recommended by international organizations. In this sense, the model might serve as a basis for evaluating food policies.
- The potential evaluation of the performance of charitable organizations that intend to satisfy the nutritional needs of the disadvantaged.
- It can also be useful as a complement to other models that face other tasks in the value chain of this type of organization, such as storage or distribution.
2. Methodology
- (1)
- Review of nutritional requirements by Spanish population groups. Population groups are characterized in this paper by ages, gender, and income ranges.
- (2)
- Search for the nutritional contribution of different food groups to meet the nutritional needs of the different population groups identified in Step 1.
- (3)
- Obtain the price associated with each of the nutritional groups per kg of food group identified in Step 2.
- (4)
- Minimize purchasing costs (mentioned in Step 3) and costs per kg of non-supplied nutrient.
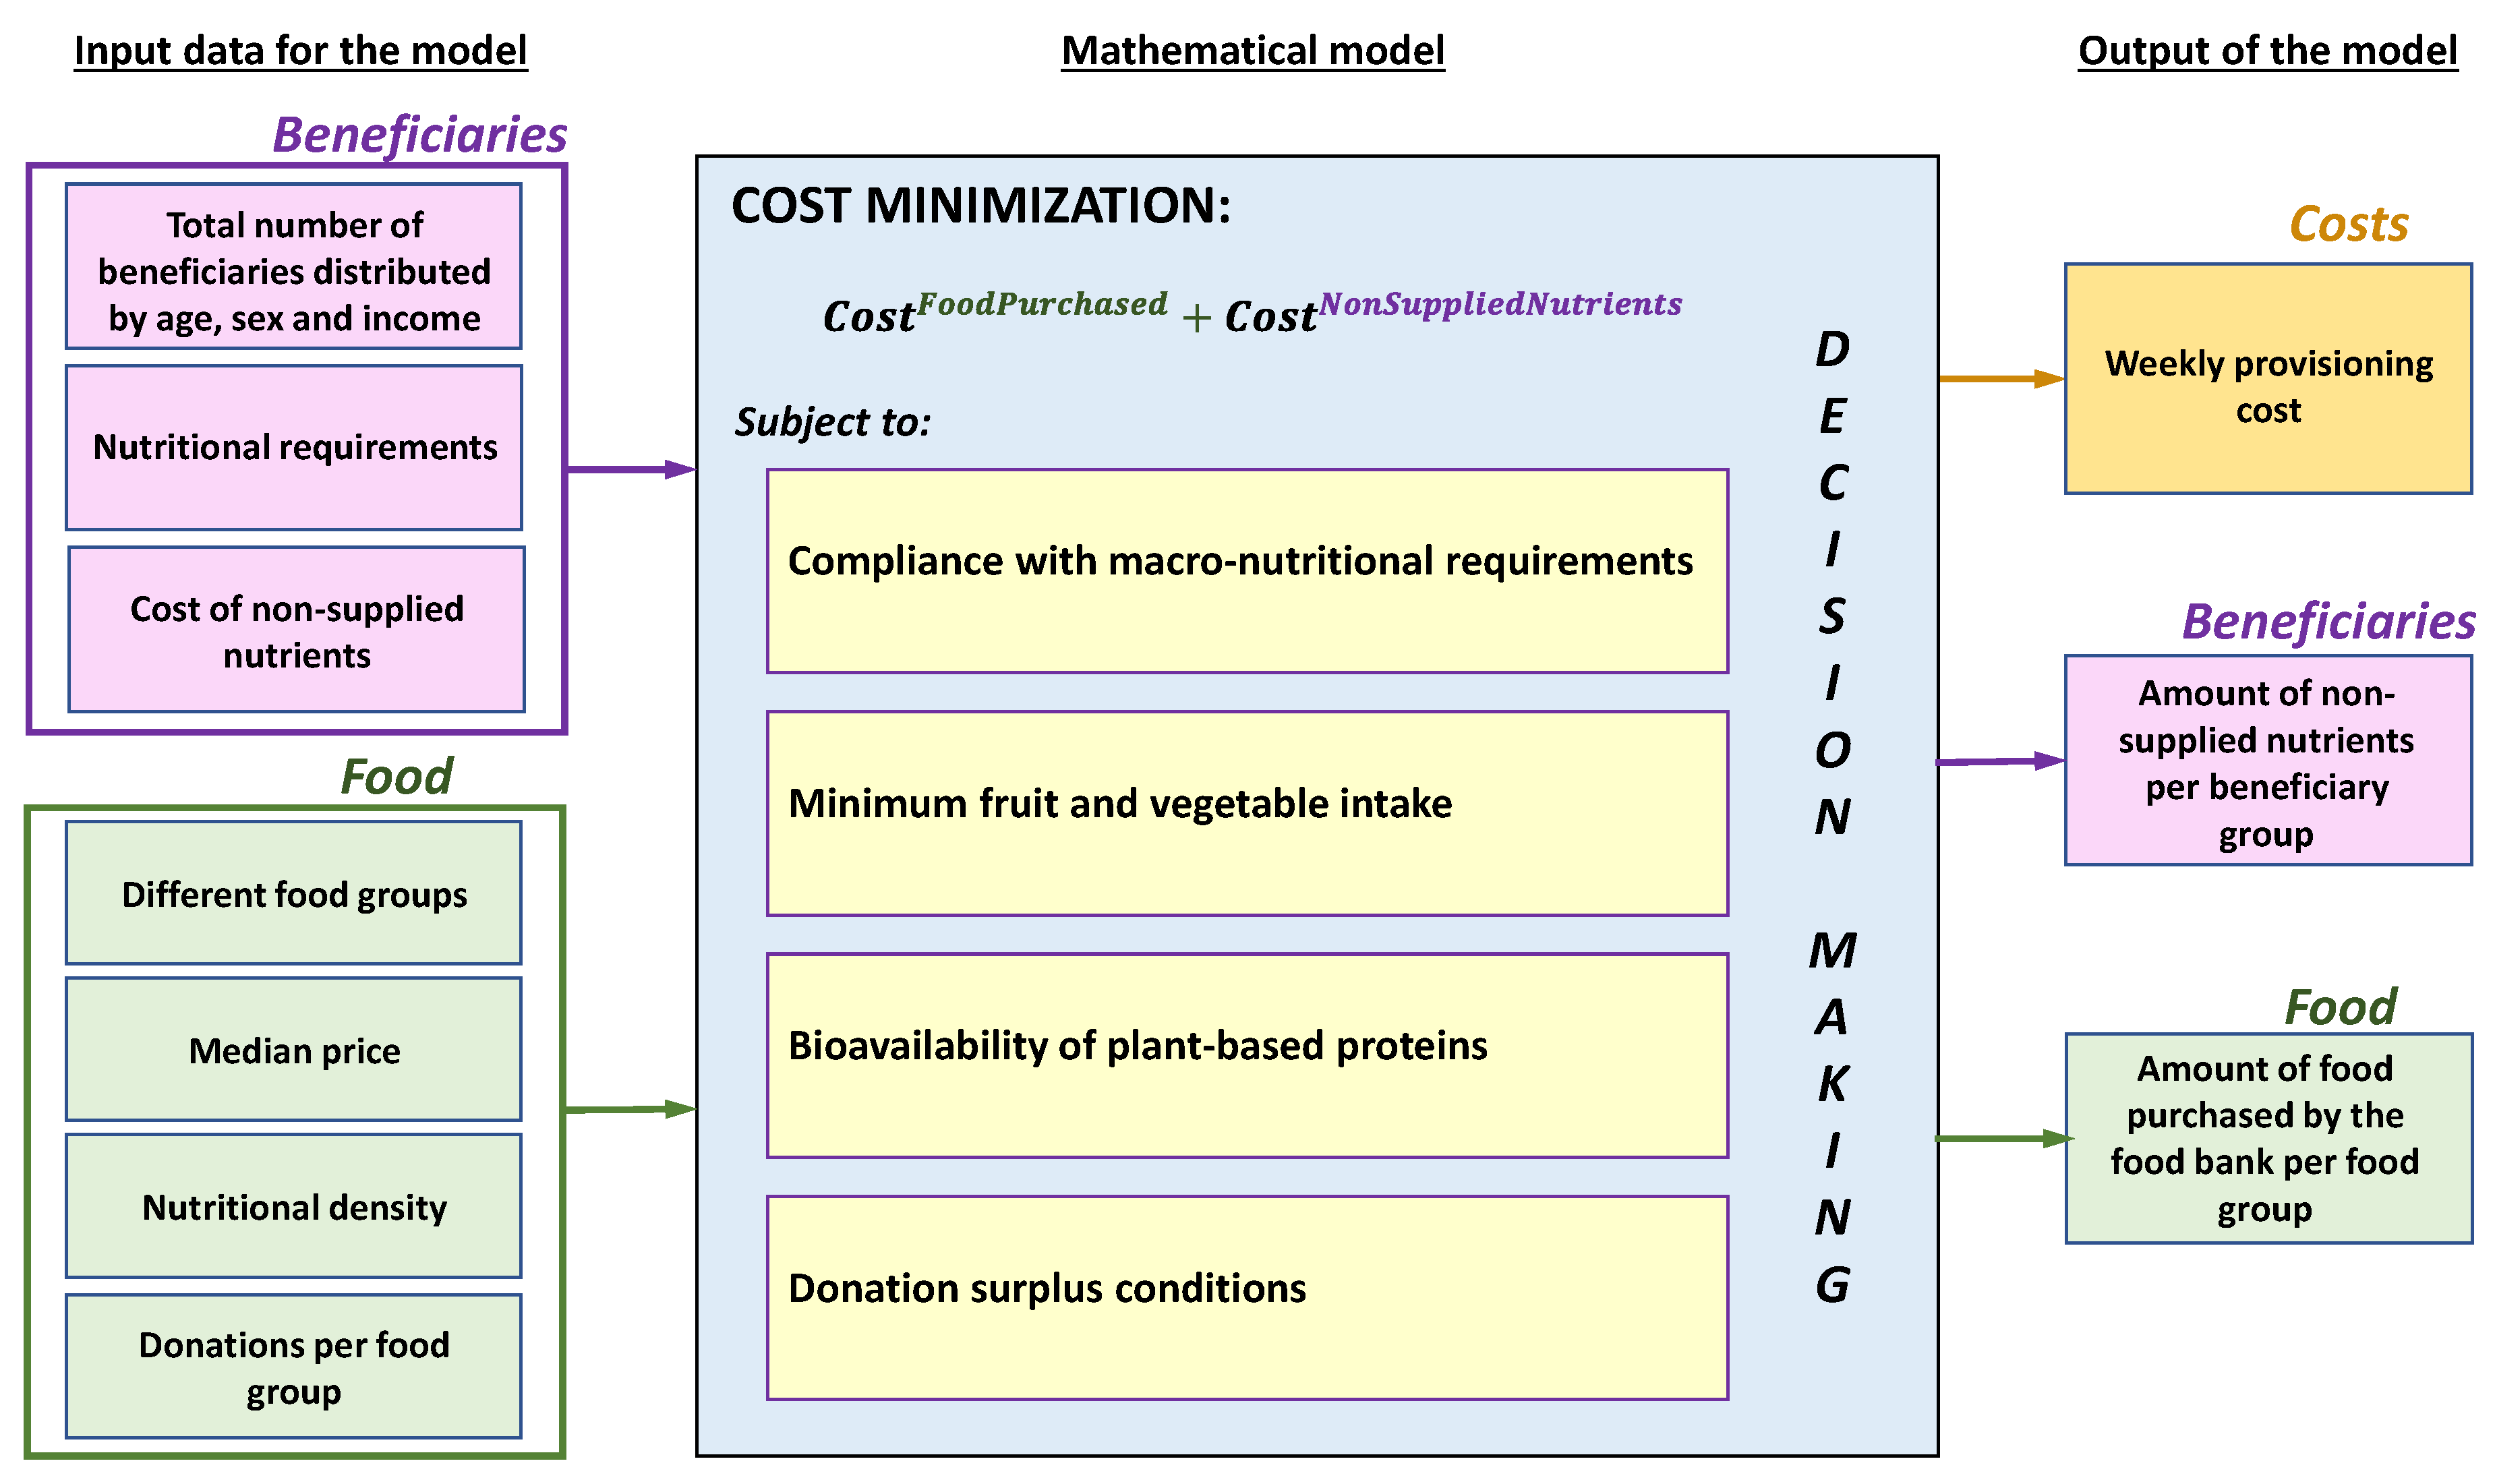
3. Optimization Model
3.1. Modeling Hypotheses
3.1.1. Nutritional Hypotheses
- Instead of using specific products to satisfy the needs of the beneficiaries, general food groups have been used.
- Nutritional requirements per food group are average values from the Recommended Dietary Allowances (RDA [10]). Wherever RDA data are unavailable, they are estimated with the lower ranges proposed in the AMDRS.
- Macronutrient and energy needs are the only nutritional requirements to be considered, leaving aside (i) micro-nutritional and (ii) water requirements. These hypotheses are, respectively, due to (i) the difficulty of finding average or median contributions of micronutrients per food group and (ii) that water is not a scarce resource in the Spanish economy.
- The effect of animal proteins on the bioavailability ([13]) of vegetable proteins is considered, since the successful digestion of vegetable-based proteins requires a minimum intake of micronutrients naturally present in animal-based proteins (such as B12).
3.1.2. Economic Hypotheses
- The cost minimization is carried out from the point of view of the food bank, which is understood as an organization of a social and charitable nature whose purpose is to help satisfy the population’s relevant nutritional requirements.
- The prices used per kg of food are median prices per kg and food group (corresponding to the central position of the price list of the different products considered in each food group). Median costs have been preferred instead of average costs in view of the results of [14], since, according to this study, average costs are much higher than median costs. The reason behind this is that a segment of the population from the middle or upper class can afford “premium” food at very high prices, increasing the average prices, and thus making them less representative of prices the food bank may afford.
- The price of food purchases does not include the cost of additional storage, distribution or manipulation needed after its purchase, nor the cost of the resources (electricity, gas or water) needed for its preparation (such as cooking).
- Costs associated with the purchase of food that is delivered as donations by third-party agents are omitted, since those are sunk costs for the optimization.
- There may be non-supplied amounts of nutrients, which are penalized in the cost function to minimize them. Specifically, this penalty should represent the social cost caused by the non-satisfaction of a nutritional requirement within a given population group. For example, in the case of a lack of essential fatty acids, the penalty should include, among others, the cost associated with the treatments required to treat the diseases due to this deficit, such as obstructions in blood flow, liver diseases, etc. In addition, this penalty can take a higher or lower value depending on whether the group population is of greater or lesser risk, distinguishing, for example, between minors and people in intermediate ages.
- There might be surpluses in donations when their consumption would be detrimental to health. They could even generate, in practice, undesirable costs for storage, in case these costs were represented.
3.1.3. Operational Hypotheses
- As previously explained, donations refer specifically to food delivered to the food bank by solidary third parties that have no information on the final beneficiaries. These food donations are then sorted in the food bank and might be distributed downstream, among the different beneficiary groups, to tackle with, for instance, differences in the quality of the nutrients given by purchased or donated food. Future references to donations in the paper refer to “effective” donations, which are the donations that remain once food in a bad state (because they were in a bad condition at the time they were donated, or because they perished at some point in the food bank’s value chain) is subtracted from the total amount.
- The model considers a dispatch of nutritional needs for a single week. The purchase is then made only once a week, at the beginning, and should cover the needs of the whole week. When modelling a single week, all donations made during a whole year are given in a continuous way, distributed evenly throughout all the weeks of the year. This is equivalent to saying that donations in any given week are the total donations that occur during a year divided by the number of weeks in the year in question. Although this hypothesis fails to capture the impact of seasonality in dietary patterns and requirements, it allows for a powerful operational representation, which could be of more relevance to a centralized planner dedicated to social services that has limited storage and planning capabilities.
3.1.4. Execution Hypotheses
- Considering continuous variables (food quantities are given in kg) makes it easier to compile and execute the model, compared to working with discrete variables (e.g., the number of rice packages, or cans of food), and does not appreciably worsen the resulting costs, being a sufficiently good approximation to the problem.
3.2. Objective Function
3.3. Constraints
3.3.1. Compliance with Nutritional Requirements
3.3.2. Caloric Limitation from Different Food Groups
3.3.3. Food Distribution and Limited Surplus:
3.3.4. Minimum Consumption of Fruits and Vegetables
3.3.5. Bioavailability Condition of Plant-Based Proteins
4. Case Study
4.1. Inputs
4.1.1. Indexes
- Food groups a are: cereal, vegetables, fruit, fats and oils, dairy, fish, meat, eggs and pulses.
- Animal proteins aA are: dairy, fish, meat and eggs.
- Vegetables proteins aV are: cereal, vegetable, fruit and legumes.
- Population groups p: men and women from 9 to 75 years of age are studied, leaving out infants, young children and the casuistry of pregnancy (pregnant and lactating women), in line with [21]. The proportion of beneficiaries by age group is taken from the first income decile in Spain, in 2018, according to data from [22].
- Nutrients r are: carbohydrates, fibre, lipids, omega-3, omega-6, protein and energy.
4.1.2. Nutrition Requirements ()
4.1.3. Nutritional Density of Each Food Group ()
4.1.4. Costs of Each Food Group ()
4.1.5. Number of Beneficiaries ()
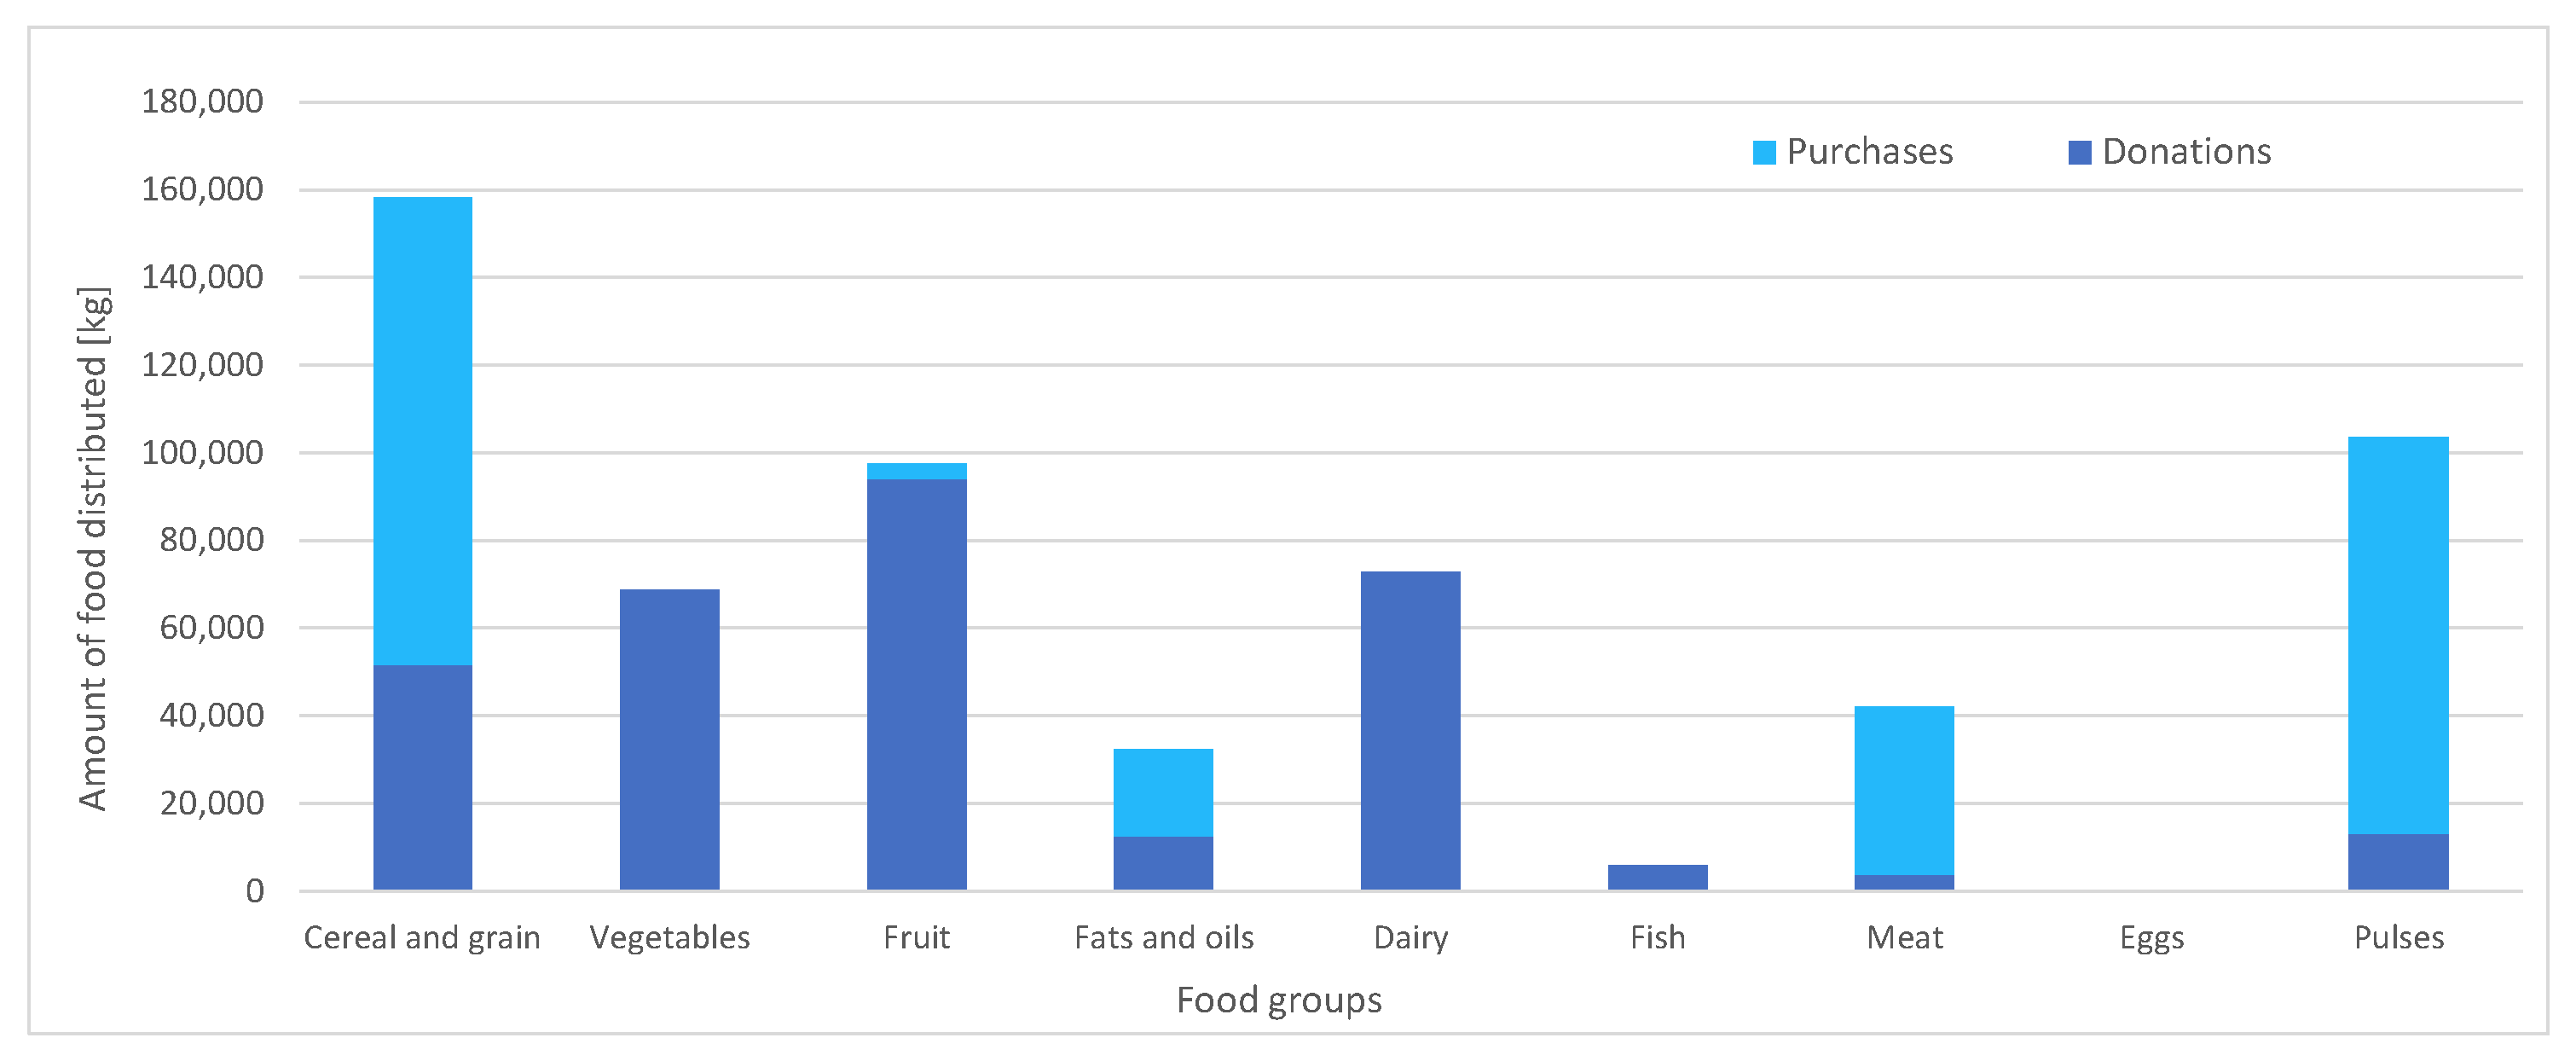
4.1.6. Amount of Donations ()
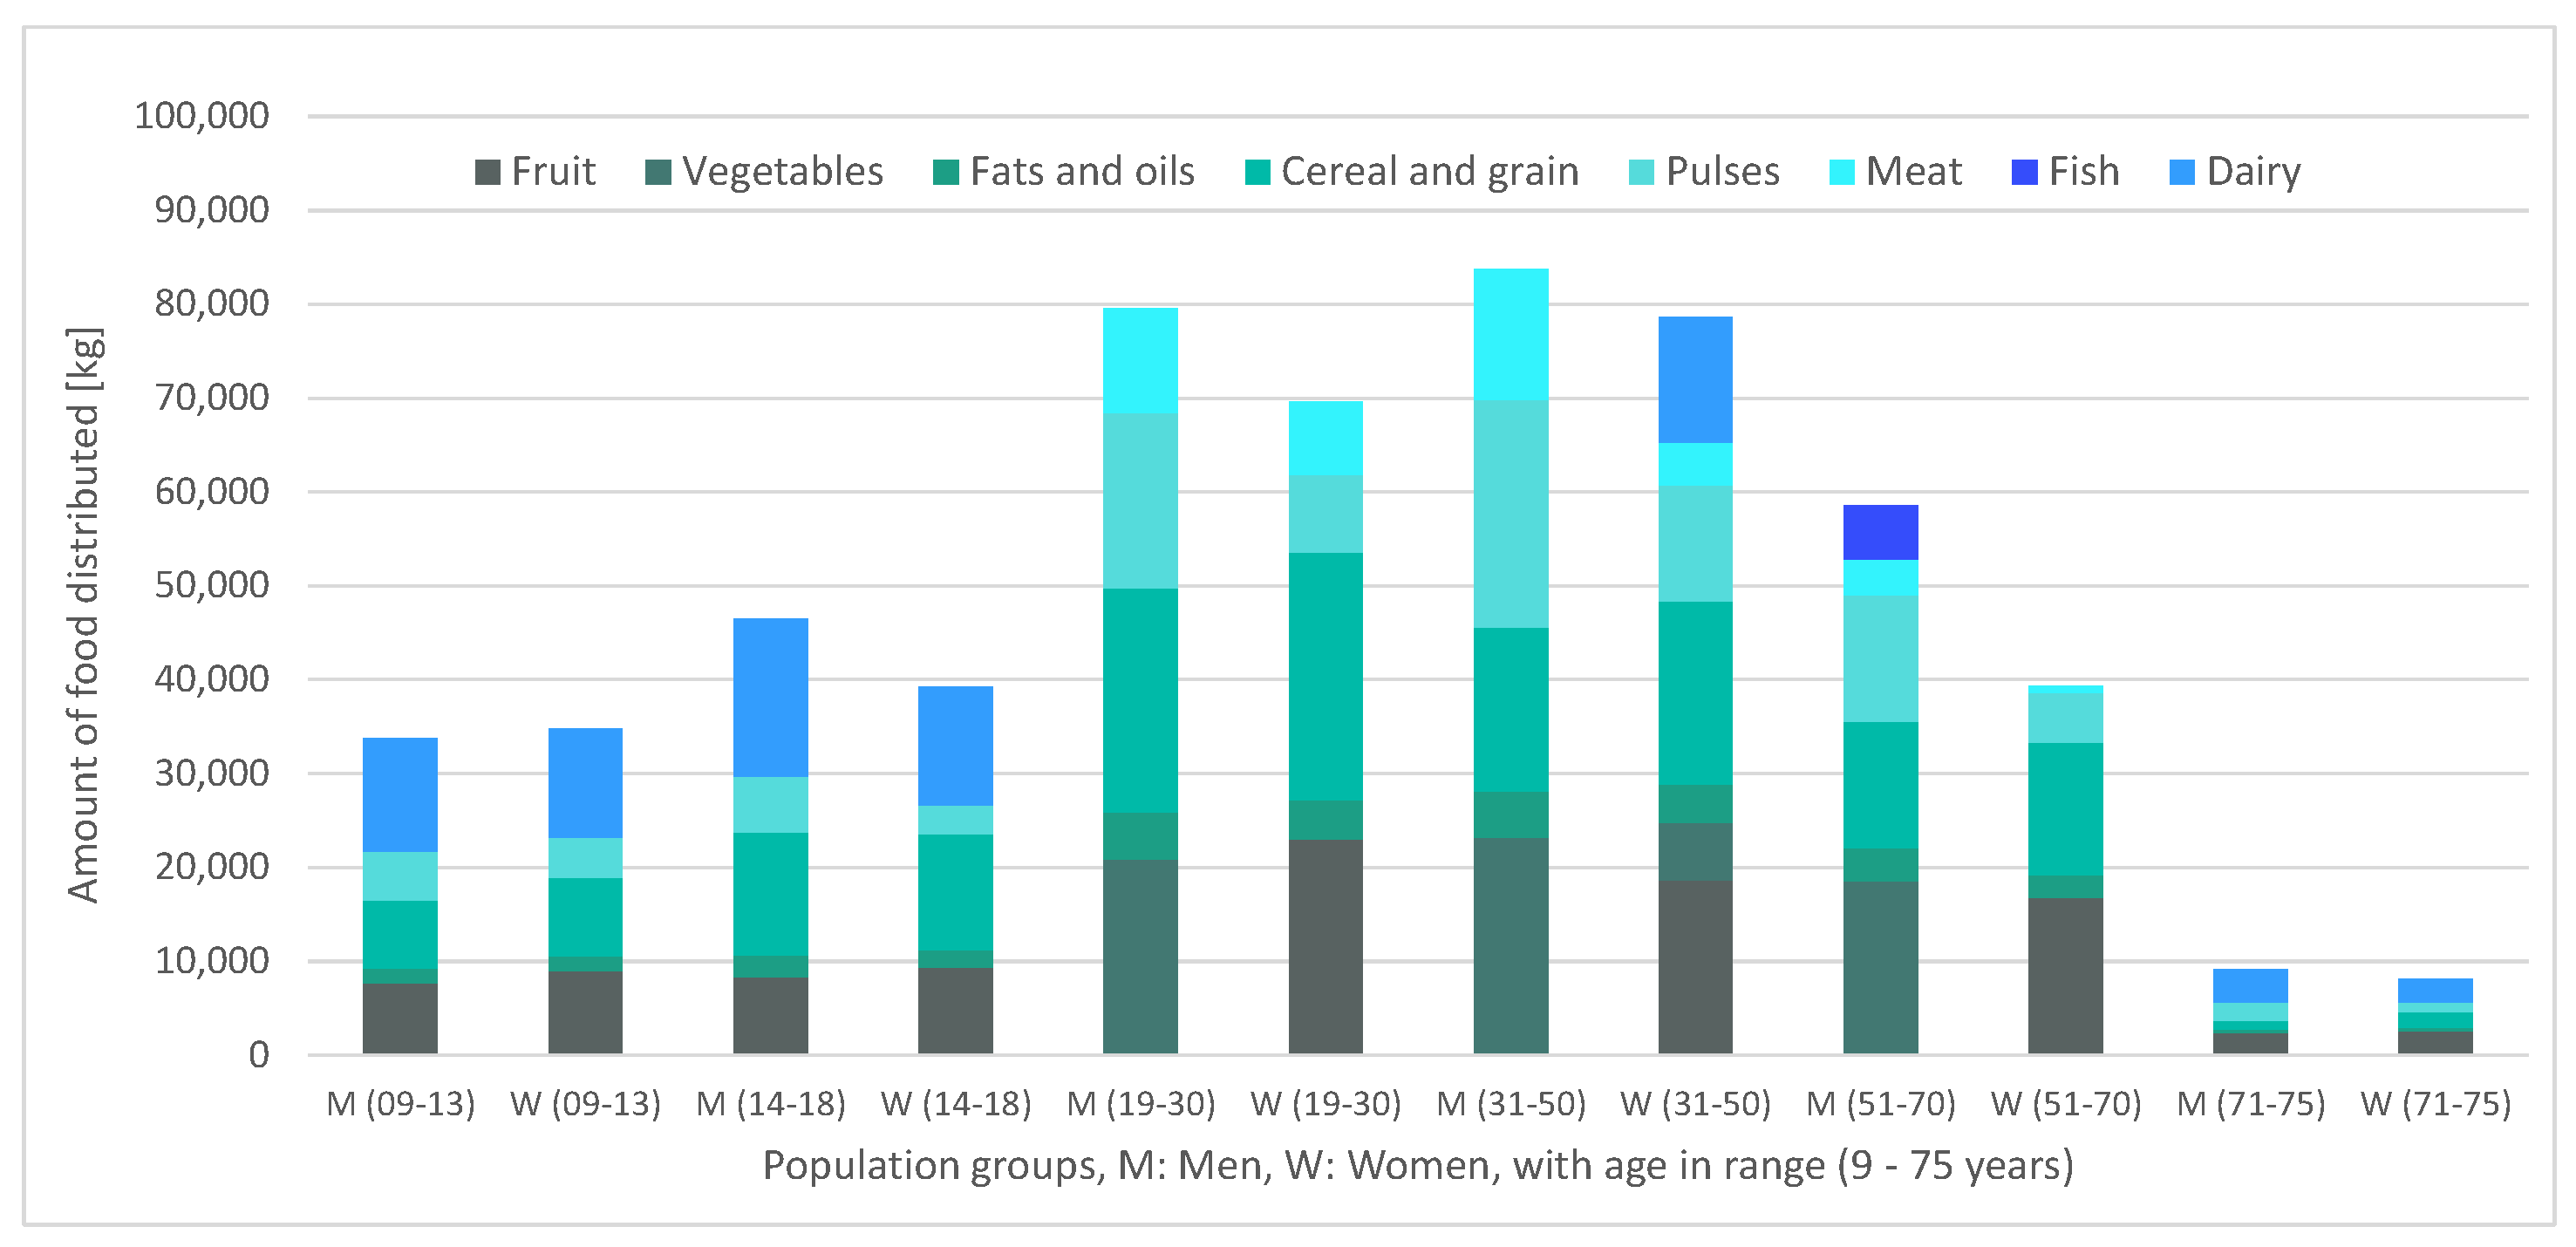
4.2. Outputs
5. Conclusions
- The distribution of macronutrients required by the minor population is easier to satisfy than that associated with older populations, and that of women is easier to satisfy than that of men.
- The use of a quantitative model to optimize food purchases in an organization such as the food bank of Madrid could help reducing costs by more than a 10%.
- There could be an alignment of objectives between the minimization of provisioning costs and the minimization of logistics costs (understood as warehousing and distribution), since optimizing supplies leads to a reduction in food supplies by 9%. This percentage quantifies the magnitude of inefficiencies of a partially decentralized system (where the food bank obtains relevant food amounts via the donations by third-party agents who do not know the number or beneficiaries) with respect to a centralized system (that has perfect information on beneficiary requirements to the fullest extent).
- Improve the social and cultural dimension of the approach by the representation of the sociological profiles of the different population groups, including individuals of foreign origin, since they habitually maintain the eating habits of their country and are at a greater risk of exclusion.
- Improve the economic dimension of the beneficiaries that might not have access to electricity and gas, which could lead to the consumption of ready-to-eat foods, which often have the worst nutritional composition, such as ultra-processed foods.
- Develop a more comprehensive chronological framework, which would allow one to consider that a large part of the donations take place only in certain peaks of the year. For example, the so called “Big Pickup” and FEAD operations. This would enable the production of a detailed analysis of other relevant activities in the value chain of the food bank of Madrid, such as storage and external logistics, and would therefore make the resulting model an even more powerful tool to detect strategic opportunities aligned with the 2030 Agenda for Sustainable Development. Adding locational information regarding donations but also storage facilities would complement chronology with valuable data and help to design better operational management strategies, and even alternative marketing strategies in the way donations are promoted.
- Analyze the detrimental impact of the absence (or excess) of the macronutrients studied, as well as of minerals (such as K, Na, Mg …) and vitamins (A, C …) (which in this work have been implicitly considered to be provided by fruit and vegetable consumption) on the beneficiaries, based on biological reasons such as the impact on the glycemic index and sanitary costs. Other nutritional recommendations such as, for example, those given in the NOVA framework [31], could be considered in this analysis.
Author Contributions
Funding
Acknowledgments
Conflicts of Interest
Nomenclature
| A. Sets, subsets and indexes | |
| a | Food groups |
| afva | Fruits and vegetables food groups |
| aAa | Food groups with animal proteins |
| aVa | Food groups with vegetal proteins |
| p | Population groups |
| r | Macronutrients (including energy) |
| B. Parameters and scalars (capital letters) | |
| NUTar | Nutritional contribution [kg/kg or kcal/kg] |
| NECpr | Nutritional requirements [kg/kg or kcal/kg] |
| PENp,r | Cost for non-supplied nutrient [EUR/kg or EUR/kcal] |
| PREa | Price [EUR/kg or EUR/kcal] |
| DONa | Donations [kg] |
| CARDp | # people [1, ∞) |
| CALr | # of kcal [kcal/kg] |
| MCALr | Maximum calories to be derived from a macronutrient [%] |
| QFVp | Minimum quantity of fruits and vegetables to be consumed [kg] |
| AVSPp | Minimum amount of animal proteins for the bioavailability of vegetal proteins [kg/kg] |
| C. Continuous positive variables (lower letters) | |
| ca | Food purchased by the food bank [kg] |
| sap | Food distributed to beneficiary groups [kg] |
| ea | Donation excess [kg] |
| cnspr | Non-supplied nutrients [kg or kcal] |
References
- El Banco de Alimentos recauda 1.300 toneladas en su “plan especial COVID-19”. Available online: https://www.lavanguardia.com/vida/20200512/481124895476/el-banco-de-alimentos-recauda-1300-toneladas-en-su-plan-especial-covid-19.html (accessed on 2 July 2020).
- Van Dooren, C. A Review of the Use of Linear Programming to Optimize Diets, Nutritiously, Economically and Environmentally. Front. Nutr. 2018, 5. [Google Scholar] [CrossRef] [PubMed]
- Darmon, N.; Ferguson, E.L.; Briend, A. A cost constraint alone has adverse effects on food selection and nutrient density: An analysis of human diets by linear programming. J. Nutr. 2002, 132, 3764–3771. [Google Scholar] [CrossRef] [PubMed]
- Darmon, N.; Ferguson, E.; Briend, A. Do economic constraints encourage the selection of energy dense diets? Appetite 2003, 41, 315–322. [Google Scholar] [CrossRef]
- Maillot, M.; Darmon, N.; Drewnowski, A. Are the lowest-cost healthful food plans culturally and socially acceptable? Public Health Nutr. 2010, 13, 1178–1185. [Google Scholar] [CrossRef] [PubMed]
- Jardim, J.G.; MendonçaVieira, R.A.; MagnoFernandes, A.; Araujo, R.; Glória, L.; Júnior, N.R.; Rocha, N.; Abreu, M.C. Application of a nonlinear optimization tool to balance diets with constant metabolizability. Livest. Sci. 2013, 158, 106–117. [Google Scholar] [CrossRef]
- Darmon, N.; Drewnowski, A. Does Social Class Predict Diet Quality? Am. J. Clin. Nutr. 2008, 87, 1107–1117. [Google Scholar] [CrossRef] [PubMed]
- Escuela Técnica Superior de Ingeniería Agronómica, Alimentaria y de Biosistemas. Chair of Food Bank. Available online: http://www.etsiaab.upm.es/Investigacion/Catedras_empresa?id=230334df780bc510VgnVCM10000009c7648a____&fmt=detail&prefmt=articulo (accessed on 2 July 2020).
- AMDR-Macronutrient Ranges and Recommendations. Available online: https://www.weightwatchers.com/us/blog/food/acceptable-macronutrient-distribution-range (accessed on 24 May 2020).
- Recommended Dietary Allowance—An overview|ScienceDirect Topics. Available online: https://www.sciencedirect.com/topics/food-science/recommended-dietary-allowance (accessed on 27 May 2020).
- WHO. WHO|Promoting Fruit and Vegetable Consumption around the World. Available online: https://www.who.int/dietphysicalactivity/fruit/en/ (accessed on 25 June 2020).
- CDC Press Releases. Available online: https://www.cdc.gov/media/releases/2017/p1116-fruit-vegetable-consumption.html (accessed on 25 June 2020).
- Fairweather-Tait, S.J.; Southon, S. Bioavailability of Nutrients. In Encyclopedia of Food Sciences and Nutrition, 2nd ed.; Caballero, B., Ed.; Academic Press: Oxford, UK, 2003; pp. 478–484. [Google Scholar]
- Darmon, N.; Drewnowski, A. Contribution of food prices and diet cost to socioeconomic disparities in diet quality and health: A systematic review and analysis. Nutr. Rev. 2015, 73, 643–660. [Google Scholar] [CrossRef]
- Dowler, E.; Barlösius, E.; Feichtinger, E. Poverty, food and nutrition. In Poverty and Food in Welfare Societies; Köhler, B.M., Feichtinger, E., Barlösius, E., Eds.; Sigma: Berlin, Germany, 1997; pp. 17–30. [Google Scholar]
- Møller, G.; Sluik, D.; Ritz, C.; Mikkilä, V.; Raitakari, O.T.; Hutri-Kähönen, N.; Dragsted, L.O.; Larsen, T.M.; Poppitt, S.D.; Silvestre, M.P.; et al. A Protein Diet Score, Including Plant and Animal Protein, Investigating the Association with HbA1c and eGFR—The PREVIEW Project. Nutrients 2017, 9, 763. [Google Scholar] [CrossRef]
- Song, M.; Fung, T.T.; Hu, F.B.; Willett, W.C.; Longo, W.D.; Chan, A.T.; Giovannucci, E.L. Animal and plant protein intake and all-cause and cause-specific mortality: Results from two prospective US cohort studies. JAMA Intern. Med. 2016, 176, 1453–1463. [Google Scholar] [CrossRef]
- Berrazaga, I.; Micard, V.; Gueugneau, M.; Walrand, S. The Role of the Anabolic Properties of Plant-Versus Animal-Based Protein Sources in Supporting Muscle Mass Maintenance: A Critical Review. Nutrients 2019, 11, 1825. [Google Scholar] [CrossRef]
- GAMS-Cutting Edge Modeling. Available online: https://www.gams.com/ (accessed on 19 July 2018).
- IBM CPLEX Optimizer-United States. Available online: https://www.ibm.com/software/commerce/optimization/cplex-optimizer/ (accessed on 3 July 2017).
- Anibes. Available online: https://www.fen.org.es/anibes/en/home/nav/inicio (accessed on 6 May 2020).
- INE. Personas por decil de renta por unidad de consumo, por edad y periodo. Base 2013 (10928). Available online: https://www.ine.es/jaxiT3/Tabla.htm?t=10928 (accessed on 27 May 2020).
- WHO. WHO|Nutrition. Available online: http://www.who.int/nutrition/en/ (accessed on 5 May 2020).
- Food and Agriculture Organization of the United Nations. About FAO. Available online: http://www.fao.org/about/en/ (accessed on 5 May 2020).
- Jameson, J.L.; Fauci, A.; Kasper, D.; Hauser, S.; Longo, D.; Loscalzo, J. Harrison’s Principles of Internal Medicine, 20th ed.; McGraw-Hill Education: New York, NY, USA, 2018. [Google Scholar]
- The National Academies Press. Food and Nutrition. Available online: http://www.nap.edu/topic/287/food-and-nutrition (accessed on 6 May 2020).
- WHO. WHO|Human Energy Requirements. Available online: https://www.who.int/nutrition/publications/nutrientrequirements/9251052123/en/ (accessed on 27 May 2020).
- Drewnowski, A. The cost of US foods as related to their nutritive value. Am. J. Clin. Nutr. 2010, 92, 1181–1188. [Google Scholar] [CrossRef] [PubMed]
- Banco de Alimentos de Madrid. Available online: https://bamadrid.org/transparencia/ (accessed on 27 May 2020).
- Fondo Europeo de Ayuda a Desfavorecidos (FEAD). Fundación Banco de Alimentos de Valladolid, 08 June 2016. Available online: https://www.bancodealimentosdevalladolid.es/distribucion/fondo-europeo-ayuda-desfavorecidos-fead (accessed on 8 May 2020).
- Ultra-Processed Foods, Diet Quality, and Health Using the NOVA Classification System|Global Forum on Food Security and Nutrition (FSN Forum). Available online: http://www.fao.org/fsnforum/resources/fsn-resources/ultra-processed-foods-diet-quality-and-health-using-nova-classification (accessed on 20 October 2020).


| [Years] | [kg/Week] | [kcal/Week] | ||||||
|---|---|---|---|---|---|---|---|---|
| Sex | Age | Carbohydrates | Fibre | Lipids | Linoleic Acid (ω-6) | Alfalinoleic Acid (ω-3) | Protein | Energy |
| Men | 9–13 | 0.910 | 0.217 | 0.389 | 0.084 | 0.008 | 0.238 | 17,500 |
| 14–18 | 0.910 | 0.266 | 0.529 | 0.112 | 0.011 | 0.364 | 23,800 | |
| 19–30 | 0.910 | 0.266 | 0.436 | 0.119 | 0.011 | 0.392 | 19,600 | |
| 31–50 | 0.910 | 0.266 | 0.389 | 0.119 | 0.011 | 0.392 | 17,500 | |
| 51–70 | 0.910 | 0.210 | 0.319 | 0.098 | 0.011 | 0.392 | 14,350 | |
| >70 | 0.910 | 0.210 | 0.311 | 0.098 | 0.011 | 0.392 | 14,000 | |
| Women | 9–13 | 0.910 | 0.182 | 0.342 | 0.070 | 0.007 | 0.238 | 15,400 |
| 14–18 | 0.910 | 0.182 | 0.389 | 0.077 | 0.008 | 0.322 | 17,500 | |
| 19–30 | 0.910 | 0.175 | 0.342 | 0.084 | 0.008 | 0.322 | 15,400 | |
| 31–50 | 0.910 | 0.175 | 0.303 | 0.084 | 0.008 | 0.322 | 13,650 | |
| 51–70 | 0.910 | 0.147 | 0.272 | 0.077 | 0.008 | 0.322 | 12,250 | |
| >70 | 0.910 | 0.147 | 0.264 | 0.077 | 0.008 | 0.322 | 11,900 | |
| Food Groups | Carbohydrates [g] | Fibre [g] | Lipids [g] | Linoleic Acid (ω-6) [g] | Alfalinoleic Acid (ω-3) [g] | Protein [g] | Water [mL] | Sum of Contributions [g] | Energy [kcal] |
|---|---|---|---|---|---|---|---|---|---|
| Cereal | 577.618 | 32.239 | 51.427 | 6.935 | 0.433 | 82.377 | 232.758 | 976.419 | 3155.225 |
| Vegetables | 81.235 | 17.195 | 2.636 | 0.216 | 0.094 | 16.151 | 831.503 | 948.720 | 416.208 |
| Fruit | 107.254 | 15.374 | 10.236 | 1.126 | 0.104 | 9.974 | 684.000 | 826.838 | 605.806 |
| Fats and oils | 0.725 | 0.000 | 983.234 | 84.566 | 3.854 | 0.874 | 31.796 | 1016.629 | 8699.919 |
| Dairy | 69.209 | 0.192 | 39.697 | 4.185 | 0.642 | 48.233 | 916.600 | 1073.931 | 806.022 |
| Fish | 2.161 | 0.000 | 54.748 | 18.279 | 5.602 | 131.863 | 598.335 | 787.106 | 1069.889 |
| Meat | 3.602 | 0.000 | 113.909 | 27.821 | 3.224 | 159.899 | 659.222 | 936.632 | 1777.112 |
| Eggs | 0.000 | 0.000 | 96.833 | 7.723 | 0.729 | 114.970 | 734.555 | 946.357 | 1313.059 |
| Pulses | 415.151 | 82.418 | 26.448 | 4.219 | 0.036 | 170.941 | 258.464 | 953.422 | 2814.574 |
| Food Groups | Carbohydrates [g] | Fibre [g] | Lipids [g] | Linoleic Acid (ω-6) [g] | Alfalinoleic Acid (ω-3) [g] | Protein [g] | Water [mL] | Sum of Contributions [g] | Energy [kcal] |
|---|---|---|---|---|---|---|---|---|---|
| Cereal | 591.568 | 33.017 | 52.669 | 7.102 | 0.444 | 84.367 | 238.379 | 1000 | 3231.424 |
| Vegetables | 85.626 | 18.125 | 2.778 | 0.228 | 0.099 | 17.024 | 876.447 | 1000 | 438.705 |
| Fruit | 129.716 | 18.594 | 12.380 | 1.362 | 0.125 | 12.063 | 827.248 | 1000 | 732.678 |
| Fats and oils | 0.713 | 0.000 | 967.151 | 83.183 | 3.791 | 0.860 | 31.276 | 1000 | 8557.613 |
| Dairy | 64.445 | 0.178 | 36.964 | 3.897 | 0.598 | 44.913 | 853.500 | 1000 | 750.534 |
| Fish | 2.745 | 0.000 | 69.556 | 23.223 | 7.117 | 167.528 | 760.171 | 1000 | 1359.269 |
| Meat | 3.846 | 0.000 | 121.615 | 29.703 | 3.442 | 170.717 | 703.822 | 1000 | 1897.343 |
| Eggs | 0.000 | 0.000 | 102.321 | 8.161 | 0.770 | 121.487 | 776.192 | 1000 | 1387.487 |
| Pulses | 435.433 | 86.444 | 27.740 | 4..425 | 0..038 | 179..292 | 271.091 | 1000 | 2952.075 |
| Food Group | [EUR/100g] |
|---|---|
| Cereal | 0.270 |
| Vegetables | 0.119 |
| Fruit | 0.101 |
| Fats and oils | 0.317 |
| Dairy | 0.240 |
| Fish | 0.318 |
| Meat | 0.318 |
| Eggs | 0.200 |
| Pulses | 0.290 |
| Sociological Groups | [People] |
|---|---|
| Men aged between 9–13 years | 7664 |
| Women aged between 9–13 years | 8920 |
| Men aged between 14–18 years | 8292 |
| Women aged between 14–18 years | 9317 |
| Men aged between 19–30 years | 20,905 |
| Women aged between 19–30 years | 22,996 |
| Men aged between 31–50 years | 23,217 |
| Women aged between 31–50 years | 24,784 |
| Men aged between 51–70 | 18,543 |
| Women aged between 51–70 | 16,774 |
| Men aged between 70–75 | 2362 |
| Women aged between 70–75 | 2563 |
| Food Group | [kg/Week] |
|---|---|
| Cereal and grain | 51,667 |
| Vegetables | 68,820 |
| Fruit | 93,989 |
| Fats and oils | 12,519 |
| Dairy | 72,742 |
| Fish | 5790 |
| Meat | 3712 |
| Eggs | 0 |
| Pulses | 13,178 |
Publisher’s Note: MDPI stays neutral with regard to jurisdictional claims in published maps and institutional affiliations. |
© 2020 by the authors. Licensee MDPI, Basel, Switzerland. This article is an open access article distributed under the terms and conditions of the Creative Commons Attribution (CC BY) license (http://creativecommons.org/licenses/by/4.0/).
Share and Cite
Castañón, R.; Campos, F.A.; Doménech Martínez, S.; Villar, J. The Food Bank of Madrid: A Linear Model for Optimal Nutrition. Int. J. Environ. Res. Public Health 2020, 17, 8097. https://doi.org/10.3390/ijerph17218097
Castañón R, Campos FA, Doménech Martínez S, Villar J. The Food Bank of Madrid: A Linear Model for Optimal Nutrition. International Journal of Environmental Research and Public Health. 2020; 17(21):8097. https://doi.org/10.3390/ijerph17218097
Chicago/Turabian StyleCastañón, Rosendo, Fco. Alberto Campos, Salvador Doménech Martínez, and José Villar. 2020. "The Food Bank of Madrid: A Linear Model for Optimal Nutrition" International Journal of Environmental Research and Public Health 17, no. 21: 8097. https://doi.org/10.3390/ijerph17218097
APA StyleCastañón, R., Campos, F. A., Doménech Martínez, S., & Villar, J. (2020). The Food Bank of Madrid: A Linear Model for Optimal Nutrition. International Journal of Environmental Research and Public Health, 17(21), 8097. https://doi.org/10.3390/ijerph17218097