Protocols for Monitoring Harmful Algal Blooms for Sustainable Aquaculture and Coastal Fisheries in Chile

 , , , , , ,
  ,
,  ,
,  ,
,  and
and
Abstract
1. Introduction
2. Materials and Methods
2.1. Sampling
2.1.1. Sample Collection
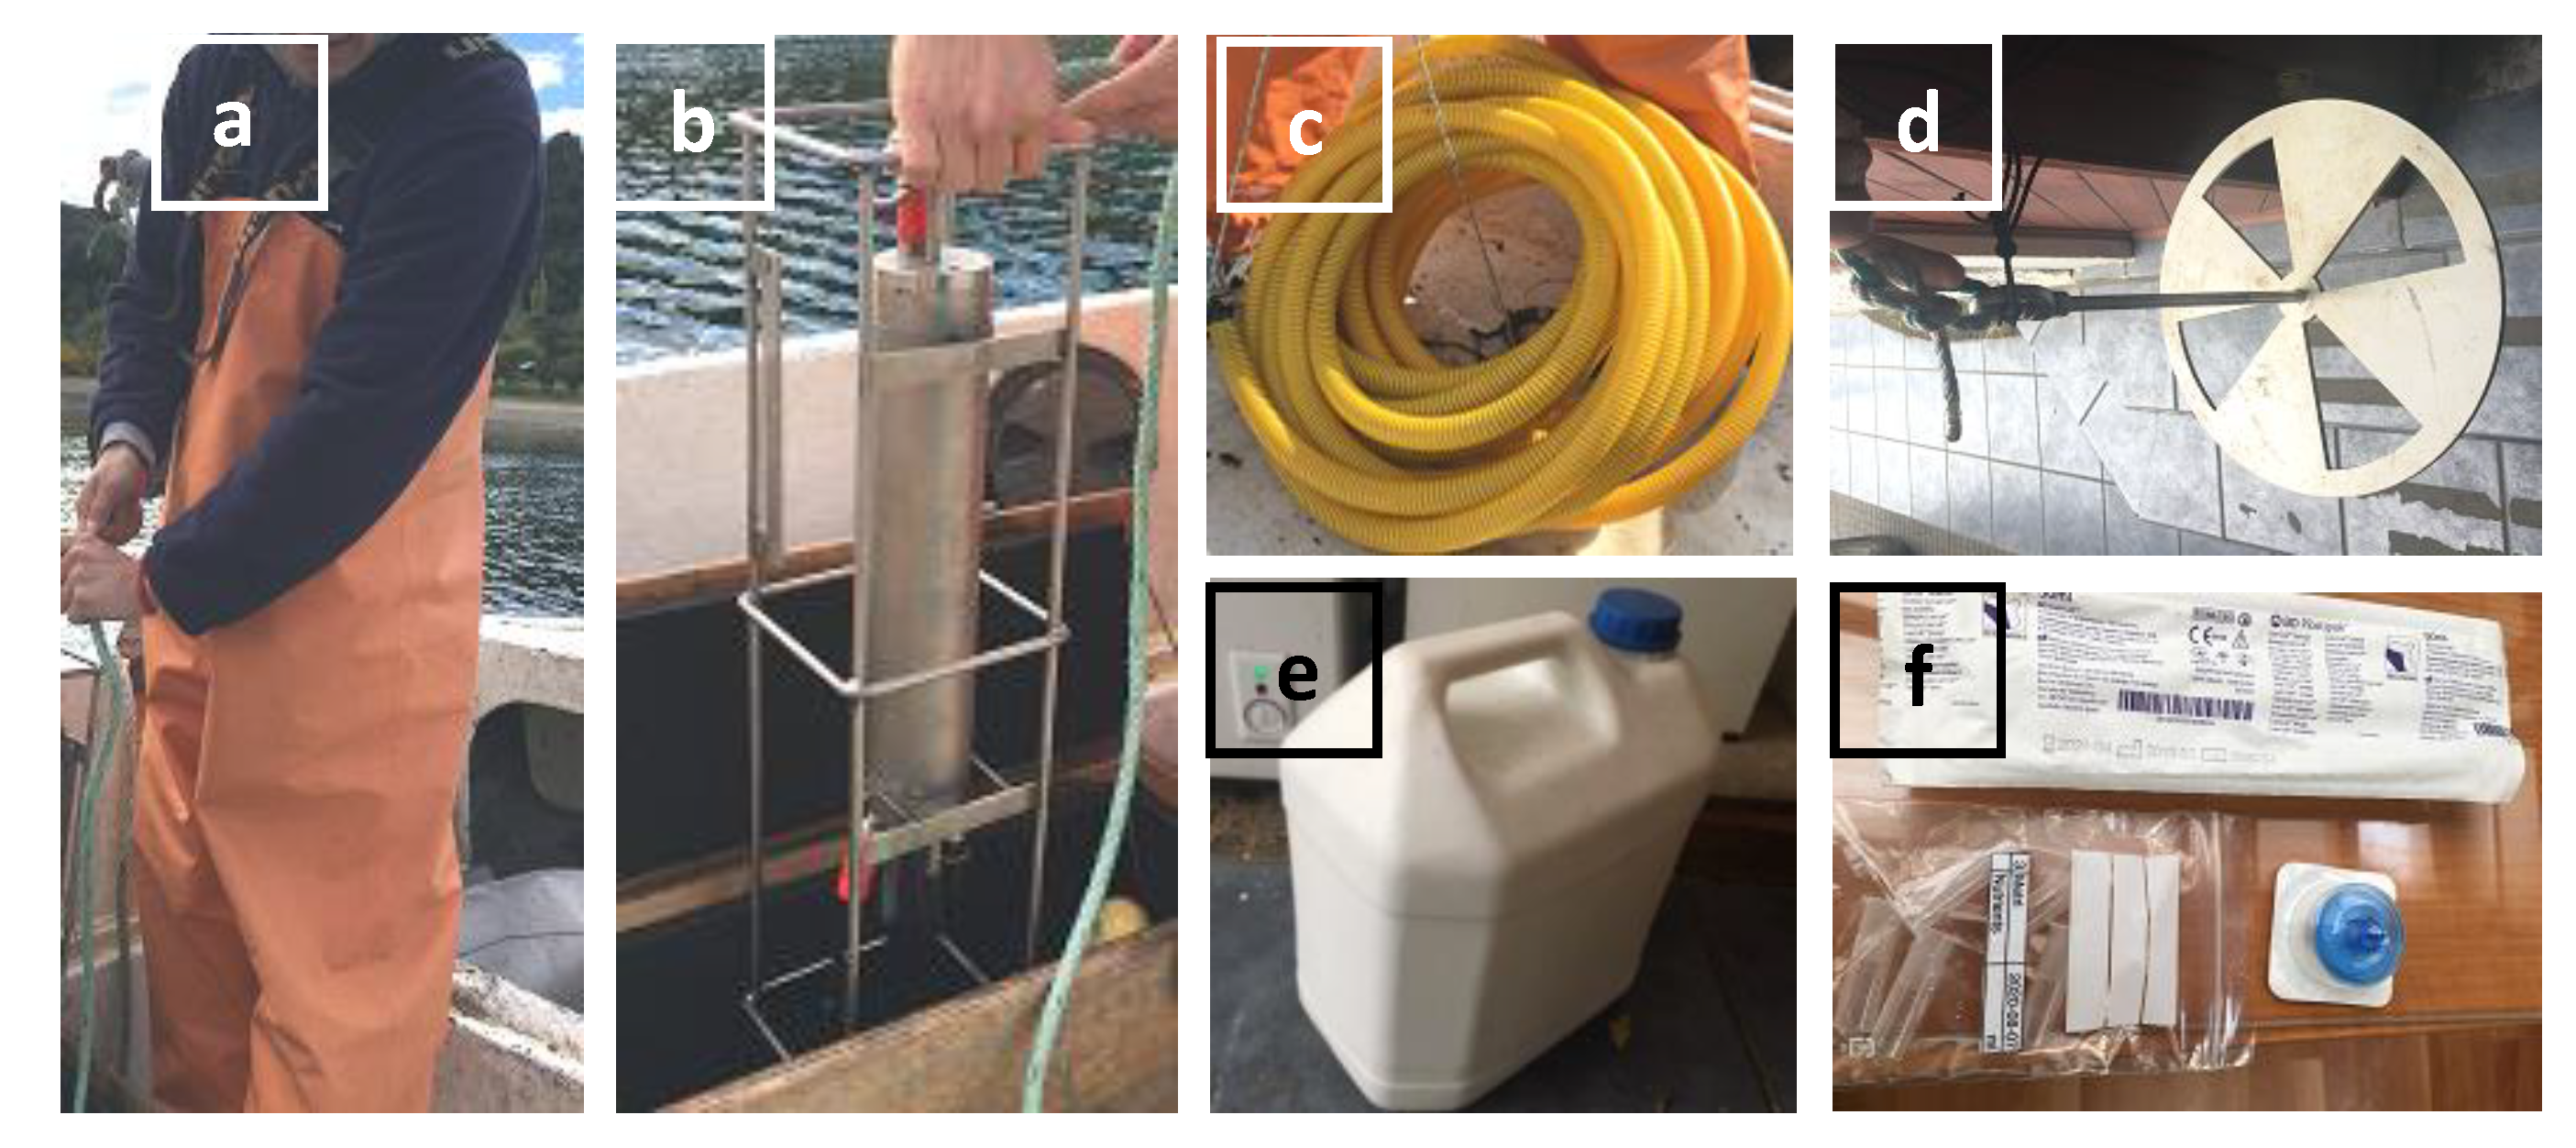
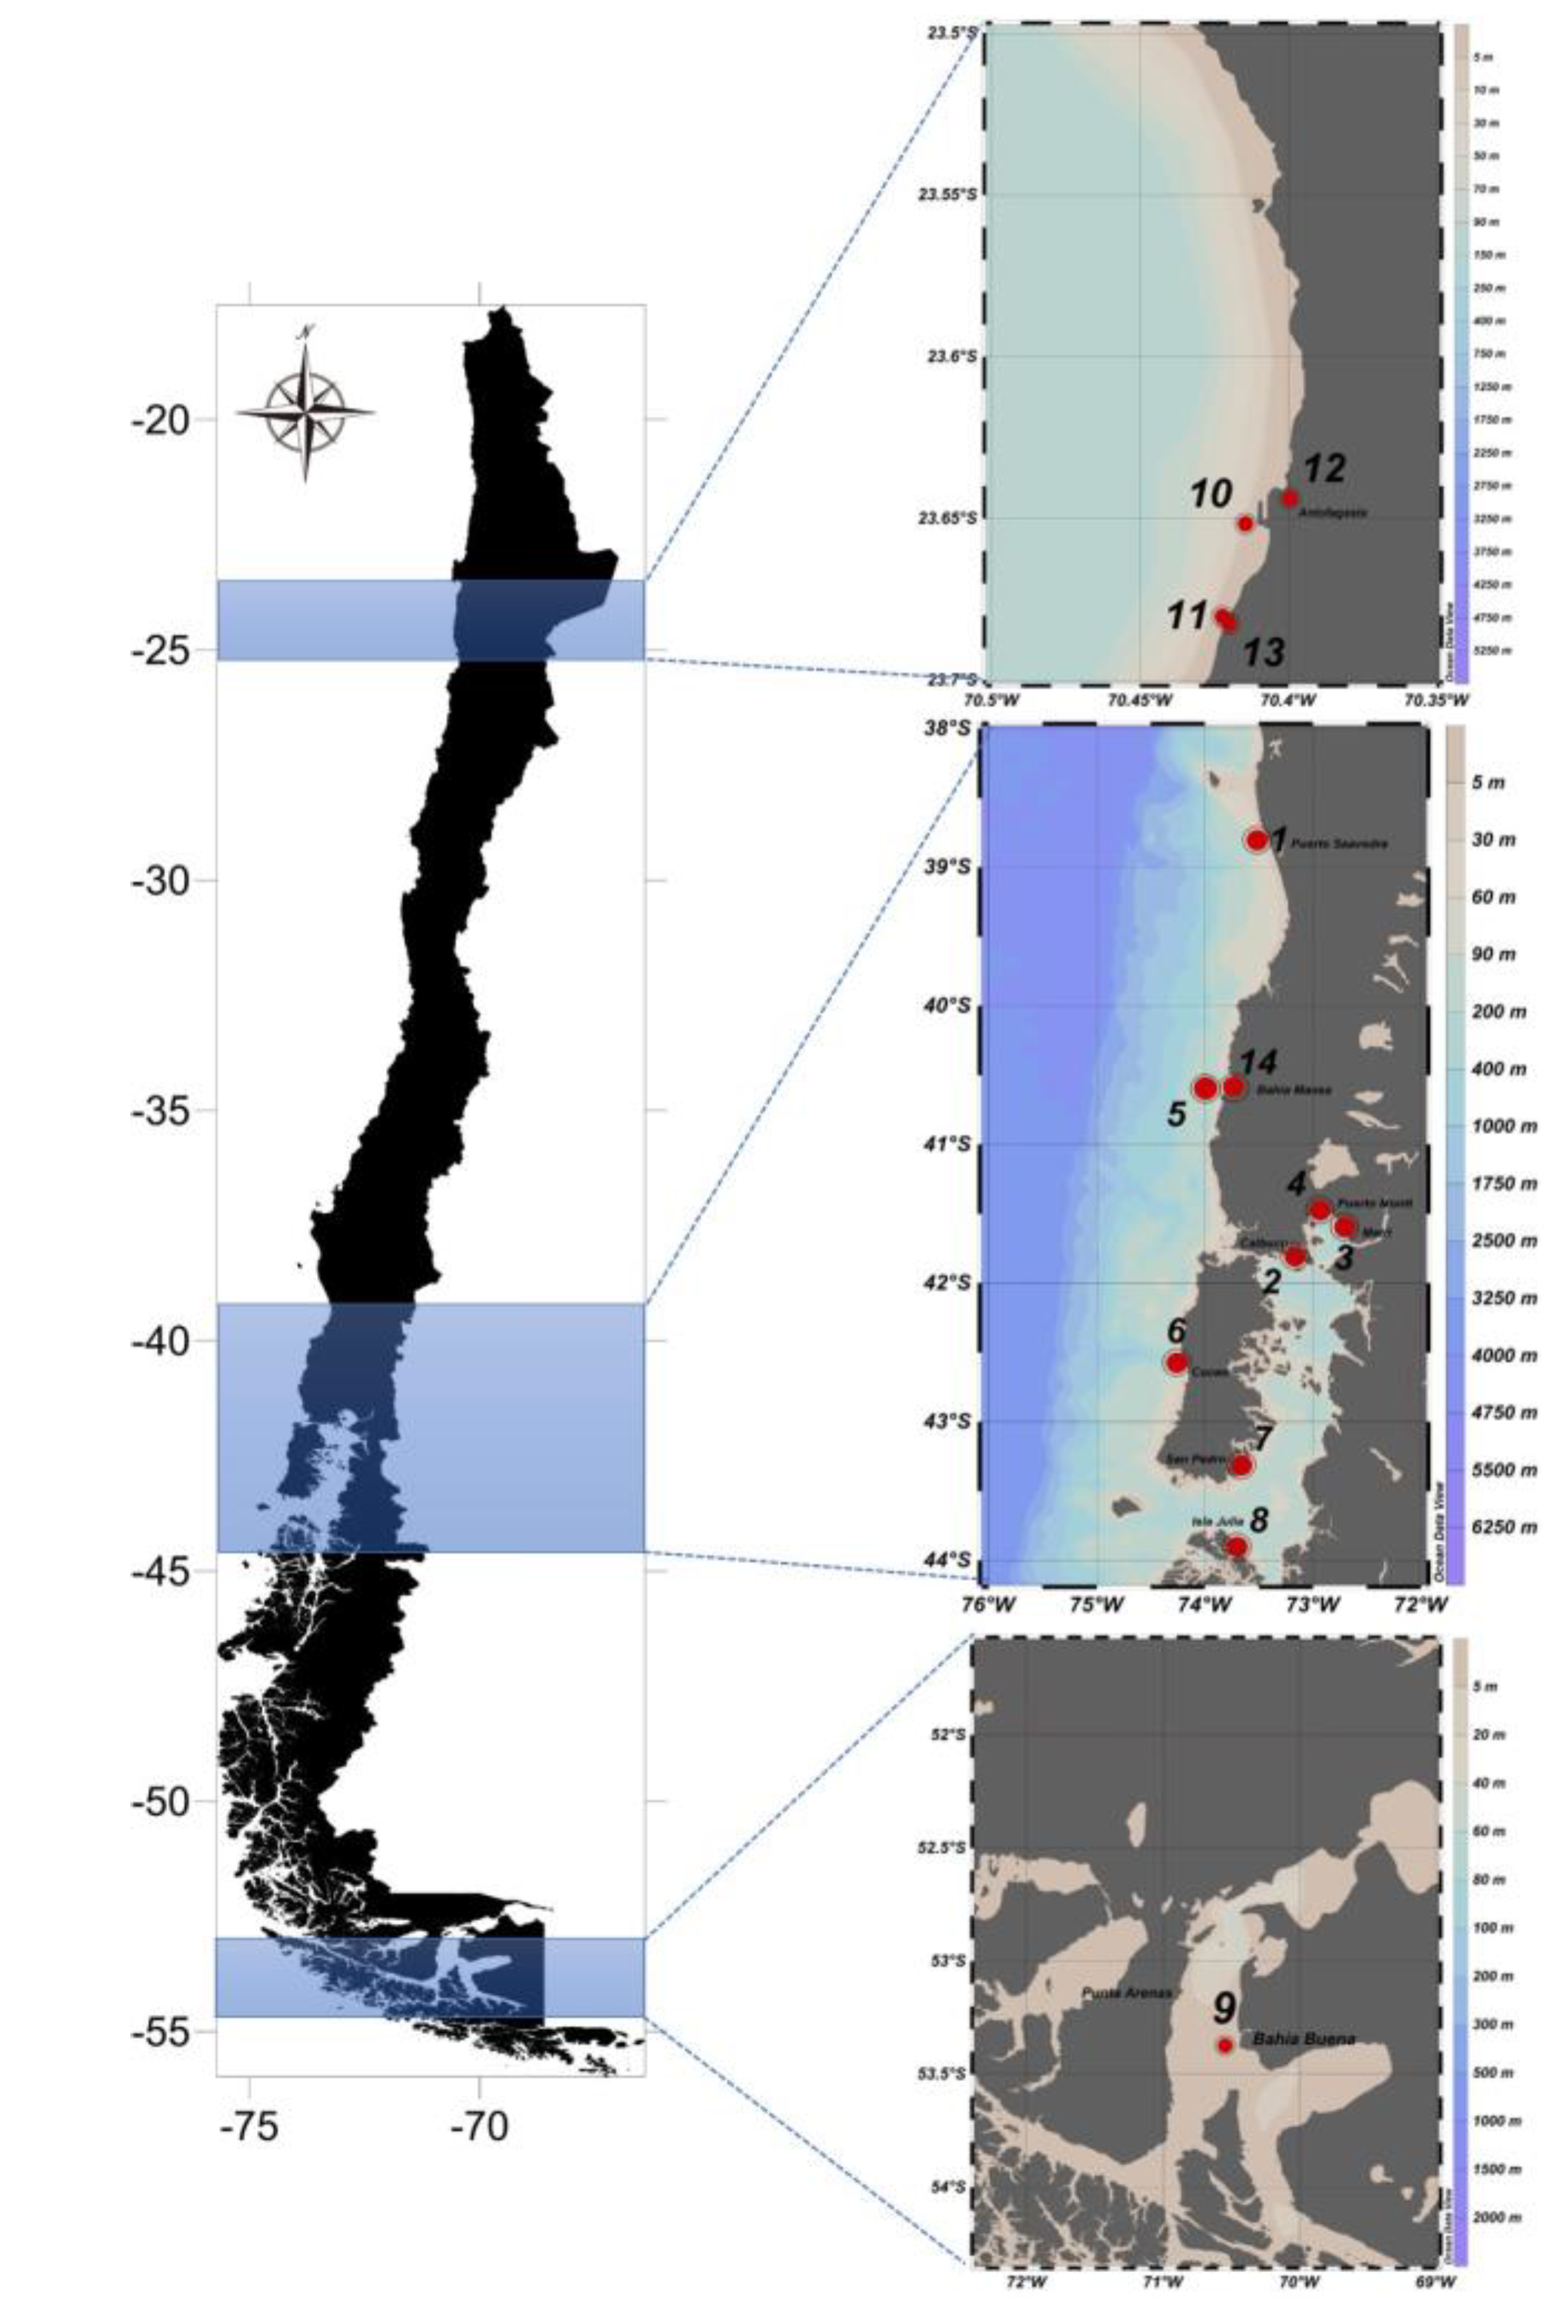
- Prepare materials and devices as in Figure 1. Go to sampling points using the GPS coordinator for precise identification of sampling points. Figure 2 shows the 14 stations to be monitored for our prospective project. In the present report, a pilot study was performed at station 3 (Metri) to justify our protocols.
- Deploy a CTD (an oceanography instrument to measure conductivity, temperature, and pressure of seawater as a function of depth) to a 3-m depth and stabilize it for 5 min. Pull the CTD to the surface quickly and deploy it back to each station’s maximum depth. Pull the CTD from the depth to surface to collect the value of temperature, salinity, dissolved oxygen (DO), and chlorophyll-a (chl-a) as a depth function. Report average of values collected from 0 to 10-m depth.
- Deploy a Secchi disc slowly by 1-m increment until the disc ceases to be visible from the surface. Record the depth of transparency of water.
2.1.2. Water Sample for Assays
2.1.3. Water Sample for Nutrient Analysis
2.2. Sample Treatment
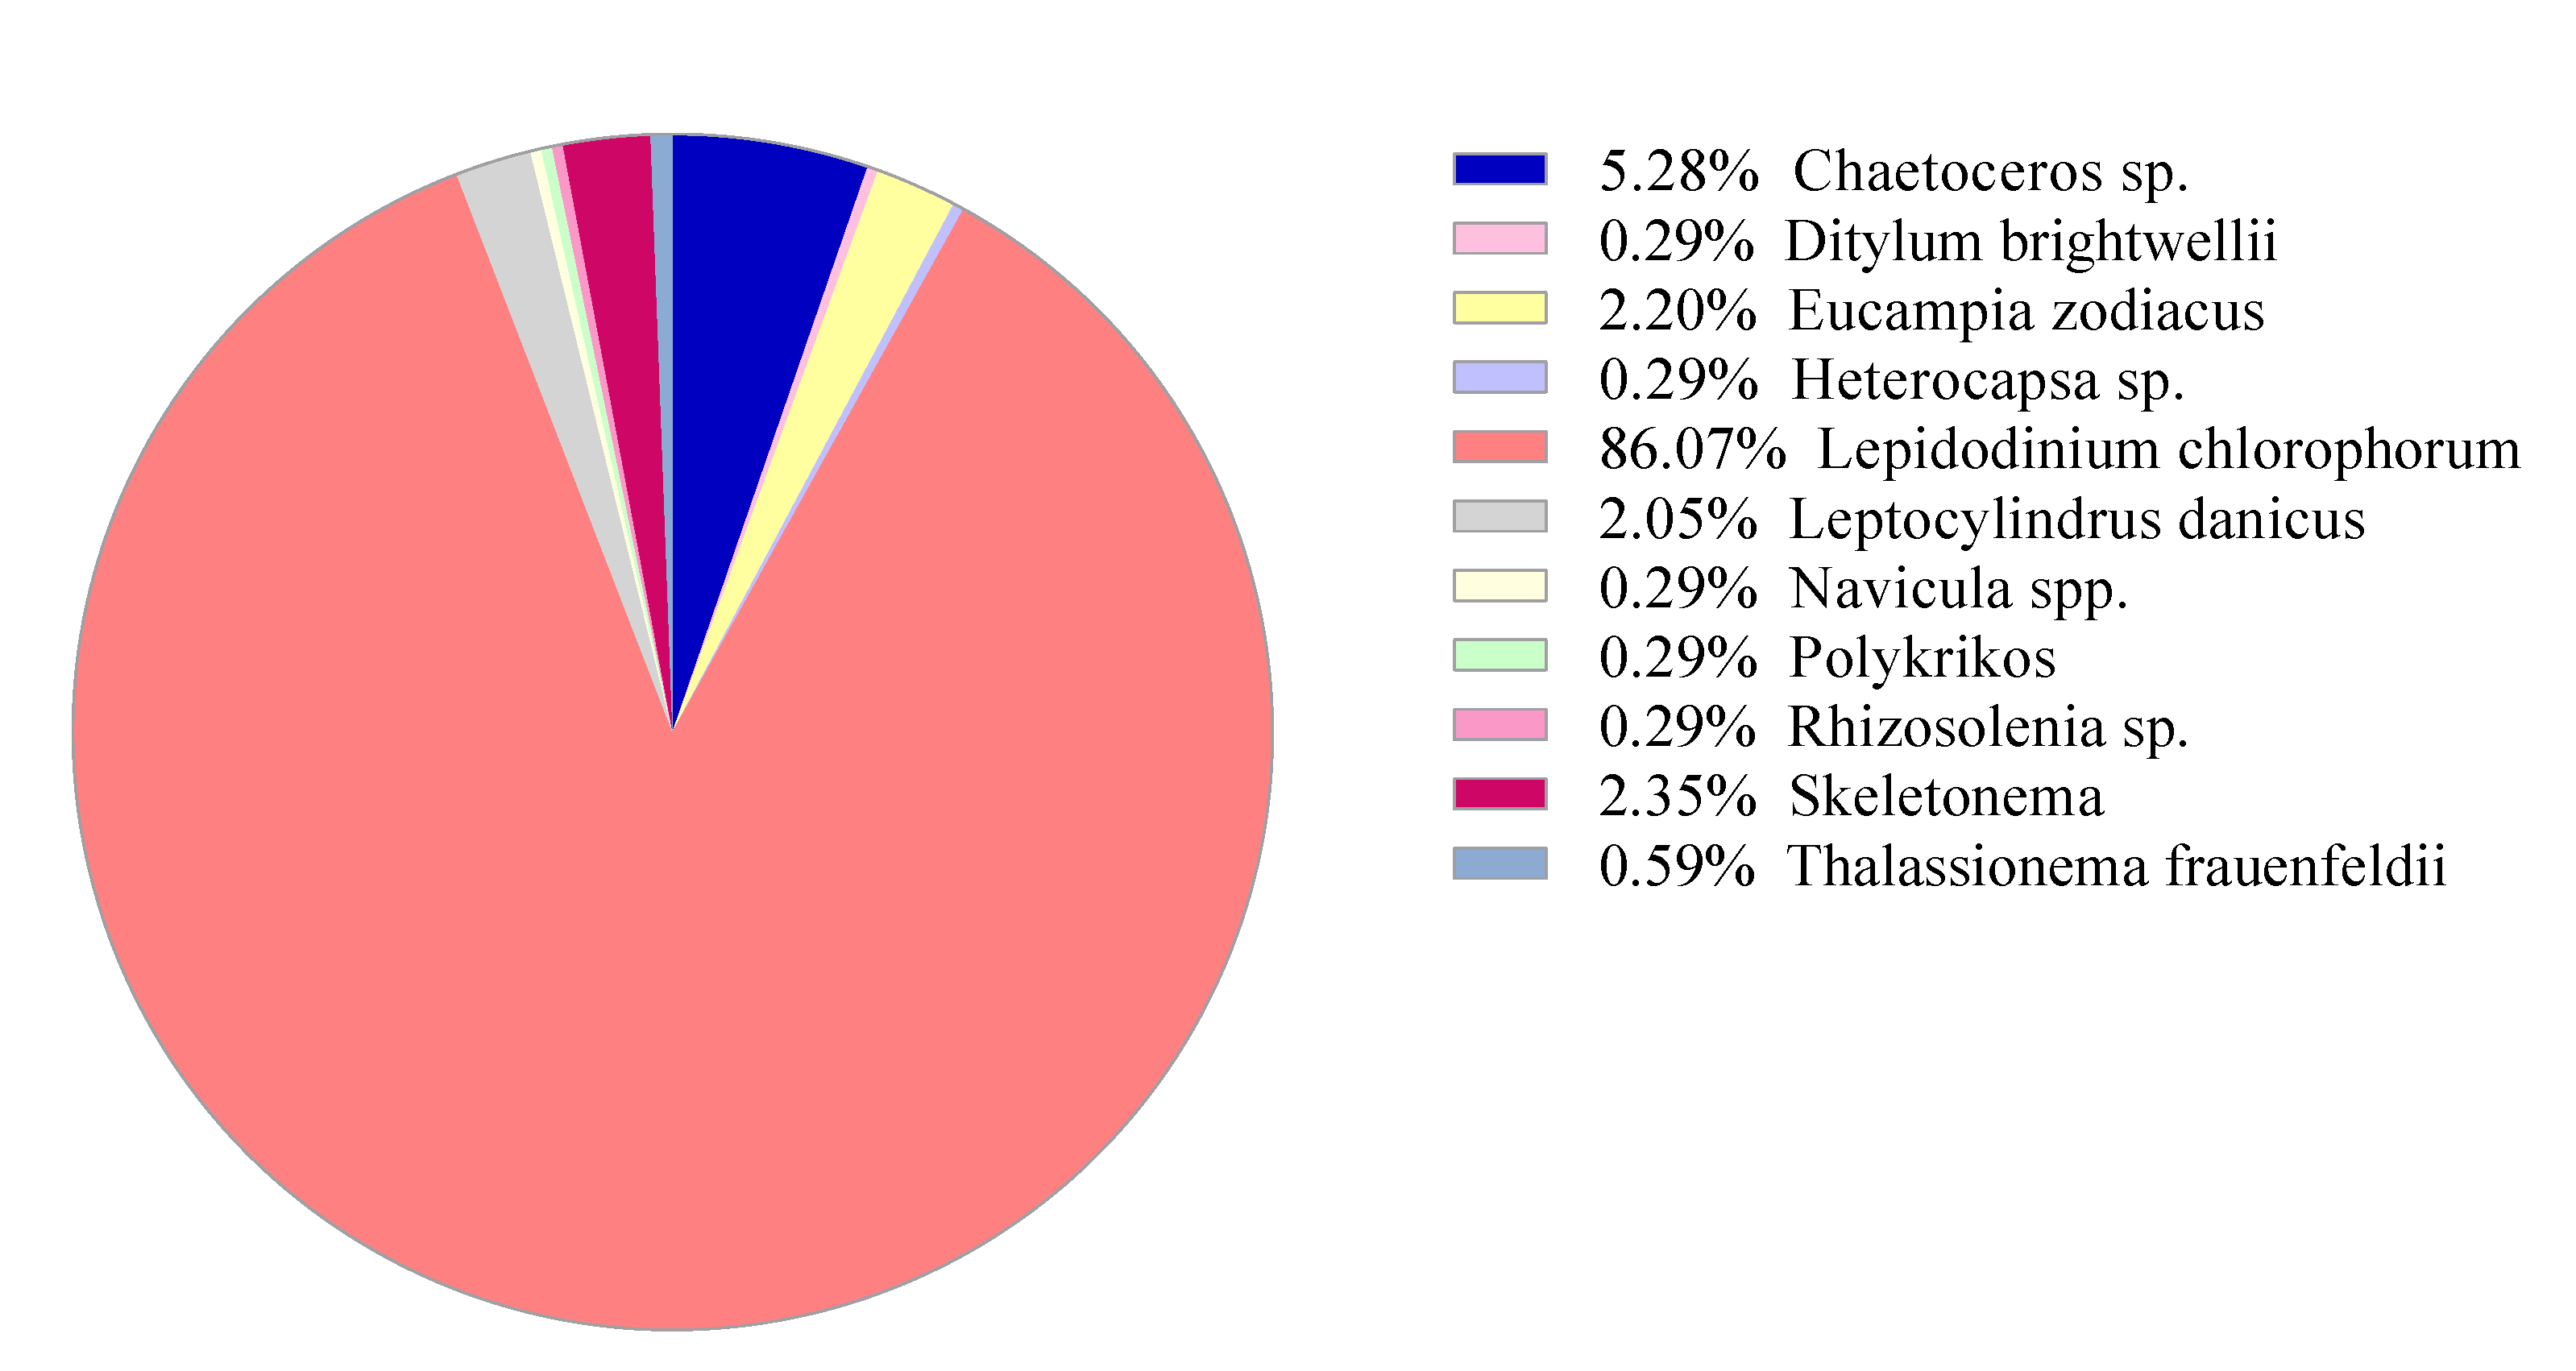
2.2.1. Phytoplankton Identification and Quantification
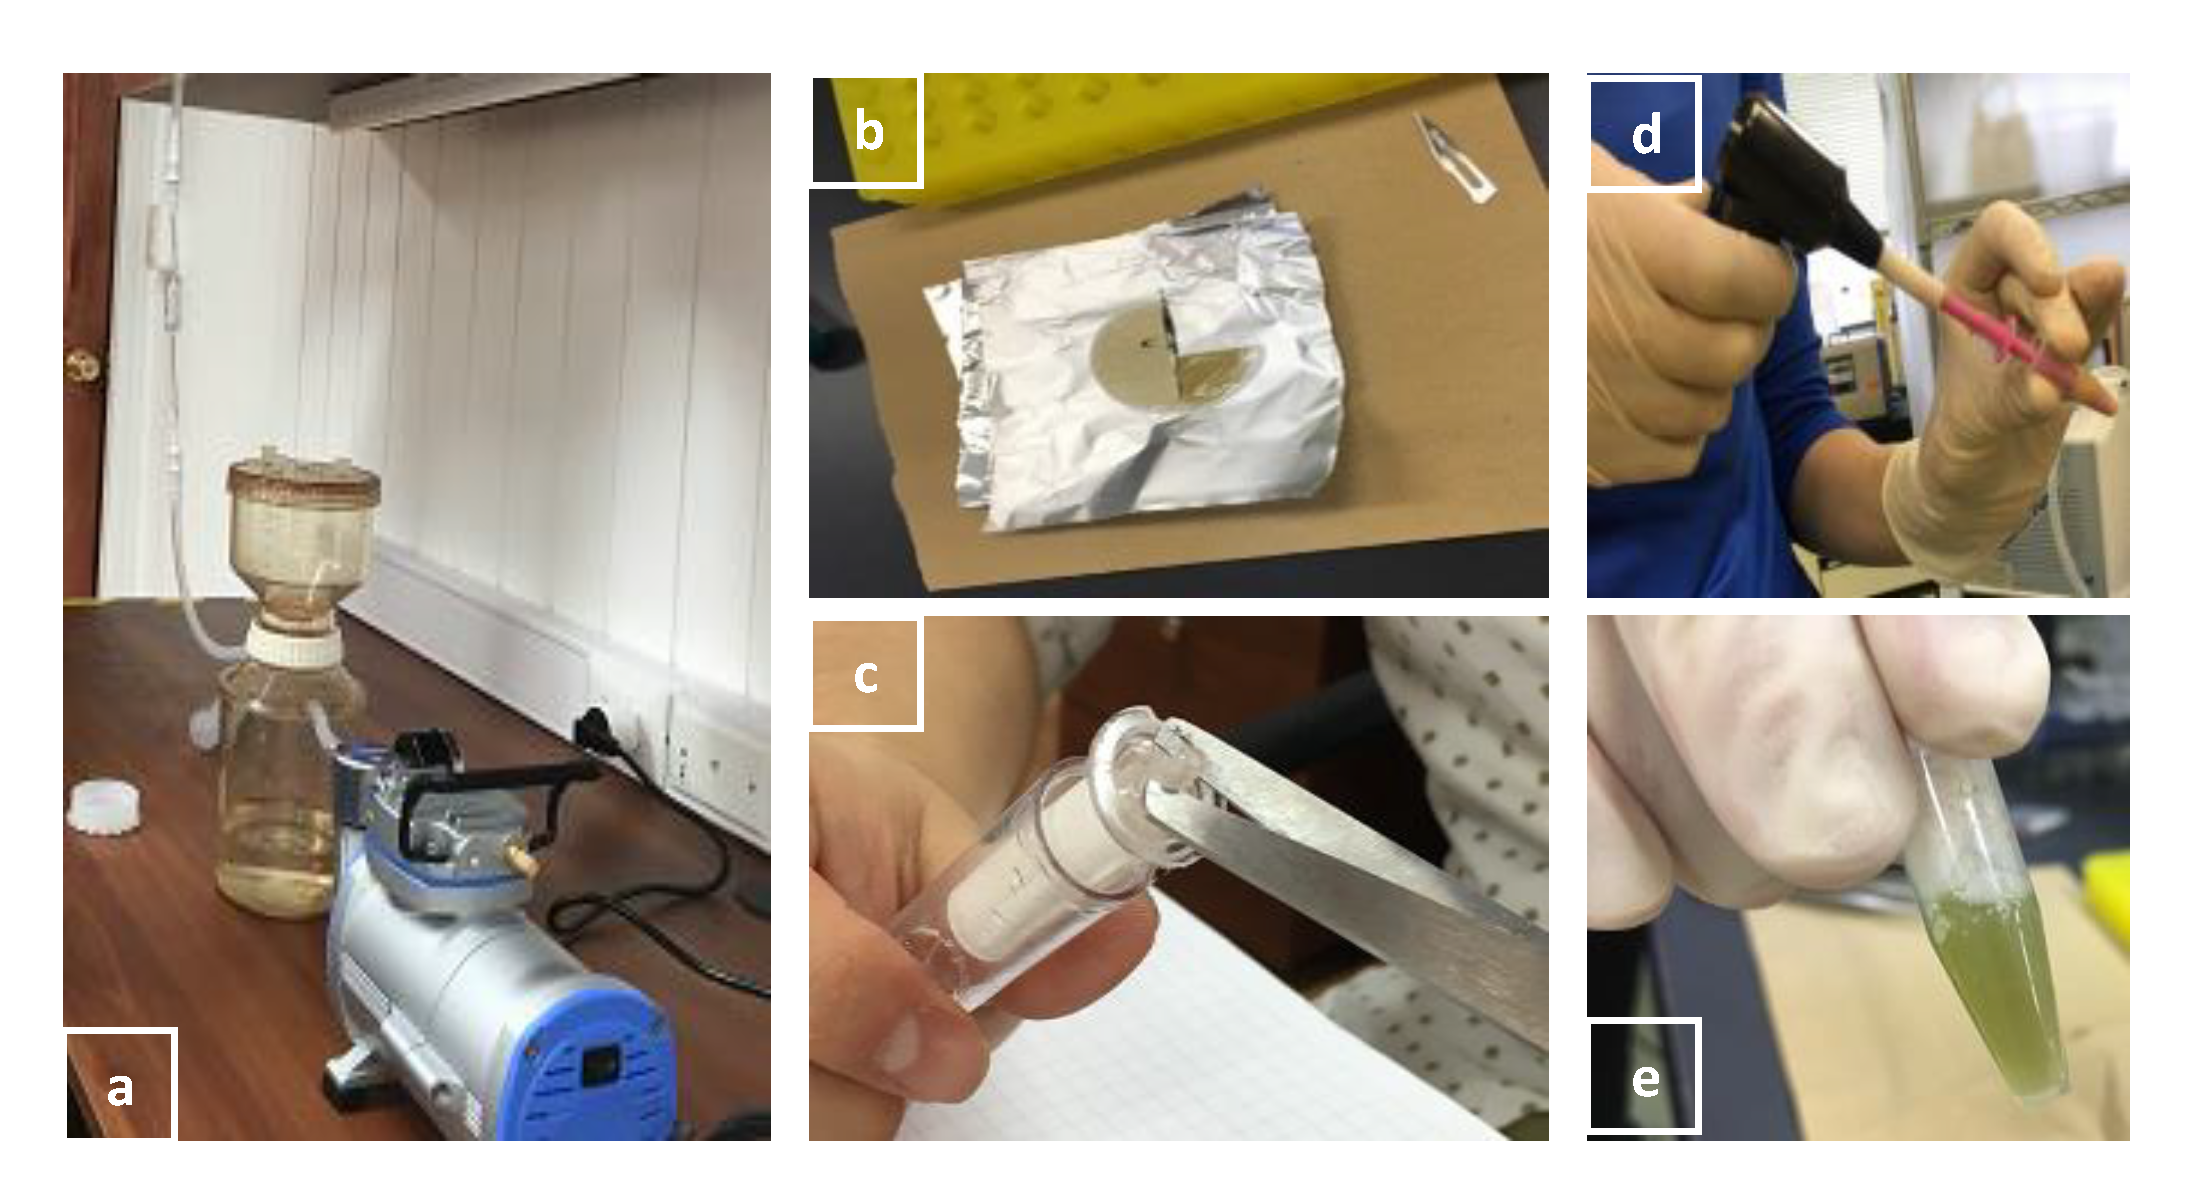
- Filter 200 mL water sample through 1 μm membrane slowly. Do not apply a vacuum too high. Stop the vacuum, while the filtration bottle top still contains 8–12 mL of the water sample. Collect the concentrated water sample on the filtration bottle top using a pipette. Transfer 8–12 mL concentrated sample to a 15-mL plastic centrifuge tube.
- Add 100 μL of Lugol to fix the sample. Keep at 5 °C for storage. Identify and count phytoplankton species in a 1-mL grid-slide glass (Sedgewick Rafter counting chamber) under a microscope per our phytoplankton naming dictionary (Table S1).
2.2.2. Sample Treatment for Pigment Analysis
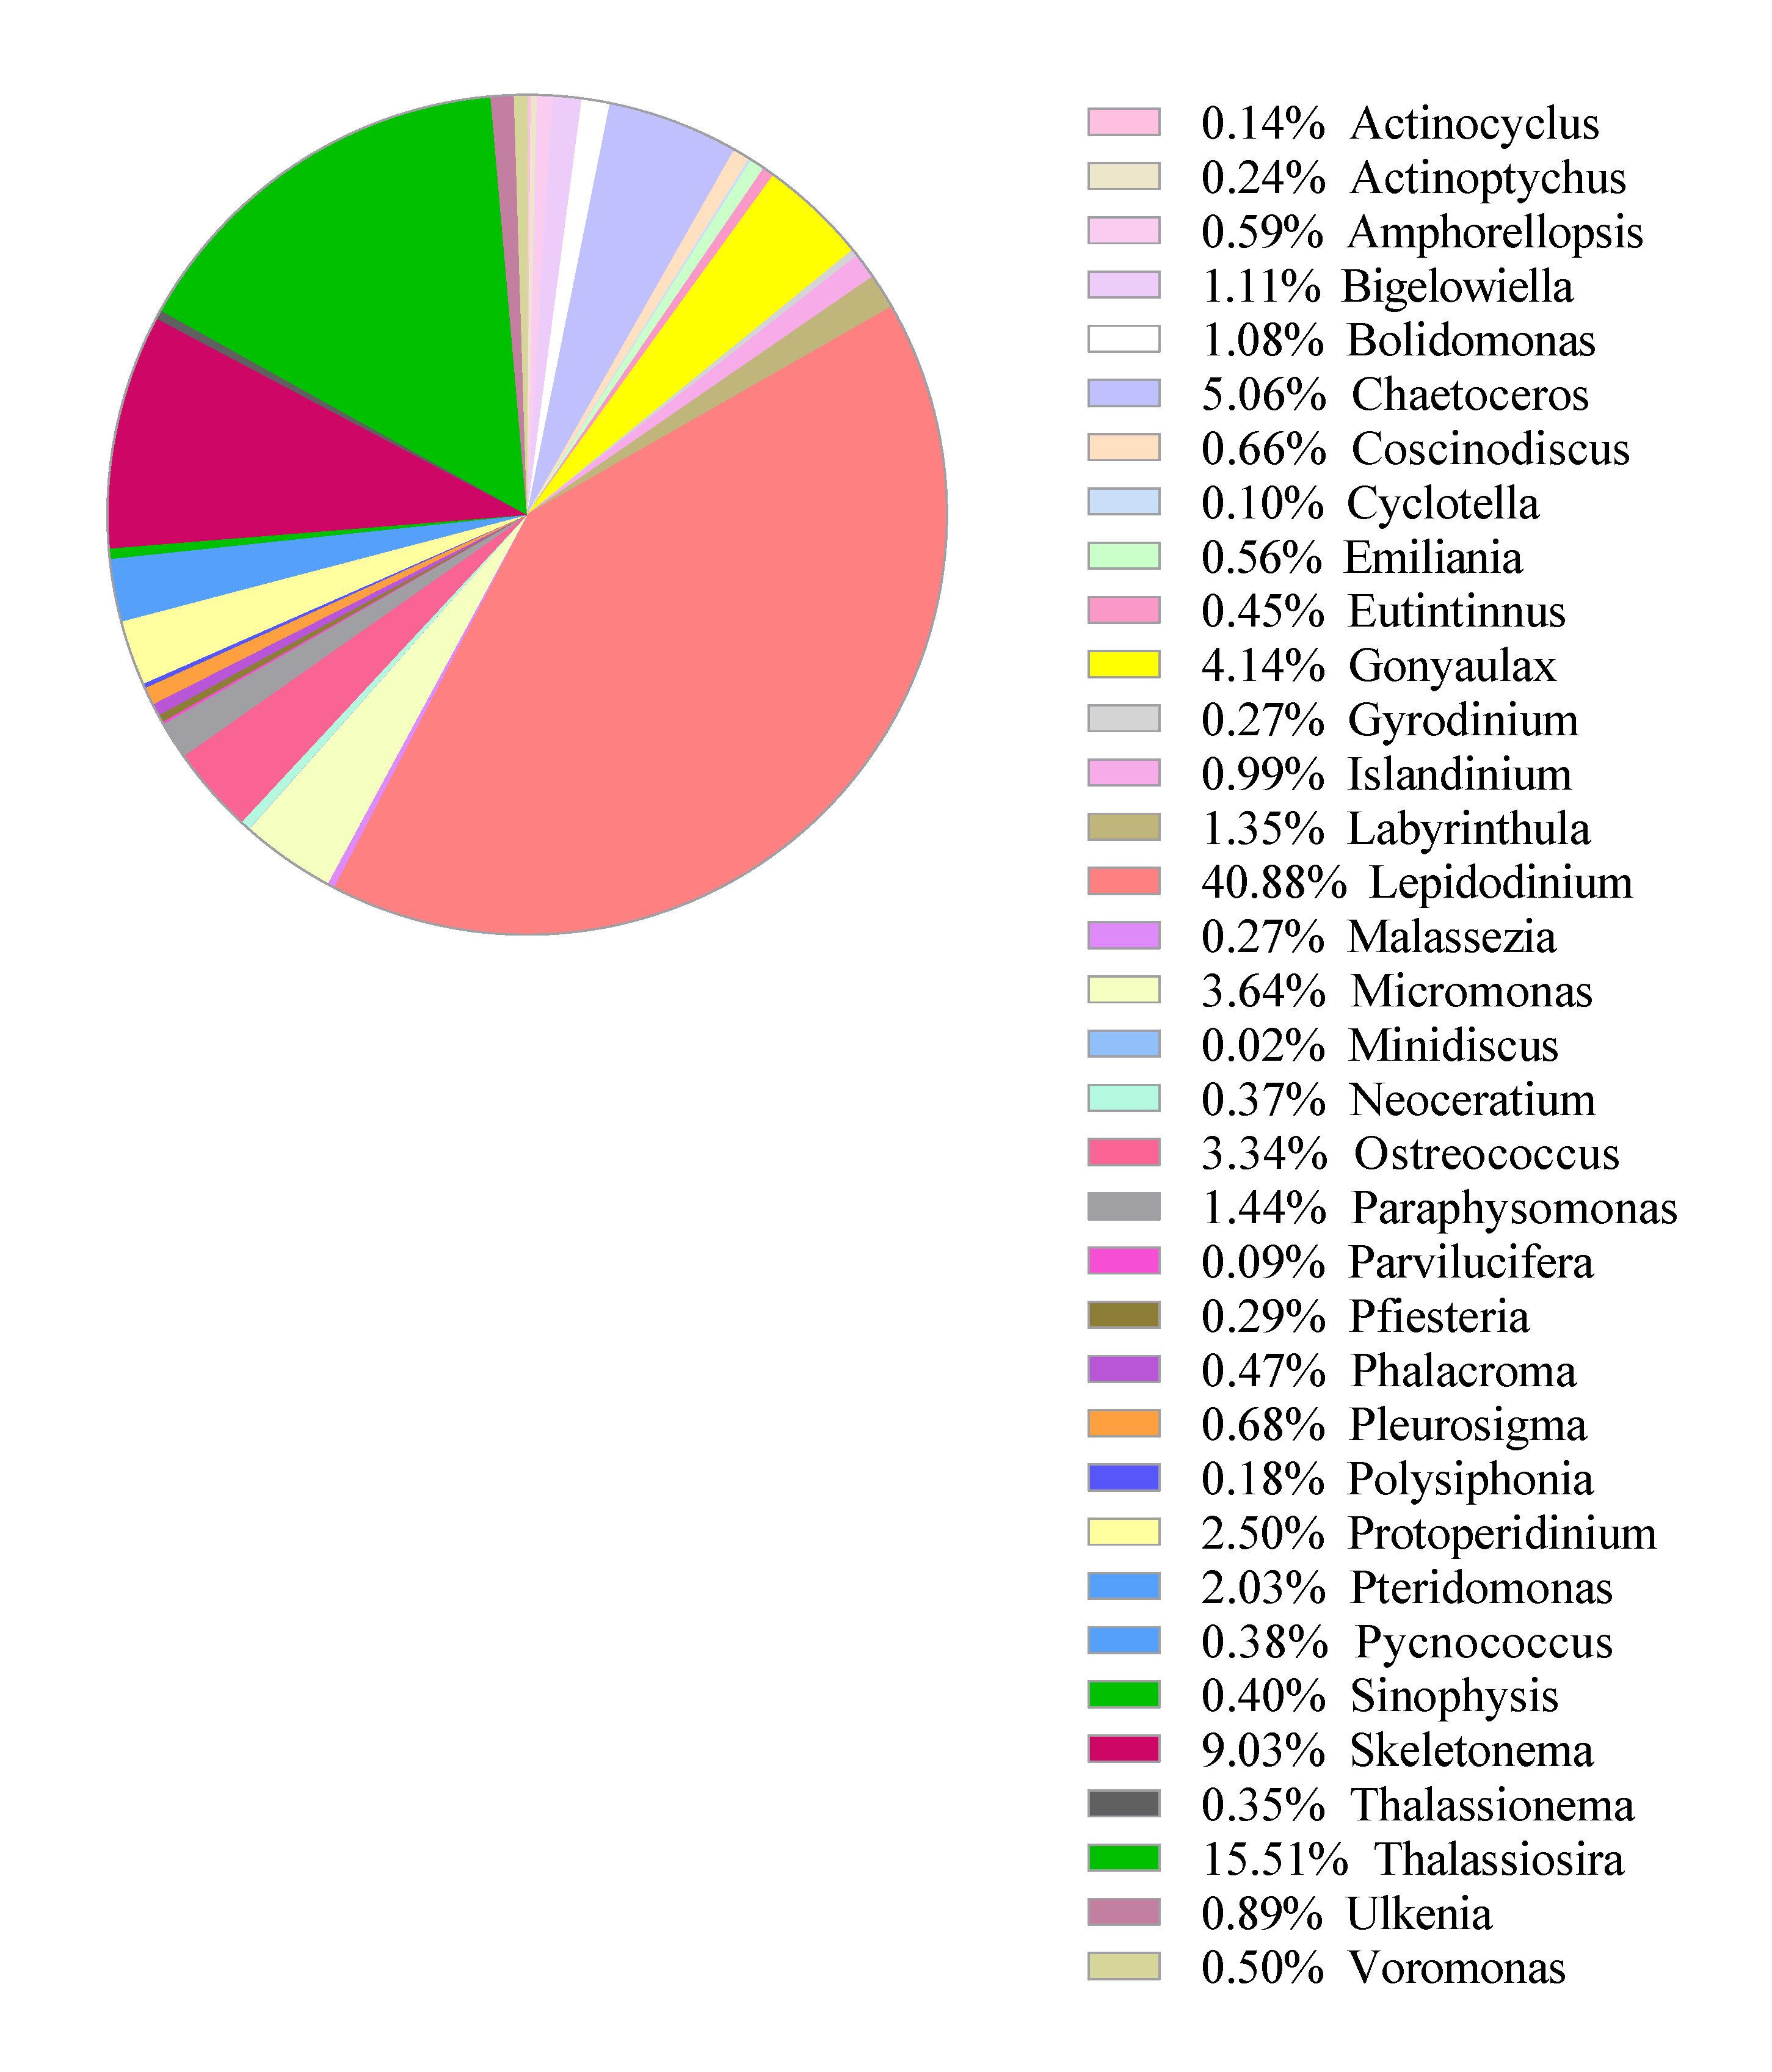
2.2.3. Sample Workups for Metabarcoding Analysis
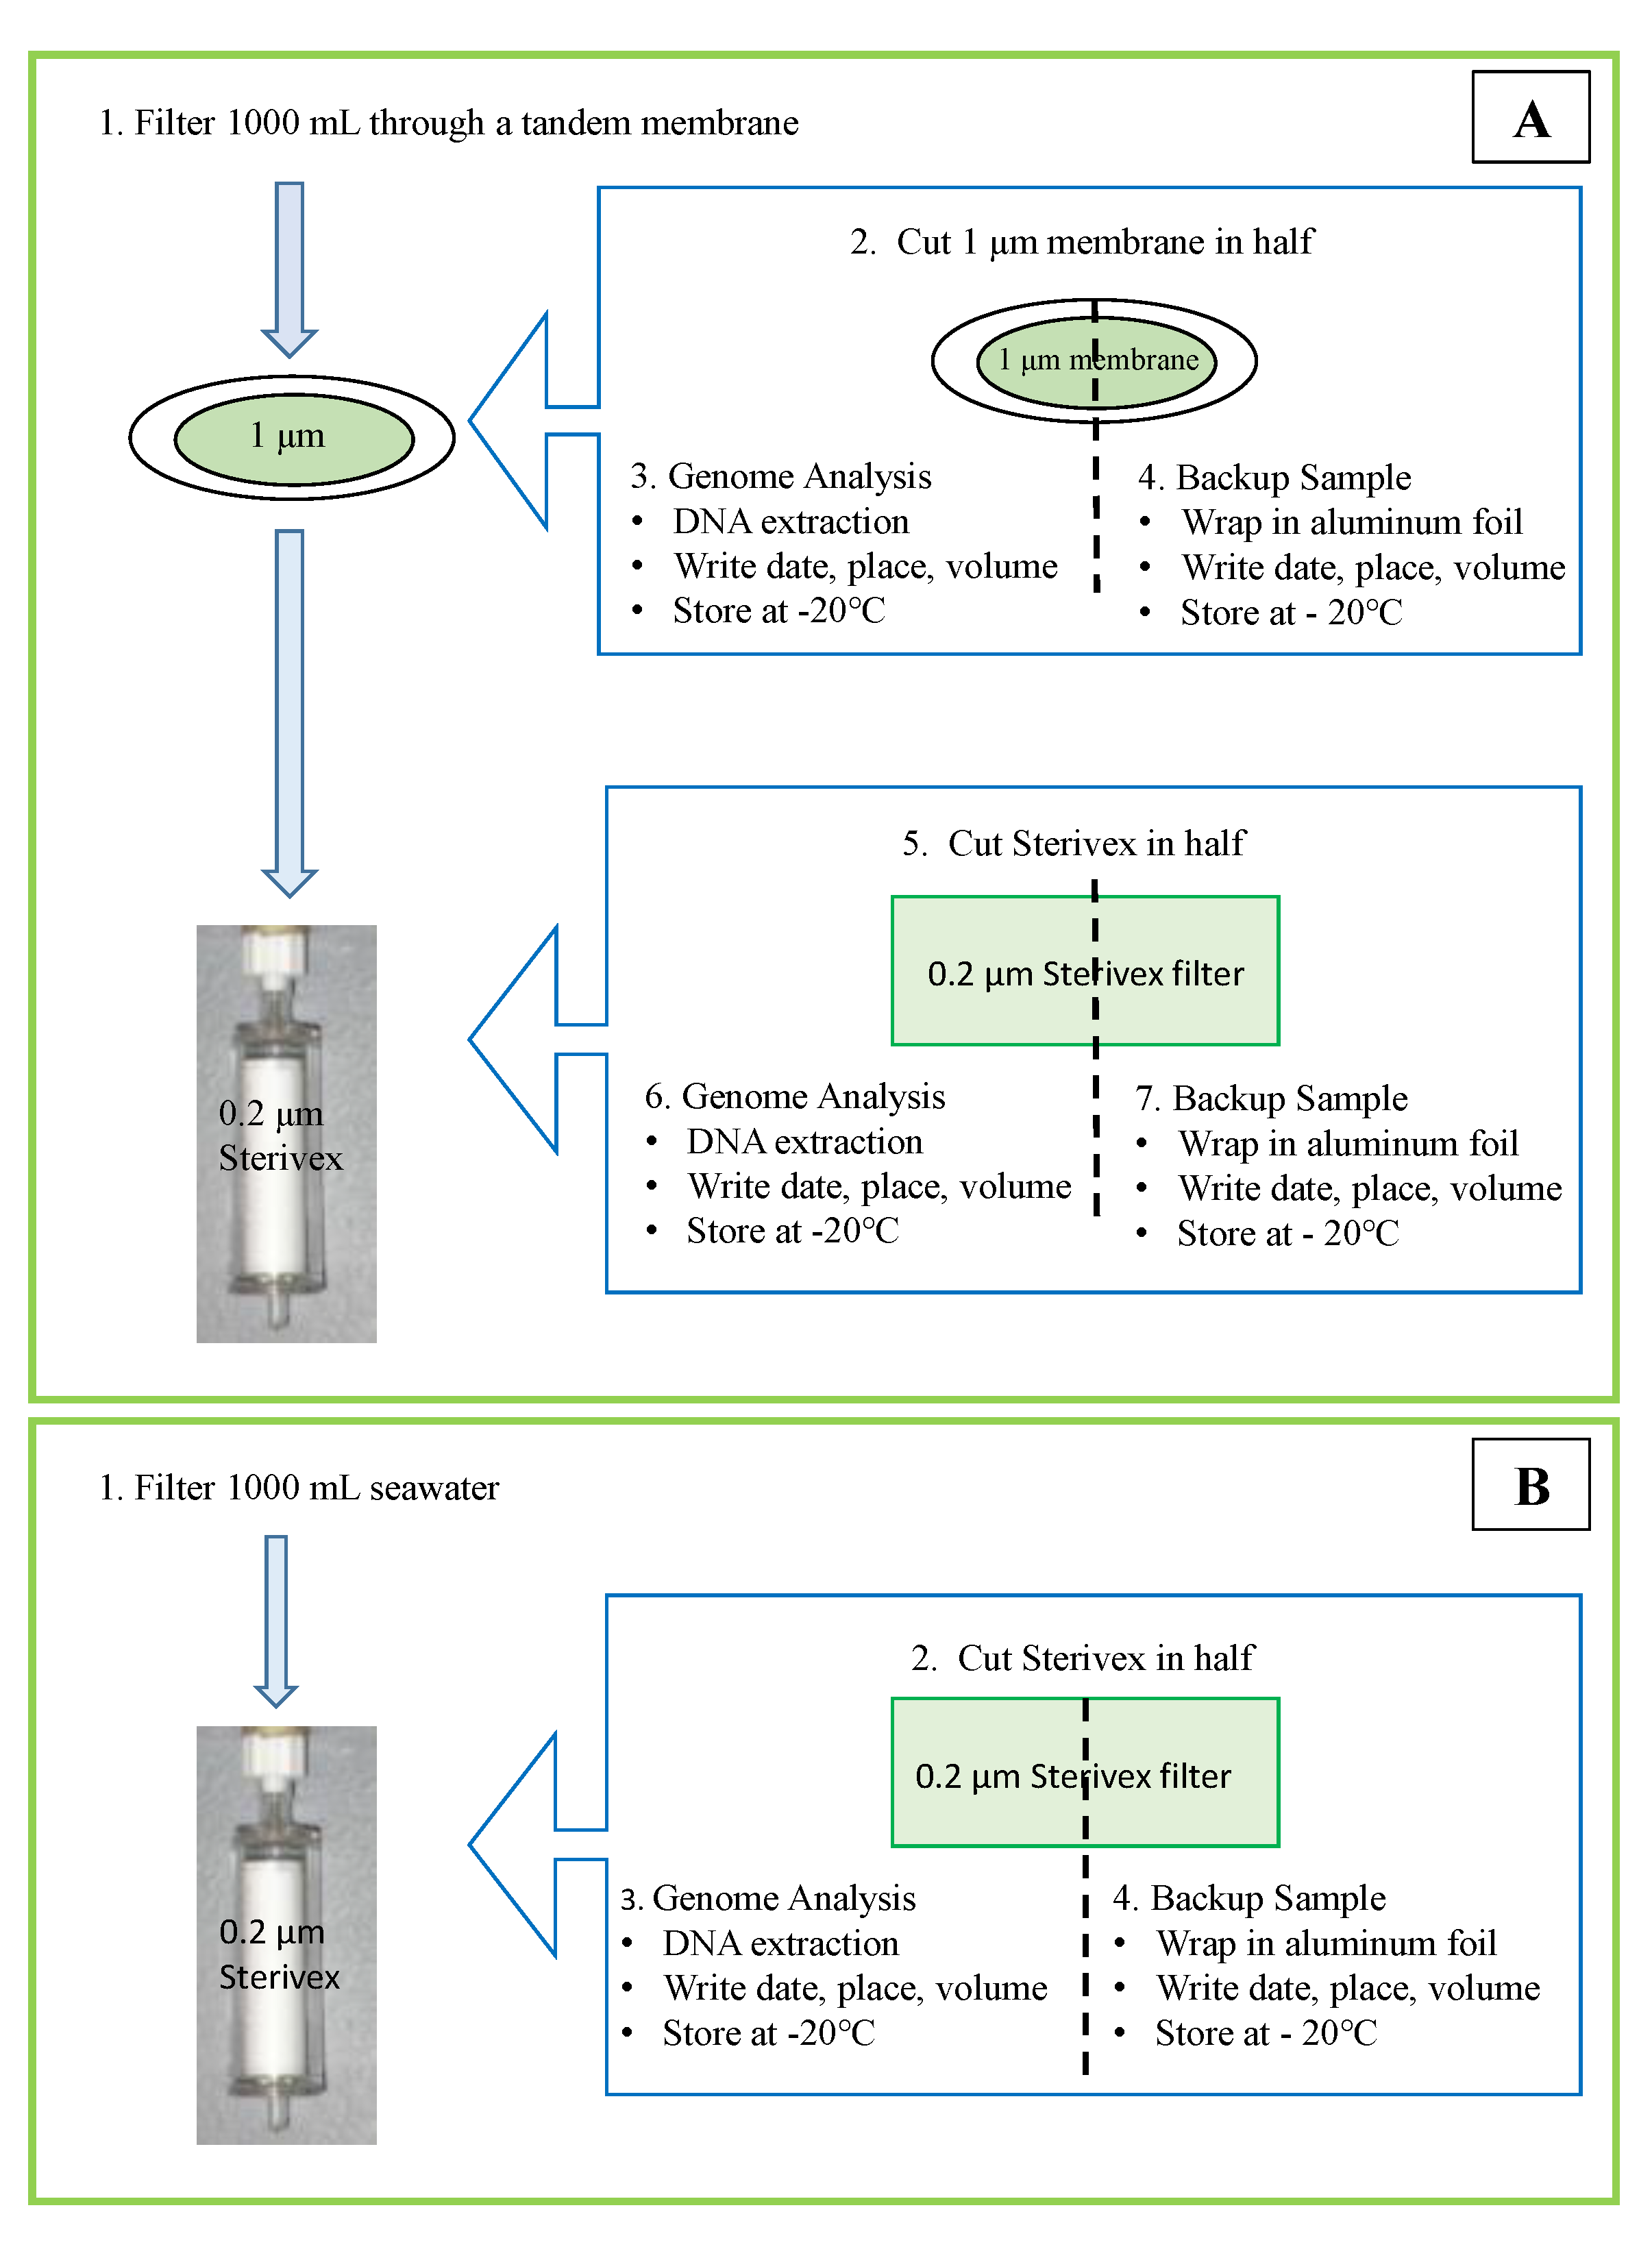
- Filter 1 liters of a water sample from Section 2.1.2 for 16S-rRNA using a tandem filtration (1 μm pore-size connected to 0.2 μm pore-size Sterivex membrane) to separate free-living and attached bacteria (Figure 3). Filter another 1 liters for 18S-rRNA gene analysis using a single filtration with a 0.2 μm Sterivex membrane (Figure 3). Thus, three filter membranes are the product from one sampling point (Figure 4). If water is dense with particles and cells, filter as much volume as possible and records the filtered volume.
- Cut each membrane in half with sterile surgical scissors and wrap it with aluminum foil. Proceed to DNA extraction with the half-cut membrane and store the other half in −20 °C as a back-up sample. Filtration of the water sample must be completed within 12 h of sampling; however, the filtered membranes can be stored at −20 °C for 4 weeks if DNA extraction cannot be performed on the same day.
2.2.4. DNA Extraction
- Prepare 5% Chelex buffer with DNA/RNA free water in a sterile container. Heat a hotplate to 97 °C. Prepare three autoclaved 2-mL microtubes per sampling point.
- Place a half-cut filtered membrane in a 2-mL autoclaved microtube. Using sterile surgical scissors, cut the membrane into small pieces within the tube.
- Add 250 μL of 5% Chelex into the tube containing the membrane pieces and homogenize for 2 min for 1μm membrane and 3 min for 0.2 μm Sterivex membrane, respectively, with a Pellet Pestle™ Cordless Motor to break bacterial and phytoplankton cells (Figure 4).
- Add 250 μL of 5% Chelex into each tube to bring up the final volume of 500 μL. Heat membranes in tubes on a hotplate for 20 min at 97 °C. Transfer liquid to a new tube by pipetting. Label the tube and store it at −20 °C.
2.3. Analysis
2.3.1. Metabarcoding Analysis
- Thaw the DNA samples from Section 2.2.4 at room temperature and use supernatant only for analysis.
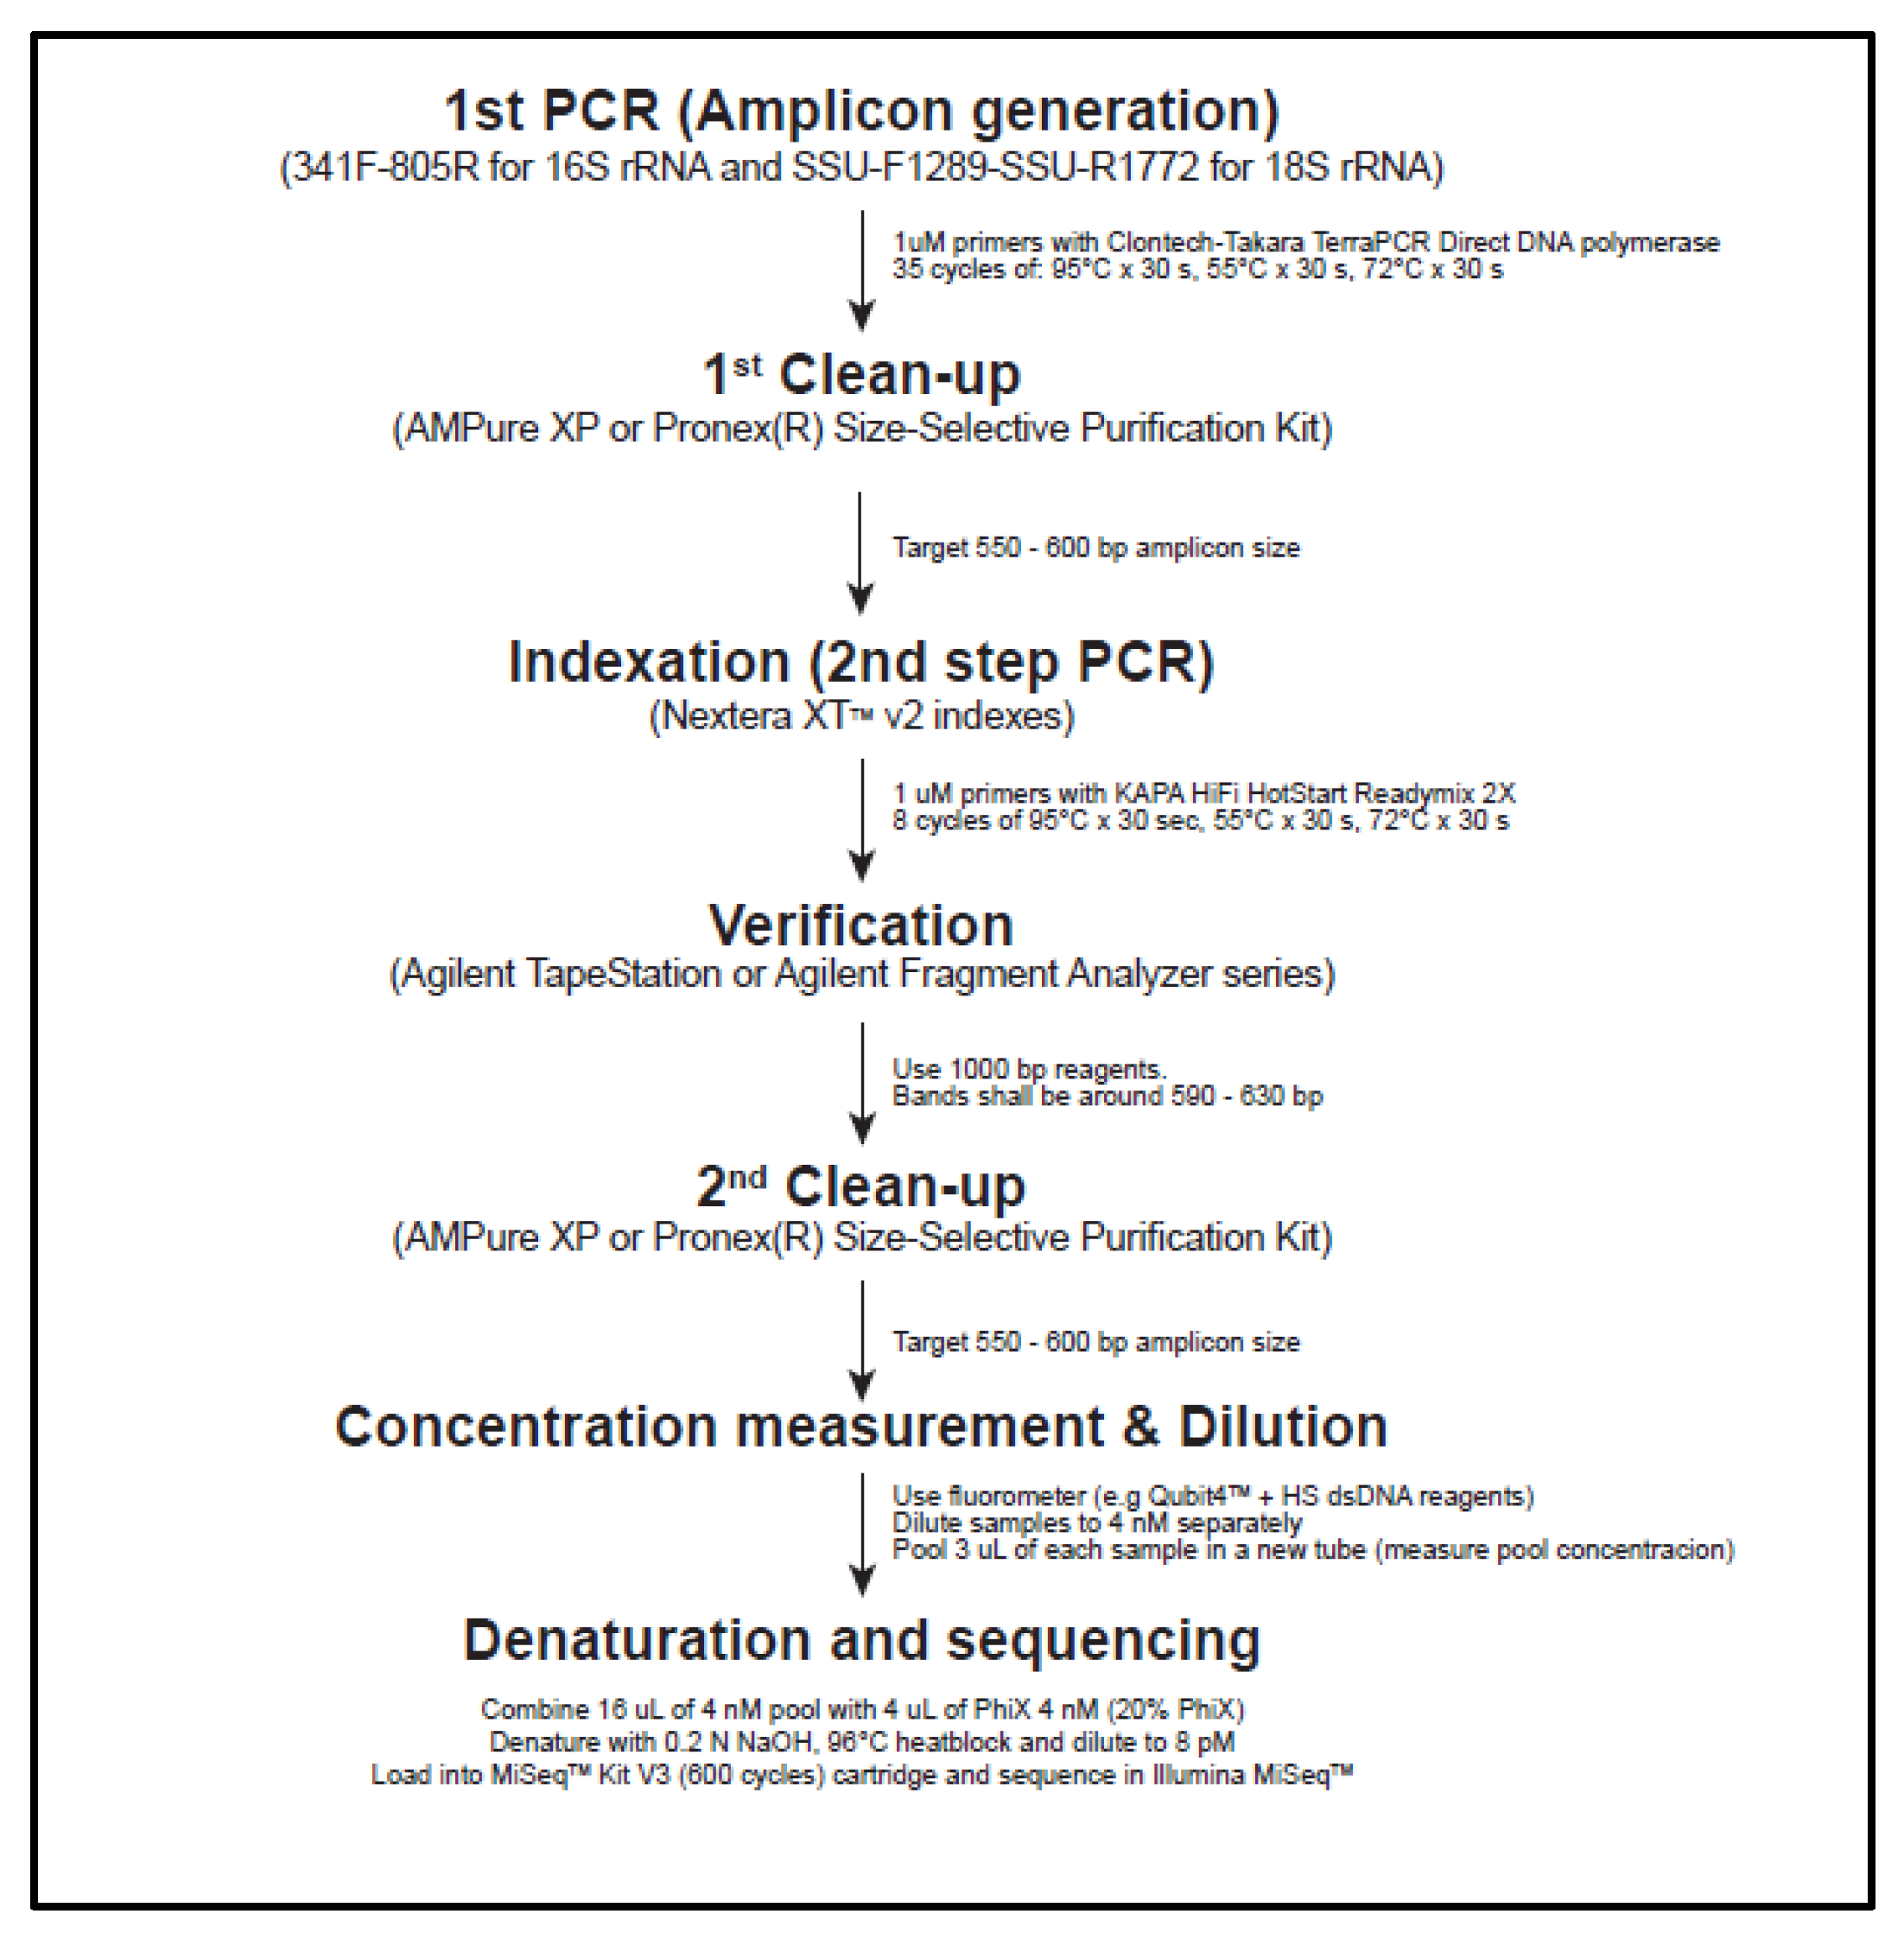
- Prepare a master mix in a 1.5-mL tube containing the followings per a 25-μL reaction sample: 2.5 μL of 1 μM 16S-341F (16S) or SSU-F1289 (18S) primer, 2.5 μL of 1 μM 16S-805R (16S) or SSU-R1772 (18S) primer (Table 1), 12.5 μL of 2× Terra PCR Direct Buffer, 0.5 μL of Terra PCR Direct Polymerase Mix (1.25 U/μL), 5 μL of PCR grade water.
- Distribute 22.5 μL of the master mix into 8-tube strips and mix with 2.5 μL of DNA templates. The negative control is PCR grade water. Cap the strip immediately.
- Perform PCR on the 8-tube strips: Initial denaturation of 95 °C for 3 min, 35 cycles of 95 °C for 30 s followed by 55 °C for 30 s and 72 °C for 30 s, final elongation of 72 °C for 5 min. Store the PCR product at −20 °C until the next step is to proceed.
- Prepare a 100-mL of 2% w/v agarose-TBE gel containing 10 μL of GelRed® Nucleic Acid Gel Stain. Mix 1.5 μL of 1× DNA loading dye with 4 μL of first PCR product, load the volume into the gel, run electrophoresis at 100 v for 30 min. Ensure the target bands at 500–600 bp, the primer-dimer bands at 80 bp, and no bands except primer-dimer in the negative control.
- Clean the first PCR product with Pronex® Size-Selective Purification kit per the manufacturer’s manual. Transfer 20 μL of the final product to a new 96-well plate and seal it with a microseal film. Store at −20 °C until the next step is to proceed
- In a new sterile 96-well plate, add the followings: 12.5 µL of 2× KAPA HiFi HotStart ReadyMix, 2.5 µL of each index primer (1 µM), 7.5 µL of purified PCR product DNA. Mix gently and cover with a microseal film.
- Perform PCR on the 96-well plate: Initial denaturation of 95 °C for 3 min, 8 cycles of 95 °C for 30 s followed by 55 °C for 30 s and 72 °C for 30 s, final elongation of 72 °C for 5 min. This “library” should be kept at −20 °C until the next step is to proceed.
- Perform library verification by the fragment analyzer, TapeStation 4000 series with 35–1000 bp reagents and D1000 sample buffer. The expected size of the final library is 613 bp for both 16S and 18S rRNA genes. Equilibrate D1000 Sample Buffer and ScreenTape at room temp for 30 min, and vortex and spin down. Mix 2 µL of D1000 Sample Buffer and 3 µL of the sample in new 8-tube strips, and verify the sample size by TapeStation 4000 series.
- Clean the libraries by the method stated in the section of first PCR.
- Measure the DNA concentration in each second PCR product using Qubit4TM coupled with QubitTM HS dsDNA kit. Accounting for the final library’s average size as 613 bp for both 16S and 18S rRNA genes, calculate DNA concentration in nM in each sample by:
- Dilute the libraries with sterile TE buffer (pH 8.0) to 4 nM in a new 0.2 mL 96-well plate. Store the plate at −20 °C until the next step is to proceed
- Thaw out Illumina MiSeqTM reagent cartridge at 4 °C. Aliquot 5 µL of diluted library and mix all in a 1.5-mL tube as a pool on ice. Measure the DNA concentration of the pooled library. If higher than 4 nM (~1.6 ng/µL), it requires adjustment.
- Set a heat block at 96 °C. Place HT1 Hybridization buffer on ice. Dilute molecular grade NaOH from 1N to 0.2 N in a new tube. Dilute PhiXTM from 10 nM stock to 4 nM in a new tube with TE Buffer pH 8.5.
- Mix 16 µL of the pooled libraries with 4 µL of PhiXTM. Mix 10 µL with 10 µL of 0.2 N NaOH in a new tube. Vortex this tube for 5 s, spin down briefly and incubate at room temperature for 5 min. Add 980 µL of HT1 Hybridization buffer to the tube and mix by inversion. Mix 260 µL of this solution with 390 µL of HT1 Hybridization buffer in a new tube and incubate it at 96 °C for 2 min followed by immediate transfer to ice for 2 min. The DNA concentration at this point is 8 pM.
2.3.2. Pigment Analysis
- Order pigment standards listed in Table 2 from DHI (Agern Allé 5, DK-2970 Hørsholm, Denmark) and obtain a Certificate of Analysis to record each standard’s actual concentration.
- Prepare two stock standard solutions, A and B. Standard solution A is prepared by mixing equal volumes of 19′But, Neo, Allo, Diato, and Zea. Standard solution B is prepared by mixing equal volumes of Perid, Fuco, 19′Hex, Prasino, Viola, Lut, Chl-a, and Chl-b.
- From the stock standard solutions, prepare two 7-point calibration curves A and B, ranging between 4 and 180 ng/mL by serial dilutions with 90% acetone.
- Prepare a standard mix by mixing equal volumes of stock standard solutions A and B. The pre-mixed pigment standard is used to verify the detection of each peak without a matrix effect. The standard solutions can be stored at −20 °C at least for three months.
2.3.2.1. Pigment Extraction
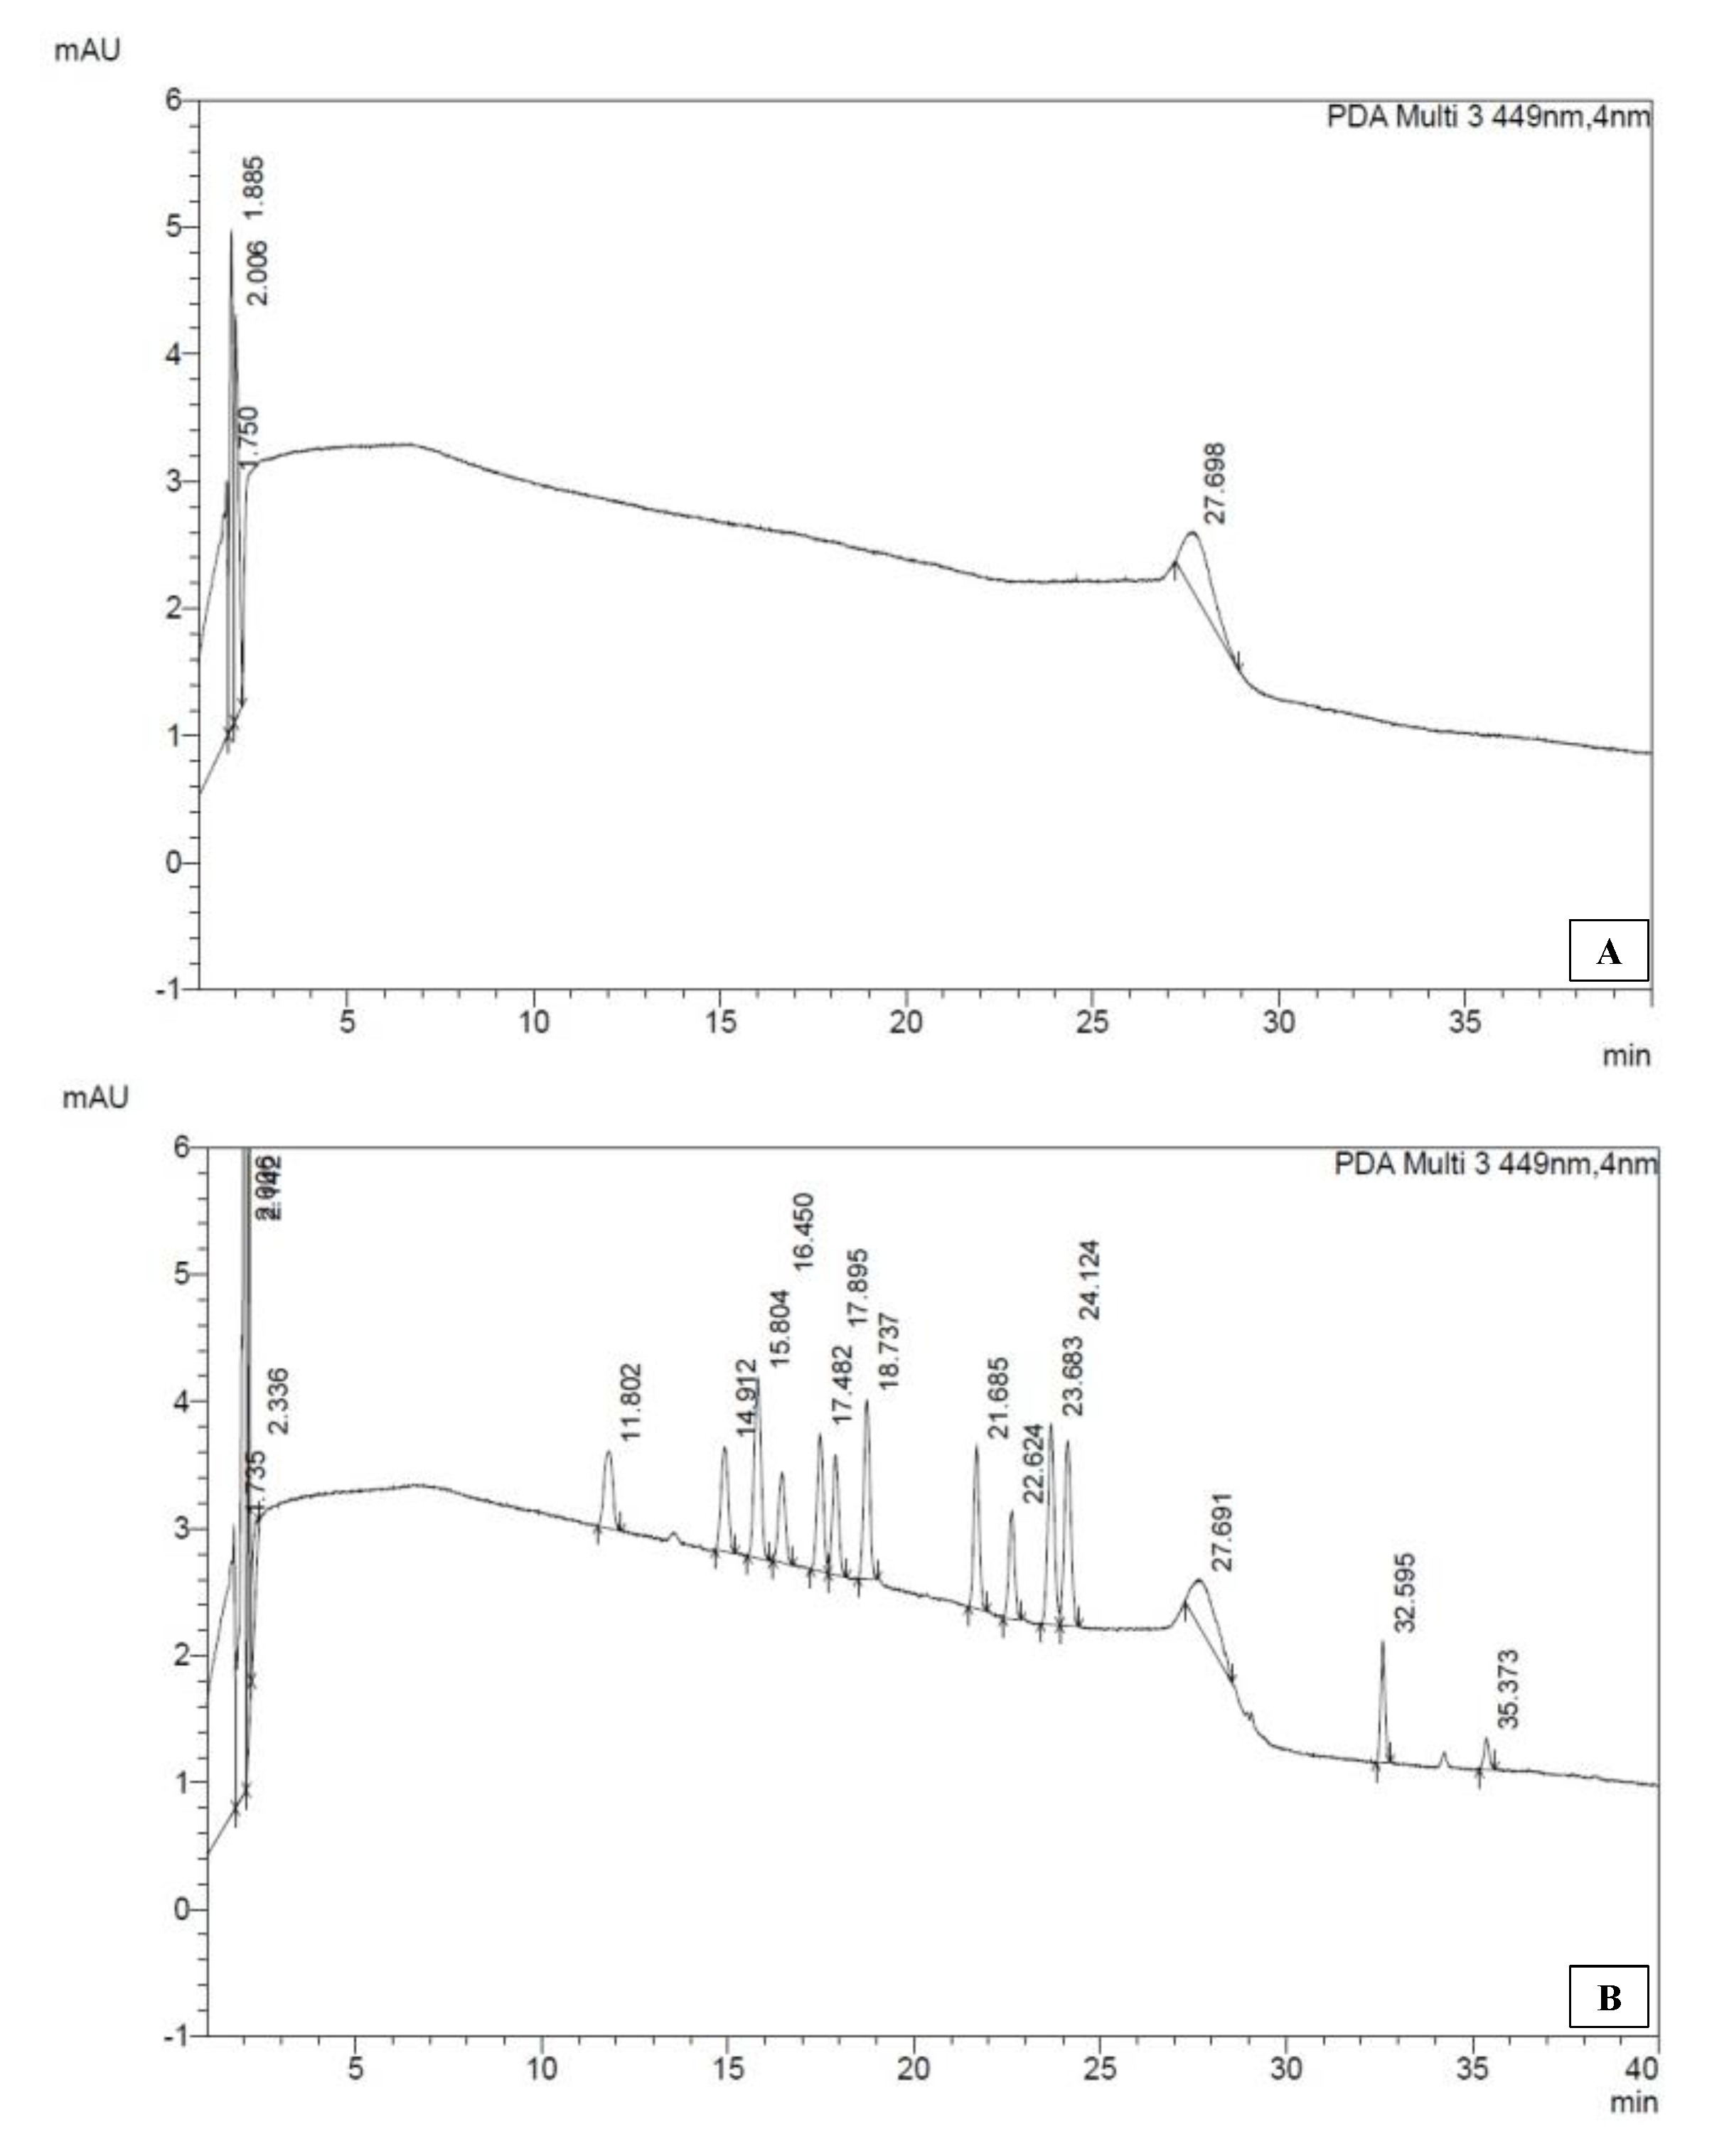
2.3.2.2. HPLC-PDA Analysis
2.3.2.3. Data Processing
2.3.3. Nutrient Analysis
2.4. Temperature and Precipitation
2.4.1. Weather Station Data by Instituto de Fomento Pesquero (IFOP)
- Comau fjord (https://www.hobolink.com/p/baa69a935234dc9d71febde8a42aa5a7),
- Apiao island (https://www.hobolink.com/p/7beb4f80e2fb5ee895848597e4b85cf7),
- Reloncaví fjord (https://www.hobolink.com/p/bd63a8b18b7e2990724e16ace75e3d41).
2.4.2. Weather Station Data by Chilean Government
2.5. Pilot Study
3. Results and Discussion
3.1. HAB Monitoring Methodologies
3.2. Pilot Study: Metabarcoding Analyses
3.3. Pilot Study: Physical and Chemical Analyses
4. Conclusions
Supplementary Materials
Author Contributions
Funding
Acknowledgments
Conflicts of Interest
Appendix A

| Sample treatment (Section 2.1): Estimated manpower: sample collection (1), sample treatment and DNA extraction (1), plankton counting (1) | |||
| Vendor | Item | Part Number | Price US$ (unit) |
| MilliporeSigma | SterivexTM GP 0.22 μm filter unit | SVGP01050 | 297.00 (50) |
| Whatman GF/F membrane | WHA1825047 | 162.00 (100) | |
| Whatman 1.0 μm pore-sized membrane | WHA111110 | 163.00 (100) | |
| Bio-Rad | Chelex® 100 Chelating Resin | 1432832 | 480.00 (100g) |
| Fisher Scientific | filter system bottle top | 09-740-36H | 298.00 (each) |
| filter system holder | 09-740-23E | 554.00 (each) | |
| Conical tube 15-mL size | 12-565-268 | 312.00 (500) | |
| Conical tube 50-mL size | 12-565-270 | 441.00 (500) | |
| Surgical scissors | 08-940 | 24.15 (each) | |
| Sedgewick Rafter, Glass slide | 50-285-41 | 309.76 (each) | |
| Lugol’s iodine solution | R40029 | 77.28 (each) | |
| Pellet Pestle™ Cordless Motor | K749540-0000 | 208.47 (each) | |
| Metabarcoding assay (Section 2.3.1). Estimated manpower: (2) | |||
| Vendor | Item | Part Number | Price US$ (unit) |
| Instrument | |||
| Fisher Scientific | MiniAMPTM Plus Thermal Cycler | A37835 | 4110.00 (each) |
| Gel electrophoresis system | D2 | 905.00 (each) | |
| Qubit4TM Fluorometer | Q33238 | 3395.00 (each) | |
| ProNex® Size-Selective Purification System | PRNG2002 | 1591.23 (each) | |
| Agilent Tapestation 4150 | G2992AA | Not disclosed | |
| GelDoc-ItTS2 Imager | NC0668068 | Not disclosed | |
| Illumina | MiSeq system | SY-410-1003 | 99,000.00 (each) |
| Biobase Co. | Biobase PCR-800 PCR Cabinet | NA | 1500.00 (each) |
| Materials | |||
| Fisher Scientific | Sterile 8-strip 0.2 mL PCR tubes and flat cap | AB-0266 43-230-32 | 324.36 (250) 126.00 (each) |
| 96-well 0.2 mL PCR plate and microseal film | 43-119-71 | 270.00 (100) | |
| 0.5 mL single tube | Q32856 | 90.25 (500) | |
| sterilized 1.5-mL tubes | 2150N | Not disclosed | |
| QubitTM dsDNA HS Assay kit | Q32851 | 103.00 (each) | |
| magnetic stand for 96 wells | AM10027 | 450.00 (each) | |
| TBE buffer | B52 | 56.25 (each) | |
| Blue/Orange Loading Dye 6X | PR-G1881 | 51.50 (each) | |
| agarose | BP160-100 | 240.00 (each) | |
| GelRed® Nucleic Acid Gel Stain | 41002 | 111.00 (each) | |
| Illumina | PhiX control Kit v3 | FC-110-3001 | 175.00 (10 μL) |
| MiSeq Reagent Kit v3 | MS-102-3003 | 989.00 (150-cycle) | |
| Nextera XT v2 Index Kit set A, B, C and D | FC-131-2001 FC-131-2002 FC-131-2003 FC-131-2004 | 1051.00 (96indices) 1051.00 (96indices) 1051.00 (96indices) 1051.00 (96indices) | |
| Agilent Technologies | D1000 ScreenTape | 5067-5582 | 221.00 (each) |
| DNA markers D1000 Reagent | 5067-5602 | 47.59 (each) | |
| loading tips for Agilent TapeStation systems | 5067-5598 | 41.20 (112) | |
| Takara Bio | Terra PCR Direct Polymerase Mix | 639271 | 529.00 (800 Rxn) |
| Integrated DNA Technologies | nuclease free water | 11-05-01-04 | 28.00 (1 L) |
| MaestroGen | DNA Ladder | 02001-500 | 43.00 (each) |
| MilliporeSigma | ethanol, molecular bio grade | E7023 | 115.00 (1 L) |
| NaOH, molecular bio grade | 1091371000 | 26.00 (1 L) | |
| Roche | DNA polymerase KAPA HiFi Hotstart ReadyMix | KK2602 | Not disclosed |
| Pigment analysis (Section 2.3.2): Estimated manpower: Sample and solution preparation (1), assay and data processing (1) | |||
| Vendor | Item | Part Number | Price US$ (unit) |
| Instrument | |||
| Shimadzu | HPLC | NA | Not disclosed |
| auto-sampler | Sil-10AF | Not disclosed | |
| quaternary pump | LC-10AT | Not disclosed | |
| degasser | DGU-14A | Not disclosed | |
| System Controller | CBM-20A | Not disclosed | |
| photodiode-array detector | SPD-M20A | Not disclosed | |
| Materials | |||
| Advanced Chromatography | Analytical column, C18-PFP, 100 Å, 3 µm, 4,6 × 150 mm | ACE-1110-1546 | 853.00 (each) |
| Nutrient analysis (Section 2.3.3): Estimated manpower: Sample and solution preparation (1), assay and data processing (1) | |||
| Vendor | Item | Part Number | Price US$ (unit) |
| Instrument | |||
| Seal Analytical | AQ400-discrete analyzer | AQ400 | Not disclosed |
| Materials | |||
| MilliporeSigma | sodium nitrite (NaNO3) | 7631-99-4 | 81.30b(500 g) |
| monopotassium phosphate (KH2PO4) | 7778-77-0 | 366.00 (5 g) | |
| sodium metasilicate monohydrate (Na2O3Si·9H2O) | 13517-24-3 | 61.50 (250 g) | |
Appendix B
| Index Name | Index and Illumina Sequencing Adapters | Index Sequence |
|---|---|---|
| Index 1 (i7) | Rev comp of sequence | |
| N701-A | CAAGCAGAAGACGGCATACGAGATTCGCCTTAGTGACTGGAGTTCAGACGTGTG | TAAGGCGA |
| N702-A | CAAGCAGAAGACGGCATACGAGATCTAGTACGGTGACTGGAGTTCAGACGTGTG | CGTACTAG |
| N703-A | CAAGCAGAAGACGGCATACGAGATTTCTGCCTGTGACTGGAGTTCAGACGTGTG | AGGCAGAA |
| N704-A | CAAGCAGAAGACGGCATACGAGATGCTCAGGAGTGACTGGAGTTCAGACGTGTG | TCCTGAGC |
| N705-A | CAAGCAGAAGACGGCATACGAGATAGGAGTCCGTGACTGGAGTTCAGACGTGTG | GGACTCCT |
| N706-A | CAAGCAGAAGACGGCATACGAGATCATGCCTAGTGACTGGAGTTCAGACGTGTG | TAGGCATG |
| N707-A | CAAGCAGAAGACGGCATACGAGATGTAGAGAGGTGACTGGAGTTCAGACGTGTG | CTCTCTAC |
| N710-A | CAAGCAGAAGACGGCATACGAGATCAGCCTCGGTGACTGGAGTTCAGACGTGTG | CGAGGCTG |
| N711-A | CAAGCAGAAGACGGCATACGAGATTGCCTCTTGTGACTGGAGTTCAGACGTGTG | AAGAGGCA |
| N712-A | CAAGCAGAAGACGGCATACGAGATTCCTCTACGTGACTGGAGTTCAGACGTGTG | GTAGAGGA |
| N714-A | CAAGCAGAAGACGGCATACGAGATTCATGAGCGTGACTGGAGTTCAGACGTGTG | GCTCATGA |
| N715-A | CAAGCAGAAGACGGCATACGAGATCCTGAGATGTGACTGGAGTTCAGACGTGTG | ATCTCAGG |
| N716-B | CAAGCAGAAGACGGCATACGAGATTAGCGAGTGTGACTGGAGTTCAGACGTGTG | ACTCGCTA |
| N718-B | CAAGCAGAAGACGGCATACGAGATGTAGCTCCGTGACTGGAGTTCAGACGTGTG | GGAGCTAC |
| N719-B | CAAGCAGAAGACGGCATACGAGATTACTACGCGTGACTGGAGTTCAGACGTGTG | GCGTAGTA |
| N720-B | CAAGCAGAAGACGGCATACGAGATAGGCTCCGGTGACTGGAGTTCAGACGTGTG | CGGAGCCT |
| N721-B | CAAGCAGAAGACGGCATACGAGATGCAGCGTAGTGACTGGAGTTCAGACGTGTG | TACGCTGC |
| N722-B | CAAGCAGAAGACGGCATACGAGATCTGCGCATGTGACTGGAGTTCAGACGTGTG | ATGCGCAG |
| N723-B | CAAGCAGAAGACGGCATACGAGATGAGCGCTAGTGACTGGAGTTCAGACGTGTG | TAGCGCTC |
| N724-B | CAAGCAGAAGACGGCATACGAGATCGCTCAGTGTGACTGGAGTTCAGACGTGTG | ACTGAGCG |
| N726-B | CAAGCAGAAGACGGCATACGAGATGTCTTAGGGTGACTGGAGTTCAGACGTGTG | CCTAAGAC |
| N727-B | CAAGCAGAAGACGGCATACGAGATACTGATCGGTGACTGGAGTTCAGACGTGTG | CGATCAGT |
| N728-B | CAAGCAGAAGACGGCATACGAGATTAGCTGCAGTGACTGGAGTTCAGACGTGTG | TGCAGCTA |
| N729-B | CAAGCAGAAGACGGCATACGAGATGACGTCGAGTGACTGGAGTTCAGACGTGTG | TCGACGTC |
| Index2 (i5) | ||
| S502-A | AATGATACGGCGACCACCGAGATCTACACCTCTCTATACACTCTTTCCCTACACGACGC | CTCTCTAT |
| S503-A | AATGATACGGCGACCACCGAGATCTACACTATCCTCTACACTCTTTCCCTACACGACGC | TATCCTCT |
| S505-A | AATGATACGGCGACCACCGAGATCTACACGTAAGGAGACACTCTTTCCCTACACGACGC | GTAAGGAG |
| S506-A | AATGATACGGCGACCACCGAGATCTACACACTGCATAACACTCTTTCCCTACACGACGC | ACTGCATA |
| S507-A | AATGATACGGCGACCACCGAGATCTACACAAGGAGTAACACTCTTTCCCTACACGACGC | AAGGAGTA |
| S508-A | AATGATACGGCGACCACCGAGATCTACACCTAAGCCTACACTCTTTCCCTACACGACGC | CTAAGCCT |
| S510-A | AATGATACGGCGACCACCGAGATCTACACCGTCTAATACACTCTTTCCCTACACGACGC | CGTCTAAT |
| S511-A | AATGATACGGCGACCACCGAGATCTACACTCTCTCCGACACTCTTTCCCTACACGACGC | TCTCTCCG |
| S513-C | AATGATACGGCGACCACCGAGATCTACACTCGACTAGACACTCTTTCCCTACACGACGC | TCGACTAG |
| S515-C | AATGATACGGCGACCACCGAGATCTACACTTCTAGCTACACTCTTTCCCTACACGACGC | TTCTAGCT |
| S516-C | AATGATACGGCGACCACCGAGATCTACACCCTAGAGTACACTCTTTCCCTACACGACGC | CCTAGAGT |
| S517-C | AATGATACGGCGACCACCGAGATCTACACGCGTAAGAACACTCTTTCCCTACACGACGC | GCGTAAGA |
| S518-C | AATGATACGGCGACCACCGAGATCTACACCTATTAAGACACTCTTTCCCTACACGACGC | CTATTAAG |
| S520-C | AATGATACGGCGACCACCGAGATCTACACAAGGCTATACACTCTTTCCCTACACGACGC | AAGGCTAT |
| S521-C | AATGATACGGCGACCACCGAGATCTACACGAGCCTTAACACTCTTTCCCTACACGACGC | GAGCCTTA |
| S522-C | AATGATACGGCGACCACCGAGATCTACACTTATGCGAACACTCTTTCCCTACACGACGC | TTATGCGA |
Appendix C
| Chile | Protocol |
|---|---|
| Programa Nacional de Prevención y Control de las Intoxicaciones por Marea Roja (PNMR) | ND |
| Programa de la Subsecretaría de Pesca y Acuicultura | ND |
| Programa de Sanidad de Moluscos Bivalvos (PSMB) | ND |
| Programa Monitoreo de Fitoplancton | ND |
| International programs: | |
| ECOHAB (Ecology and Oceanography of Harmful Algal Blooms) | ND |
| EUROHAB (European Harmful Algal Blooms) | ND |
| GEOHAB (Global Ecology and Oceanography of Harmful Algal Blooms) | ND |
| IOC-UNESCO (Intergovernmental Oceanographic Commission-UNESCO) | ND |
| International Conference on Harmful Algae (ICHA) * | ND |
| U.S. programs: | |
| ECOHAB (Ecology and Oceanography of Harmful Algal Blooms) | ND |
| MERHAB (Monitoring and Event Response of Harmful Algal Blooms) | ND |
| PCMHAB (Prevention, Control, and Mitigation) | ND |
| Pew Oceans Commission | ND |
| U.S. Commission on Ocean Policy | ND |
| U.S. Symposium on Harmful Algae * | ND |
| West Coast Governors’ Agreement on Ocean Health (WCGA) | ND |
References
- Hallegraeff, G.M. A review of harmful algal blooms and their apparent global increase. Phycologia 1993, 32, 79–99. [Google Scholar] [CrossRef]
- Burkholder, J.M. Implications of harmful microalgae and heterotrophic dinoflagellates in management of sustainable marine fisheries. Ecol. Appl. 1998, 8, S37–S62. [Google Scholar] [CrossRef]
- Glibert, P.M.; Anderson, D.M.; Gentien, P.; Graneli, E.; Sellner, K.G. The global complex phenomena of harmful algae blooms. Oceanography 2005, 18, 130–141. [Google Scholar]
- Anderson, D.M. Red Tides. Sci. Am. 1994, 271, 52–58. [Google Scholar] [CrossRef]
- Honner, S.; Kudela, R.M.; Handler, E.M. Bilateral mastoiditis from red tide exposure. J. Emerg. Med. 2012, 43, 663–666. [Google Scholar] [CrossRef] [PubMed]
- Gobler, C.; Doherty, O.; Hattenrath-Lehmann, T.; Griffith, A.; Litaker, R. Ocean warming since 1982 has expanded the niche of toxic algal blooms in the North Atlantic and North Pacific oceans. Proc. Natl. Acad. Sci. USA 2017, 114, 4975–4980. [Google Scholar] [CrossRef]
- León-Muñoz, J.; Urbina, M.A.; Garreaud, R.; Iriarte, J.L. Hydroclimatic conditions trigger record harmful algal bloom in western Patagonia (summer 2016). Sci. Rep. 2018, 8, 1330. [Google Scholar] [CrossRef]
- Díaz, P.; Alvarez, G.; Varela, D.; Santos, I.E.; Diaz, M.; Molinet, C.; Seguel, M.; Aguilera, B.A.; Guzmán, L.; Uribe, E.; et al. Impacts of harmful algal blooms on the aquaculture industry: Chile as a case study. Perspect. Phycol. 2019, 6. [Google Scholar] [CrossRef]
- Clément, A.; Lincoqueo, L.; Saldivia, M.; Brito, C.G.; Muñoz, F.; Fernández, C.; Pérez, F.; Maluje, C.P.; Correa, N.; Moncada, V.; et al. Exceptional summer conditions and HABs of Pseudochattonella in Southern Chile create record impacts on salmon farms. Harmful Algae News. 2016, 53, 1–3. [Google Scholar]
- Mascareño, A.; Cordero, R.; Azócar, G.; Billi, M.; Henríquez, P.A.; Ruz, G. Controversies in social-ecological systems: Lessons from a major red tide crisis on Chiloé Island, Chile. Ecol. Soc. 2018, 23, 15. [Google Scholar] [CrossRef]
- Trainer, V.L.; Moore, S.K.; Hallegraeff, G.; Kudela, R.M.; Clement, A.; Mardones, J.I.; Cochlan, W.P. Pelagic harmful algal blooms and climate change: Lessons from nature’s experiments with extremes. Harmful Algae. 2020, 91, 101591. [Google Scholar] [CrossRef] [PubMed]
- Bell, W.H.; Mitchell, R. Chemotactic and Growth Responses of Marine Bacteria to Algal Extracellular Products. Biol. Bull. 1972, 143, 265–277. [Google Scholar] [CrossRef]
- Bell, W.H.; Lang, J.M. Selective stimulation of marine bacteria by algal extracellular products. Limnol. Oceanogr. 1974, 19, 833–839. [Google Scholar] [CrossRef]
- Azam, F.; Malfatti, F. Microbial structuring of marine ecosystems. Nat. Rev. Microbiol. 2007, 5, 782–791. [Google Scholar] [CrossRef] [PubMed]
- Amin, S.A.; Hmelo, L.R.; van Tol, H.M.; Durham, B.P.; Carlson, L.T.; Heal, K.R.; Morales, R.L.; Berthiaume, C.T.; Parker, M.S.; Djunaedi, B.; et al. Interaction and signaling between a cosmopolitan phytoplankton and associated bacteria. Nature 2015, 522, 98–101. [Google Scholar] [CrossRef] [PubMed]
- Bertranda, E.M.; McCrowa, J.P.; Moustafaa, A.; Zhenga, H.; McQuaida, J.B.; Delmontd, T.O.; Poste, A.F.; Sipler, R.E.; Spackeen, J.L.; Xug, K.; et al. Phytoplankton-bacterial interactions mediate micronutrient colimitation at the coastal Antarctic sea ice edge. Proc. Natl. Acad. Sci. USA 2015, 112, 9938–9943. [Google Scholar] [CrossRef]
- Ramanan, R.; Kim, B.H.; Cho, D.H.; Oh, H.M.; Kim, H.S. Algae-bacteria interactions: Evolution, ecology and emerging applications. Biotechnol. Adv. 2016, 34, 14–29. [Google Scholar] [CrossRef]
- Seymour, J.; Amin, S.; Raina, J.B.; Stocker, R. Zooming in on the phycosphere: The ecological interface for phytoplankton-bacteria relationships. Nat. Microbiol. 2017, 2, 17065. [Google Scholar] [CrossRef]
- Zhou, J.; Richlen, M.; Sehein, T.; Kulis, D.; Anderson, D.; Cai, Z.H. Microbial Community Structure and Associations During a Marine Dinoflagellate Bloom. Front. Microbiol. 2018, 9, 1201. [Google Scholar] [CrossRef]
- Banerji, A.; Bagley, M.; Elk, M.; Pilgrim, E.; Martinson, J.; Domingo, J. Spatial and temporal dynamics of a freshwater eukaryotic plankton community revealed via 18S rRNA gene metabarcoding. Hydrobiologia 2018, 818, 71–86. [Google Scholar] [CrossRef]
- Cheung, M.K.; Au, C.H.; Chu, K.H.; Kwan, H.S.; Wong, C.K. Composition and genetic diversity of picoeukaryotes in subtropical coastal waters as revealed by 454 pyrosequencing. ISME J. 2010, 4, 1053–1059. [Google Scholar] [CrossRef] [PubMed]
- Lindeque, P.K.; Parry, H.E.; Harmer, R.A.; Somerfield, P.J.; Atkinson, A. Next generation sequencing reveals the hidden diversity of zooplankton assemblages. PLoS ONE 2013, 8, e81327. [Google Scholar] [CrossRef] [PubMed]
- Nagai, S.; Yamamoto, K.; Hata, N.; Itakura, S. Study of DNA extraction methods for use in loop-mediated isothermal amplification detection of single resting cysts in the toxic dinoflagellates Alexandrium tamarense and A. catenella. Mar. Genomics 2012, 7, 51–56. [Google Scholar] [CrossRef] [PubMed]
- Tanabe, A.S.; Nagai, S.; Hida, K.; Yasuike, M.; Fujiwara, A.; Nakamura, Y.; Takano, Y.; Katakura, S. Comparative study of the validity of three regions of the 18S-rRNA gene for massively parallel sequencing-based monitoring of the planktonic eukaryote community. Mol. Ecol. Resour. 2016, 16, 402–414. [Google Scholar] [CrossRef] [PubMed]
- Nishitani, G.; Nagai, S.; Hayakawa, S.; Kosaka, Y.; Sakurada, K.; Kamiyama, T.; Gojoboric, T. Multiple plastids collected by the Dinoflagellate Dinophysis mitra through Kleptoplastidy. Appl. Environ. Microbiol. 2012, 78, 813–821. [Google Scholar] [CrossRef]
- Klindworth, A.; Pruesse, E.; Schweer, T.; Peplies, J.; Quast, C.; Horn, M.; Glöckner, F.O. Evaluation of general 16S ribosomal RNA gene PCR primers for classical and next-generation sequencing-based diversity studies. Nucleic Acids Res. 2013, 41, e1. [Google Scholar] [CrossRef]
- Callahan, B.J.; McMurdie, P.J.; Rosen, M.J.; Han, A.W.; Johnson, A.J.; Holmes, S.P. DADA2: High-resolution sample inference from Illumina amplicon data. Nat. Method. 2016, 13, 581–583. [Google Scholar] [CrossRef]
- Yilmaz, P.; Parfrey, L.W.; Yarza, P.; Gerken, J.; Pruesse, E.; Quast, C.; Schweer, T.; Peplies, J.; Ludwig, W.; Glöckner, F.O. The SILVA and “All-species Living Tree Project (LTP)” taxonomic frameworks. Nucleic Acids Res. 2014, 42, D643–D648. [Google Scholar] [CrossRef]
- Sanz, N.; Garcıa-Blanco, A.; Gavalas-Olea, A.; Loures, P.; Garrido, J.L. Phytoplankton pigment biomarkers: HPLC separation using a pentafluorophenyloctadecyl silica column. Methods Ecol. Evol. 2015, 6, 1199–1209. [Google Scholar] [CrossRef]
- Mackey, M.D.; Higgins, H.W.; Wright, S.W. CHEMTAX—A program for estimating class abundances from chemical markers: Application to HPLC measurements of phytoplankton. Mar. Ecol. Prog. Ser. 1996, 144, 265–283. [Google Scholar] [CrossRef]
- Nagai, S.; Hida, K.; Urushizaki, S.; Takano, Y.; Hongo, Y.; Kameda, T.; Abe, K. Massively parallel sequencing-based survey of eukaryotic community structures in Hiroshima Bay and Ishigaki Island. Gene 2016, 576, 681–689. [Google Scholar] [CrossRef] [PubMed]
- Nagai, S.; Kohsuke, H.; Shingo, U.; Onitsuka, G.; Motoshige, Y.; Nakamura, Y.; Fujiwara, A.; Tajimi, S.; Kimoto, K.; Kobayashi, T.; et al. Influences of diurnal sampling bias on fixed-point monitoring of plankton biodiversity determined using a massively parallel sequencing-based technique. Gene 2016, 576, 667–675. [Google Scholar] [CrossRef] [PubMed]
- Thompson, H.; Lesaulnier, C.; Pelikan, C.; Gutierrez, T. Visualisation of the obligate hydrocarbonoclastic bacteria Polycyclovorans algicola and Algiphilus aromaticivorans in co-cultures with micro-algae by CARD-FISH. J. Microbiol. Methods 2018, 152, 73–79. [Google Scholar] [CrossRef] [PubMed]
- Sievers, H.A.; Silva, N. Water masses and circulation in austral Chilean channels and fjords. In Progress in the Oceanographic Knowledge of Chilean Interior Waters, from Puerto Montt to Cape Horn, 1st ed.; Silva, N., Palma, S., Eds.; Comité Oceanográfico Nacional, Pontificia Universidad Católica de Valparaíso: Valparaíso, Chile, 2008; pp. 53–58. [Google Scholar]
- Sievers, H.A.; Calvete, C.; Silva, N. Distribución de características físicas, masas de agua y circulación general para algunos canales australes entre el golfo de Penas y el estrecho de Magallanes (Crucero Cimar Fiordo 2). Cienc. Tecnol. Mar. 2002, 25, 17–43. [Google Scholar]
- Aiken, C.M.; Petersen, W.; Schroeder, F.; Gehrung, M.; Ramírez von Holle, P.A. Ship-of-Opportunity Monitoring of the Chilean Fjords Using the Pocket FerryBox. J. At. Ocean Tech. 2011, 28, 1338–1350. [Google Scholar] [CrossRef]
- Silva, N. Dissolved oxygen, pH, and nutrients in the austral Chilean channels and fjords. In Progress in the Oceanographic Knowledge of Chilean Interior Waters, from Puerto Montt to Cape Horn, 1st ed.; Silva, N., Palma, S., Eds.; Comité Oceanográfico Nacional, Pontificia Universidad Católica de Valparaíso: Valparaíso, Chile, 2008; pp. 37–43. [Google Scholar]
- Armijo, J.; Oerder, V.; Auger, P.A.; Bravo, A.; Molina, E. The 2016 red tide crisis in southern Chile: Possible influence of the mass oceanic dumping of dead salmons. Mar. Pollut. Bull. 2020, 150, 110603. [Google Scholar] [CrossRef]
- Ríos, F.; Kilian, R.; Mutschke, E. Chlorophyll-a thin layers in the Magellan fjord system: The role of the water column stratification. Cont. Shelf Res. 2016, 124, 1–12. [Google Scholar] [CrossRef]
- Wright, S.W.; Thomas, D.P.; Marchant, H.J.; Higgins, H.W.; Mackey, M.D.; Mackey, D.J. Analysis of phytoplankton of the Australian sector of the Southern Ocean: Comparisons of microscopy and size frequency data with interpretations of pigment HPLC data using the ‘CHEMTAX’ matrix factorization program. Mar. Ecol. Prog. Ser. 1996, 144, 285–298. [Google Scholar] [CrossRef]


| Primer Name | Overhang Adapter (5′ → 3′) | Region of Interest Specific Sequence (5′ → 3′) | Ref. |
|---|---|---|---|
| SSU-F1289 | ACACTCTTTCCCTACACGACGCTCTTCCGATCT | TGGAGYGATHTGTCTGGTTDATTCCG | [24,25] |
| SSU-R1772 | GTGACTGGAGTTCAGACGTGTGCTCTTCCGATCT | TCACCTACGGAWACCTTGTTACG | |
| 16S-341F | ACACTCTTTCCCTACACGACGCTCTTCCGATCT | CCTACGGGNGGCWGCAG | [26] |
| 16S-805R | GTGACTGGAGTTCAGACGTGTGCTCTTCCGATCT | GACTACHVGGGTATCTAATCC |
| Standard | Abbreviation | Target Wavelength | Retention Time |
|---|---|---|---|
| 19′-Butanoyloxyfucoxanthin | 19′But | 446 nm | 14.9 |
| 19′-Hexanoyloxyfucoxanthin | 19′Hex | 447 nm | 17.5 |
| Alloxanthin | Allo | 453 nm | 21.7 |
| Chlorophyll-a | Chl-a | 665 nm | 35.4 |
| Chlorophyll-b | Chl-b | 466 nm | 32.6 |
| Diatoxanthin | Diato | 449 nm | 22.6 |
| Fucoxanthin | Fuco | 449 nm | 15.8 |
| Lutein | Lut | 445 nm | 24.1 |
| 9′-cis-Neoxanthin | Neo | 439 nm | 16.5 |
| Peridinin | Perid | 472 nm | 11.8 |
| Prasinoxanthin | Prasino | 454 nm | 17.9 |
| Violaxanthin | Viola | 443 nm | 18.7 |
| Zeaxanthin | Zea | 450 nm | 23.7 |
| Time (min) | Mobile Phase A (%) | Mobile Phase B (%) |
|---|---|---|
| 0 | 96 | 4 |
| 0.2 | 96 | 4 |
| 16 | 62 | 38 |
| 22 | 62 | 38 |
| 22.1 | 28 | 72 |
| 30 | 20 | 80 |
| 36 | 10 | 90 |
| 36.1 | 96 | 4 |
| Nitrite | Nitrite-Nitrate | Phosphate | Silicate | |
|---|---|---|---|---|
| Standard | NNaO3 | NNaO3 | KH2PO4 | Na2O3Si·9H2O |
| Standard curve | 7-point 0.001–0.2 mg/L | 8-point 0.01–2.0 mg/L | 7-point 0.003–0.3 mg/L | 8-point 0.10–10 mg/L |
| r acceptance | >0.9985 | >0.9985 | >0.9985 | >0.9985 |
| LOQ | 0.001 mg/L | 0.01 mg/L | 0.003 mg/L | 0.10 mg/L |
| LOD | 0.002 mg/L | 0.003 mg/L | 0.0006 mg/L | 0.018 mg/L |
| USEPA number | 600/R 93/100, 1993. | 600/R 93/100, 1993. | 600/R 93/100, 1993. | 600/4-79-020, 1983. |
| SEAL AQ2 number | EPA-137-A | EPA-127-A | EPA-155-A | EPA-122-A |
| Assay | Parameter | Value at Metri | Reference |
|---|---|---|---|
| atmospheric | temperature | 7.7 °C | NA |
| precipitation | None | NA | |
| Secchi | depth transparency | 3.5 m | NA |
| CTD | water temperature | 12.0 °C | 12 °C (weather atlas) |
| salinity | 30.2 | 31–33 PSU [34] | |
| dissolve oxygen | 10.48 mg/L (117.7%) | 110% [36] | |
| Chlorophyll-a | 15.05 μg/L | 3 μg/L [36] | |
| nutrient | NO2 | 0.04 μM | NA |
| NO3 | <LOD | 0–8 μM [37] | |
| PO4 | 0.77 μM | 0–8 μM [37] | |
| Si(OH)2 | 17.13 μM | 20–100 μM [37] | |
| pigment | 19′But | 0 μg/L | 0–0.08 μg/L [40] |
| 19′Hex | 0.113 μg/L | 0–0.15 μg/L | |
| Allo | 0 μg/L | 0–0.01 μg/L | |
| Chl-a | 2.073 μg/L | 0–0.6 μg/L | |
| Chl-b | 0.341 μg/L | 0–0.15 μg/L | |
| Diato | 0 μg/L | NA | |
| Fuco | 0.568 μg/L | 0–0.15 μg/L | |
| Lut | 0μg/L | 0–0.01 μg/L | |
| Neo | 0 μg/L | NA | |
| Perid | 0.027 μg/L | 0–0.08 μg/L | |
| Prasino | 0.025μg/L | 0–0.01 μg/L | |
| Viola | 0.014 μg/L | NA | |
| Zea | 0 μg/L | 0–0.01 μg/L |
Publisher’s Note: MDPI stays neutral with regard to jurisdictional claims in published maps and institutional affiliations. |
© 2020 by the authors. Licensee MDPI, Basel, Switzerland. This article is an open access article distributed under the terms and conditions of the Creative Commons Attribution (CC BY) license (http://creativecommons.org/licenses/by/4.0/).
Share and Cite
Yarimizu, K.; Fujiyoshi, S.; Kawai, M.; Norambuena-Subiabre, L.; Cascales, E.-K.; Rilling, J.-I.; Vilugrón, J.; Cameron, H.; Vergara, K.; Morón-López, J.; et al. Protocols for Monitoring Harmful Algal Blooms for Sustainable Aquaculture and Coastal Fisheries in Chile. Int. J. Environ. Res. Public Health 2020, 17, 7642. https://doi.org/10.3390/ijerph17207642
Yarimizu K, Fujiyoshi S, Kawai M, Norambuena-Subiabre L, Cascales E-K, Rilling J-I, Vilugrón J, Cameron H, Vergara K, Morón-López J, et al. Protocols for Monitoring Harmful Algal Blooms for Sustainable Aquaculture and Coastal Fisheries in Chile. International Journal of Environmental Research and Public Health. 2020; 17(20):7642. https://doi.org/10.3390/ijerph17207642
Chicago/Turabian StyleYarimizu, Kyoko, So Fujiyoshi, Mikihiko Kawai, Luis Norambuena-Subiabre, Emma-Karin Cascales, Joaquin-Ignacio Rilling, Jonnathan Vilugrón, Henry Cameron, Karen Vergara, Jesus Morón-López, and et al. 2020. "Protocols for Monitoring Harmful Algal Blooms for Sustainable Aquaculture and Coastal Fisheries in Chile" International Journal of Environmental Research and Public Health 17, no. 20: 7642. https://doi.org/10.3390/ijerph17207642
APA StyleYarimizu, K., Fujiyoshi, S., Kawai, M., Norambuena-Subiabre, L., Cascales, E.-K., Rilling, J.-I., Vilugrón, J., Cameron, H., Vergara, K., Morón-López, J., Acuña, J. J., Gajardo, G., Espinoza-González, O., Guzmán, L., Jorquera, M. A., Nagai, S., Pizarro, G., Riquelme, C., Ueki, S., & Maruyama, F. (2020). Protocols for Monitoring Harmful Algal Blooms for Sustainable Aquaculture and Coastal Fisheries in Chile. International Journal of Environmental Research and Public Health, 17(20), 7642. https://doi.org/10.3390/ijerph17207642