Effects of PM2.5 on Third Grade Students’ Proficiency in Math and English Language Arts


Abstract
1. Introduction
1.1. Impacts of Air Pollution on Children’s Cognition and School Performance
1.2. Children’s Differential Sensitivity to Air Pollution
2. Materials and Methods
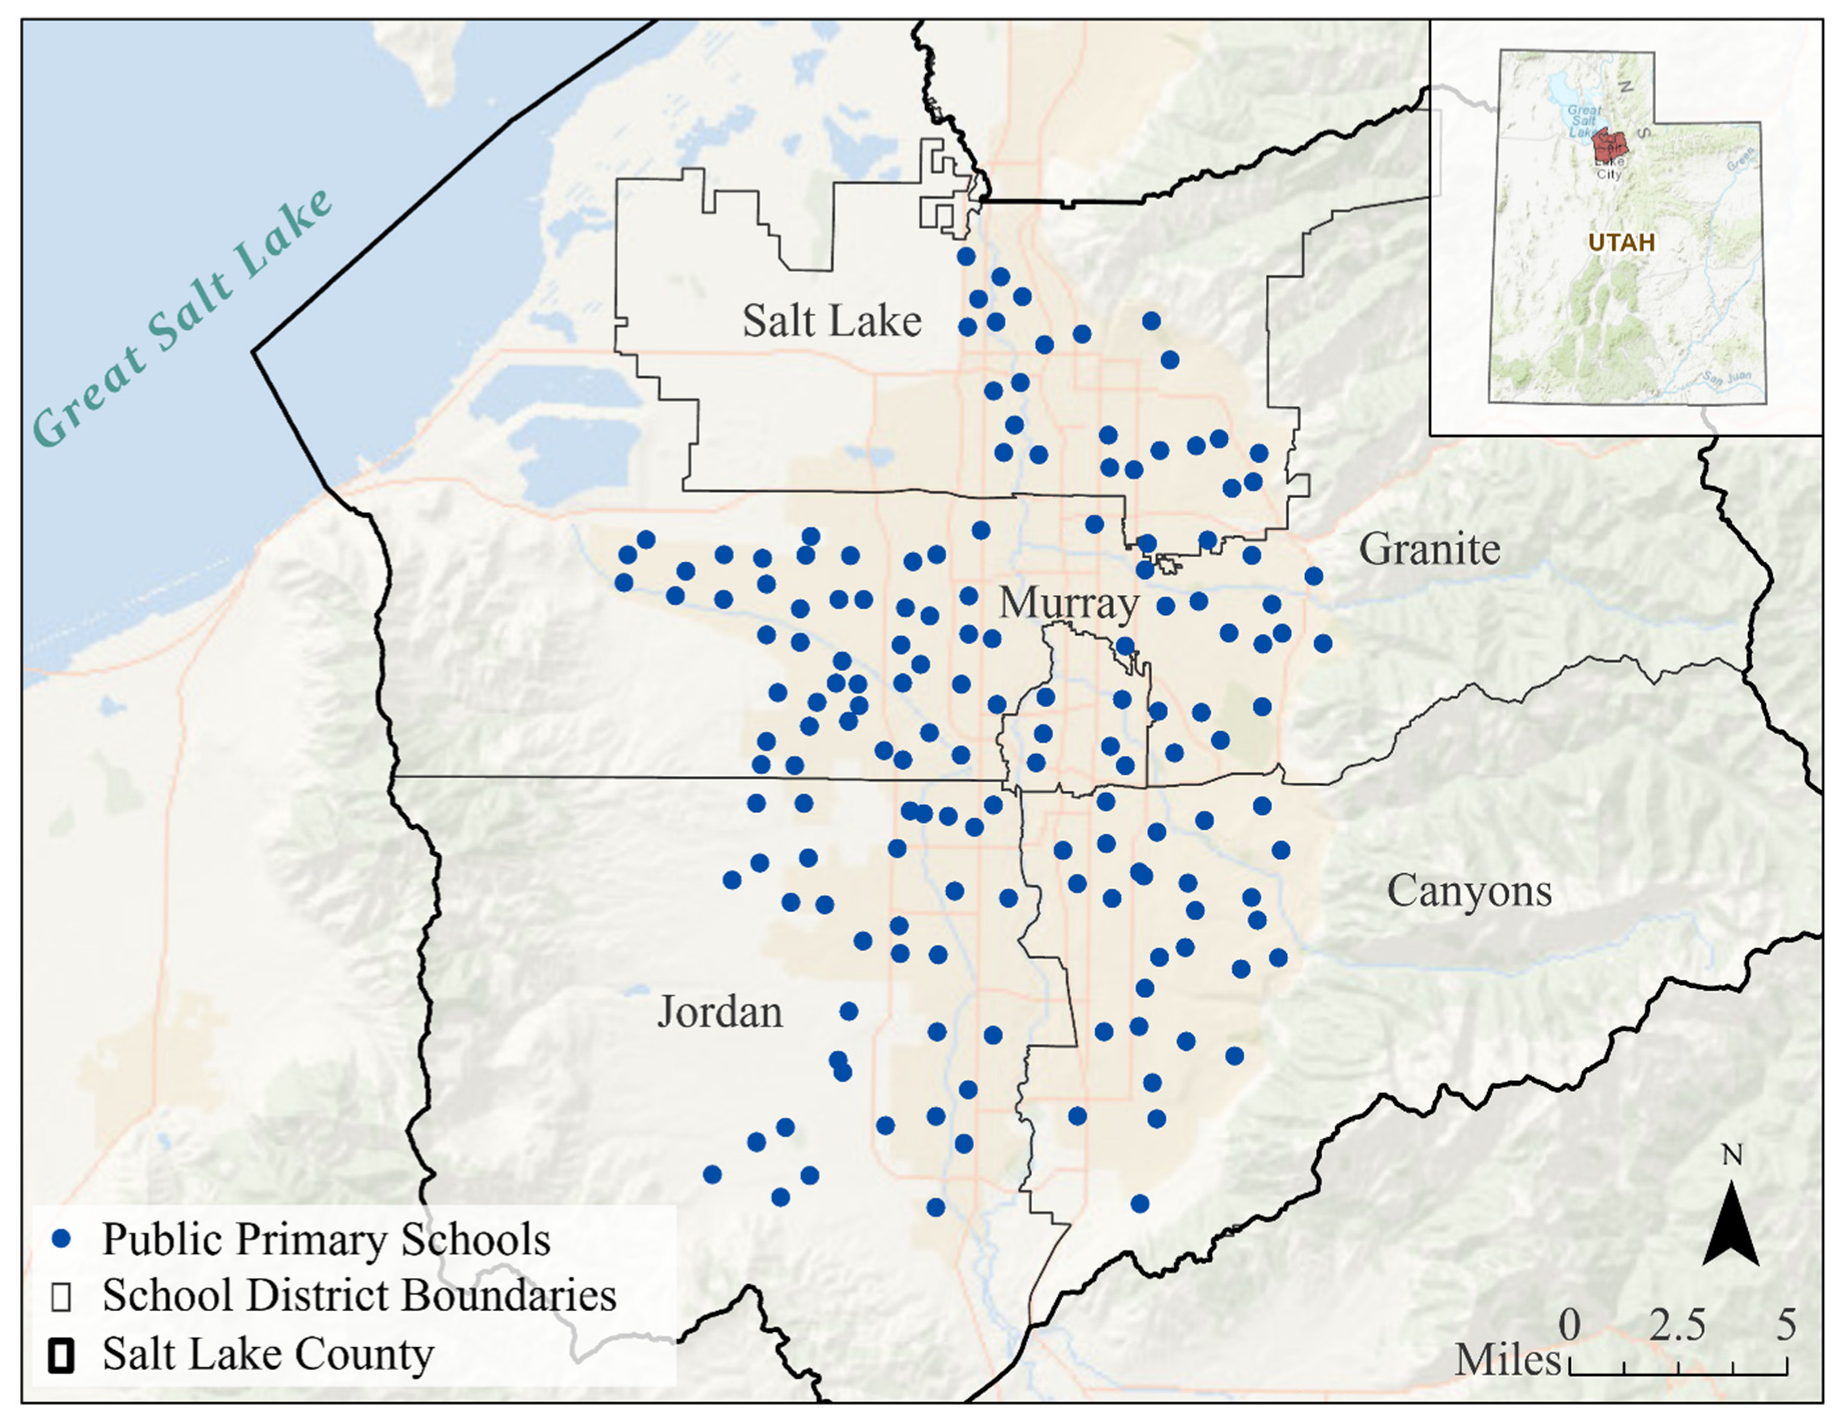
2.1. Case Study Area
2.2. Unit of Analysis
2.3. Air Pollution Metrics
2.4. Academic Proficiency Variables
2.5. Sociodemographic Variables
2.6. School Characteristics
2.7. Generalized Estimating Equations
3. Results
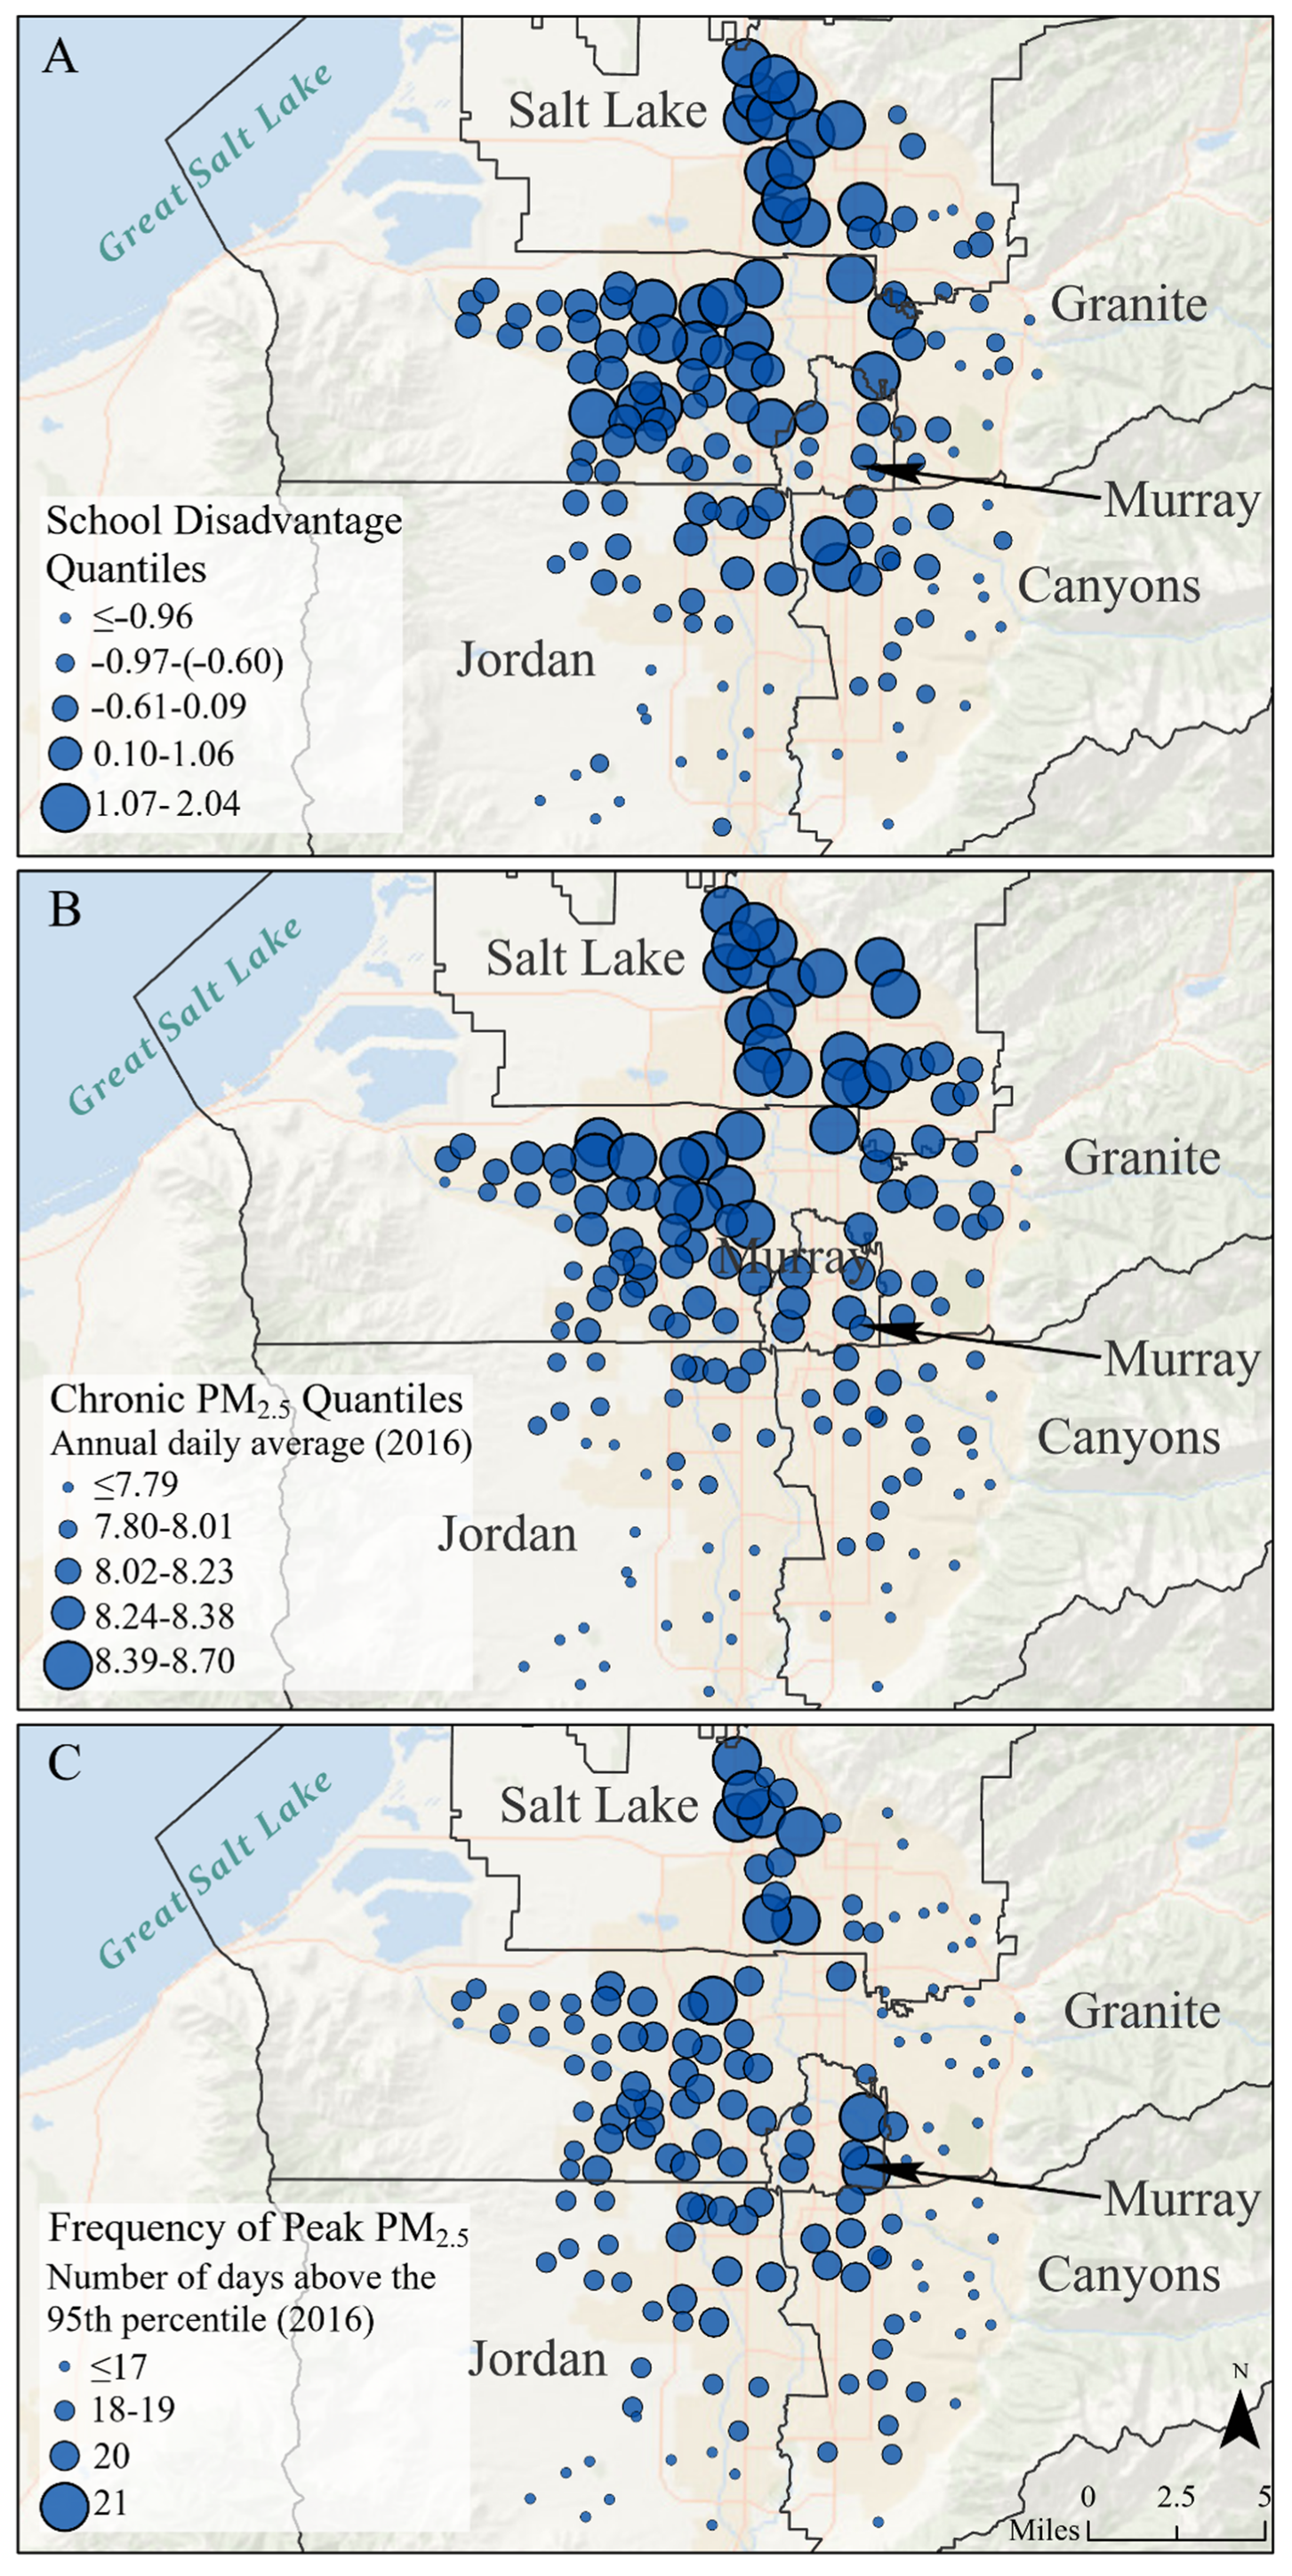
3.1. Associations between School Disadvantage and PM2.5 Exposures at School
3.2. Associations between Chronic PM2.5 Exposure and the Frequency of Peak PM2.5 Exposures on Academic Proficiency
3.3. Interactions between PM2.5 Exposures and School Disadvantage in Predicting Academic Proficiency
4. Discussion
Limitations and Future Directions
5. Conclusions
Author Contributions
Funding
Conflicts of Interest
References
- Wang, S.; Zhang, J.; Zeng, X.; Zeng, Y.; Wang, S.; Chen, S. Association of traffic-related air pollution with children’s neurobehavioral functions in Quanzhou, China. Environ. Health Perspect. 2009, 117, 1612–1618. [Google Scholar] [CrossRef] [PubMed]
- Calderón-Garcidueñas, L.; Kavanaugh, M.; Block, M.; D’Angiulli, A.; Delgado-Chávez, R.; Torres-Jardón, R.; González-Maciel, A.; Reynoso-Robles, R.; Osnaya, N.; Villarreal-Calderon, R.; et al. Neuroinflammation, hyperphosphorylated tau, diffuse amyloid plaques, and down-regulation of the cellular prion protein in air pollution exposed children and young adults. J. Alzheimers Dis. 2012, 28, 93–107. [Google Scholar] [CrossRef]
- Calderón-Garcidueñas, L.; Torres-Jardón, R.; Kulesza, R.J.; Park, S.-B.; D’Angiulli, A. Air pollution and detrimental effects on children’s brain. The need for a multidisciplinary approach to the issue complexity and challenges. Front. Hum. Neurosci. 2014, 8, 613. [Google Scholar] [CrossRef]
- Calderón-Garcidueñas, L.; Gónzalez-Maciel, A.; Reynoso-Robles, R.; Delgado-Chávez, R.; Mukherjee, P.S.; Kulesza, R.J.; Torres-Jardón, R.; Ávila-Ramírez, J.; Villarreal-Ríos, R. Hallmarks of Alzheimer disease are evolving relentlessly in Metropolitan Mexico City infants, children and young adults. APOE4 carriers have higher suicide risk and higher odds of reaching NFT stage V at ≤ 40 years of age. Environ. Res. 2018, 164, 475–487. [Google Scholar] [CrossRef]
- Brockmeyer, S.; D’Angiulli, A. How air pollution alters brain development: The role of neuroinflammation. Transl. Neurosci. 2016, 7, 24–30. [Google Scholar] [CrossRef]
- Kweon, B.-S.; Mohai, P.; Lee, S.; Sametshaw, A.M. Proximity of public schools to major highways and industrial facilities, and students’ school performance and health hazards. Environ. Plan. B Urban Anal. City Sci. 2018, 45, 312–329. [Google Scholar] [CrossRef]
- Grineski, S.E.; Collins, T.W.; Adkins, D.E. Hazardous air pollutants are associated with worse performance in reading, math, and science among US primary schoolchildren. Environ. Res. 2020, 181, 108925. [Google Scholar] [CrossRef] [PubMed]
- Shier, V.; Nicosia, N.; Shih, R.; Datar, A. Ambient air pollution and children’s cognitive outcomes. Popul. Environ. 2019, 40, 347. [Google Scholar] [CrossRef]
- Marcotte, D.E. Something in the air? Air quality and children’s educational outcomes. Econ. Educ. Rev. 2017, 56, 141–151. [Google Scholar] [CrossRef]
- Stingone, J.A.; McVeigh, K.H.; Claudio, L. Association between prenatal exposure to ambient diesel particulate matter and perchloroethylene with children’s 3rd grade standardized test scores. Environ. Res. 2016, 148, 144–153. [Google Scholar] [CrossRef]
- Mullen, C.; Grineski, S.; Collins, T.; Xing, W.; Whitaker, R.; Sayahi, T.; Becnel, T.; Goffin, P.; Gaillardon, P.-E.; Meyer, M.; et al. Patterns of distributive environmental inequity under different PM2.5 air pollution scenarios for Salt Lake County public schools. Environ. Res. 2020, 186, 109543. [Google Scholar] [CrossRef] [PubMed]
- Collins, T.W.; Grineski, S.E. Environmental injustice and religion: Outdoor air pollution disparities in Metropolitan Salt Lake City, Utah. Ann. Am. Assoc. Geogr. 2019, 109, 1597–1617. [Google Scholar] [CrossRef]
- Grineski, S.E.; Collins, T.W. Geographic and social disparities in exposure to air neurotoxicants at U.S. public schools. Environ. Res. 2018, 161, 580–587. [Google Scholar] [CrossRef] [PubMed]
- Gaffron, P.; Niemeier, D. School locations and traffic emissions—environmental (in) justice findings using a new screening method. Int. J. Environ. Res. Public Health 2015, 12, 2009–2025. [Google Scholar] [CrossRef]
- Chakraborty, J.; Zandbergen, P.A. Children at risk: Measuring racial/ethnic disparities in potential exposure to air pollution at school and home. J. Epidemiol. Community Health 2007, 61, 1074–1079. [Google Scholar] [CrossRef]
- Pastor, M.; Morello-Frosch, R.; Sadd, J.L. Breathless: Schools, air toxics, and environmental justice in California. Policy Stud. J. 2006, 34, 337–362. [Google Scholar] [CrossRef]
- Morello-Frosch, R.; Pastor, M.; Sadd, J. Integrating environmental justice and the precautionary principle in research and policy making: The case of ambient air toxics exposures and health risks among schoolchildren in Los Angeles. Ann. Am. Acad. Political Soc. Sci. 2002, 584, 47–68. [Google Scholar] [CrossRef]
- Collins, T.W.; Grineski, S.E.; Nadybal, S. Social disparities in exposure to noise at public schools in the contiguous United States. Environ. Res. 2019, 175, 257–265. [Google Scholar] [CrossRef]
- Salvesen, D.; Zambito, P. Safe schools: Identifying potential threats to the health and safety of school children in North Carolina. In School Siting and Healthy Communities: Why Where We Invest in School Facilities Matters; Michigan State University Press: East Lansing, MI, USA, 2010; pp. 187–220. [Google Scholar]
- McConnell, R.; Berhane, K.; Yao, L.; Jerrett, M.; Lurmann, F.; Gilliland, F.; Kunzli, N.; Gauderman, J.; Avol, E.; Thomas, D.; et al. Traffic, susceptibility, and childhood asthma. Environ. Health Perspect. 2006, 114, 766–772. [Google Scholar] [CrossRef]
- Buthbumrung, N.; Mahidol, C.; Navasumrit, P.; Promvijit, J.; Hunsonti, P.; Autrup, H.; Ruchirawat, M. Oxidative DNA damage and influence of genetic polymorphisms among urban and rural schoolchildren exposed to benzene. Chem. Biol. Interact. 2008, 172, 185–194. [Google Scholar] [CrossRef]
- Volk, H.E.; Hertz-Picciotto, I.; Delwiche, L.; Lurmann, F.; McConnell, R. Residential proximity to freeways and autism in the CHARGE study. Environ. Health Perspect. 2011, 119, 873–877. [Google Scholar] [CrossRef] [PubMed]
- Pastor, M.; Sadd, J.L.; Morello-Frosch, R. Reading, writing, and toxics: Children’s health, academic performance, and environmental justice in Los Angeles. Environ. Plan. C Gov. Policy 2004, 22, 271–290. [Google Scholar] [CrossRef]
- Mohai, P.; Kweon, B.-S.; Lee, S.; Ard, K. Air pollution around schools is linked to poorer student health and academic performance. Health Aff. 2011, 30, 852–862. [Google Scholar] [CrossRef] [PubMed]
- Grineski, S.E.; Clark-Reyna, S.E.; Collins, T.W. School-based exposure to hazardous air pollutants and grade point average: A multi-level study. Environ. Res. 2016, 147, 164–171. [Google Scholar] [CrossRef] [PubMed]
- Xu, X.; Ha, S.U.; Basnet, R. A review of epidemiological research on adverse neurological effects of exposure to ambient air pollution. Front. Public Health 2016, 4, 157. [Google Scholar] [CrossRef]
- Lee, H.; Myung, W.; Kim, D.K.; Kim, S.E.; Kim, C.T.; Kim, H. Short-term air pollution exposure aggravates Parkinson’s disease in a population-based cohort. Sci. Rep. 2017, 7, 44941. [Google Scholar] [CrossRef]
- Schwartz, J. Air pollution and children’s health. Pediatrics 2004, 13, 1037–1043. [Google Scholar]
- Shehab, M.A.; Pope, F.D. Effects of short-term exposure to particulate matter air pollution on cognitive performance. Sci. Rep. 2019, 9, 8237. [Google Scholar] [CrossRef]
- Sunyer, J.; Suades-González, E.; García-Esteban, R.; Rivas, I.; Pujol, J.; Alvarez-Pedrerol, M.; Forns, J.; Querol, X.; Basagaña, X. Traffic-related air pollution and attention in primary school children: Short-term association. Epidemiology 2017, 28, 181–189. [Google Scholar] [CrossRef]
- Lavy, V.; Ebenstein, A.; Roth, S. The Impact of Short Term Exposure to Ambient Air Pollution on Cognitive Performance and Human Capital Formation; National Bureau of Economic Research: Cambridge, MA, USA, 2014; p. w20648. [Google Scholar]
- Abbey, D.E.; Burchette, R.J. Relative power of alternative ambient air pollution metrics for detecting chronic health effects in epidemiological studies. Environmetrics 1996, 7, 453–470. [Google Scholar] [CrossRef]
- Mills, P.K.; Abbey, D.; Beeson, W.L.; Petersen, F. Ambient air pollution and cancer in california seventh-day adventists. Arch. Environ. Health Int. J. 1991, 46, 271–280. [Google Scholar] [CrossRef] [PubMed]
- Grineski, S.E.; Collins, T.W.; Olvera, H.A. Local variability in the impacts of residential particulate matter and pest exposure on children’s wheezing severity: A geographically weighted regression analysis of environmental health justice. Popul. Environ. 2015, 37, 22–43. [Google Scholar] [CrossRef]
- Romero-Lankao, P.; Qin, H.; Borbor-Cordova, M. Exploration of health risks related to air pollution and temperature in three Latin American cities. Soc. Sci. Med. 2013, 83, 110–118. [Google Scholar] [CrossRef] [PubMed]
- Pearce, J.R.; Richardson, E.A.; Mitchell, R.J.; Shortt, N.K. Environmental justice and health: The implications of the socio-spatial distribution of multiple environmental deprivation for health inequalities in the United Kingdom. Trans. Inst. Br. Geogr. 2010, 35, 522–539. [Google Scholar] [CrossRef]
- Gouveia, N.; Fletcher, T. Time series analysis of air pollution and mortality: Effects by cause, age and socioeconomic status. J. Epidemiol. Community Health (1979-) 2000, 54, 750–755. [Google Scholar] [CrossRef]
- Marmot, M.; Wilkinson, R.G. Social Determinants of Health, 2nd ed.; Oxford University Press: Oxford, UK, 2005; ISBN 978-0-19-856589-5. [Google Scholar]
- Munoz-Pizza, D.M.; Villada-Canela, M.; Reyna, M.A.; Texcalac-Sangrador, J.L.; Osornio-Vargas, Á.R. Air pollution and children’s respiratory health: A scoping review of socioeconomic status as an effect modifier. Int. J. Public Health 2020. [Google Scholar] [CrossRef]
- Di, Q.; Dai, L.; Zanobetti, A.; Wang, Y.; Choirat, C.; Dominici, F.; Schwartz, J.D. A nationwide case-crossover study on air pollution and mortality in the medicare population. ISEE Conf. Abstr. 2018. [Google Scholar] [CrossRef]
- Erqou, S.; Clougherty, J.E.; Olafiranye, O.; Magnani, J.W.; Aiyer, A.; Tripathy, S.; Kinnee, E.; Kip, K.E.; Reis, S.E. Particulate matter air pollution and racial differences in cardiovascular disease risk. Arterioscler. Thromb. Vasc. Biol. 2018, 38, 935–942. [Google Scholar] [CrossRef]
- Burra, T.A.; Moineddin, R.; Agha, M.M.; Glazier, R.H. Social disadvantage, air pollution, and asthma physician visits in Toronto, Canada. Environ. Res. 2009, 109, 567–574. [Google Scholar] [CrossRef]
- Forastiere, F.; Stafoggia, M.; Tasco, C.; Picciotto, S.; Agabiti, N.; Cesaroni, G.; Perucci, C.A. Socioeconomic status, particulate air pollution, and daily mortality: Differential exposure or differential susceptibility. Am. J. Ind. Med. 2007, 50, 208–216. [Google Scholar] [CrossRef]
- Grineski, S.E.; Staniswalis, J.G.; Peng, Y.; Atkinson-Palombo, C. Children’s asthma hospitalizations and relative risk due to nitrogen dioxide (NO2): Effect modification by race, ethnicity, and insurance status. Environ. Res. 2010, 110, 178–188. [Google Scholar] [CrossRef]
- Zhang, X.; Chen, X.; Zhang, X. The impact of exposure to air pollution on cognitive performance. Proc. Natl. Acad. Sci. USA 2018, 115, 9193–9197. [Google Scholar] [CrossRef] [PubMed]
- Ailshire, J.; Karraker, A.; Clarke, P. Neighborhood social stressors, fine particulate matter air pollution, and cognitive function among older U.S. adults. Soc. Sci. Med. 2017, 172, 56–63. [Google Scholar] [CrossRef] [PubMed]
- Perera, F.P.; Wheelock, K.; Wang, Y.; Tang, D.; Margolis, A.E.; Badia, G.; Cowell, W.; Miller, R.L.; Rauh, V.; Wang, S.; et al. Combined effects of prenatal exposure to polycyclic aromatic hydrocarbons and material hardship on child ADHD behavior problems. Environ. Res. 2018, 160, 506–513. [Google Scholar] [CrossRef]
- Fu, P.; Guo, X.; Cheung, F.M.H.; Yung, K.K.L. The association between PM2.5 exposure and neurological disorders: A systematic review and meta-analysis. Sci. Total Environ. 2019, 655, 1240–1248. [Google Scholar] [CrossRef] [PubMed]
- Mendoza, D.L.; Pirozzi, C.S.; Crosman, E.T.; Liou, T.G.; Zhang, Y.; Cleeves, J.J.; Bannister, S.C.; Anderegg, W.R.L.; Paine III, R. Absentee and economic impact of low-level fine particulate matter and ozone exposure in k-12 students. arXiv 2020, arXiv:2007.09230. [Google Scholar] [CrossRef]
- USEPA Green Book | US EPA. Utah Nonattainment/Maintenance Status for Each County by Year for All Criteria Pollutants. Available online: https://www3.epa.gov/airquality/greenbook/anayo_ut.html (accessed on 29 June 2020).
- American Lung Association Nearly Half of U.S. Breathing Unhealthy Air; Record-Breaking Air Pollution in Nine Western Cities. Available online: https://www.lung.org/media/press-releases/state-of-the-air-2020 (accessed on 14 July 2020).
- UDAQ, Utah Division of Air Quality 2017 Annual Report 2017. Available online: https://documents.deq.utah.gov/air-quality/annual-reports/DAQ-2018-001005.pdf (accessed on 29 June 2020).
- Beard, J.D.; Beck, C.; Graham, R.; Packham, S.C.; Traphagan, M.; Giles, R.T.; Morgan, J.G. Winter temperature inversions and emergency department visits for asthma in salt lake county, Utah, 2003–2008. Environ. Health Perspect. 2012, 120, 1385–1390. [Google Scholar] [CrossRef]
- Hammoud, A.; Carrell, D.T.; Gibson, M.; Sanderson, M.; Parker-Jones, K.; Peterson, C.M. Decreased sperm motility is associated with air pollution in Salt Lake City. Fertil. Steril. 2010, 93, 1875–1879. [Google Scholar] [CrossRef]
- Pope, C.A.; Renlund, D.G.; Kfoury, A.G.; May, H.T.; Horne, B.D. Relation of heart failure hospitalization to exposure to fine particulate air pollution. Am. J. Cardiol. 2008, 102, 1230–1234. [Google Scholar] [CrossRef]
- Pope, C.A.; Hill, R.W.; Villegas, G.M. particulate air pollution and daily mortality on Utah’s Wasatch front. Environ. Health Perspect. 1999, 107, 567–573. [Google Scholar] [CrossRef]
- Pope, C.A., 3rd. Respiratory hospital admissions associated with PM10 pollution in Utah, Salt Lake, and Cache Valleys. Arch. Environ. Health 1991, 46, 90–97. [Google Scholar] [CrossRef] [PubMed]
- Alloway, T.P.; Alloway, R.G. Investigating the predictive roles of working memory and IQ in academic attainment. J. Exp. Child Psychol. 2010, 106, 20–29. [Google Scholar] [CrossRef]
- Anderson, P. Assessment and Development of executive function (EF) during childhood. Child Neuropsychol. 2002, 8, 71. [Google Scholar] [CrossRef]
- Berrocal, V.J.; Gelfand, A.E.; Holland, D.M. Space-time data fusion under error in computer model output: An application to modeling air quality. Biometrics 2012, 68, 837–848. [Google Scholar] [CrossRef] [PubMed]
- USEPA, O. Downscaler Model for Predicting Daily Air Pollution. Available online: https://www.epa.gov/air-research/downscaler-model-predicting-daily-air-pollution (accessed on 15 July 2020).
- Son, J.-Y.; Lane, K.J.; Miranda, M.L.; Bell, M.L. Health disparities attributable to air pollutant exposure in North Carolina: Influence of residential environmental and social factors. Health Place 2020, 62, 102287. [Google Scholar] [CrossRef] [PubMed]
- Bravo, M.A.; Ebisu, K.; Dominici, F.; Wang, Y.; Peng, R.D.; Bell, M.L. Airborne fine particles and risk of hospital admissions for understudied populations: Effects by urbanicity and short-term cumulative exposures in 708 U.S. counties. Environ. Health Perspect. 2017, 125, 594–601. [Google Scholar] [CrossRef] [PubMed]
- Mirabelli, M.C.; Vaidyanathan, A.; Flanders, W.D.; Qin, X.; Garbe, P. Outdoor PM2.5, ambient air temperature, and asthma symptoms in the past 14 days among adults with active asthma. Environ. Health Perspect. 2016, 124, 1882–1890. [Google Scholar] [CrossRef] [PubMed]
- Nicholson, L.M.; Slater, S.J.; Chriqui, J.F.; Chaloupka, F. Validating adolescent socioeconomic status: Comparing school free or reduced price lunch with community measures. Spat. Demogr. 2014, 2, 55–65. [Google Scholar] [CrossRef]
- Garson, G.D. Generalized Linear Models & Generalized Estimating Equations, 2013th ed.; Statistical Associates Publishers: Asheboro, NC, USA, 2013. [Google Scholar]
- Liang, K.-Y.; Zeger, S.L. Longitudinal data analysis using generalized linear models. Biometrika 1986, 73, 13–22. [Google Scholar] [CrossRef]
- Collins, T.W.; Grineski, S.E.; Chakraborty, J.; Montgomery, M.C.; Hernandez, M. Downscaling environmental justice analysis: Determinants of household-level hazardous air pollutant exposure in Greater Houston. Ann. Assoc. Am. Geogr. 2015, 105, 684–703. [Google Scholar] [CrossRef]
- Chakraborty, J.; Collins, T.W.; Grineski, S.E. Exploring the environmental justice implications of hurricane harvey flooding in Greater Houston, Texas. Am. J. Public Health 2019, 109, 244–250. [Google Scholar] [CrossRef] [PubMed]
- Bullard, R.D. Solid waste sites and the black houston community. Sociol. Inq. 1983, 53, 273–288. [Google Scholar] [CrossRef] [PubMed]
- Dawson, J.F. Moderation in Management Research: What, Why, When, and How. J. Bus. Psychol. 2014, 29, 1–19. [Google Scholar] [CrossRef]
- Block, M.L.; Elder, A.; Auten, R.L.; Bilbo, S.D.; Chen, H.; Chen, J.-C.; Cory-Slechta, D.A.; Costa, D.; Diaz-Sanchez, D.; Dorman, D.C.; et al. The outdoor air pollution and brain health workshop. Neurotoxicology 2012, 33, 972–984. [Google Scholar] [CrossRef] [PubMed]
- Vreeland, H.; Weber, R.; Bergin, M.; Greenwald, R.; Golan, R.; Russell, A.G.; Verma, V.; Sarnat, J.A. Oxidative potential of PM2.5 during Atlanta rush hour: Measurements of in-vehicle dithiothreitol (DTT) activity. Atmos. Environ. 2017, 165, 169–178. [Google Scholar] [CrossRef]
- Schraufnagel, D.E.; Balmes, J.R.; Cowl, C.T.; De Matteis, S.; Jung, S.-H.; Mortimer, K.; Perez-Padilla, R.; Rice, M.B.; Riojas-Rodriguez, H.; Sood, A.; et al. Air pollution and noncommunicable diseases: A review by the forum of international respiratory societies’ environmental committee, Part 1: The damaging effects of air pollution. Chest 2019, 155, 409–416. [Google Scholar] [CrossRef]
- Burnett, R.; Chen, H.; Szyszkowicz, M.; Fann, N.; Hubbell, B.; Pope, C.A.; Apte, J.S.; Brauer, M.; Cohen, A.; Weichenthal, S.; et al. Global estimates of mortality associated with long-term exposure to outdoor fine particulate matter. Proc. Natl. Acad. Sci. USA 2018, 115, 9592–9597. [Google Scholar] [CrossRef]
- Bell, M.L.; Peng, R.D.; Dominici, F. The exposure–response curve for ozone and risk of mortality and the adequacy of current ozone regulations. Env. Health Perspect. 2006, 114, 532–536. [Google Scholar] [CrossRef]
- Briscoe, J. HB 0353: Reduction of Single Occupancy Vehicle Trips Pilot Program. Available online: https://le.utah.gov/~2019/bills/static/HB0353.html (accessed on 16 July 2020).
- Escamilla, L. SB 0112: Inland Port Amendments. Available online: https://le.utah.gov/~2020/bills/static/SB0112.html (accessed on 16 July 2020).
- Quintana, S.M.; Mahgoub, L. Ethnic and racial disparities in education: Psychology’s role in understanding and reducing disparities. Theory Into Pract. 2016, 55, 94–103. [Google Scholar] [CrossRef]
- Tenenbaum, H.R.; Ruck, M.D. Are teachers’ expectations different for racial minority than for European American students? A meta-analysis. J. Educ. Psychol. 2007, 99, 253–273. [Google Scholar] [CrossRef]
- Steele, C.M.; Aronson, J. Stereotype threat and the intellectual test performance of African Americans. J. Personal. Soc. Psychol. 1995, 69, 797–811. [Google Scholar] [CrossRef]
- Wasserberg, M.J. Stereotype Threat Effects on African American Children in an Urban Elementary School. J. Exp. Educ. 2014, 82, 502–517. [Google Scholar] [CrossRef]
- Grineski, S.E.; Collins, T.W.; Chakraborty, J.; McDonald, Y.J. Environmental health injustice: Exposure to air toxics and children’s respiratory hospital admissions in El Paso, Texas. Prof. Geogr. 2013, 65, 31–46. [Google Scholar] [CrossRef]
- Faught, E.L.; Williams, P.L.; Willows, N.D.; Asbridge, M.; Veugelers, P.J. The association between food insecurity and academic achievement in Canadian school-aged children. Public Health Nutr. 2017, 20, 2778–2785. [Google Scholar] [CrossRef]
- Rubin, D.H.; Erickson, C.J.; Agustin, M.S.; Cleary, S.D.; Allen, J.K.; Cohen, P. Cognitive and academic functioning of homeless children compared with housed children. Pediatrics 1996, 97, 289–294. [Google Scholar]
- Herbers, J.E.; Cutuli, J.J.; Supkoff, L.M.; Heistad, D.; Chan, C.-K.; Hinz, E.; Masten, A.S. Early reading skills and academic achievement trajectories of students facing poverty, homelessness, and high residential mobility. Educ. Res. 2012, 41, 366–374. [Google Scholar] [CrossRef]
- Zweig, J.S.; Ham, J.C.; Avol, E.L. Air Pollution and Academic Performance: Evidence from California Schools. Available online: http://econweb.umd.edu/~ham/test%20scores%20submit.pdf (accessed on 4 September 2020).
- Meng, Q.Y.; Spector, D.; Colome, S.; Turpin, B. Determinants of indoor and personal exposure to PM2.5 of indoor and outdoor origin during the RIOPA study. Atmos. Environ. 2009, 43, 5750–5758. [Google Scholar] [CrossRef]
- Guo, H.; Morawska, L.; He, C.; Zhang, Y.L.; Ayoko, G.; Cao, M. Characterization of particle number concentrations and PM2.5 in a school: Influence of outdoor air pollution on indoor air. Envrion. Sci. Pollut. Res. Int. 2010, 17, 1268–1278. [Google Scholar] [CrossRef]
- Tippayawong, N.; Khuntong, P.; Nitatwichit, C.; Khunatorn, Y.; Tantakitti, C. Indoor/outdoor relationships of size-resolved particle concentrations in naturally ventilated school environments. Build. Environ. 2009, 44, 188–197. [Google Scholar] [CrossRef]
- Monn, C. Exposure assessment of air pollutants: A review on spatial heterogeneity and indoor/outdoor/personal exposure to suspended particulate matter, nitrogen dioxide and ozone. Atmos. Environ. 2001, 35, 1–32. [Google Scholar] [CrossRef]
- Baek, S.-O.; Kim, Y.-S.; Perry, R. Indoor air quality in homes, offices and restaurants in Korean urban areas—indoor/outdoor relationships. Atmos. Environ. 1997, 31, 529–544. [Google Scholar] [CrossRef]
- Andersen, I. Relationships between outdoor and indoor air pollution. Atmos. Env. 1972, 6, 275–278. [Google Scholar] [CrossRef]
- Loftus, C.T.; Hazlehurst, M.F.; Szpiro, A.A.; Ni, Y.; Tylavsky, F.A.; Bush, N.R.; Sathyanarayana, S.; Carroll, K.N.; Karr, C.J.; LeWinn, K.Z. Prenatal air pollution and childhood IQ: Preliminary evidence of effect modification by folate. Environ. Res. 2019, 176, 108505. [Google Scholar] [CrossRef] [PubMed]
- Lee, A.; Hsu, H.-H.L.; Chiu, Y.-H.M.; Bose, S.; Rosa, M.J.; Kloog, I.; Wilson, A.; Schwartz, J.; Cohen, S.; Coull, B.A.; et al. Prenatal fine particulate exposure and early childhood asthma: Effect of maternal stress and fetal gender. J. Allergy. Clin. Immunol. 2018, 141, 1880–1886. [Google Scholar] [CrossRef]
- Lewis-Mccoy, R.L. Inequality in the Promised Land: Race, Resources, and Suburban Schooling; Stanford University Press: Stanford, CA, USA, 2014; ISBN 978-0-8047-9070-3. [Google Scholar]
- Risom, J.; Schuff, S.; Martine, L.J.; Westermark, E.; Kielgast, L.V.; Akers, A.; Bengtsson, K.; Thorsen, S. Air Quality/Copenhagen: Reducing Air Pollution through Urban Design. Available online: https://gehlpeople.com/projects/air-quality-copenhagen/ (accessed on 29 June 2020).
- USEPA, O. Living Close to Roadways: Health Concerns and Mitigation Strategies. Available online: https://www.epa.gov/sciencematters/living-close-roadways-health-concerns-and-mitigation-strategies (accessed on 29 June 2020).
- Makar, M.; Antonelli, J.; Di, Q.; Cutler, D.; Schwartz, J.; Dominici, F. Estimating the causal effect of fine particulate matter levels on death and hospitalization: Are levels below the safety standards harmful? Epidemiology 2017, 28, 627–634. [Google Scholar] [CrossRef]


| Variables | Yes (N, Number of Schools)) | No (N, Number of Schools) | N (Number of Schools) | Minimum | Maximum | Mean | Standard Deviation |
|---|---|---|---|---|---|---|---|
| Air Pollution Variables, | |||||||
| Chronic PM2.5 a | 156 | 6.66 | 8.70 | 8.08 | 0.38 | ||
| Frequency of peak PM2.5 b | 156 | 11.00 | 21.00 | 18.50 | 1.80 | ||
| Academic Proficiency Variables | |||||||
| Percentage below proficiency in math (Spring 2017) | 156 | 2.53 | 74.67 | 31.79 | 16.78 | ||
| Percentage below proficiency in English and language art (Spring 2017) | 156 | 2.53 | 81.25 | 30.99 | 17.61 | ||
| Sociodemographic Variables | |||||||
| School disadvantage factor (2016–2017) | 156 | −1.26 | 2.04 | 0.00 | 1.00 | ||
| Percent free/reduced-price meals | 156 | 8 | 99 | 46.83 | 27.95 | ||
| Percent Hispanic | 156 | 2 | 74 | 26.34 | 19.74 | ||
| Percent non-Hispanic minority | 156 | 4 | 37 | 12.76 | 6.27 | ||
| Title 1 | 47 | 109 | 156 | ||||
| School Characteristics | |||||||
| School enrollment (2016–2017) | 156 | 309 | 1231 | 626.07 | 183.50 | ||
| Canyons School District | 28 | 128 | 156 | ||||
| Granite School District | 62 | 94 | 156 | ||||
| Jordan School District | 34 | 122 | 156 | ||||
| Murray School District | 6 | 150 | 156 | ||||
| Salt Lake City School District | 26 | 130 | 156 |
| Variable | Model 1 | Model 2 | ||
|---|---|---|---|---|
| Coefficient p (Standard Error) | 95% Confidence Interval | Coefficient p (Standard Error) | 95% Confidence Interval | |
| Intercept | 2.12 *** | 17.37 *** | ||
| District a | ||||
| Canyons | −0.48 *** (0.04) | −0.56, −0.39 | 1.37 *** (0.30) | 0.78, 0.96 |
| Granite | −0.29 *** (0.05) | −0.37, −0.18 | 0.97 ** (0.34) | 0.30, 1.64 |
| Jordan | −0.72 *** (0.09) | −0.90, −0.55 | 1.46 *** (0.35) | 0.77, 2.15 |
| Murray | −0.12 *** (0.03) | −0.19, −0.06 | 3.09 *** (0.59) | 1.94, 4.24 |
| Total enrollment (standardized) | 0.00 (0.02) | −0.03, 0.04 | −0.10 (0.13) | −0.35, 0.16 |
| School disadvantage | 0.14 *** (0.02) | 0.10, 0.17 | 1.28 *** (0.16) | 0.98, 1.59 |
| Variable | Model 3 | Model 4 | Model 5 | Model 6 | Model 7 | |||||
|---|---|---|---|---|---|---|---|---|---|---|
| Coefficient p (Standard Error) | 95% Confidence Interval | Coefficient p (Standard Error) | 95% Confidence Interval | Coefficient p (Standard Error) | 95% Confidence Interval | Coefficient p (Standard Error) | 95% Confidence Interval | Coefficient p (Standard Error) | 95% Confidence Interval | |
| Intercept | −219.85 *** (46.01) | −310.02, −129.68 | −50.59 *** (13.38) | −76.81, −24.37 | −38.39 (32.41) | −101.91, 25.14 | −9.32 (10.49) | −29.88, 11.25 | 8.86 (11.42) | 13.24, 0.60 |
| District a | ||||||||||
| Canyons | 13.57 ** (5.47) | 2.85, 24.29 | −3.54 (3.23) | −9.86, 2.78 | 13.86 *** (3.42) | 7.16, 20.56 | 8.95 *** (2.80) | 3.47, 14.44 | 7.95 ** (2.60) | 2.85, 13.05 |
| Granite | 25.91 *** (2.75) | 20.51, 31.31 | 14.44 *** (2.51) | 9.52, 19.34 | 26.14 *** (2.23) | 21.77, 30.51 | 22.01 *** (2.37) | 17.36, 26.67 | 20.51 *** (2.21) | 16.18, 24.83 |
| Jordan | 31.72 *** (5.91 | 20.14, 43.31 | 8.74 * (3.82) | 1.25, 16.22 | 27.39 *** (4.31) | 18.94, 35.84 | 21.06 *** (3.34) | 14.51, 27.06 | 19.93 *** (3.19) | 13.68, 26.19 |
| Murray | 4.39 (3.32) | −2.12, 10.90 | −10.44 * (4.24) | −18.74, −2.14 | 8.35 *** (2.16) | 4.11, 12.58 | 3.25 (2.69) | −2.02, 8.53 | 1.31 (2.61) | −3.81, 6.43 |
| Total enrollment (standardized) | −2.29 ** (0.87) | −3.99, −0.58 | −2.44 ** (0.83) | −4.07, −0.82 | −2.71 *** (0.85) | −4.38, −1.04 | −2.65 *** (0.79) | −4.19, −1.11 | −2.41 ** (0.71) | −3.80, −1.01 |
| Daily annual average PM2.5 | 28.70 *** (5.43) | 18.06, 39.33 | 6.49 (3.83) | −1.02, 14.00 | ||||||
| Frequency of peak PM2.5 | 4.09 *** (0.73) | 2.65, 5.52 | 1.46 ** (0.58) | 0.33, 2.60 | 0.65 (0.61) | −0.54, 1.83 | ||||
| School disadvantage | 11.70 *** (1.15) | 9.45, 13.94 | 10.73 *** (1.12) | 8.54, 12.92 | 44.18 *** (12.24) | 20.20, 68.17 | ||||
| DisadvantageXpeak PM2.5 | −1.73 ** (0.64) | −2.98, −0.48 | ||||||||
| Variable | Model 8 | Model 9 | Model 10 | Model 11 | Model 12 | |||||
|---|---|---|---|---|---|---|---|---|---|---|
| Coefficient p (Standard Error) | 95% Confidence Interval | Coefficient p (Standard Error) | 95% Confidence Interval | Coefficient p (Standard Error) | 95% Confidence Interval | Coefficient p (Standard Error) | 95% Confidence Interval | Coefficient p (Standard Error) | 95% Confidence Interval | |
| Intercept | −210.09 *** (47.46) | −303.11, −117.07 | −46.27 ** (16.86) | −79.31, −13.23 | −29.55 (46.32) | −120.33, 61.23 | −13.21 (13.25) | −39.17, 12.76 | −3.79 (16.75) | −36.63, 29.04 |
| District a | ||||||||||
| Canyons | 7.37 (5.67) | −3.74, 18.47 | −8.31 ** (3.16) | −14.51, −2.11 | 8.40 ** (3.86) | 0.84, 16.00 | 3.70 (2.66) | −1.51, 8.90 | 2.55 (2.78) | −2.90, 8.00 |
| Granite | 23.54 *** (3.47) | 16.73, 30.35 | 13.04 *** (2.99) | 7.19, 18.90 | 23.45 ***(3.07) | 17.43, 29.46 | 19.83 *** (2.76) | 14.42, 25.25 | 18.25 *** (2.93) | 12.50, 24.00 |
| Jordan | 24.55 *** (6.21) | 12.38, 36.71 | 4.40 (3.69) | −2.85, 11.64 | 20.69 *** (4.68) | 11.51, 29.87 | 14.75 *** (2.95) | 9.00, 20.53 | 13.60 *** (3.23) | 7.27, 19.94 |
| Murray | 2.32 (3.89) | −5.29, 9.94 | −12.19 ** (4.36) | −20.73, −3.65 | 6.32 ** (2.58) | 1.28, 11.37 | 0.34 (3.15) | −5.83, 6.52 | −1.80 (3.53) | −8.71, 5.12 |
| Total enrollment | −2.01 ** (0.93) | −3.83, −0.19 | −3.36 ** (1.14) | −5.60, −1.12 | −2.47 ** (0.91) | −4.24, −0.70 | −2.63 *** (0.81) | −4.22, −1.05 | −2.62 ** (0.88) | −4.40, −0.90 |
| Daily annual average PM2.5 | 27.81 *** (5.58) | 16.87, 38.74 | 5.68 (5.48) | −5.06, 16.42 | ||||||
| Frequency of peak PM2.5 | 3.92 *** (0.92) | 2.12, 5.73 | 1.79 ** (0.74) | 0.35, 3.23 | 1.41 (0.88) | −0.32, 3.14 | ||||
| Disadvantage | 11.53 *** (1.39) | 8.18, 14.25 | 10.00 *** (1.42) | 7.30, 12.80 | 33.99 ** (16.97) | 0.73, 67.25 | ||||
| DisadvantageXpeak PM2.5 | −1.27 (0.88) | −2.98, 0.45 | ||||||||
© 2020 by the authors. Licensee MDPI, Basel, Switzerland. This article is an open access article distributed under the terms and conditions of the Creative Commons Attribution (CC BY) license (http://creativecommons.org/licenses/by/4.0/).
Share and Cite
Mullen, C.; Grineski, S.E.; Collins, T.W.; Mendoza, D.L. Effects of PM2.5 on Third Grade Students’ Proficiency in Math and English Language Arts. Int. J. Environ. Res. Public Health 2020, 17, 6931. https://doi.org/10.3390/ijerph17186931
Mullen C, Grineski SE, Collins TW, Mendoza DL. Effects of PM2.5 on Third Grade Students’ Proficiency in Math and English Language Arts. International Journal of Environmental Research and Public Health. 2020; 17(18):6931. https://doi.org/10.3390/ijerph17186931
Chicago/Turabian StyleMullen, Casey, Sara E. Grineski, Timothy W. Collins, and Daniel L. Mendoza. 2020. "Effects of PM2.5 on Third Grade Students’ Proficiency in Math and English Language Arts" International Journal of Environmental Research and Public Health 17, no. 18: 6931. https://doi.org/10.3390/ijerph17186931
APA StyleMullen, C., Grineski, S. E., Collins, T. W., & Mendoza, D. L. (2020). Effects of PM2.5 on Third Grade Students’ Proficiency in Math and English Language Arts. International Journal of Environmental Research and Public Health, 17(18), 6931. https://doi.org/10.3390/ijerph17186931