Risk Perception of Air Pollution: A Systematic Review Focused on Particulate Matter Exposure

 ,
,  ,
,  ,
,  and
and 
Abstract
1. Introduction
1.1. Risk Perception
1.2. Particulate Matter Pollution and Health
1.3. Policies
2. Materials and Methods
2.1. Search Strategy
2.2. Criteria for Eligibility
- Perception concerns, exclusively PM exposure; if exposure refers to several pollutants or environmental matrices, PM should be specifically mentioned;
- PM levels are always measured, both directly and indirectly, and exposure refers to the specific population;
- PM measurement is only conducted outdoors;
- PM can also be included in an air quality index, AQI, while perception must always be measured, both directly and indirectly;
- Perception can be evaluated via quantitative or qualitative methods.
2.3. Study Selection
2.4. Data Extraction
2.5. Perception Conceptual Dimensions
3. Results
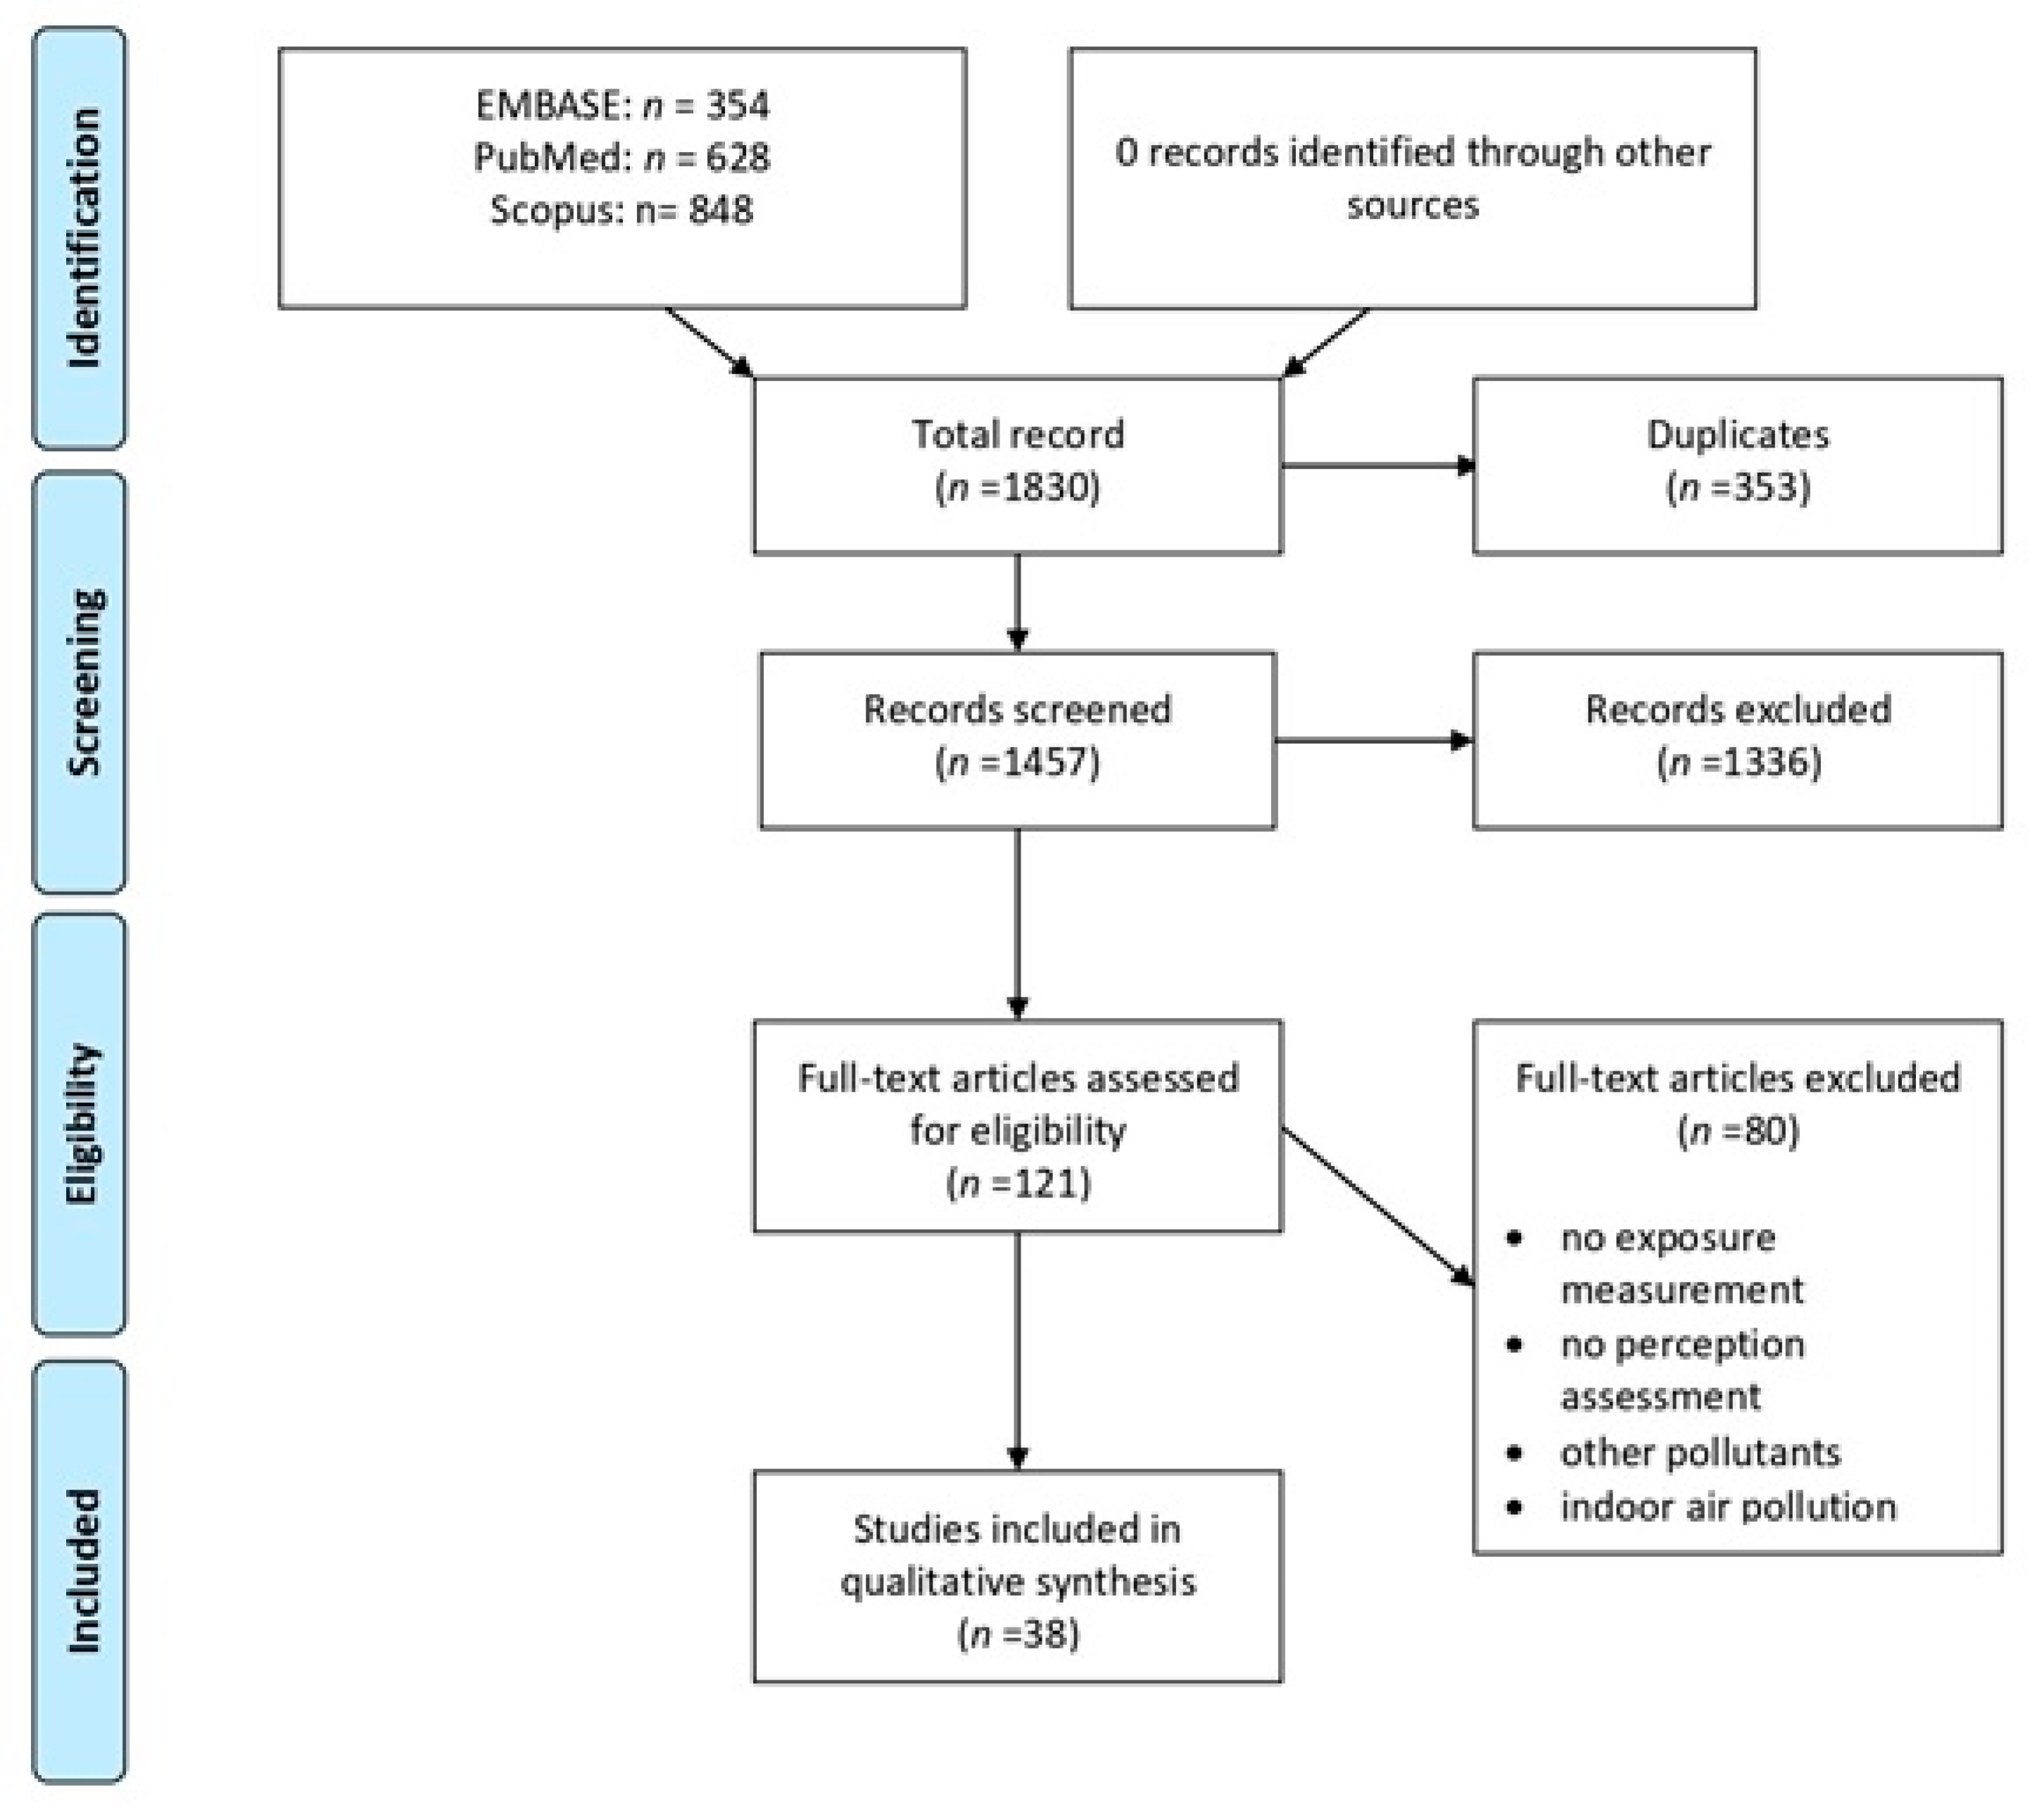
3.1. Search Results and Study Characteristics
- Studies where the main exposures referred to tobacco smoke, indoor settings, specific pollutants originating from industries, or other anthropogenic sources such as caves and mines;
- Studies evaluating health outcomes related to air pollution, but not to perception or risk perception;
- Generic studies, editorials, or abstracts in proceedings of conferences.
- PM exposure measurement;
- Perception assessment;
- Presence of indoor air pollution;
- Presence of other pollutants.
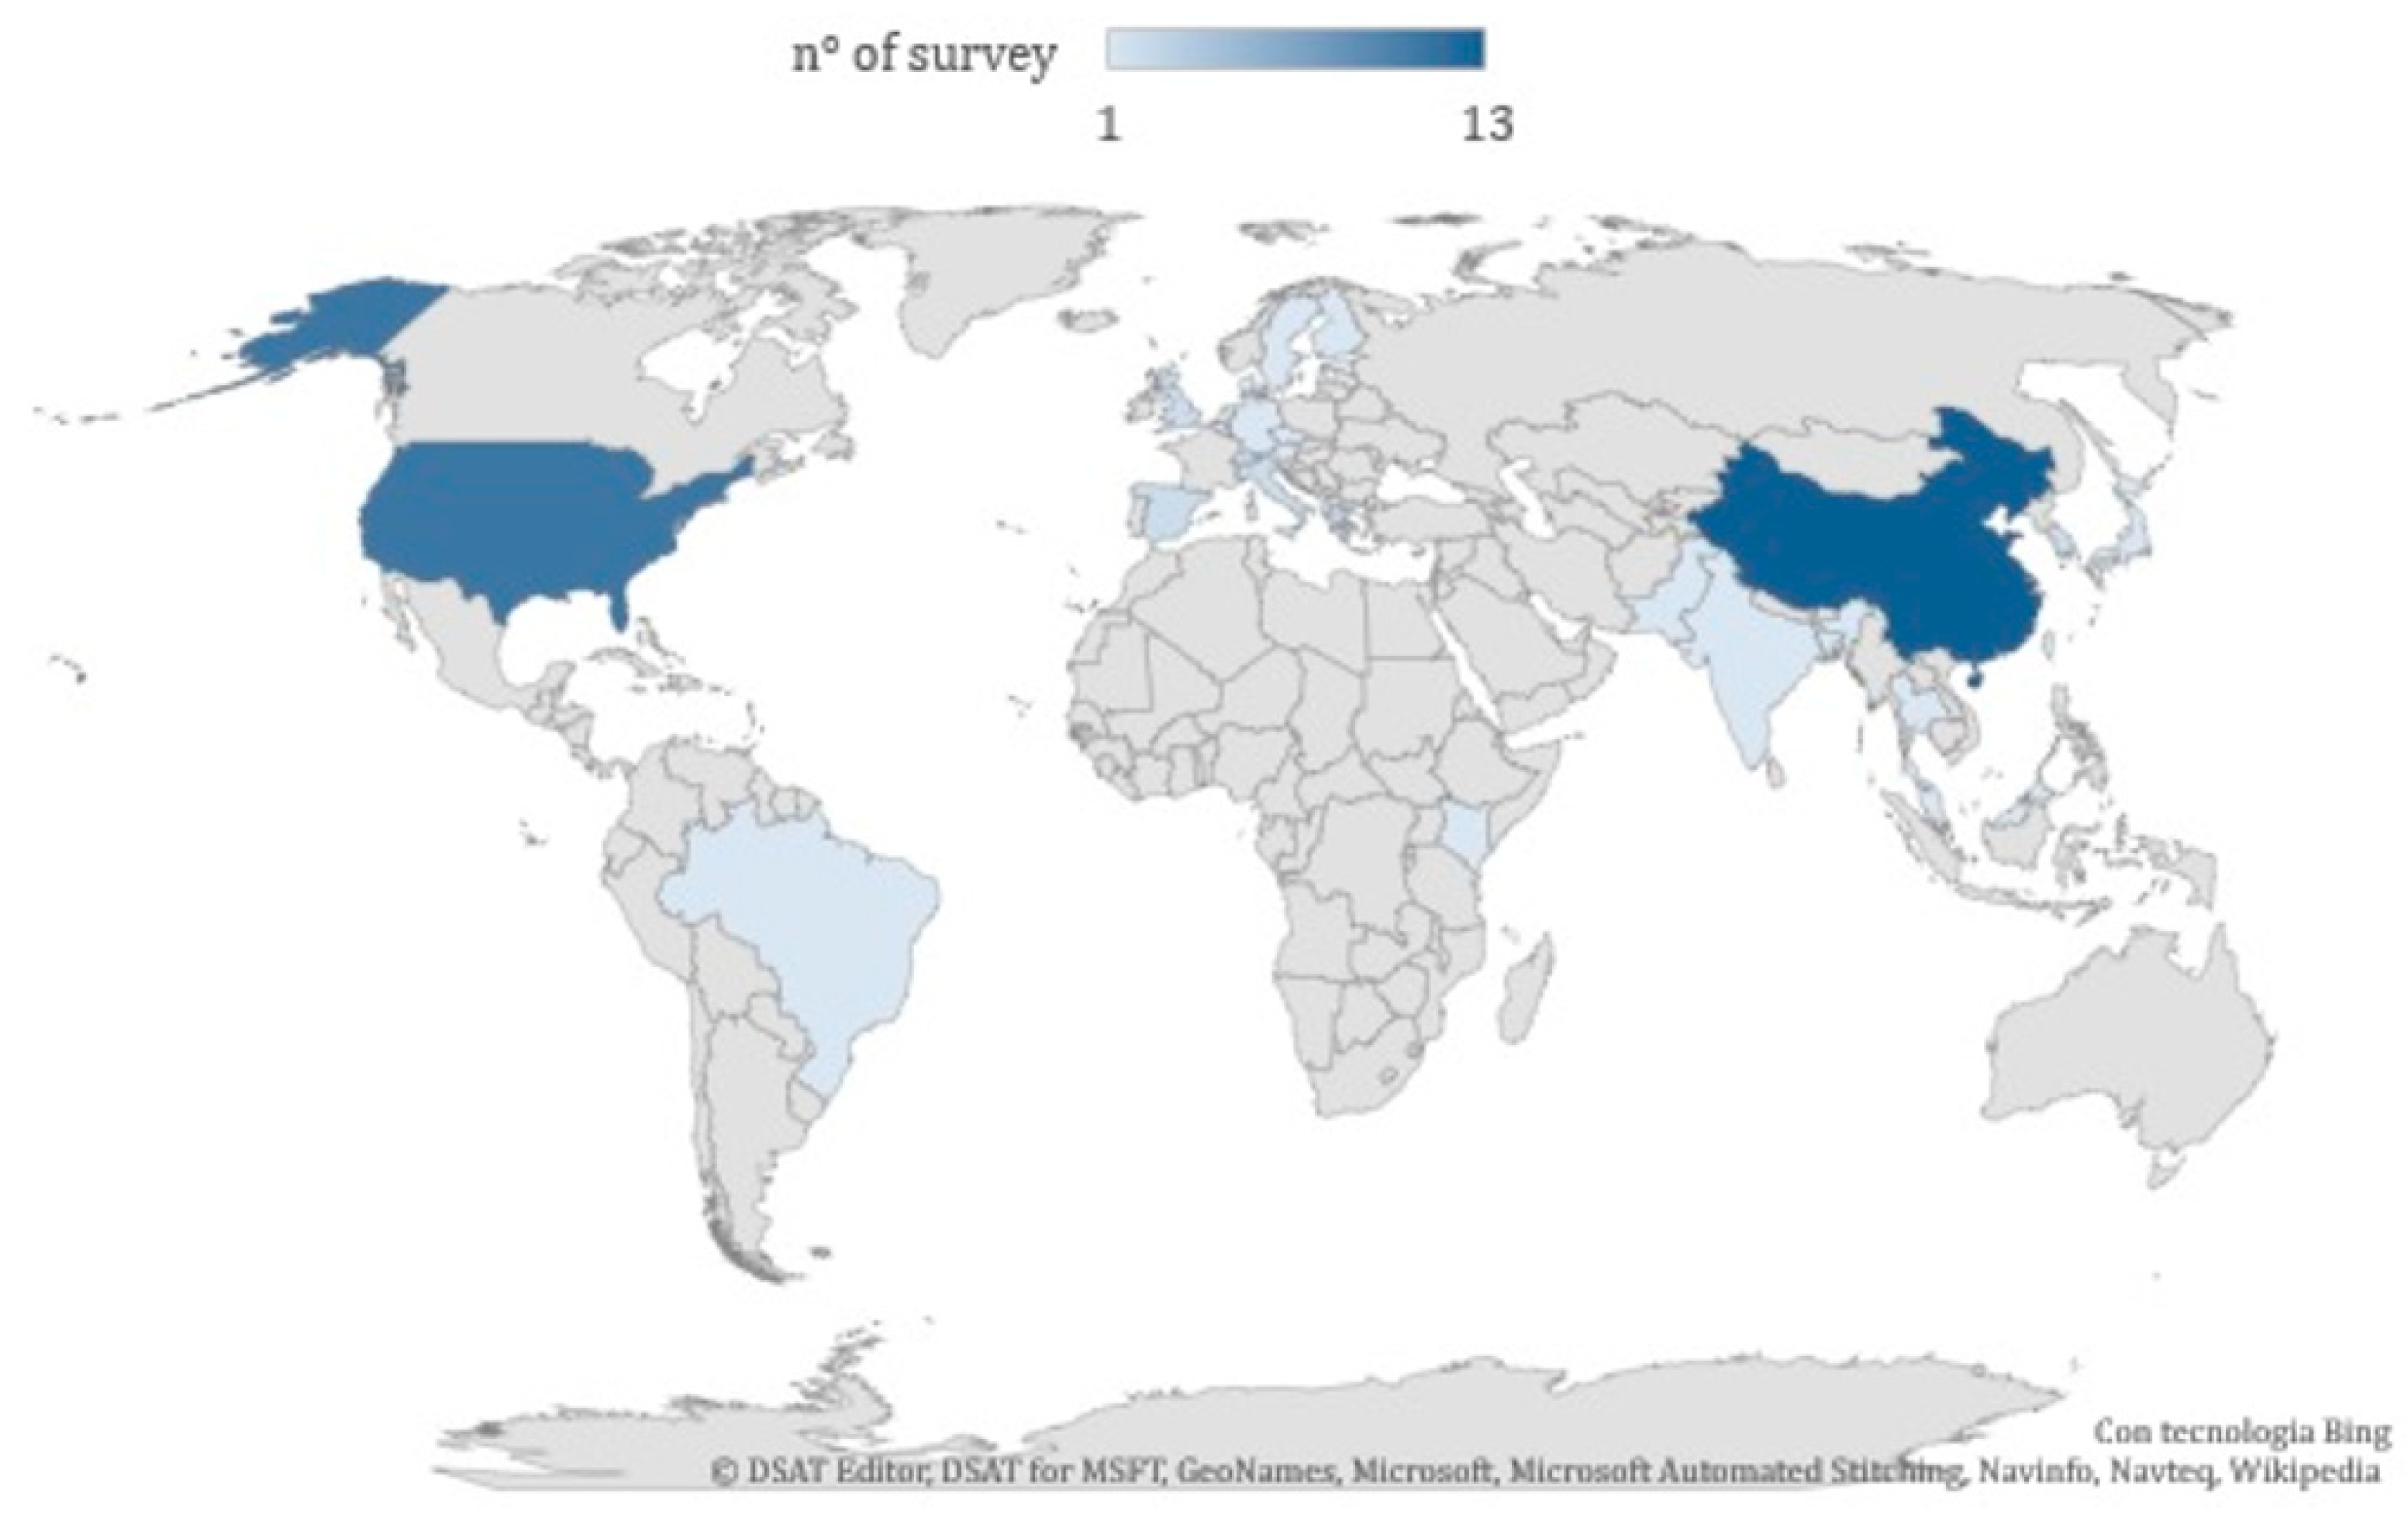
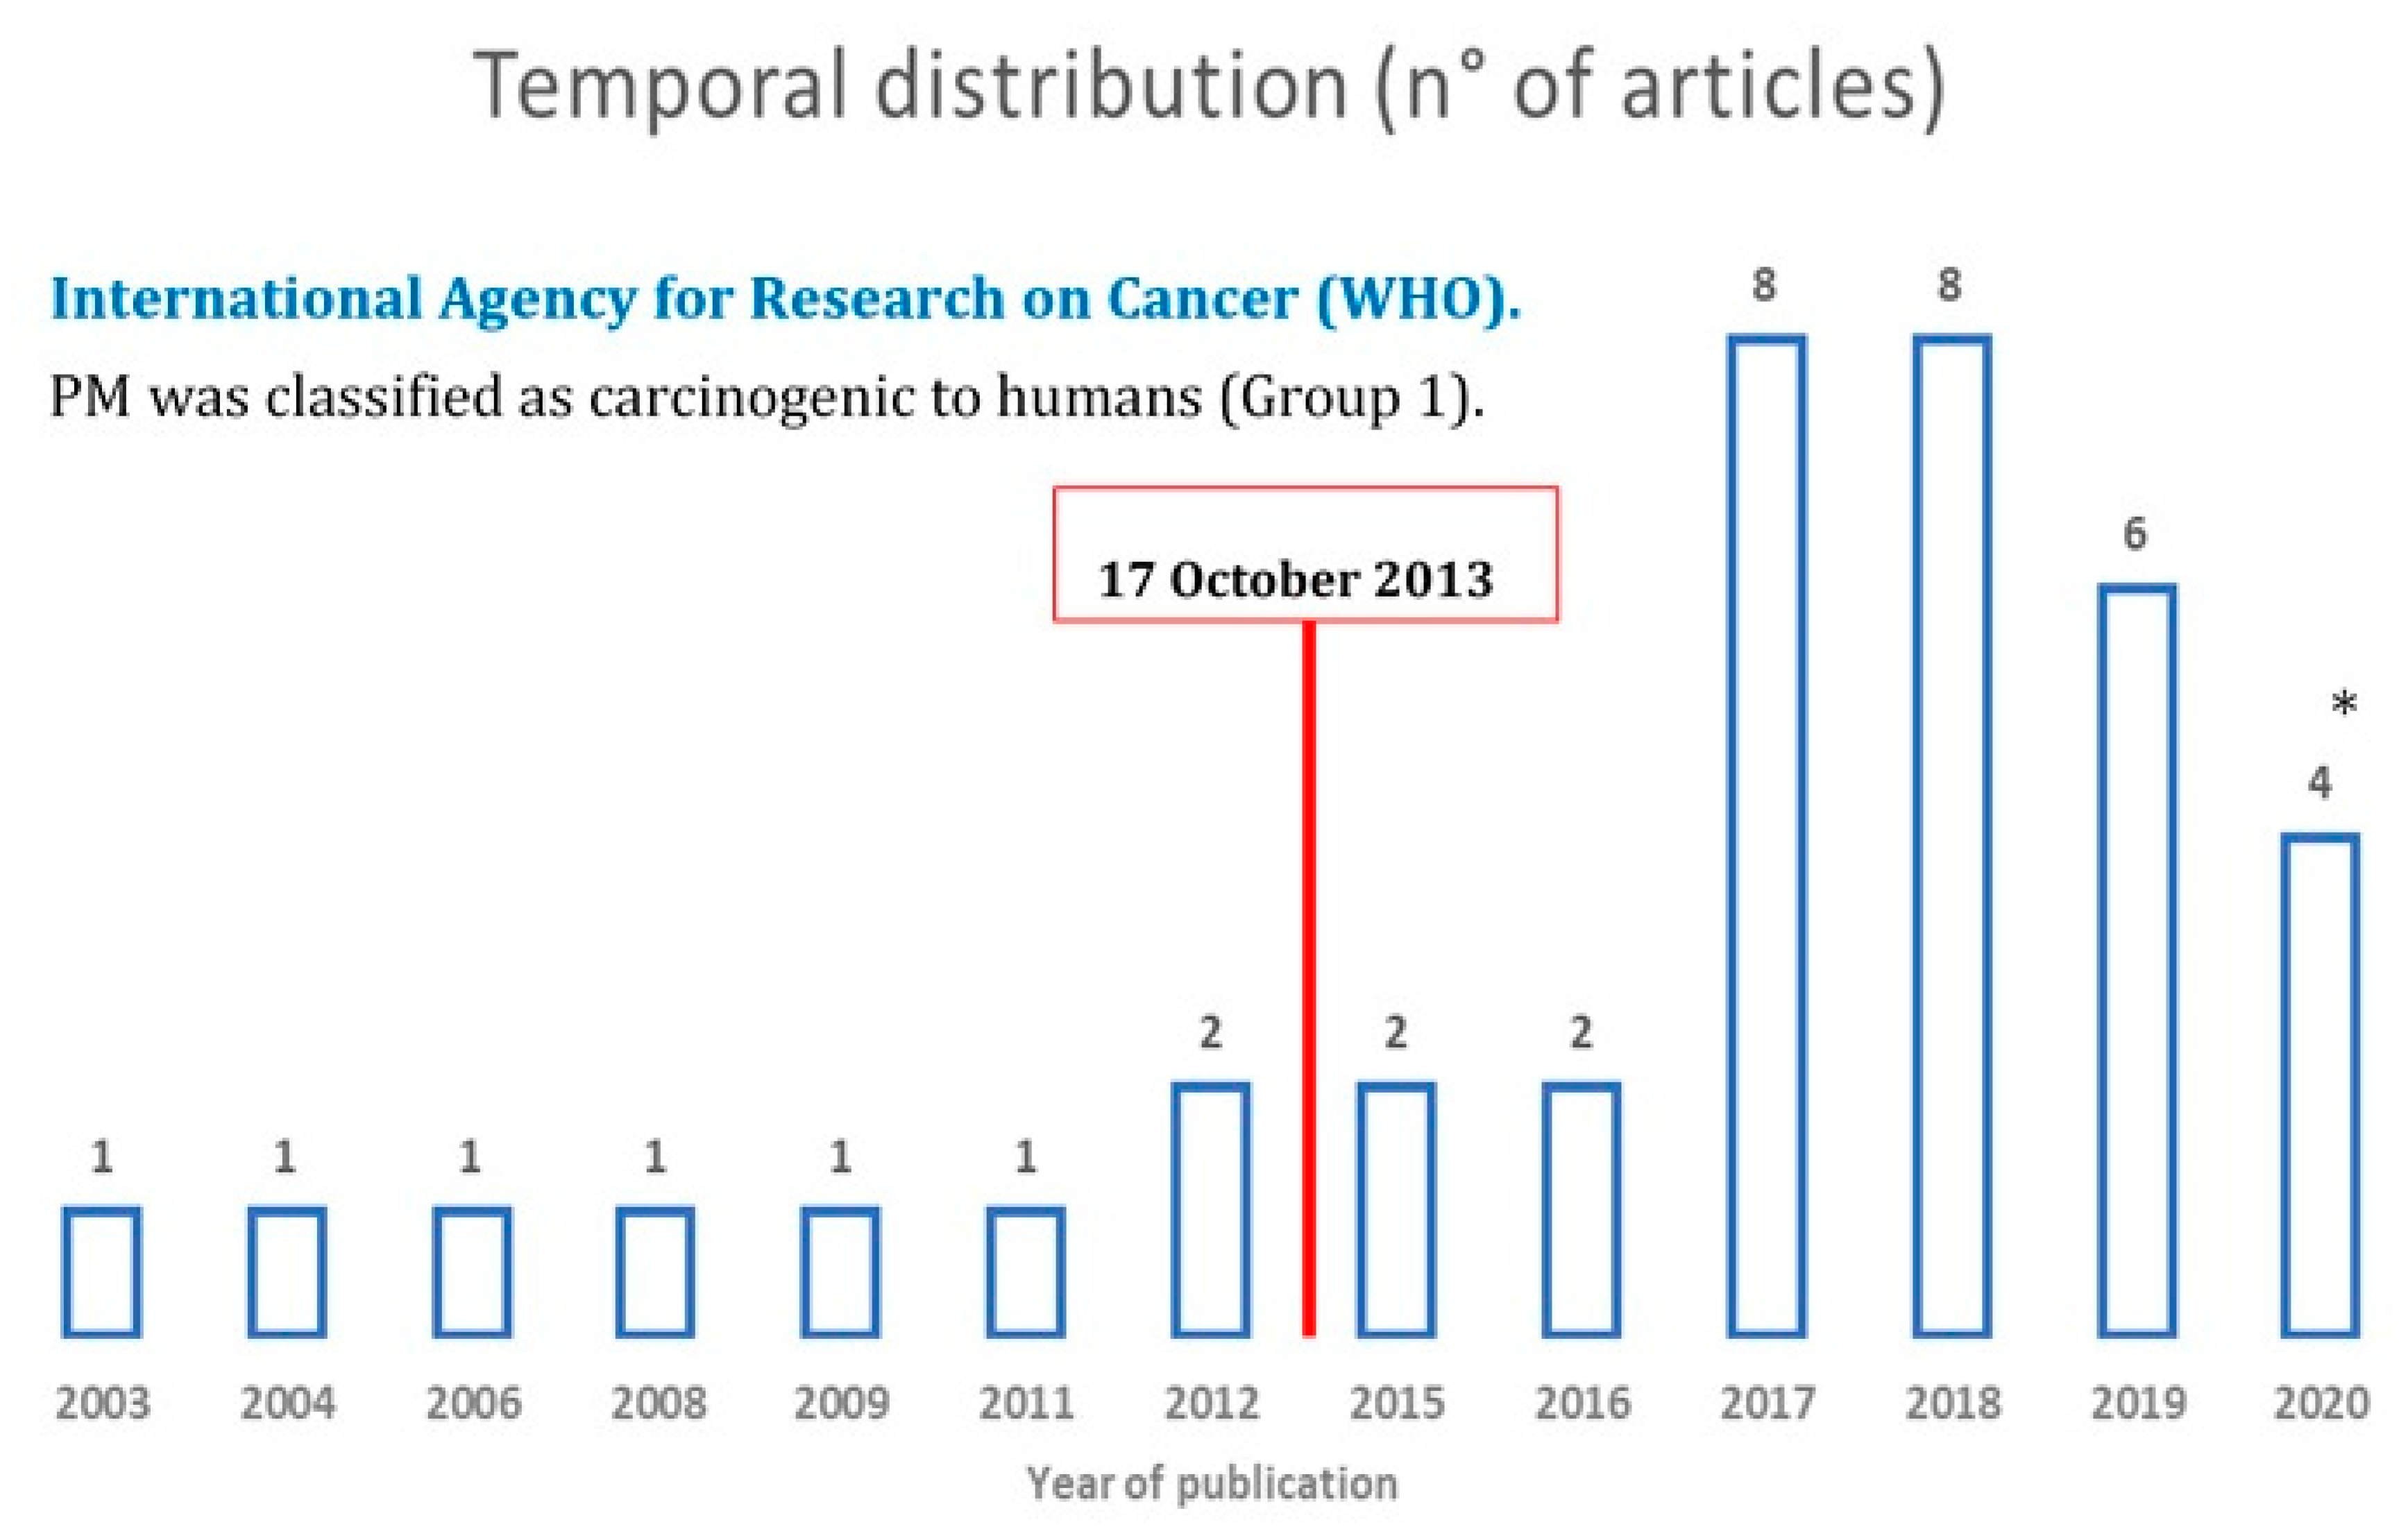
3.2. Geographical and Timeline Distribution
3.3. Exposure Assessment of Particulate Matter (PM)
3.4. Study Design and Population
3.4.1. Population Studies
3.4.2. Web-Based Studies
3.4.3. Procedures of the Studies
3.5. Risk Perception
4. Discussion
4.1. Big Data Utilization and Applications
4.2. Communication and Recommendations
4.3. Strength, Limitations, and Future Lines of Research
5. Conclusions
Author Contributions
Funding
Acknowledgments
Conflicts of Interest
Abbreviations
| AQ | air quality |
| AQI | Air Quality Index |
| PM | particulate matter |
| EU | European Community |
| WTP | Willingness to Pay |
References
- Cori, L.; Bianchi, F.; Cadum, E.; Anthonj, C. Risk Perception and COVID-19. Int. J. Environ. Res. Public Health 2020, 17, 3114. [Google Scholar] [CrossRef]
- Cori, L.; Bianchi, F. Covid-19 and air pollution: Communicating the results of geographic correlation studies. Epidemiol. Prev. 2020, 44, 120–123. [Google Scholar] [CrossRef] [PubMed]
- Rosa, E.A.; Renn, O.; McCright, A.M. The Risk Society Revisited: Social Theory and Risk Governance; Temple University Press: Philadelphia, PA, USA, 2014. [Google Scholar]
- Ropeik, D. Understanding Factors of Risk Perception. Available online: https://niemanreports.org/articles/understanding-factors-of-risk-perception/ (accessed on 10 August 2020).
- Slovic, P.; Peters, E.; Finucane, M.L.; Macgregor, D.G. Affect, risk, and decision making. Health Psychol. 2005, 24, S35–S40. [Google Scholar] [CrossRef] [PubMed]
- Yun, K.; Lurie, N.; Hyde, P.S. Moving mental health into the disaster-preparedness spotlight. N. Engl. J. Med. 2010, 363, 1193–1195. [Google Scholar] [CrossRef]
- Flynn, J.; Slovic, P.; Mertz, C.K. Gender, Race, and Perception of Environmental Health Risks. Risk Anal. 1994, 14, 1101–1108. [Google Scholar] [CrossRef] [PubMed]
- Pidgeon, N. Risk assessment, risk values and the social science programme: Why we do need risk perception research. Reliab. Eng. Syst. Saf. 1998, 59, 5–15. [Google Scholar] [CrossRef]
- Renn, O. Perception of risks. Toxicol. Lett. 2004, 149, 405–413. [Google Scholar] [CrossRef]
- Nelson, J.W.; Scammell, M.K.; Altman, R.G.; Webster, T.F.; Ozonoff, D.M. A new spin on research translation: The Boston Consensus Conference on Human Biomonitoring. Environ. Health Perspect. 2009, 117, 495–499. [Google Scholar] [CrossRef]
- Nieuwenhuijsen, M.J. Exposure Assessment in Environmental Epidemiology; Oxford University Press: Oxford, UK, 2015; ISBN 978-0-19-937881-4. [Google Scholar]
- Funtowicz, S.O.; Ravetz, J.R. Risk management as a postnormal science. Risk Anal 1992, 12, 95–97. [Google Scholar] [CrossRef]
- Coi, A.; Minichilli, F.; Bustaffa, E.; Carone, S.; Santoro, M.; Bianchi, F.; Cori, L. Risk perception and access to environmental information in four areas in Italy affected by natural or anthropogenic pollution. Environ. Int. 2016, 95, 8–15. [Google Scholar] [CrossRef]
- Carducci, A.; Fiore, M.; Azara, A.; Bonaccorsi, G.; Bortoletto, M.; Caggiano, G.; Calamusa, A.; De Donno, A.; De Giglio, O.; Dettori, M.; et al. Environment and health: Risk perception and its determinants among Italian university students. Sci. Total Environ. 2019, 691, 1162–1172. [Google Scholar] [CrossRef] [PubMed]
- Signorino, G. Proximity and risk perception. Comparing risk perception ‘profiles’ in two petrochemical areas of Sicily (Augusta and Milazzo). J. Risk Res. 2012, 15, 1223–1243. [Google Scholar] [CrossRef]
- Mudu, P.; Terracini, B.; Martuzzi, M. Human Health in Areas with Industrial Contamination; WHO Regional Office for Europe: Copenhagen, Denmark, 2014; ISBN 978-9-289-05005-0.
- Carducci, A.; Donzelli, G.; Cioni, L.; Palomba, G.; Verani, M.; Mascagni, G.; Anastasi, G.; Pardini, L.; Ceretti, E.; Grassi, T.; et al. Air pollution: A study of citizen’s attitudes and behaviors using different information sources. Epidemiol. Biostat. Public Health 2017, 14. [Google Scholar] [CrossRef]
- Zinn, J.O. Recent Developments in Sociology of Risk and Uncertainty. Hist. Soc. Res./Hist. Soz. 2006, 31, 275–286. [Google Scholar]
- Douglas, M.; Wildavsky, A. Risk and Culture; University of California Press: Berkeley, CA, USA, 1983; ISBN 978-0-520-05063-1. [Google Scholar]
- Kasperson, R.E.; Renn, O.; Slovic, P.; Brown, H.S.; Emel, J.; Goble, R.; Kasperson, J.X.; Ratick, S. The Social Amplification of Risk: A Conceptual Framework. Risk Anal. 1988, 8, 177–187. [Google Scholar] [CrossRef]
- Aven, T.; Renn, O. Risk, Governance and Society. In Risk Management and Governance: Concepts, Guidelines and Applications; Springer: Berlin/Heidelberg, Germany, 2010; ISBN 978-3-642-13925-3. [Google Scholar]
- Renn, O.; Rohrmann, B. Risk, Governance and Society. In Cross-Cultural Risk Perception: A Survey of Empirical Studies; Springer US: New York, NY, USA, 2000; ISBN 978-0-7923-7747-4. [Google Scholar]
- Michaels, D.; Monforton, C. Manufacturing uncertainty: Contested science and the protection of the public’s health and environment. Am. J. Public Health 2005, 95, S39–S48. [Google Scholar] [CrossRef]
- Guerriero, C. Cost-Benefit Analysis of Environmental Health Interventions; Elsevier: Amsterdam, The Netherlands, 2020; ISBN 978-0-12-812885-5. [Google Scholar]
- Cohen, A.J.; Brauer, M.; Burnett, R.; Anderson, H.R.; Frostad, J.; Estep, K.; Balakrishnan, K.; Brunekreef, B.; Dandona, L.; Dandona, R.; et al. Estimates and 25-year trends of the global burden of disease attributable to ambient air pollution: An analysis of data from the Global Burden of Diseases Study 2015. Lancet 2017, 389, 1907–1918. [Google Scholar] [CrossRef]
- Health Effects of Particulate Matter. Policy Implications for Countries in Eastern Europe, Caucasus and Central Asia (2013). Available online: https://www.euro.who.int/en/health-topics/environment-and-health/air-quality/publications/2013/health-effects-of-particulate-matter.-policy-implications-for-countries-in-eastern-europe,-caucasus-and-central-asia-2013 (accessed on 14 July 2020).
- Kim, M.; Yi, O.; Kim, H. The role of differences in individual and community attributes in perceived air quality. Sci. Total Environ. 2012, 425, 20–26. [Google Scholar] [CrossRef]
- Evolution of WHO Air Quality Guidelines: Past, Present and Future (2017). Available online: https://www.euro.who.int/en/health-topics/environment-and-health/air-quality/publications/2017/evolution-of-who-air-quality-guidelines-past,-present-and-future-2017 (accessed on 14 July 2020).
- IARC. Outdoor Air Pollution; WHO Press: New York, NY, USA, 2015; Volume 109, ISBN 978-92-832-0175-5.
- IARC Outdoor Air Pollution a Leading Environmental Cause of Cancer Deaths. Available online: https://www.iarc.fr/pressrelease/iarc-outdoor-air-pollution-a-leading-environmental-cause-of-cancer-deaths/ (accessed on 14 July 2020).
- US EPA. Health and Environmental Effects of Particulate Matter (PM). Available online: https://www.epa.gov/pm-pollution/health-and-environmental-effects-particulate-matter-pm (accessed on 14 July 2020).
- McMichael, A.J.; Woodruff, R.E.; Hales, S. Climate change and human health: Present and future risks. Lancet 2006, 367, 859–869. [Google Scholar] [CrossRef]
- Feng, L.; Liao, W. Legislation, plans, and policies for prevention and control of air pollution in China: Achievements, challenges, and improvements. J. Clean. Prod. 2016, 112, 1549–1558. [Google Scholar] [CrossRef]
- Ban, J.; Zhou, L.; Zhang, Y.; Brooke Anderson, G.; Li, T. The health policy implications of individual adaptive behavior responses to smog pollution in urban China. Environ. Int. 2017, 106, 144–152. [Google Scholar] [CrossRef] [PubMed]
- Misra, P.; Takeuchi, W. Assessing population sensitivity to urban air pollution using google trends and remote sensing datasets. In Proceedings of the ISPRS—International Archives of the Photogrammetry, Remote Sensing and Spatial Information Sciences, Baltimore, MD, USA, 6–11 October 2019; Volume XLII-3-W11, pp. 93–100. [Google Scholar]
- Wang, L.; Watanabe, T. Effects of environmental policy on public risk perceptions of haze in Tianjin City: A difference-in-differences analysis. Renew. Sustain. Energy Rev. 2019, 109, 199–212. [Google Scholar] [CrossRef]
- Kuklinska, K.; Wolska, L.; Namiesnik, J. Air quality policy in the U.S. and the EU—A review. Atmos. Pollut. Res. 2015, 6, 129–137. [Google Scholar] [CrossRef]
- EU Approves New Rules for Member States to Drastically Cut Air Pollution. Available online: https://ec.europa.eu/commission/presscorner/detail/en/IP_16_4358 (accessed on 14 July 2020).
- Moher, D.; Liberati, A.; Tetzlaff, J.; Altman, D.G. PRISMA Group Preferred reporting items for systematic reviews and meta-analyses: The PRISMA statement. PLoS Med. 2009, 6, e1000097. [Google Scholar] [CrossRef] [PubMed]
- Li, F.; Zhou, T. Effects of objective and subjective environmental pollution on well-being in urban China: A structural equation model approach. Soc. Sci. Med. 2020, 249, 112859. [Google Scholar] [CrossRef] [PubMed]
- Mirabelli, M.C.; Ebelt, S.; Damon, S.A. Air Quality Index and air quality awareness among adults in the United States. Environ. Res. 2020, 183, 109185. [Google Scholar] [CrossRef]
- Machado, M.; Reisen, V.A.; Santos, J.M.; Reis Junior, N.C.; Frère, S.; Bondon, P.; Ispány, M.; Aranda Cotta, H.H. Use of multivariate time series techniques to estimate the impact of particulate matter on the perceived annoyance. Atmos. Environ. 2020, 222, 117080. [Google Scholar] [CrossRef]
- Ueberham, M.; Schlink, U.; Dijst, M.; Weiland, U. Cyclists’ Multiple Environmental Urban Exposures—Comparing Subjective and Objective Measurements. Sustainability 2019, 11, 1412. [Google Scholar] [CrossRef]
- Ho, H.C.; Wong, M.S.; Man, H.Y.; Shi, Y.; Abbas, S. Neighborhood-based subjective environmental vulnerability index for community health assessment: Development, validation and evaluation. Sci. Total Environ. 2019, 654, 1082–1090. [Google Scholar] [CrossRef]
- Pu, S.; Shao, Z.; Fang, M.; Yang, L.; Liu, R.; Bi, J.; Ma, Z. Spatial distribution of the public’s risk perception for air pollution: A nationwide study in China. Sci. Total Environ. 2019, 655, 454–462. [Google Scholar] [CrossRef]
- Zakaria, M.F.; Ezani, E.; Hassan, N.; Ramli, N.A.; Wahab, M.I.A. Traffic-related Air Pollution (TRAP), Air Quality Perception and Respiratory Health Symptoms of Active Commuters in a University Outdoor Environment. Iop Conf. Ser. Earth Environ. Sci. 2019, 228, 012017. [Google Scholar] [CrossRef]
- Dong, D.; Xu, X.; Xu, W.; Xie, J. The Relationship between the Actual Level of Air Pollution and Residents’ Concern about Air Pollution: Evidence from Shanghai, China. Int. J. Environ. Res. Public Health 2019, 16, 4784. [Google Scholar] [CrossRef] [PubMed]
- Reames, T.G.; Bravo, M.A. People, place and pollution: Investigating relationships between air quality perceptions, health concerns, exposure, and individual- and area-level characteristics. Environ. Int. 2019, 122, 244–255. [Google Scholar] [CrossRef] [PubMed]
- Lu, Y.; Wang, Y.; Zuo, J.; Jiang, H.; Huang, D.; Rameezdeen, R. Characteristics of public concern on haze in China and its relationship with air quality in urban areas. Sci. Total Environ. 2018, 637–638, 1597–1606. [Google Scholar] [CrossRef] [PubMed]
- Pantavou, K.; Psiloglou, B.; Lykoudis, S.; Mavrakis, A.; Nikolopoulos, G.K. Perceived air quality and particulate matter pollution based on field survey data during a winter period. Int. J. Biometeorol. 2018, 62, 2139–2150. [Google Scholar] [CrossRef] [PubMed]
- Bergstra, A.D.; Brunekreef, B.; Burdorf, A. The mediating role of risk perception in the association between industry-related air pollution and health. PLoS ONE 2018, 13, e0196783. [Google Scholar] [CrossRef] [PubMed]
- Orru, K.; Nordin, S.; Harzia, H.; Orru, H. The role of perceived air pollution and health risk perception in health symptoms and disease: A population-based study combined with modelled levels of PM10. Int. Arch. Occup. Env. Health 2018, 91, 581–589. [Google Scholar] [CrossRef]
- Malecki, K.M.C.; Schultz, A.A.; Bergmans, R.S. Neighborhood Perceptions and Cumulative Impacts of Low Level Chronic Exposure to Fine Particular Matter (PM2.5) on Cardiopulmonary Health. Int. J. Environ. Res. Public Health 2018, 15, 84. [Google Scholar] [CrossRef]
- Dons, E.; Laeremans, M.; Anaya-Boig, E.; Avila-Palencia, I.; Brand, C.; de Nazelle, A.; Gaupp-Berghausen, M.; Götschi, T.; Nieuwenhuijsen, M.; Orjuela, J.P.; et al. Concern over health effects of air pollution is associated to NO2 in seven European cities. Air Qual. Atmos. Health 2018, 11, 591–599. [Google Scholar] [CrossRef]
- Huang, L.; Li, J.; He, R.; Rao, C.; van der Kuijp, T.J.; Bi, J. Quantitative Analysis of Health Risk Perception, Exposure Levels, and Willingness to Pay/Accept of PM2.5 during the 2014 Nanjing Youth Olympic Games. Environ. Sci. Technol. 2018, 52, 13824–13833. [Google Scholar] [CrossRef]
- Gany, F.; Bari, S.; Prasad, L.; Leng, J.; Lee, T.; Thurston, G.D.; Gordon, T.; Acharya, S.; Zelikoff, J.T. Perception and reality of particulate matter exposure in New York City taxi drivers. J. Expo. Sci. Environ. Epidemiol. 2017, 27, 221–226. [Google Scholar] [CrossRef] [PubMed]
- Cantuaria, M.L.; Brandt, J.; Løfstrøm, P.; Blanes-Vidal, V. Public perception of rural environmental quality: Moving towards a multi-pollutant approach. Atmos. Environ. 2017, 170, 234–244. [Google Scholar] [CrossRef]
- Pantavou, K.; Lykoudis, S.; Psiloglou, B. Air quality perception of pedestrians in an urban outdoor Mediterranean environment: A field survey approach. Sci. Total Environ. 2017, 574, 663–670. [Google Scholar] [CrossRef] [PubMed]
- Huang, L.; Rao, C.; van der Kuijp, T.J.; Bi, J.; Liu, Y. A comparison of individual exposure, perception, and acceptable levels of PM2.5 with air pollution policy objectives in China. Environ. Res. 2017, 157, 78–86. [Google Scholar] [CrossRef] [PubMed]
- Chen, Y.; Zhang, Z.; Shi, P.; Song, X.; Wang, P.; Wei, X.; Tao, F. Public perception and responses to environmental pollution and health risks: Evaluation and implication from a national survey in China. J. Risk Res. 2017, 20, 347–365. [Google Scholar] [CrossRef]
- Cisneros, R.; Brown, P.; Cameron, L.; Gaab, E.; Gonzalez, M.; Ramondt, S.; Veloz, D.; Song, A.; Schweizer, D. Understanding Public Views about Air Quality and Air Pollution Sources in the San Joaquin Valley, California. J. Environ. Public Health 2017, 2017, 4535142. [Google Scholar] [CrossRef]
- Ngo, N.S.; Kokoyo, S.; Klopp, J. Why participation matters for air quality studies: Risk perceptions, understandings of air pollution and mobilization in a poor neighborhood in Nairobi, Kenya. Public Health 2017, 142, 177–185. [Google Scholar] [CrossRef]
- Oltra, C.; Sala, R. Perception of risk from air pollution and reported behaviors: A cross-sectional survey study in four cities. J. Risk Res. 2018, 21, 869–884. [Google Scholar] [CrossRef]
- Tao, Z.; Kokas, A.; Zhang, R.; Cohan, D.S.; Wallach, D. Inferring Atmospheric Particulate Matter Concentrations from Chinese Social Media Data. PLoS ONE 2016, 11, e0161389. [Google Scholar] [CrossRef]
- Guo, Y.; Liu, F.; Lu, Y.; Mao, Z.; Lu, H.; Wu, Y.; Chu, Y.; Yu, L.; Liu, Y.; Ren, M.; et al. Factors Affecting Parent’s Perception on Air Quality—From the Individual to the Community Level. Int. J. Environ. Res. Public Health 2016, 13, 493. [Google Scholar] [CrossRef]
- King, K.E. Chicago residents’ perceptions of air quality: Objective pollution, the built environment, and neighborhood stigma theory. Popul. Environ. 2015, 37, 1–21. [Google Scholar] [CrossRef] [PubMed]
- Wang, S.; Paul, M.J.; Dredze, M. Social media as a sensor of air quality and public response in China. J. Med. Internet Res. 2015, 17, e22. [Google Scholar] [CrossRef] [PubMed]
- Johnson, B.B. Experience with urban air pollution in Paterson, New Jersey and implications for air pollution communication. Risk Anal. 2012, 32, 39–53. [Google Scholar] [CrossRef] [PubMed]
- Nikolopoulou, M.; Kleissl, J.; Linden, P.F.; Lykoudis, S. Pedestrians’ perception of environmental stimuli through field surveys: Focus on particulate pollution. Sci. Total Environ. 2011, 409, 2493–2502. [Google Scholar] [CrossRef]
- Wen, X.-J.; Balluz, L.; Mokdad, A. Association between media alerts of air quality index and change of outdoor activity among adult asthma in six states, BRFSS, 2005. J. Community Health 2009, 34, 40–46. [Google Scholar] [CrossRef]
- Semenza, J.C.; Wilson, D.J.; Parra, J.; Bontempo, B.D.; Hart, M.; Sailor, D.J.; George, L.A. Public perception and behavior change in relationship to hot weather and air pollution. Environ. Res. 2008, 107, 401–411. [Google Scholar] [CrossRef]
- Tilt, B. Perceptions of Risk from Industrial Pollution in China: A Comparison of Occupational Groups. Hum. Organ. 2006, 65, 115–127. [Google Scholar] [CrossRef]
- Brody, S.D.; Peck, B.M.; Highfield, W.E. Examining localized patterns of air quality perception in Texas: A spatial and statistical analysis. Risk Anal. 2004, 24, 1561–1574. [Google Scholar] [CrossRef]
- Rotko, T.; Oglesby, L.; Künzli, N.; Carrer, P.; Nieuwenhuijsen, M.J.; Jantunen, M. Determinants of perceived air pollution annoyance and association between annoyance scores and air pollution (PM2.5, NO2) concentrations in the European EXPOLIS study. Atmos. Environ. 2002, 36, 4593–4602. [Google Scholar] [CrossRef]
- Buka, I.; Koranteng, S.; Osornio-Vargas, A.R. The effects of air pollution on the health of children. Paediatr Child Health 2006, 11, 513–516. [Google Scholar]
- Carducci, A.; Casini, B.; Donzelli, G.; Verani, M.; Bruni, B.; Ceretti, E.; Zani, C.; Carraro, E.; Bonetta, S.; Bagordo, F.; et al. Improving awareness of health hazards associated with air pollution in primary school children: Design and test of didactic tools. Appl. Environ. Educ. Commun. 2016, 15, 247–260. [Google Scholar] [CrossRef]
- Bickerstaff, K. Risk perception research: Socio-cultural perspectives on the public experience of air pollution. Environ. Int. 2004, 30, 827–840. [Google Scholar] [CrossRef] [PubMed]
- Slovic, P. Perception of risk. Science 1987, 236, 280–285. [Google Scholar] [CrossRef] [PubMed]
- Sepai, O.; Collier, C.; Van Tongelen, B.; Casteleyn, L. Human biomonitoring data interpretation and ethics; obstacles or surmountable challenges? Environ. Health 2008, 7, S13. [Google Scholar] [CrossRef] [PubMed]
- De Felip, E.; Bianchi, F.; Bove, C.; Cori, L.; D’Argenzio, A.; D’Orsi, G.; Fusco, M.; Miniero, R.; Ortolani, R.; Palombino, R.; et al. Priority persistent contaminants in people dwelling in critical areas of Campania Region, Italy (SEBIOREC biomonitoring study). Sci. Total Environ. 2014, 487, 420–435. [Google Scholar] [CrossRef] [PubMed]
- Bianchi, F.; Minoia, C.; Minichilli, F.; Cori, L.; Bustaffa, E.; Leoni, E.; Migliore, S.; Ronchi, A.; Turci, R. Biomonitoring studies: Bioaccumulation of polychlorinated biphenyls and heavy metals. In Human Health in Areas with Industrial Contamination; WHO Regional Office for Europe: Copenhagen, Denmark, 2014; pp. 143–166. ISBN 978-92-890-5005-0. [Google Scholar]
- Cori, L. Risk communication and the role of knowledge broker, experiences in Italy. Toxicol. Environ. Chem. 2016, 98, 1100–1109. [Google Scholar] [CrossRef]
- Wallquist, L.; Visschers, V.H.M.; Siegrist, M. Impact of Knowledge and Misconceptions on Benefit and Risk Perception of CCS. Environ. Sci. Technol. 2010, 44, 6557–6562. [Google Scholar] [CrossRef]
- Shin, M.; Werner, A.K.; Strosnider, H.; Hines, L.B.; Balluz, L.; Yip, F.Y. Public Perceptions of Environmental Public Health Risks in the United States. Int. J. Environ. Res. Public Health 2019, 16, 1045. [Google Scholar] [CrossRef]
- Cardwell, F.S.; Elliott, S.J. Understanding an Environmental Health Risk: Investigating Asthma Risk Perception in Ontario Youth Sport. Int. J. Environ. Res. Public Health 2019, 16, 2033. [Google Scholar] [CrossRef]
- Braveman, P.; Gottlieb, L. The Social Determinants of Health: It’s Time to Consider the Causes of the Causes. Public Health Rep. 2014, 129, 19–31. [Google Scholar] [CrossRef]
- Lämmle, L.; Woll, A.; Mensink, G.B.M.; Bös, K. Distal and Proximal Factors of Health Behaviors and Their Associations with Health in Children and Adolescents. Int. J. Environ. Res. Public Health 2013, 10, 2944–2978. [Google Scholar] [CrossRef] [PubMed]
- Murphy, J.; Link, M.W.; Childs, J.H.; Tesfaye, C.L.; Dean, E.; Stern, M.; Pasek, J.; Cohen, J.; Callegaro, M.; Harwood, P. Social Media in Public Opinion ResearchExecutive Summary of the Aapor Task Force on Emerging Technologies in Public Opinion Research. Public Opin. Q. 2014, 78, 788–794. [Google Scholar] [CrossRef]
- Jun, S.-P.; Yoo, H.S.; Choi, S. Ten years of research change using Google Trends: From the perspective of big data utilizations and applications. Technol. Forecast. Soc. Chang. 2018, 130, 69–87. [Google Scholar] [CrossRef]
- Aquino, F.; Donzelli, G.; De Franco, E.; Privitera, G.; Lopalco, P.L.; Carducci, A. The web and public confidence in MMR vaccination in Italy. Vaccine 2017, 35, 4494–4498. [Google Scholar] [CrossRef]
- Donzelli, G.; Palomba, G.; Federigi, I.; Aquino, F.; Cioni, L.; Verani, M.; Carducci, A.; Lopalco, P. Misinformation on vaccination: A quantitative analysis of YouTube videos. Hum. Vaccines Immunother. 2018, 14, 1654–1659. [Google Scholar] [CrossRef]
- McLaughlin, C.P.; Kaluzny, A.D.; Kibbe, D.C.; Tredway, R. Changing roles for primary-care physicians: Addressing challenges and opportunities. Healthc Q. 2005, 8, 70–78. [Google Scholar] [CrossRef]
- Fontaine, G.; Lavallée, A.; Maheu-Cadotte, M.-A.; Bouix-Picasso, J.; Bourbonnais, A. Health science commu nication strategies used by researchers with the public in the digital and social media ecosystem: A systematic scoping review protocol. BMJ Open 2018, 8, e019833. [Google Scholar] [CrossRef]
- Krnic Martinic, M.; Pieper, D.; Glatt, A.; Puljak, L. Definition of a systematic review used in overviews of systematic reviews, meta-epidemiological studies and textbooks. BMC Med. Res. Methodol. 2019, 19, 203. [Google Scholar] [CrossRef]


| First Author, Year | Study Area | Population Characteristics | Study Design/Objectives | Exposure Assessment | Results |
|---|---|---|---|---|---|
| P. Misra, 2020 [35] | Multi-country. Seven Asian megacities (Dhaka, Karachi, Delhi, Bangkok, Taipei, Seoul and Tokyo) | n/a | Perception of AQ assessed by identifying correlation of Google Trends weekly Relative Search Volume (RSV) to PM2.5 levels. | Moderate Resolution Imaging Spectro-radiometer (MODIS) retrieved aerosol optical depth (AOD) and angstrom exponent (AE) global satellite products. | Relationship between AQ RSV and AQ concentrations. Tendency to search for ‘air pollution’ and ‘cough’ occurs when PM2.5 levels are in excess and temperature is below the baseline values. RSV and remote sensing datasets could be beneficial in assessing perception and health risks during pollution episodes. |
| F. Li, 2020 [40] | China. 25 provinces, representative of the whole country | 11,908 subjects aged 9 years or older | Questionnaire survey data. Data on individual characteristics and subjective evaluation factors (perceived environmental pollution, self-rated health, and well-being) extracted from the China Family Panel Studies for 2016. | AQI data obtained from 2401 monitoring stations in 272 prefecture-level cities in China, with data recorded hourly. | Perception of air pollution directly and negatively related to wellbeing. AQI correlated with low life satisfaction, low happiness, depression. Poor subjective health correlated with low life satisfaction, low happiness, depression. |
| M. Mirabelli, 2020 [41] | USA (nationwide) | 12,936 men and women aged 18 and older | Cross sectional survey. Data from respondents to the 2016-2018 Consumer Styles surveys linked by geographic location and survey year to daily AQI. | County-level daily EPA’s AQ Index data. For each U.S. county with available data, it was aggregated the daily AQI data by year. | Heightened awareness of increasing pollution associated with people reporting respiratory symptoms and heart disease. Knowledge of pollution and symptoms of related illnesses more significant in areas with information and dissemination on AQI (even when the index is positive) |
| M. Machado, 2020 [42] | Metropolitan Region of Vitoria (MRV), Brazil | 220 subjects aged 16 and older | 3-year time-series survey. Relationship between perceived annoyance and PM concentration to estimate the relative risk. | Flow of monthly average sediment PM; monthly maximum and average values of PM10 and total suspended particle from eight AQ monitoring stations managed by the local environmental agency (IEMA); 3 years data (from July 2011 to July 2014). | Strong association between the perceived annoyance and different sizes of PM. An increase in air pollutant concentrations significantly associated with increasing probability of being annoyed. |
| M. Ueberham, 2019 [43] | City of Leipzig, Germany | 66 cyclists aged 18 and older | Survey by questionnaire. Cyclists wearing sensors measuring particle counts (PNC), noise, humidity, temperature, geolocation, and subjective perception of each exposure on everyday routes for one week (n = 730). Smartphone application to investigate the perception of participants. Three aims to: (i) compare the multiple exposure profiles, (ii) contrast objective data and subjective individual perception, (iii) examine route decision-making and awareness of health impacts for healthier route choices. | Exposure data gathered on ordinal scale from 1 (very low) to 5 (very high). In absence of guidelines for PNC, quantiles were used to generate equally distributed classes of samples. | PNC and noise underestimated, reliable estimate for heat. The majority of cyclists underestimated their exposures to noise (84%) and PNC (80%). No significant correlation between perceived and objective exposures to noise and PNC (p > 0.05). In contrast, the values for heat exposure showed a significant moderate correlation (r = 0.68). |
| H. Ho, 2019 [44] | Honk Kong, China | 120 adult subjects | 8-item survey for rating subjective environmental statuses influencing environmental vulnerability. Estimation of neighbourhood-based environmental vulnerability based on objective and subjective environmental measures from a local population. | Map of PM2.5 at 500 m resolution, derived from 142 cloud-free Moderate Resolution Imaging Spectroradiometer (MODIS) Aerosol Optical Depth (AOD) datasets between 2007 and 2009. | Subjective environmental vulnerability index, SEVI, significantly associated with the local differences in mortality. Environmental conditions can directly influence people with specific illnesses and can be used to estimate community health at small-district-level. |
| S. Pu, 2019 [45] | China. 31 China provinces | 9744 men and women aged 14 and older | Questionnaire survey data. Nationwide view on public’s air pollution risk perception and attitudes: (1) exploring spatial distribution of Chinese publics’ risk perception and attitude toward air pollution; (2) identifying characteristics of sensitive populations for air pollution; (3) analyzing which factor significantly affect publics’ attitude toward AQ. | Average annual PM2.5 concentration data obtained from Report on the State of the Environment in China of each province (2016). | Spatial distribution of PR, perceived risk—and SAQ, satisfaction of AQ highly concordant with actual air pollution level. PM2.5 has a positive direct influence on PR. PM2.5 has a positive moderating effect on PR and can strengthen positive correlation between PR and SAQ. |
| M. Zakaria, 2019 [46] | University campus, Selangor, Malaysia | 180 men and women 19–22 years old | Survey by a self-administered questionnaire used to collect data on socio-demographic, AQ perception and respiratory health symptoms among university students. | Measurements of traffic-related air pollutants conducted at three sampling sites in University South Campus. | Significant associations between each level of traffic-related air pollutants and AQ perception and respiratory health symptoms (p < 0.05). |
| D. Dong, 2019 [47] | China (nationwide) | n/a | Web Based Time Series Study by the Baidu index to explore the relationship between actual level of air pollution and residents’ concern about air pollution. On the basis of daily data of 2068 days in Shanghai, a vector autoregression (VAR) model was built for empirical analysis. | AQ measured by the AQI reported by environmental monitoring stations. Daily AQI data to measure air pollution level in Shanghai freely available from the website of the China AQ Online Monitoring and Analysis Platform. | Local residents perceived deprivation of AQ and expressed their concern on air pollution within the day the AQ index rose. Decline of AQ in another towns, such as Beijing, raised the concern of Shanghai residents about local AQ. Rising concern in Shanghai had a beneficial impact on AQ improvement. |
| T. Reames, 2019 [48] | Kansas City metropolitan area, USA | 2869 | Space Time Data Survey to evaluate: (1) spatial distribution of PM2.5 and O3 exposures, pollution perceptions, and pollution health concerns; (2) relationships between individual- and area characteristics and PM2.5 and O3 exposure; (3) cross-sectional associations between item 2 results and pollution perception and pollution health concerns. | Census tract concentrations of PM2.5 and O3 obtained for 2009–2012 from the Community Multiscale AQ downscaler, including monitoring data obtained from the National and Local Air Monitoring Stations networks (NAMS/SLAMS). | No relationship between pollution perception and health concern, nor with air pollution exposure. Pollution perception associated with age, sex, respiratory problems, AQ alert knowledge. Health concern associated with age, sex, AQ alert knowledge, O3 exposure and poverty. |
| Y. Lu, 2018 [49] | China (nationwide) | n/a | Time series cross-correlation analysis. Baidu Search Index to analyze the patterns of public concern about haze from 2013 to 2017, and the dynamic relationship between public concern and AQ data. | PM2.5 concentration data before July 2017 from US Embassy and from 1–7 to 7-12-2017 from a data integration platform (real-time data of PM2.5 from US Embassy). Public concern investigated via web. | According to annual data, slight decrease of the weak correlation of public concern and AQ. Removing the annual trend component of time-series, the public concern resulted more sensitive to the short term fluctuation of AQ (lag), even as pollution decreased. |
| K. Pantavou, 2018 [50] | Athens, Greece | 387 men and women aged 13 and older | Questionnaire-based study involving pedestrians at the survey sites the sites, invited to evaluate of AQ at the moment of the interview. | ATSI Dust Track 8520 aerosol monitor set for PM10 measurements installed in the mobile station to count PM10 | Air dust perception related to PM10 concentration, affected by individual health status, smoking status, and exposure time; air pollution perception related to wind speed, gender, and health status. |
| A. Bergstra, 2018 [51] | Seven villages, industrial area East Vlissingen, Southwest Netherlands | 2627 men and women aged 19 and older | Cross-sectional study by questionnaire to assess associations between industrial air pollution and health symptoms and risk perception about local industry. | Emission data obtained from the Emission Register. | Strong association between the perceived annoyance, some health problems and PM2.5 exposure. Role of parental worry about local industry in exposure-health relations for children; parents are more worried for their children than for themselves. |
| K. Orru, 2018 [52] | Estonia (nationwide) | 1000 subjects aged 18–75 | Cross-sectional study by questionnaire, with the aims to test a model that describes interrelations among air pollution, perceived pollution, health risk perception, health symptoms and diseases in 1000 Estonian residents (sample stratified by age, sex, geographical location). | Annual mean concentrations of PM10 in 2012 modelled with the resolution of 1 × 1 km across Estonia using a Eulerian AQ dispersion model. Data on PM10 at the respondent’s home address used to categorise the respondent. | No associations between level of air pollution exposure and influence perceived pollution, health risk perception, symptoms or diseases. Perceived exposure influenced health risk perception, which, in turn, influenced health symptoms and diseases, while perceived exposure affected symptoms, which influence diseases. |
| K. Malecki, 2018 [53] | Wisconsis, USA | 2230 men and women aged 21–74 | Cross-sectional study by questionnaire, to investigate associations between low-level chronic PM2.5 exposure and cardiopulmonary health, and the potential mediating or modifying effects of adverse neighbourhood perceptions. It used data from the Survey of the Health of Wisconsin. | Chronic PM2.5 exposures estimated using three-year annual average estimates derived from the United States Environmental Protection Agency’s Fused AQ Surface Downscaler model. | Association between AQ and cardiopulmonary health. Adverse perceptions of neighbourhood built environment among all participants. Significant associations between PM2.5 and lung function (FEV1) only among individuals with negative perceptions and increased reports of neighbourhood stressors. |
| E. Dons, 2018 [54] | Multi-country. Antwerp (BE), Barcelona (SP), London (UK), Orebro (SE), Rome (IT), Vienna (AU), Zurich (SW) | 7622 subjects. Mean age = 40 | Cross-sectional study by questionnaire to evaluate relationships between concern on health effects of air pollution and personal and environmental factors. Participants recruited to fill an online questionnaire on travel and physical activity behaviour, perceptions, attitudes on active mobility and the environment, and socio-demographic factors. | Air pollution at the residence from Europe-wide NO2 and PM2.5 maps with a 100-m resolution and available for year 2010. The NO2 and PM2.5 models explained 58.2% and 63.3% of spatial variation respectively. The European main road network was used to determine the distance of each residence to the nearest primary road. | Mean modelled air pollution and mean level of concern per city well correlated for NO2 (r2 = 0.75), less for PM2.5 (r2 = 0.49). In regression model, sex, children in the household, physical activity and NO2 at the home address significantly correlated to individual concern over health effects of air pollution. NO2 but not PM2.5 at the home address associated with concern over health effects of air pollution. |
| L. Huang, 2018 [55] | Nanjing, China | Three surveys to 250 adults each were conducted before, during and after the Youth Olympic Games (YOG) (August 16−28, 2014). Subjects aged 15 and older. | Comparative and correlation analyses of three surveys. Aim: changes in public attitudes, including their health risk perception, acceptable risk levels of air pollution, and their willingness to pay/accept for reductions in air pollution for the benefit of reducing health risks before, during, and after the Youth Olympic Games (YOG). | Respondents’ daily PM2.5 exposure levels calculated using an equation recommended by the US-EPA. The equation links time-activity patterns to the exposure medium concentration, normalizing by weight. The real-time ambient PM2.5 concentrations collected from the China Environmental Monitoring Centre (CEMC); outdoor and indoor exposure times from the questionnaire surveys. | Great differences in health perception levels, average daily PM2.5 exposure (ADD), public acceptance levels, willingness to pay and to accept compensation for air pollution before, during, and after the YOG. During the YOG, public exposed to PM2.5lower concentrations most accepted risks posed by haze. After YOG, residents more sensitive to haze and demanded higher AQ. A greater willingness to pay for risk reduction and to accept compensation for health-related losses. |
| F. Gany, 2017 [56] | New York City, USA | 100 taxi drivers aged 18 and older | Survey by interview to assess taxi drivers’ knowledge, attitudes, and beliefs (KAB) about air pollution compared with direct measures of exposures. One hundred drivers completed an air pollution KAB questionnaire, and seven taxicabs participated in preliminary in-cab air sampling. | Roadside and in-vehicle levels of PM2.5 and black carbon (BC) were continuously measured over a single shift on each subject, and exposures compared with central site monitoring. Two aerosol monitors, a personal MIE DataRam 1000 and a MicroAethalometer, to measure fine PM and BC levels, respectively, inside New York City taxi cabs. | Even with general knowledge about the risks associated with occupational exposure to air pollution, taxi drivers did not consider their exposure and/or potential related risks to their health as priorities in the context of other health concerns. |
| M. Cantuaria, 2017 [57] | Four non-urban regions of Denmark: Anholt, Keldsnor, Lindet, Sundeved | 1068 men and women aged 18 and older | Cross-sectional study to assess environmental conditions and health of residents living nearby agricultural land and animal production facilities. Residents invited via mail by answering a printed questionnaire or an online version. | Exposure assessment to 14 atmospheric pollutants. The concentrations of all pollutants, except for ammonia, were calculated using the integrated multiscale air pollution model system (THOR). | Annoyance is associated with air pollutants and noise. |
| K. Pantavou, 2017 [58] | Athens, Greece | 1699 men and women aged 14 and older | Cross-sectional questionnaire study involving persons passing by or visiting the monitored sites, to explore AQ perception, examining their potential relationship with air pollutants concentrations, meteorological and personal variables in an urban outdoor Mediterranean environment. | Data of air pollutant concentrations were acquired from the Ministry of Environment and Energy for the air pollution stations closest to the monitoring sites | A basic relationship between AQ perception and air pollutants concentration. PM associated with dust perception; NOx and CO associated with overall AQ perception. Greater perception of dusty or poor QA conditions if pollutants increased. Perception of QA influenced by age, area of residence, health symptoms and thermal sensation. |
| L. Huang, 2017 [59] | Beijing, Nanjingn, and Guangzhou. China | 1284 men and women aged 18 and older | Cross-sectional questionnaire surveys conducted in three representative cities of China to explore how public perception and acceptable risk of air pollution can prompt individual behavioural changes and play a role in public’s response to health risks. | The respondents’ daily PM2.5 exposure levels, calculated by US-EPA methodology. Real-time PM2.5 concentrations collected from China Environmental Monitoring Centre, outdoor and indoor exposure times from the questionnaire surveys. | Risk perception different in the three cities, increases with exposure experiences. The higher measured PM level observed in women and less well-off people. Poor correlation between perception and PM2.5 measures. |
| Y. Chen, 2017 [60] | China (nationwide) | 10,300 | Nationwide survey. Sample selected to investigate subjective perceptions and responses to environmental pollution. | Officially weekly water quality levels at 131 monitoring sections and daily AQ levels at 109 main cities in 2008–2012 period, from the Ministry of Environmental Protection of the People’s Republic of China. | Influence by direct or indirect experience of harm and socio-economic conditions on the accuracy of individual response on 4 measured environmental parameters and attitudes. Accuracies increased low at county scale than at city scale. Accuracy on AQ higher than on water quality (47% vs 43%). |
| R. Cisneros, 2017 [61] | San Joaquin Valley, California, USA | 744 young-adults | Survey conducted with residents to understand their sources of AQ information, perceptions of AQ, and behaviours related to AQ. | PM2.5 AQ data were downloaded from the California Air Resources Board website. The two-month PM2.5 mean concentrations were further grouped into three categories based on the United States NAAQS and the European AQ Standards. | Participants exposed to high PM2.5 concentrations perceived air pollution to be of the worst quality. AQ in the San Joaquin Valley was primarily perceived as either moderate or unhealthy for sensitive groups. Females perceived air pollution to be of worse quality compared to males. |
| N. Ngo, 2017 [62] | Mathare, one of the largest and oldest informal settlements in Nairobi. Kenya | 40 men and women aged 24–58 | Focus group discussions to understand how residents currently view air pollution. Measurements of personal exposure to PM2.5 by three women living in Mathare who carried pumps as they went about their daily activities. | PM2.5 concentrations collected on pre-weighed Teflon filters using portable air samplers carried in backpacks. Each participant pre-trained on how to use and carry the pump. | Community work on PM measurement and risk perception produced qualitative results of growing risk perception, information request on impacts, proactive protection behaviours and request for prevention measures. |
| J. Ban, 2017 [34] | Nanjing, China | 1141 men and woman aged 16 and older | Face-to-face questionnaire survey on a random sample in Nanjing during a heavily polluted period. Objective: examine changes in individual behaviour coping with smog pollution episodes | The average PM2.5 concentration exceeded the national air threshold standard (75 µg/m3) on 52 of the 62 survey days (a rate of 83.8%), indicating frequent, serious pollution conditions in Nanjing throughout the period. | Relationship between perceived smog intensity, risk perception and behaviour change (concern behaviours), enhanced in case of negative experience or harmful health experiences (preventive actions). Higher level of awareness and risk perception for women. |
| C. Oltra, 2016 [63] | Four Spanish cities: Madrid, Barcelona, Zaragoza, and La Coruña | 1202. Mean age = 40 | Questionnaire survey, investigating how public perceptions of air pollution, risk beliefs and self reported actions limit personal exposure to air pollution across cities. Analysis to quantify association between individual variables and self-protective and information-seeking actions due to bad AQ. | Air pollution concentrations obtained from the local and regional environmental agencies. | Significant differences in subjective evaluation of local AQ, according to annoyance, physical symptoms and distress due to air pollution. Small differences in levels of self-reported attention to AQ, perceived severity and controllability beliefs. Self-reported attention to AQ levels and worry about health effects of air pollution were the most associated variables with avoid polluted streets, information seeking, change leisure activities and use face-masks. |
| Z. Tao, 2016 [64] | Beijing, Shanghai, Guangzhou, and Chengdu. China | 513,537 messages | Survey by social network. Messages posted to Weibo (over 300 million users) to construct an “Air Discussion Index” (ADI) characterizing AQ conditions and for investigating the relationship between PM2,5 and social media posts. | PM2.5 AQ data from monitoring stations located at U.S. embassy or consulates in Beijing, Shanghai, Guangzhou, and Chengdu. | Strong correlation between the ADI and measured PM2,5. Social media identified as useful proxy measurement for pollution, particularly when traditional measurement stations are unavailable, censored or misreported. |
| Y. Guo, 2016 [65] | Whuan, China | 865 men and women aged 18 or older | Survey by questionnaire for evaluating parent’s perception of AQ, by investigating the relationship between parent’s QA perception and air pollution monitoring data, and of the factors affecting parents’ perceptions. | The data of the average concentrations of primary air pollutants and the annual excellent rate of AQ in Wuhan city from the Wuhan Environmental Protection Bureau for the period 2010–2014. | General improving trend of AQ in Wuhan contrasted with the belief of deterioration in the majority of participants, indicating a significant difference between public perception and reality. |
| K. King, 2015 [66] | Chicago, USA | 3105 men and woman aged 18 or older | Survey on a subset of the Cicago Community Adult Health Study, aiming to: (1) assess the relationship between perceived AQ and five commonly used objective measures (cancer risk, neurological risk, respiratory risk, PM10, O3; (2) investigate neighbourhood correlates of AQ perception. | Measures of ambient PM10 and ambient daily O3 (10 a.m.–6 p.m.) from the EPA’s AQ System obtained from RAND at the tract level. | Perceptions of AQ do track somewhat with objective measures of AQ, especially PM10 (but inversely related to O3 in some models). Relevant factors: socio economic status, ethnicity, gender, age and health status. Air pollution more reported by poors, blacks, hispanics, women, ills and olders. |
| S. Wang, 2015 [67] | China (nationwide) | 435,873 messages | Analysis of big-data by mining Weibo messages about AQ role to identify AQ trends and public response in China. Comparison of the volume of AQ messages with fine particle pollution to evaluate the effectiveness of social media for complementing AQ sensors. Manual coding analysis of a sample of messages to evaluate the ability for measuring public perception, awareness, and response to pollution. | Data from the State Environmental Protection Department, which began AQ monitoring in 2012 for 74 cities. | Message volume in Sina Weibo indicative of true particle pollution levels; the messages contain rich details including perceptions, behaviors, and self-reported health effects. Social media data improve existing air pollution surveillance data, especially perception and health-related data that traditionally requires expensive surveys or interview. |
| M. Kim, 2012 [27] | Seoul, South Korea | 16,041 men and women aged 20 or older | Cross-sectional survey study investigating (1) the relationship between measured AQ and perceived AQ in Seoul, and (2) the determinants of perceived local AQ in Seoul, focusing on individual and community-level characteristics. | Five sets of air pollution data for PM10, CO, SO2, NO2, O3 levels were obtained from 27 outdoor monitoring stations in Seoul. | Measured AQ weakly related or not related to perceived AQ. Higher risk perception associated to younger age, higher education level; no relationship with health status. |
| B. B. Johnson, 2012 [68] | Paterson, New Jersey. USA | 441 subjects. Mean age = 50 | Cross-sectional study surveyed Paterson residents to extend understanding of awareness of air pollution, sources of this awareness, and their implications for communication about air pollution. | Part of major air toxics monitoring and enforcement initiatives in Paterson, New Jersey, in 2004–2006 by the State Environmental Agency. | Perceptions of AQ not correlated with official monitoring data (U.S. AQI), but associated with health problems and social vulnerability. |
| M. Nikolopoulou, 2011 [69] | University of California, San Diego. USA | 260 subjects. 67% aged 18–24 and 19% aged 25–34 years. | Questionnaire-guided Interviews Survey on the perception of individual exposure to different environmental stresses; microclimate, noise and PM) monitored by 260 questionnaire-guided interviews at a road construction site and a traffic site on the UC San Diego campus. | A Shinyei PPD20V particle counter sensitive to particles with a diameter larger than 1 μm was used to determine the number concentration of PM in particles per litre. | Overall, higher PM concentrations were correlated with perception of poor AQ, influenced by medical history; current smokers were the least sensitive to ambient AQ conditions. |
| X. Wen, 2009 [70] | Colorado, Florida, Indiana, Kansas, Massachusetts, and Wisconsin. USA | 28,303 men and women aged 18 or older | Cross-sectional study, aiming at examine the association between AQ media alerts, and reductions or changes in outdoor activities among adult with asthma. Data from the 2005 Behavioral Risk Factor Surveillance System to assess reductions or changes in outdoor activities because of the perception of bad AQ, media alerts on AQI, and health professional advice to reduce outdoor activity levels. | Air pollutant concentrations collected daily by the Environmental Protection Agency and reported as AQI. | Media alerts on AQ resulted a very important factor related to changes in outdoor activity. People with lifetime asthma more than twice likely to change or reduce their outdoor activities based on their individual perception of bad AQ than people without asthma. |
| J. Semenza, 2008 [71] | Portland, Oregan. Houston, Texas. USA | 1962. Mean age = 50.2 | Survey for evaluating the effectiveness of heat and air pollution advisory systems in altering public behaviour. Subjects enrolled by random-digit-dial telephone surveys. Surveys conducted shortly after episodes of poor AQ and/or hot conditions, weekday and weekend episodes, and episodes with or without accompanying health advisories. | Temperature, relative humidity, wind speed, solar radiation, O3, NO, NO2, and PM2.5 data collected by the Texas Commission on Environmental Quality, the Oregon Department of Environmental Quality and a network of Portland State University monitoring stations.. | Combination of behaviors when AQ is worse, but not corresponding to what is measured by the control units. No correlation between measured pollution and symptoms. Women perceive more pollution and change habits: lower-status individuals more sensitive to heat waves |
| B. Tilt, 2006 [72] | Futian, an industrial township in China’s southwestern province of Sichuan, China | 122 workers | Survey by interview using standardised questionnaire, set up through ethnographic methods, aimed at evaluating whether and how the perceived severity of these risks varies within the community across occupational groups. | Air pollutant concentrations collected by the Chinese government, through the State Environmental Protection Administration. | Most informants perceived industrial pollution as posing considerable risk to themselves and the community. Three occupational groups (industrial, commerce and service, farmers) perceived differently in relation to socio-economic factors. |
| B.S.D. Brody, 2004 [73] | Two large metropolitan areas in Texas: Dallas-Fort Worth and Houston-Galveston, USA | 870 adults | Survey by telephone aimed at assessing factors shaping public perception of AQ by examining spatial pattern of risk perception, role of socioeconomic characteristics, and relationship between perceived and measured air pollution. Residents surveyed as part of a state-wide telephone survey. To each respondent an average AQ based on their proximity to the nearest monitoring station was assigned. | Measured levels of AQ based on readings from continuous air monitoring stations (CAMS) in the study areas. Levels of CO, NO, O3, PM2.5 and SO2 recorded daily over a one-year period until August 2001. | Perceptions of local AQ different in Dallas and Huston and not driven by actual readings from air monitoring stations. Factors influencing perceptions: individual sensory experience, sense of place, proximity, neighbourhood setting, socioeconomic characteristics and media reporting. |
| T. Rotko, 2003 [74] | Multi-country. Six cities. Athens, Basel, Milan, Oxford, Prague and Helsinki | 1736 men and women aged between 25 and 55 | Analysis of a sample from EXPOLIS-European multicenter study for measurement of air pollution exposures of working age urban population during workdays. Objectives: (i) comparing levels and determinants of air pollution annoyance among the adult populations of six European cities; (ii) calculating the correlation between the perceived air pollution annoyance and the measured PM2.5 and NO2 exposures and microenvironment concentrations. | The study compares the measured pollutant concentrations (house indoor and outdoor, workplace indoor) and personal exposures to PM2.5 and NO2. PM2.5 was collected on two different filters: one for the working hours including commuting (personal work) and the other for the remaining hours of 48-h measurement period (personal leisure time). | No consistent or significant correlations were found between annoyance and PM2.5 exposure. Large variations in levels of air pollution annoyance, with the highest in traffic; significant determinants: city, self-reported symptoms, downtown residence and gender. Some associations with measured pollution emerged analysing specific correlation considering single cities, traffic, downtown living, work. |
| Dimensions (Recurrence in the Selected Articles) | Features | Recurrences (n = 174) |
|---|---|---|
| Understanding/sensorial perception (n = 44) | Awareness = acknowledgement of the existence of a problem | 32 |
| Belief = opinion to be exposed | 5 | |
| Knowledge = capacity to understand the existence of a problem | 7 | |
| Reactions/psychological consequences (n = 48) | Concern = apprehension | 9 |
| Risk perception = there is a risk for health (for me—for others) | 23 | |
| Worry = it is more that concern, linked to a depressive mood | 5 | |
| Fear = explicit reference to this emotion | 1 | |
| Outrage = main concept used by psychometric approach | 4 | |
| Familiarity = experience of the fact | 5 | |
| Trust = it is generally towards the responsible institutions | 1 | |
| Reactions/physical consequences (n = 44) | Annoyance = feeling of negative consequences | 6 |
| Anxiety = stress | 2 | |
| Life quality change = comfort, benefits, modification of habits | 10 | |
| Self-reported health symptoms | 26 | |
| Behaviours (n = 38) | Avoidance of the problem | 4 |
| Search for info | 12 | |
| Exposure reduction | 13 | |
| Proactivity = self-efficacy | 4 | |
| Request for actions = from public bodies/community | 3 | |
| Acceptance = of specific measures/policies | 2 |
| Association | No. of Articles Showing Association | References |
|---|---|---|
| Association not evaluated | 2 | H. Ho, 2019 [44]; C. Oltra, 2016 [63] |
| Measured pollution not correlated with perception | 5 | M. Ueberham, 2019 [43]; T. Reames, 2019 [48]; F. Gany, 2017 [56]; J. Semenza, 2008 [71]; B.S.D. Brody, 2004 [73] |
| Indirect influence of air pollution on perception | 2 | F. Li, 2020 [40]; K. Orru, 2018 [52] |
| Scarce influence of air pollution on perception, influence by behavior, experience, socio-economic factors | 9 | K. Pantavou, 2018 [50]; L. Huang, 2018 [55]; K. Pantavou, 2017 [58]; L. Huang, 2017 [59]; Y. Chen, 2017 [60]; Y. Guo, 2016 [65]; K. King, 2015 [66]; B. B. Johnson, 2012 [68]; T. Rotko, 2003 [74] |
| A direct association between air pollution and perception is established, with a specific role of symptoms, behavior, socioeconomic factors, and information/communication | 20 | P. Misra, 2020 [35]; M. Mirabelli, 2020 [41]; M. Machado, 2020 [42]; S. Pu, 2019 [45]; M. Zakaria, 2019 [46]; D. Dong, 2019 [47]; Y. Lu, 2018 [49]; A. Bergstra, 2018 [51]; K. Malecki, 2018 [53]; E. Dons, 2018 [54]; M. Cantuaria, 2017 [57]; R. Cisneros, 2017 [61]; N. Ngo, 2017 [62]; J. Ban, 2017 [34]; Z. Tao, 2016 [64]; S. Wang, 2015 [67]; M. Kim, 2012 [27]; M. Nikolopoulou, 2011 [69]; X. Wen, 2009 [70]; B. Tilt, 2006 [72] |
© 2020 by the authors. Licensee MDPI, Basel, Switzerland. This article is an open access article distributed under the terms and conditions of the Creative Commons Attribution (CC BY) license (http://creativecommons.org/licenses/by/4.0/).
Share and Cite
Cori, L.; Donzelli, G.; Gorini, F.; Bianchi, F.; Curzio, O. Risk Perception of Air Pollution: A Systematic Review Focused on Particulate Matter Exposure. Int. J. Environ. Res. Public Health 2020, 17, 6424. https://doi.org/10.3390/ijerph17176424
Cori L, Donzelli G, Gorini F, Bianchi F, Curzio O. Risk Perception of Air Pollution: A Systematic Review Focused on Particulate Matter Exposure. International Journal of Environmental Research and Public Health. 2020; 17(17):6424. https://doi.org/10.3390/ijerph17176424
Chicago/Turabian StyleCori, Liliana, Gabriele Donzelli, Francesca Gorini, Fabrizio Bianchi, and Olivia Curzio. 2020. "Risk Perception of Air Pollution: A Systematic Review Focused on Particulate Matter Exposure" International Journal of Environmental Research and Public Health 17, no. 17: 6424. https://doi.org/10.3390/ijerph17176424
APA StyleCori, L., Donzelli, G., Gorini, F., Bianchi, F., & Curzio, O. (2020). Risk Perception of Air Pollution: A Systematic Review Focused on Particulate Matter Exposure. International Journal of Environmental Research and Public Health, 17(17), 6424. https://doi.org/10.3390/ijerph17176424