1. Introduction
China, as the largest developing country in the world [
1], has experienced a rapid process of urbanization and suffered from the accompanying air pollution problems. Among them, particulate matter (PM, mainly including PM
2.5 and PM
10) pollution is especially serious in China and has drawn widespread attention from the public [
2,
3]. Many epidemiological research studies have confirmed that PM pollutants can threat human health, such as increasing the risk of heart disease, lung cancer, and cardiovascular diseases [
4,
5,
6]. It was also reported that the total disability-adjusted life years (DALYs) associated with PM
2.5 and PM
10 pollution in China are 7.2 million and 20.66 million, respectively, in 2014–2015 [
7]. To improve air quality, the Chinese government has implemented numerous harsh clean air measures, such as shutting down some high polluted factories and eliminating outdated industrial capacities, since 2013 [
8,
9]. Several research studies found decreasing trends of the annual average PM
2.5 and PM
10 concentrations in recent years, especially in some key urban agglomerations, such as the Beijing-Tianjin-Hebei (BTH), the Yangtze River Delta (YRD), and the Pearl River Delta (PRD) [
10,
11]. Scholars also identified the reduction of industrial emission and the promotion of clean fuels in traffic and residential sectors to be the two dominant factors for the PM pollution reduction in China [
12]. However, despite the declining tendencies in some parts of China, the PM pollution is still serious in China given its large concentrations. Specifically, the average concentrations of PM
10 and PM
2.5 over China were 89 μg/m
3 and 43 μg/m
3 in 2017 [
11], which were 4.5 times and 4 times more than the World Health Organization (WHO) guidelines, respectively. [
13].
Since the first case reported in Wuhan, a mega city in central China, in December 2019, many more cases of COVID-19 have been found over the country and it has evolved into a global pandemic further. Until 8 April 2020, according to WHO, there had been over 1 million confirmed cases and almost 80 thousand death cases reported worldwide [
14]. This new virus is highly contagious and can even spread through aerosol [
15]. To cut off the spread of the COVID-19 virus, the Chinese government adopted the strictest self-quarantine measures and listed it as the category B infectious disease on 20 January 2020. People were restricted from traveling outside for entertainment, study, and work and were encouraged to stay at home. In addition, because of the Spring Festival, workers went back to their hometowns, so numerous industrial plants had to be shut down during this period. Under this circumstance, less traffic mobility and industrial operation produced less atmospheric pollutant emissions which were in favor of air quality improvement [
16]. Some studies also reported that air pollutants, such as PM
10, O
3, and NO
2, showed significant reductions during the COVID-19 outbreak in some major cities around the world, such as New York, Rome, and Delhi [
17,
18]. In the Yangtze River Delta Region of China, it was found that the reduction of industrial operations and vehicles’ emissions made a great contribution to air quality improvement during this period [
19]. Thus, these control measures are not only necessary for preventing the contagion of COVID-19 virus but also provide an opportunity to examine the effect on PM pollution of traffic restriction and industrial shutdown. In addition, it must be recognized that the pattern of PM pollution reduction tends to vary in regions due to the diversified city response to COVID-19. However, related research studies were mainly focused on local regions or cities, and the national spatiotemporal change pattern of PM was discussed rarely.
In addition to the spatiotemporal variations of PM pollution, the influencing factors driving such variations are also essential for investigating how COVID-19 control measures affected PM pollution. PM pollution related influencing factors can be categorized as natural environmental factors and socioeconomic factors. Some studies have proved that some natural meteorological factors, such as relative humidity, play very important roles in the formation of the substances in PM [
20,
21]. As for socioeconomic indicators, previous research studies tended to use some indicators from government yearbooks or bulletins, such as secondary industry share, population density, and gross domestic product (GDP) per capita, to reflect the effect of human activities on PM pollution [
22,
23,
24]. Among these indicators, scholars have confirmed that some, like secondary industry share, is significantly correlated with PM pollution, while the influences of other factors, like GDP per capita, are dependent on the development stage of a city or a region [
25,
26]. Compared with the study periods in previous researches, the period of COVID-19 outbreak is relatively short and it is tough to find appropriate data. For example, traffic mobility reduction, as a vital factor contributing to the PM pollution, is limited by availability and reliability and is hard to measure, especially during a relatively short period. As the development of mobile Internet technology, traffic mobility can be perceived easily by the data from location-based service (LBS) [
27]. Moreover, it can present the change of traffic mobility with high temporal resolution, thus possibly being the solution for the short-period research studies, like ours.
In terms of investigation methods, some scholars used classic statistical methods, such as ordinary least square (OLS) model and stochastic impacts by regression on population, affluence, and technology (STIRPAT) model, for relationship analysis [
23,
28]. These models indicate the overall influence of different factors by some global coefficients and cannot depict the spatial heterogeneity among different geographical objects. To solve this issue, geographically weighted regression (GWR), a local regression method, indicating the influence of factors by many spatial coefficients, were introduced in some research studies [
29,
30]. However, there are also some disadvantages for GWR. For example, GWR assumes that all influencing factors affect the result at the same scale, which may induce some errors. For the research studies of air pollution underlying mechanism analysis, the relationship between pollutants and different influencing factors usually varies in spatial scales [
31]. Therefore, GWR may not perform well for the influencing factors analysis in our research. Recently, an improved model of GWR, multi-scale geographically weighted regression (MGWR), was developed [
32]. This model can obtain the optimal bandwidth for each influencing factor and address the issue of imposed scale heterogeneity, which might be the better choice in our research.
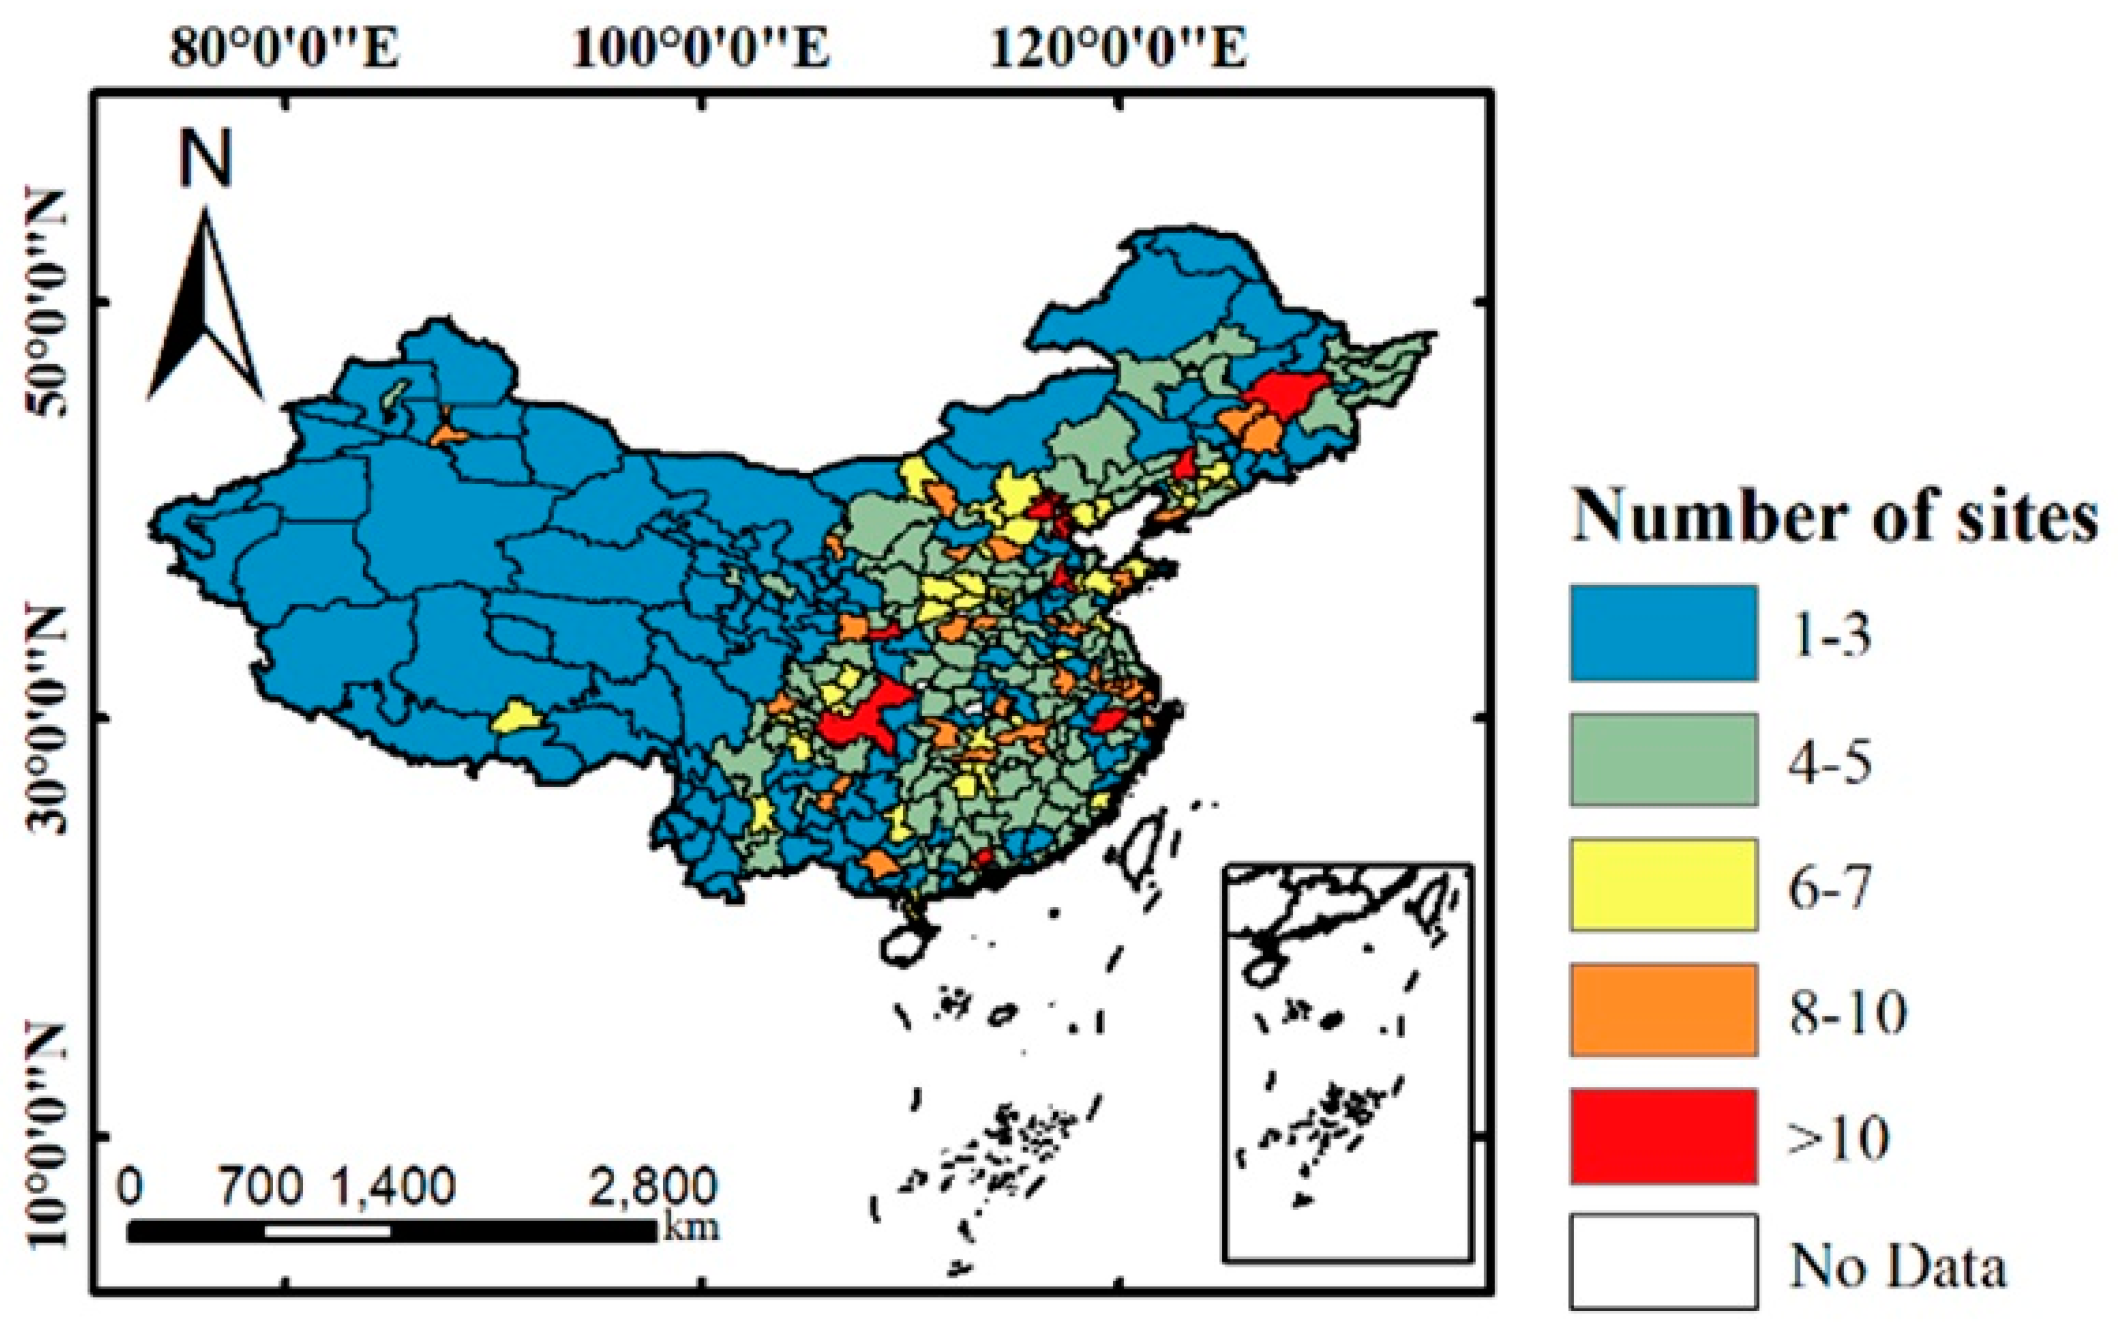
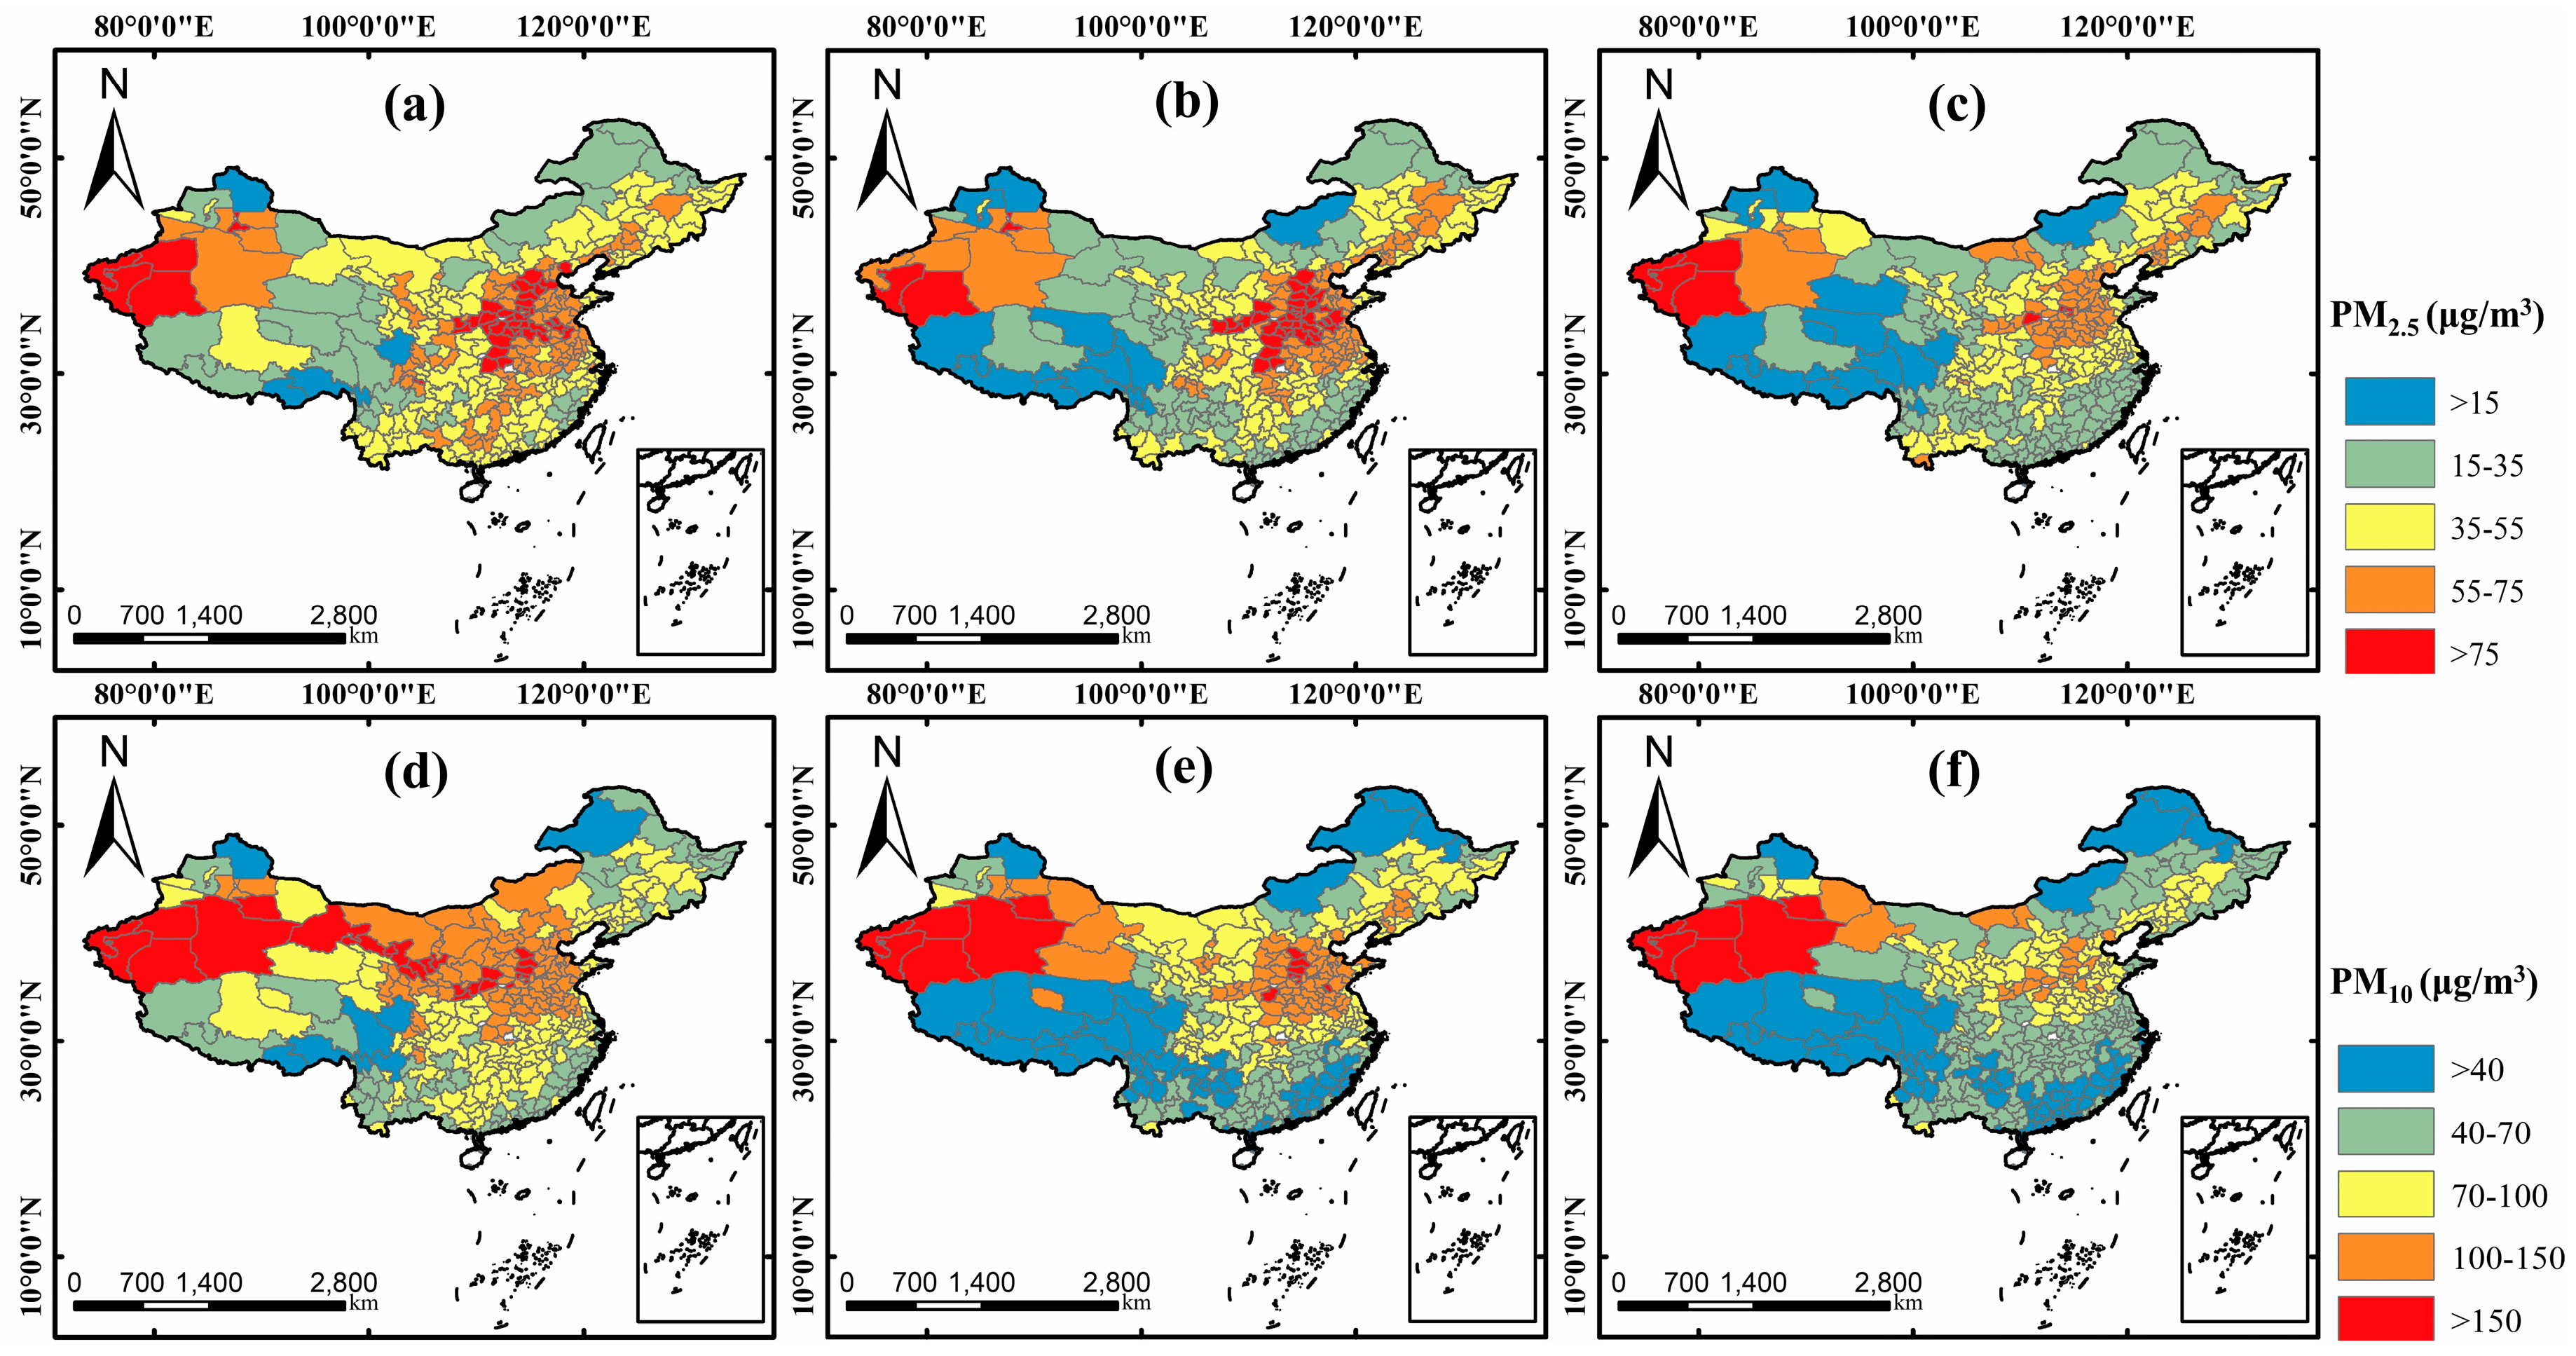
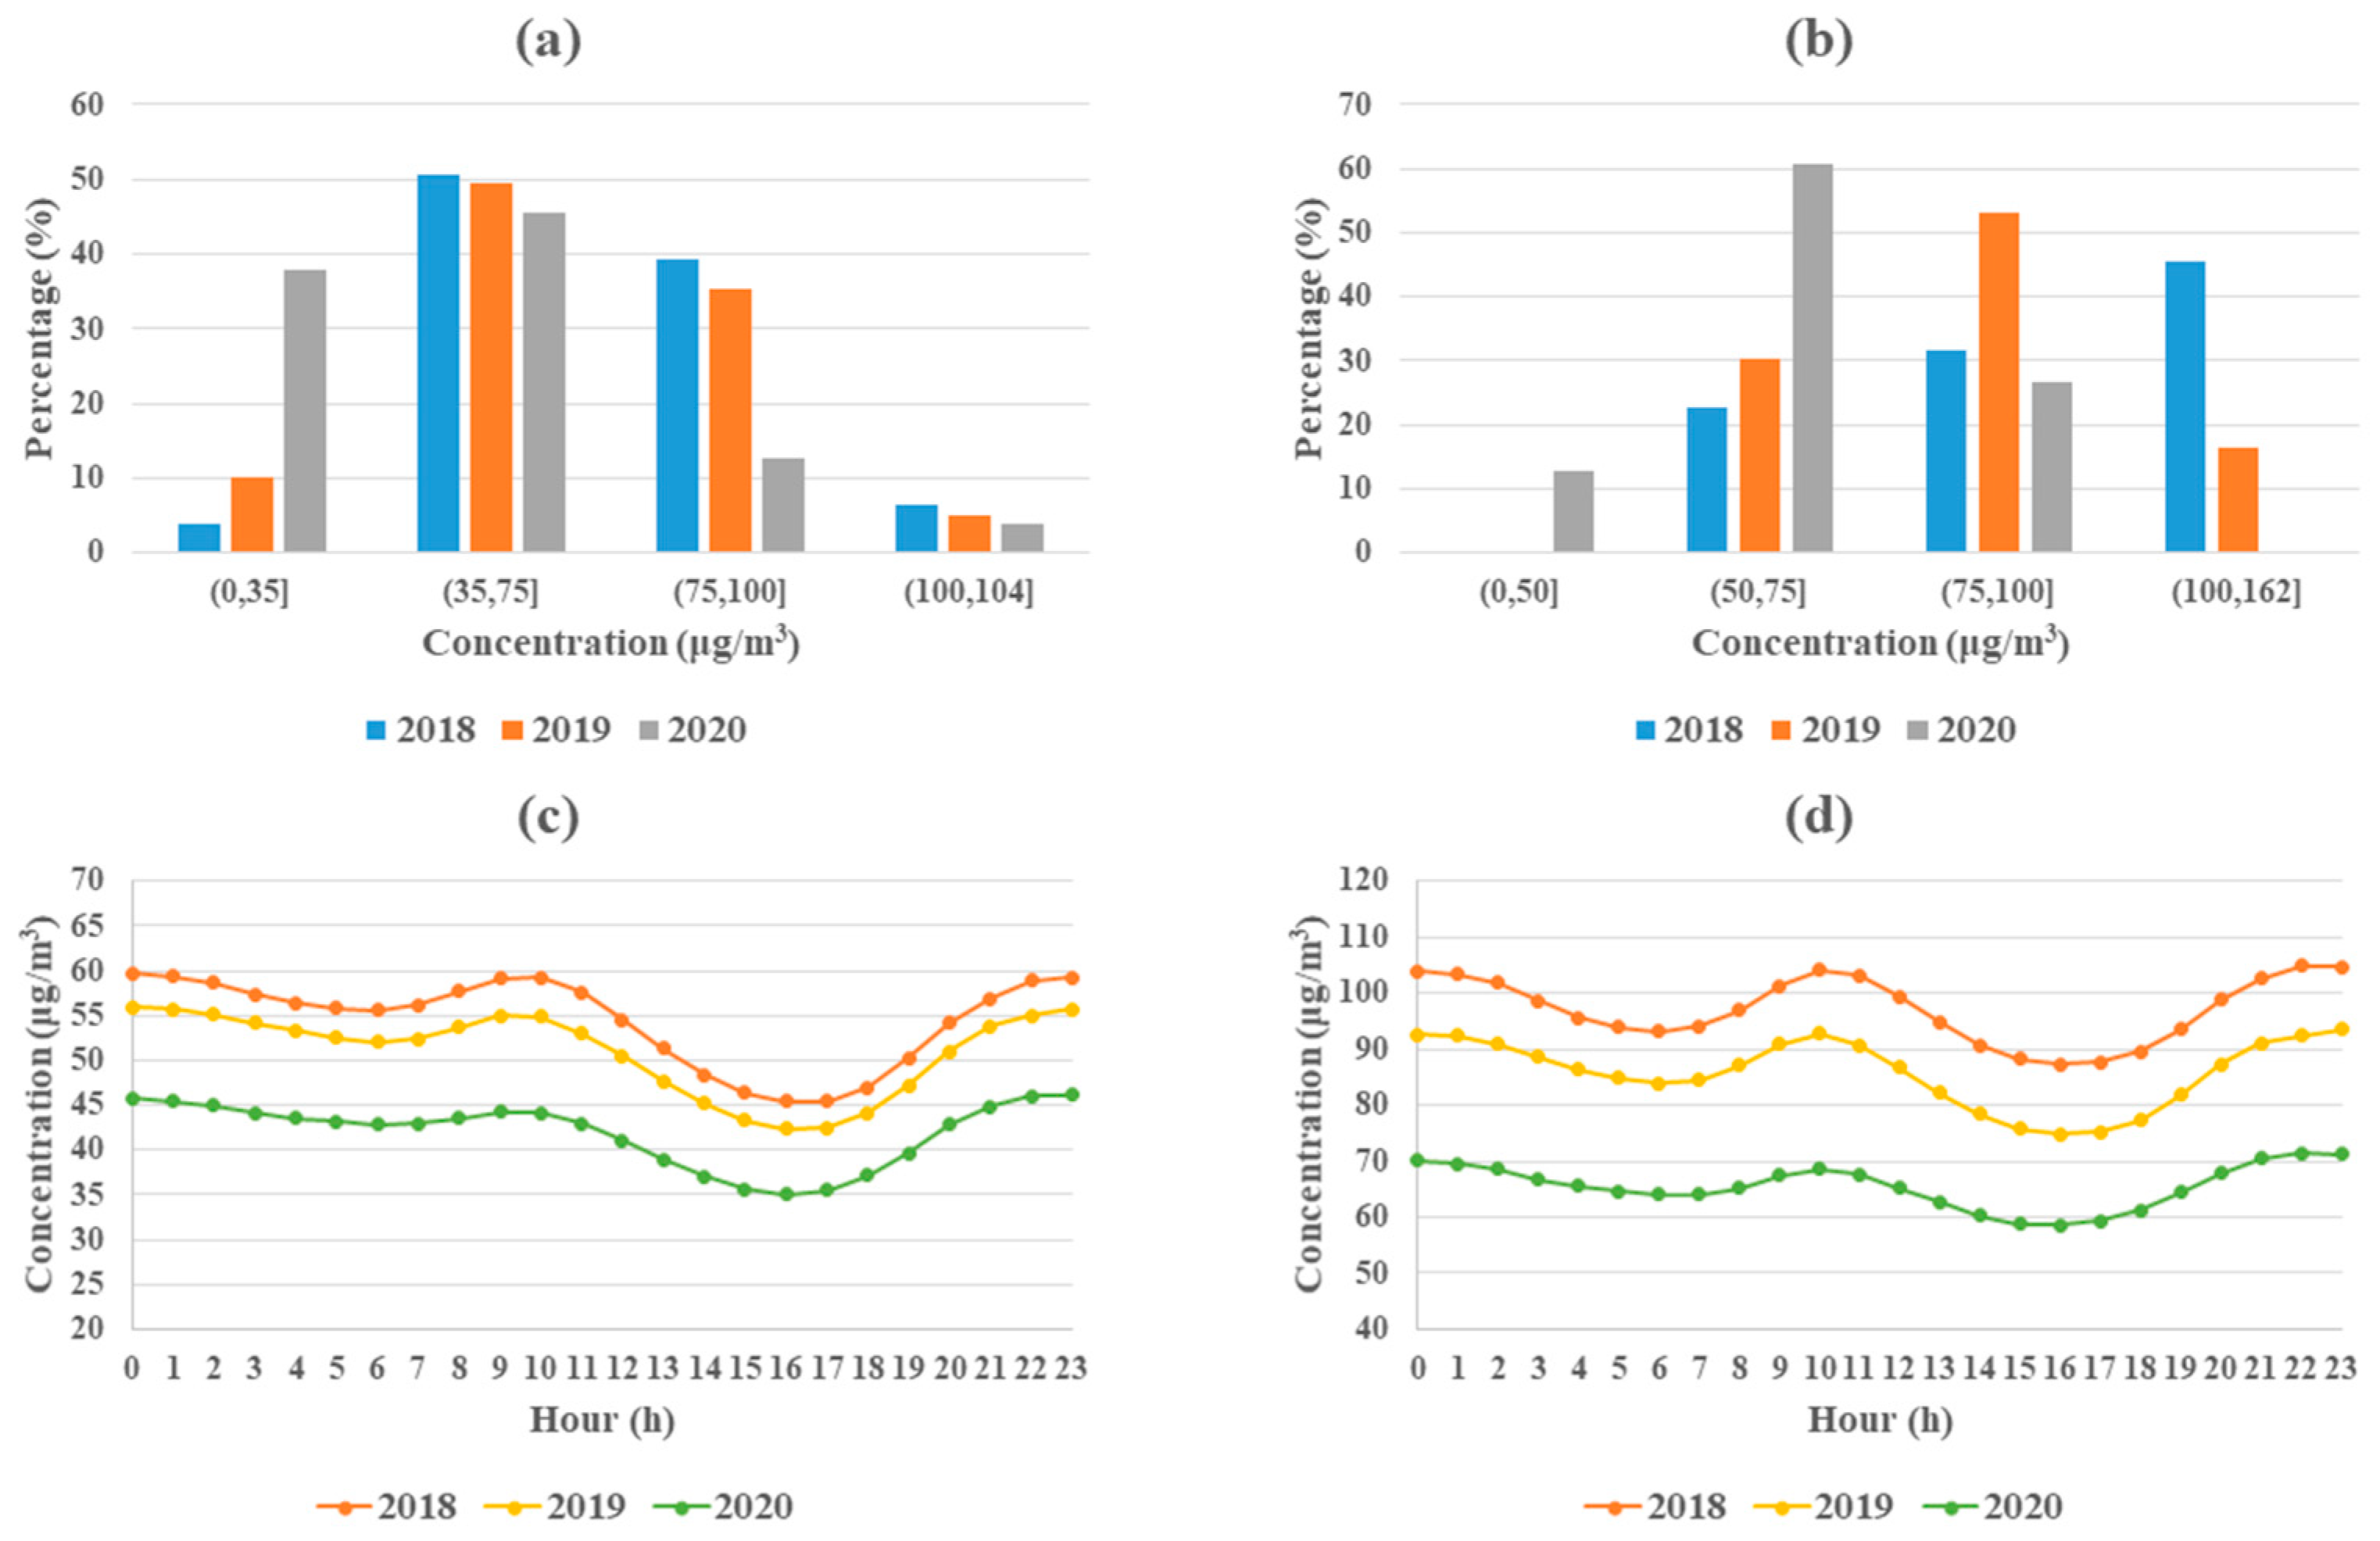
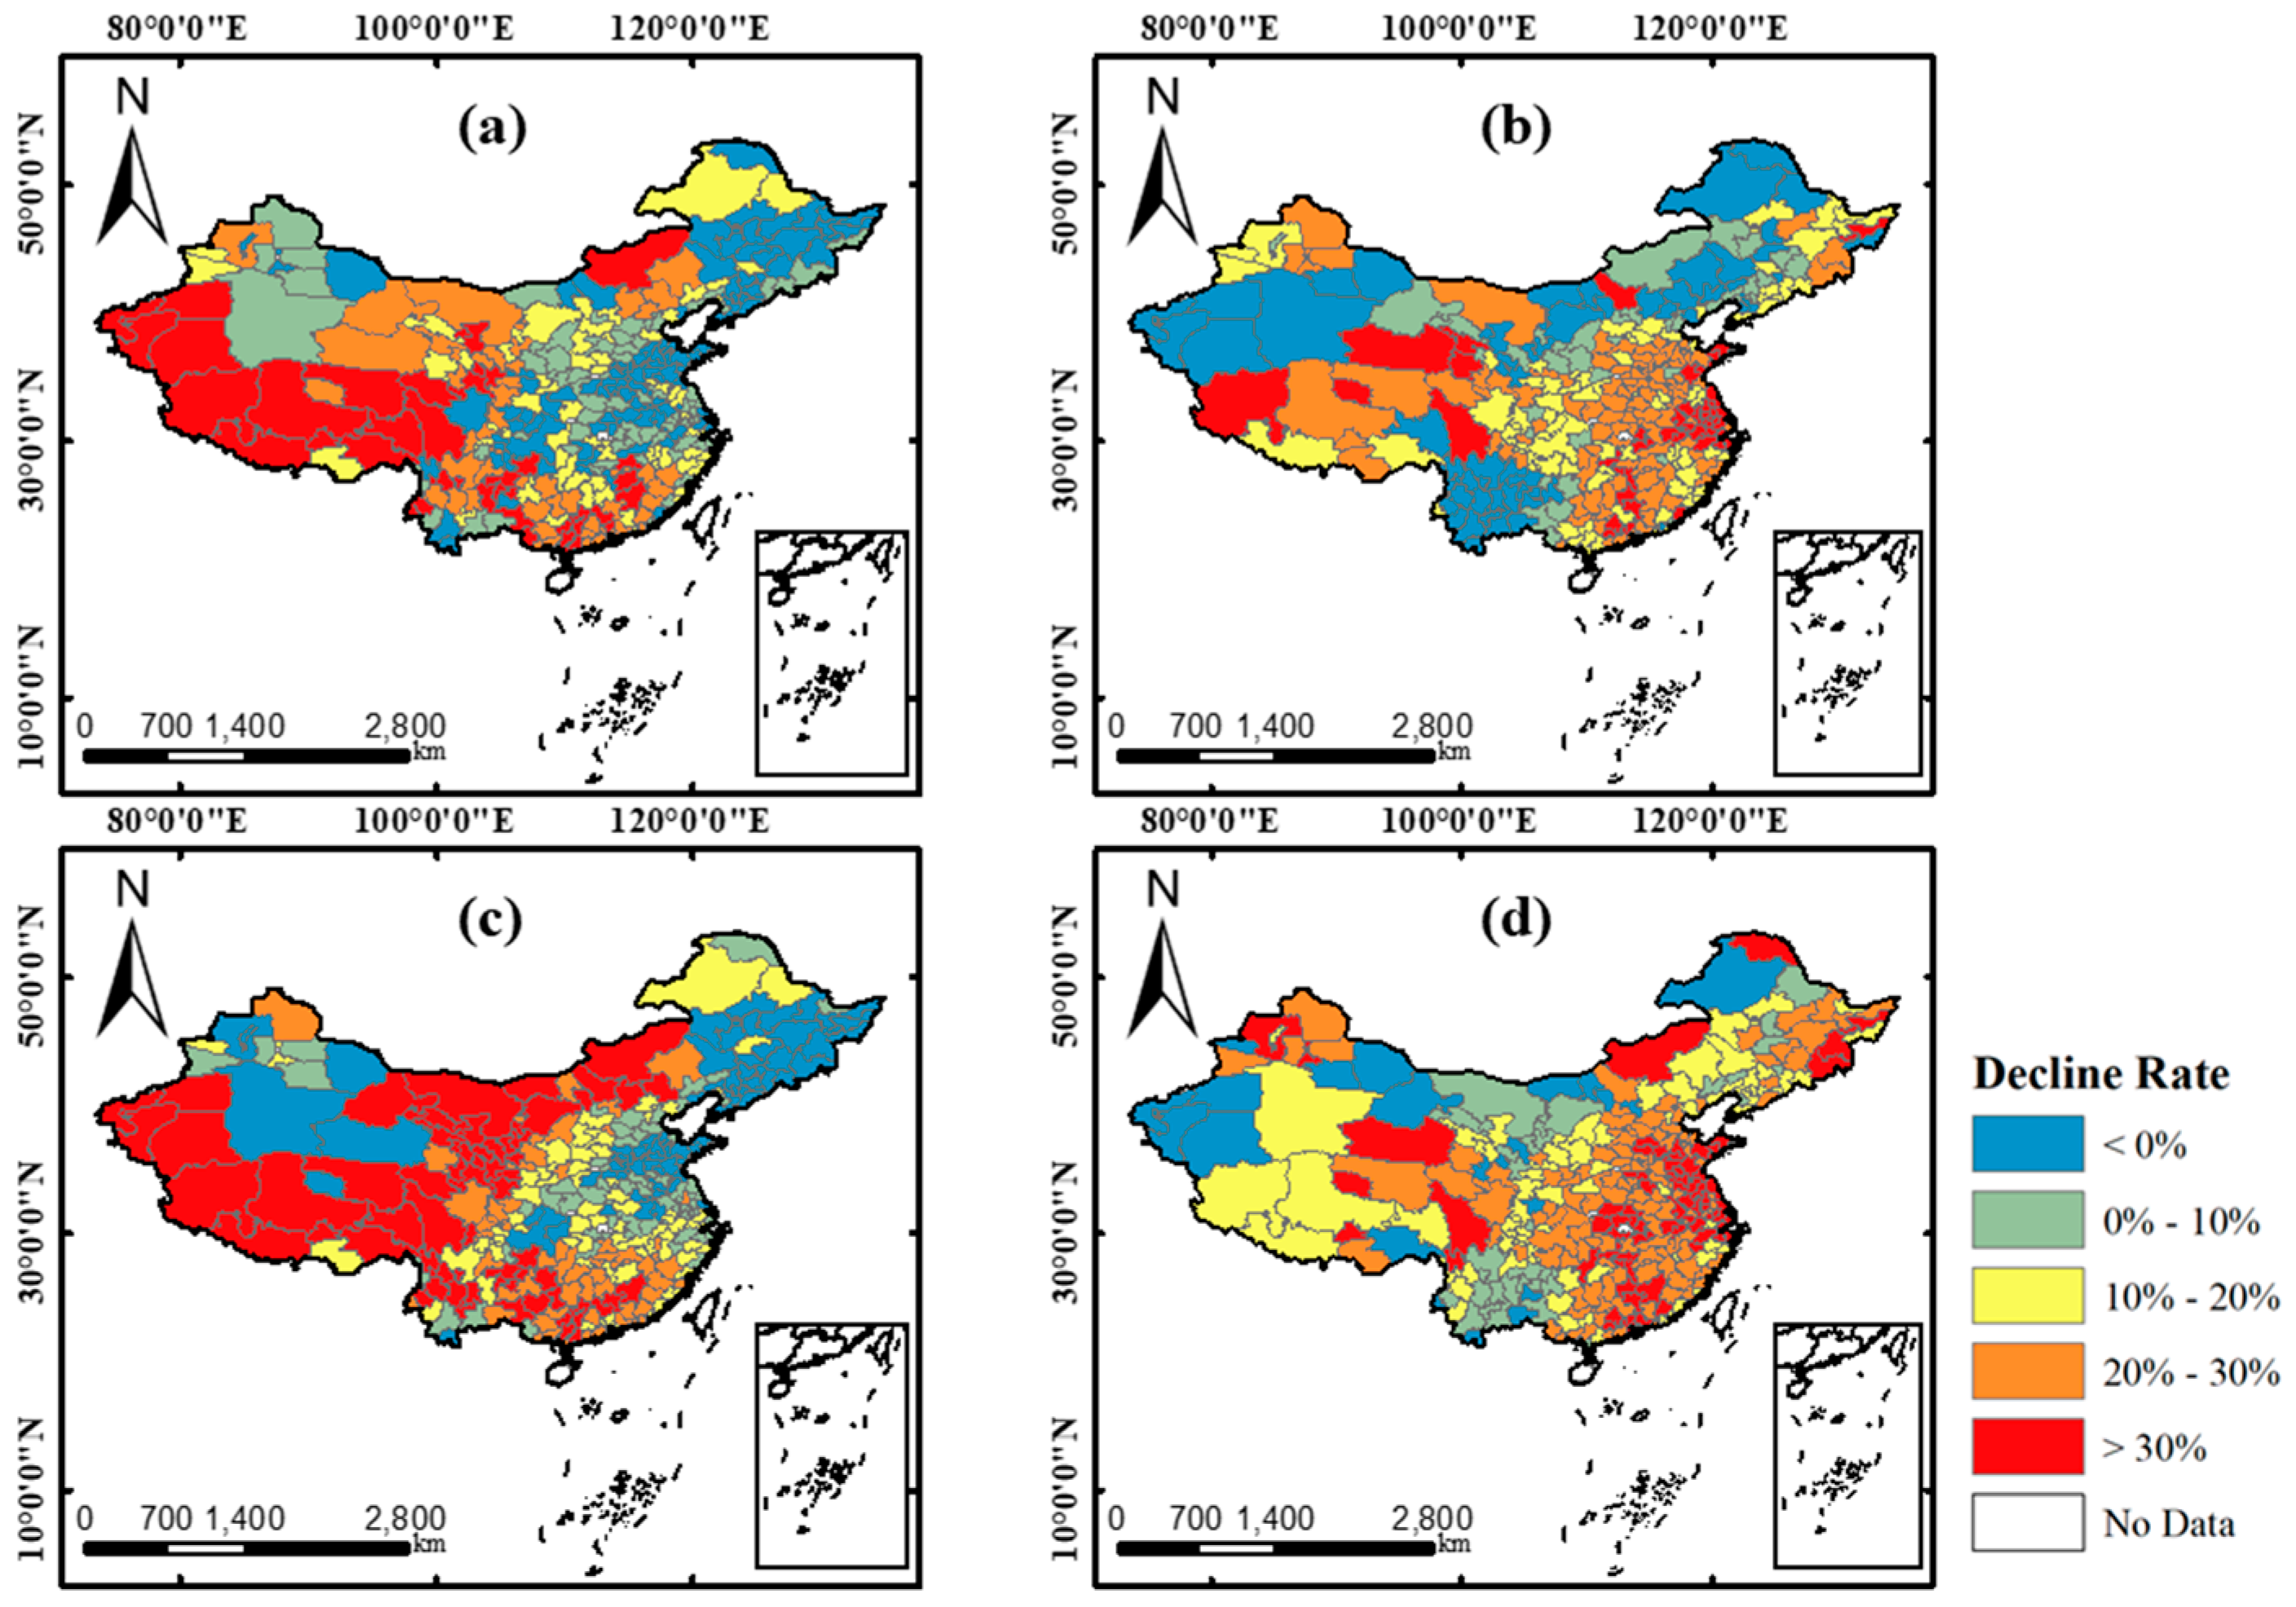
In this study, our goal was to derive the pattern of PM2.5 and PM10 change by comparing the concentrations in two study periods of 2019 and 2020, respectively, for prefecture cities of China and to further analyze the influencing factors. The study period was set from 20 January to 8 April, when the COVID-19 virus spread seriously in China and related control measures were the strictest during this period in 2020. Firstly, spatial autocorrelation analysis was conducted to recognize the PM concentration change pattern of all prefecture cities in China. Then, for reflecting the traffic mobility reduction, we collected intra-city mobility intensity of Chinese prefecture cities from the Baidu platform and used the average difference between 2019 and 2020 as the indicator for the regression analysis in the next stage. Lastly, MGWR was applied for the relationship investigation between the decline rates of both PM2.5 and PM10 and the influencing factors, including meteorological factors and socioeconomic factors.
4. Conclusions
In this study, we obtained the changed pattern of PM2.5 and PM10 concentration at city-scale in China during the COVID-19 outbreak compared with the same period of 2019 by spatial autocorrelation analysis. In addition, an improved model of GWR, MGWR, was applied for detecting the influence of four meteorological factors and two socioeconomic factors on the drop of PM pollution. The main findings are as follows:
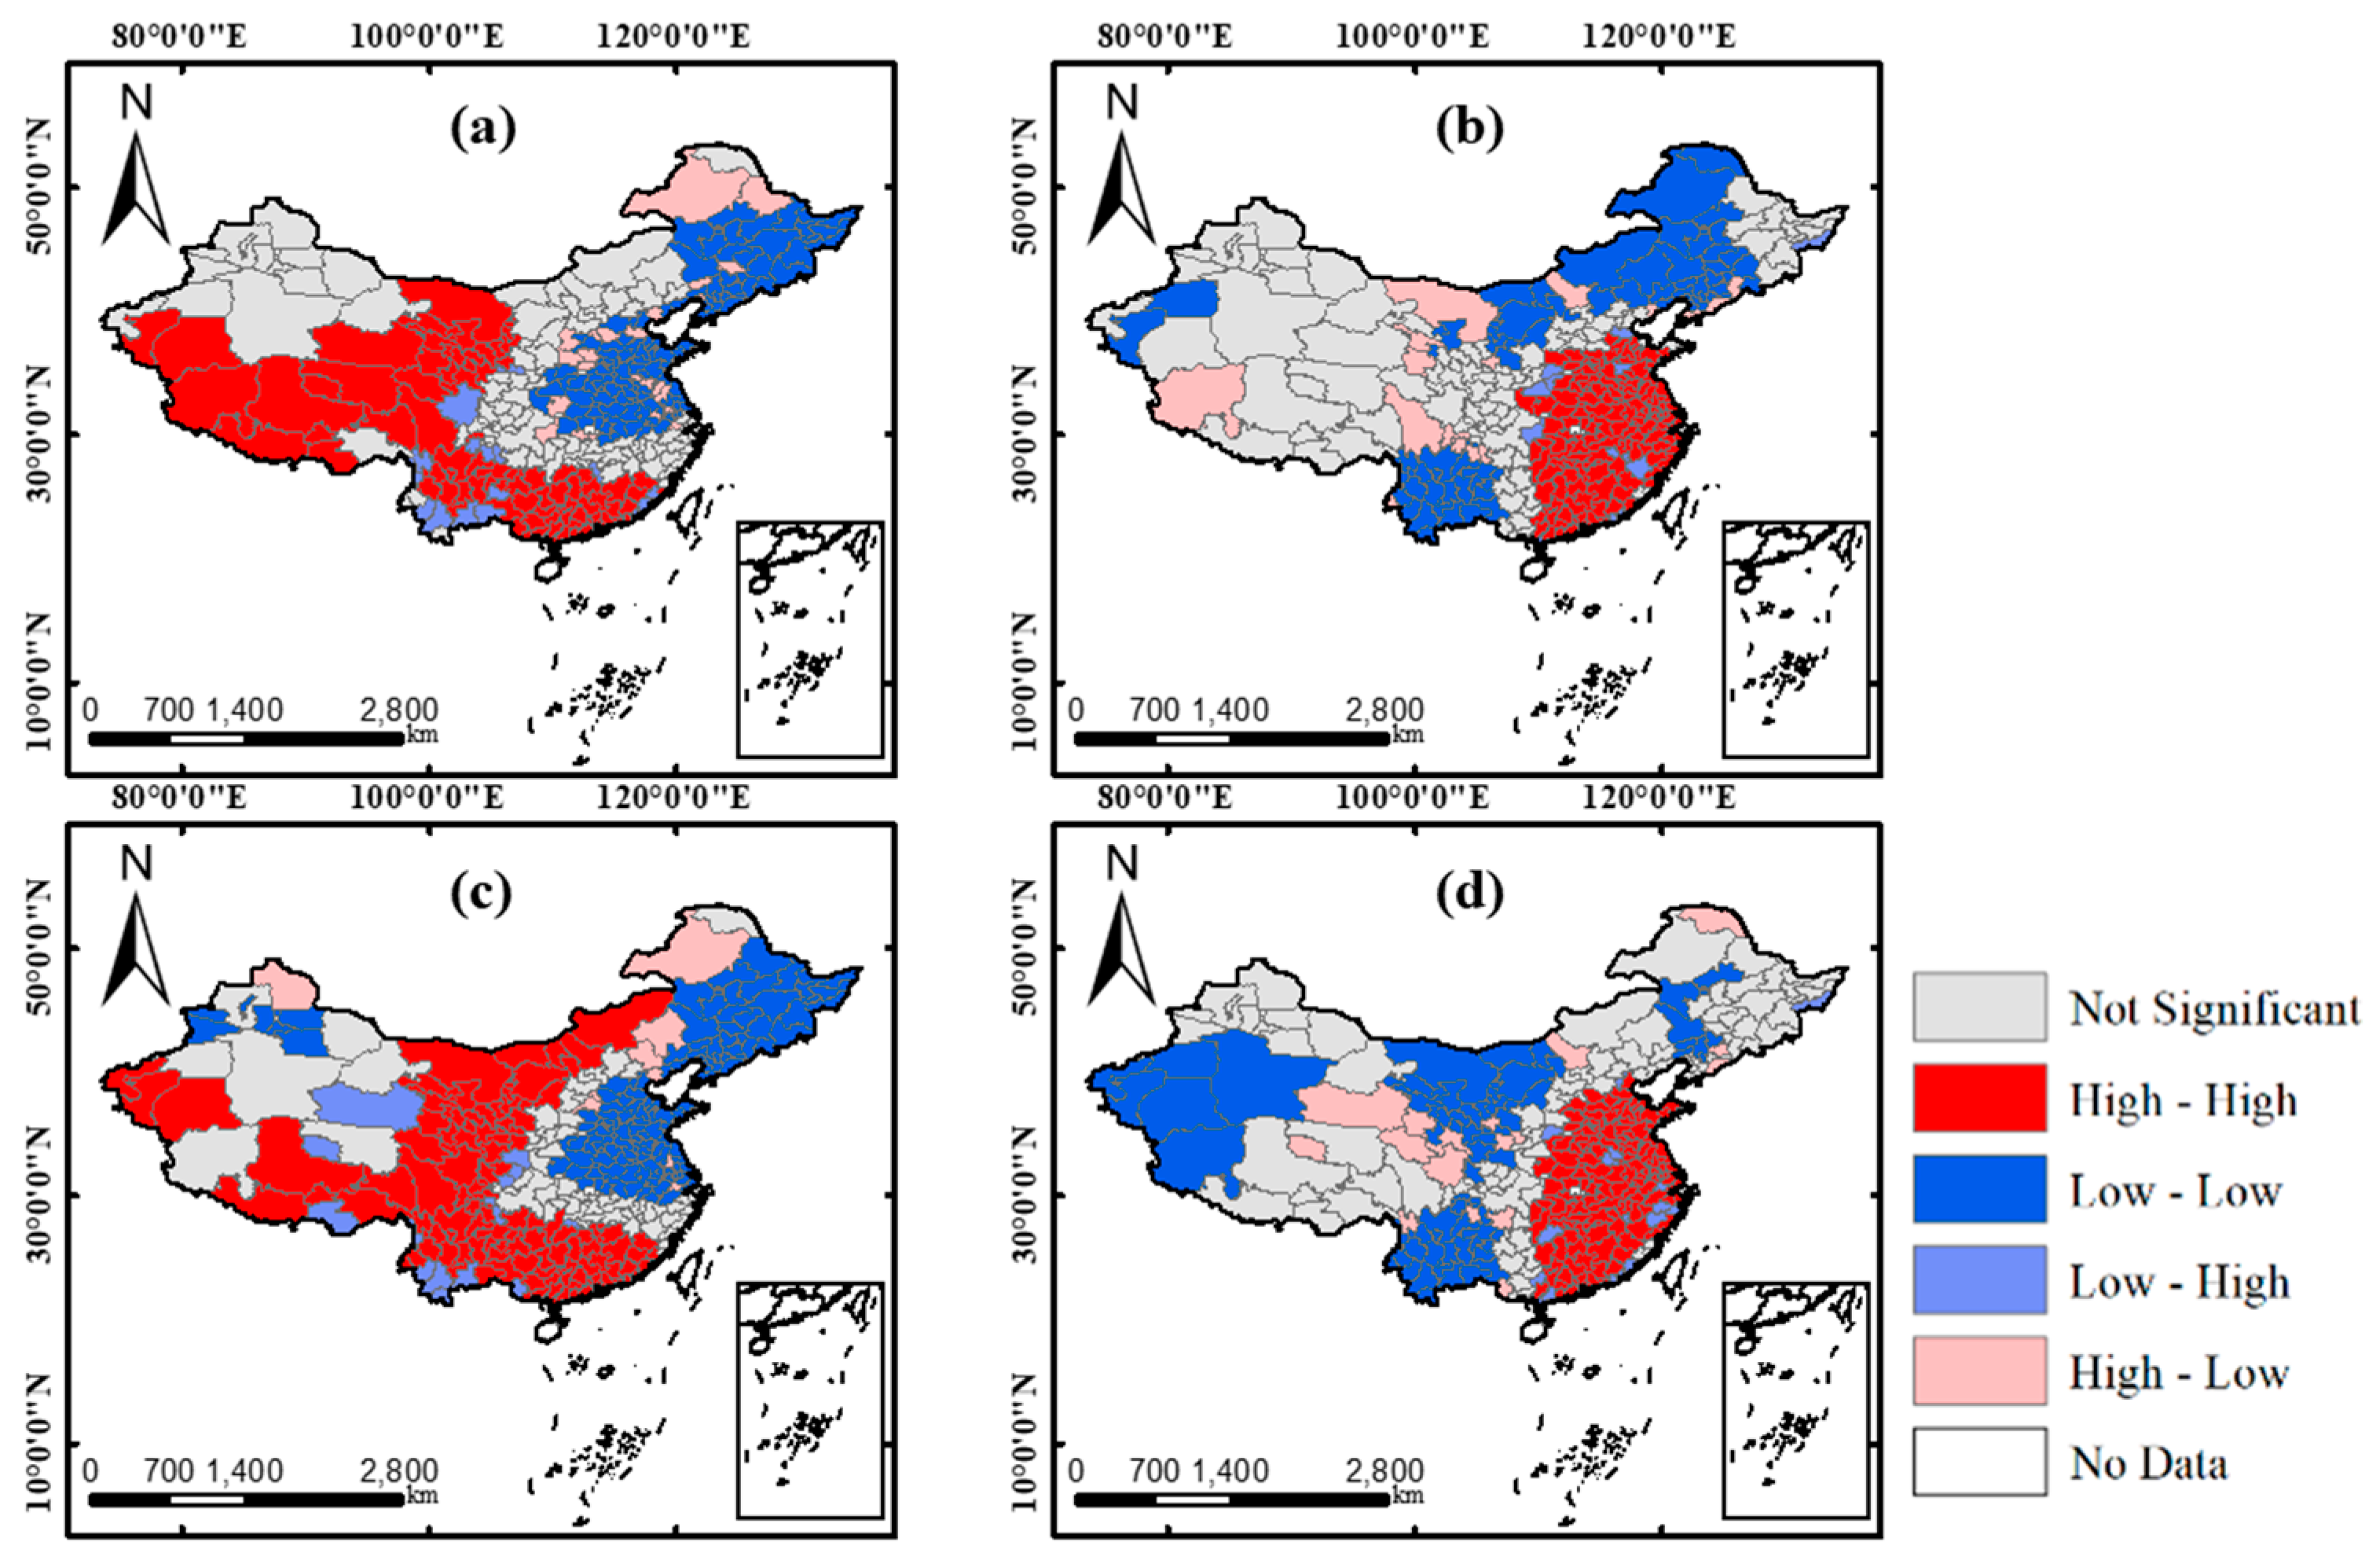
(1) The decline changes of both PM2.5 and PM10 presented a totally different spatiotemporal pattern in 2019–2020 compared with that of 2018–2019. In the result of 2018–2019, obvious “low-low” clustering patterns were found in north, central and east regions of China, whereas, in 2019–2020, it showed strong clustering patterns of high decline rates of PM2.5 and PM10 in these regions
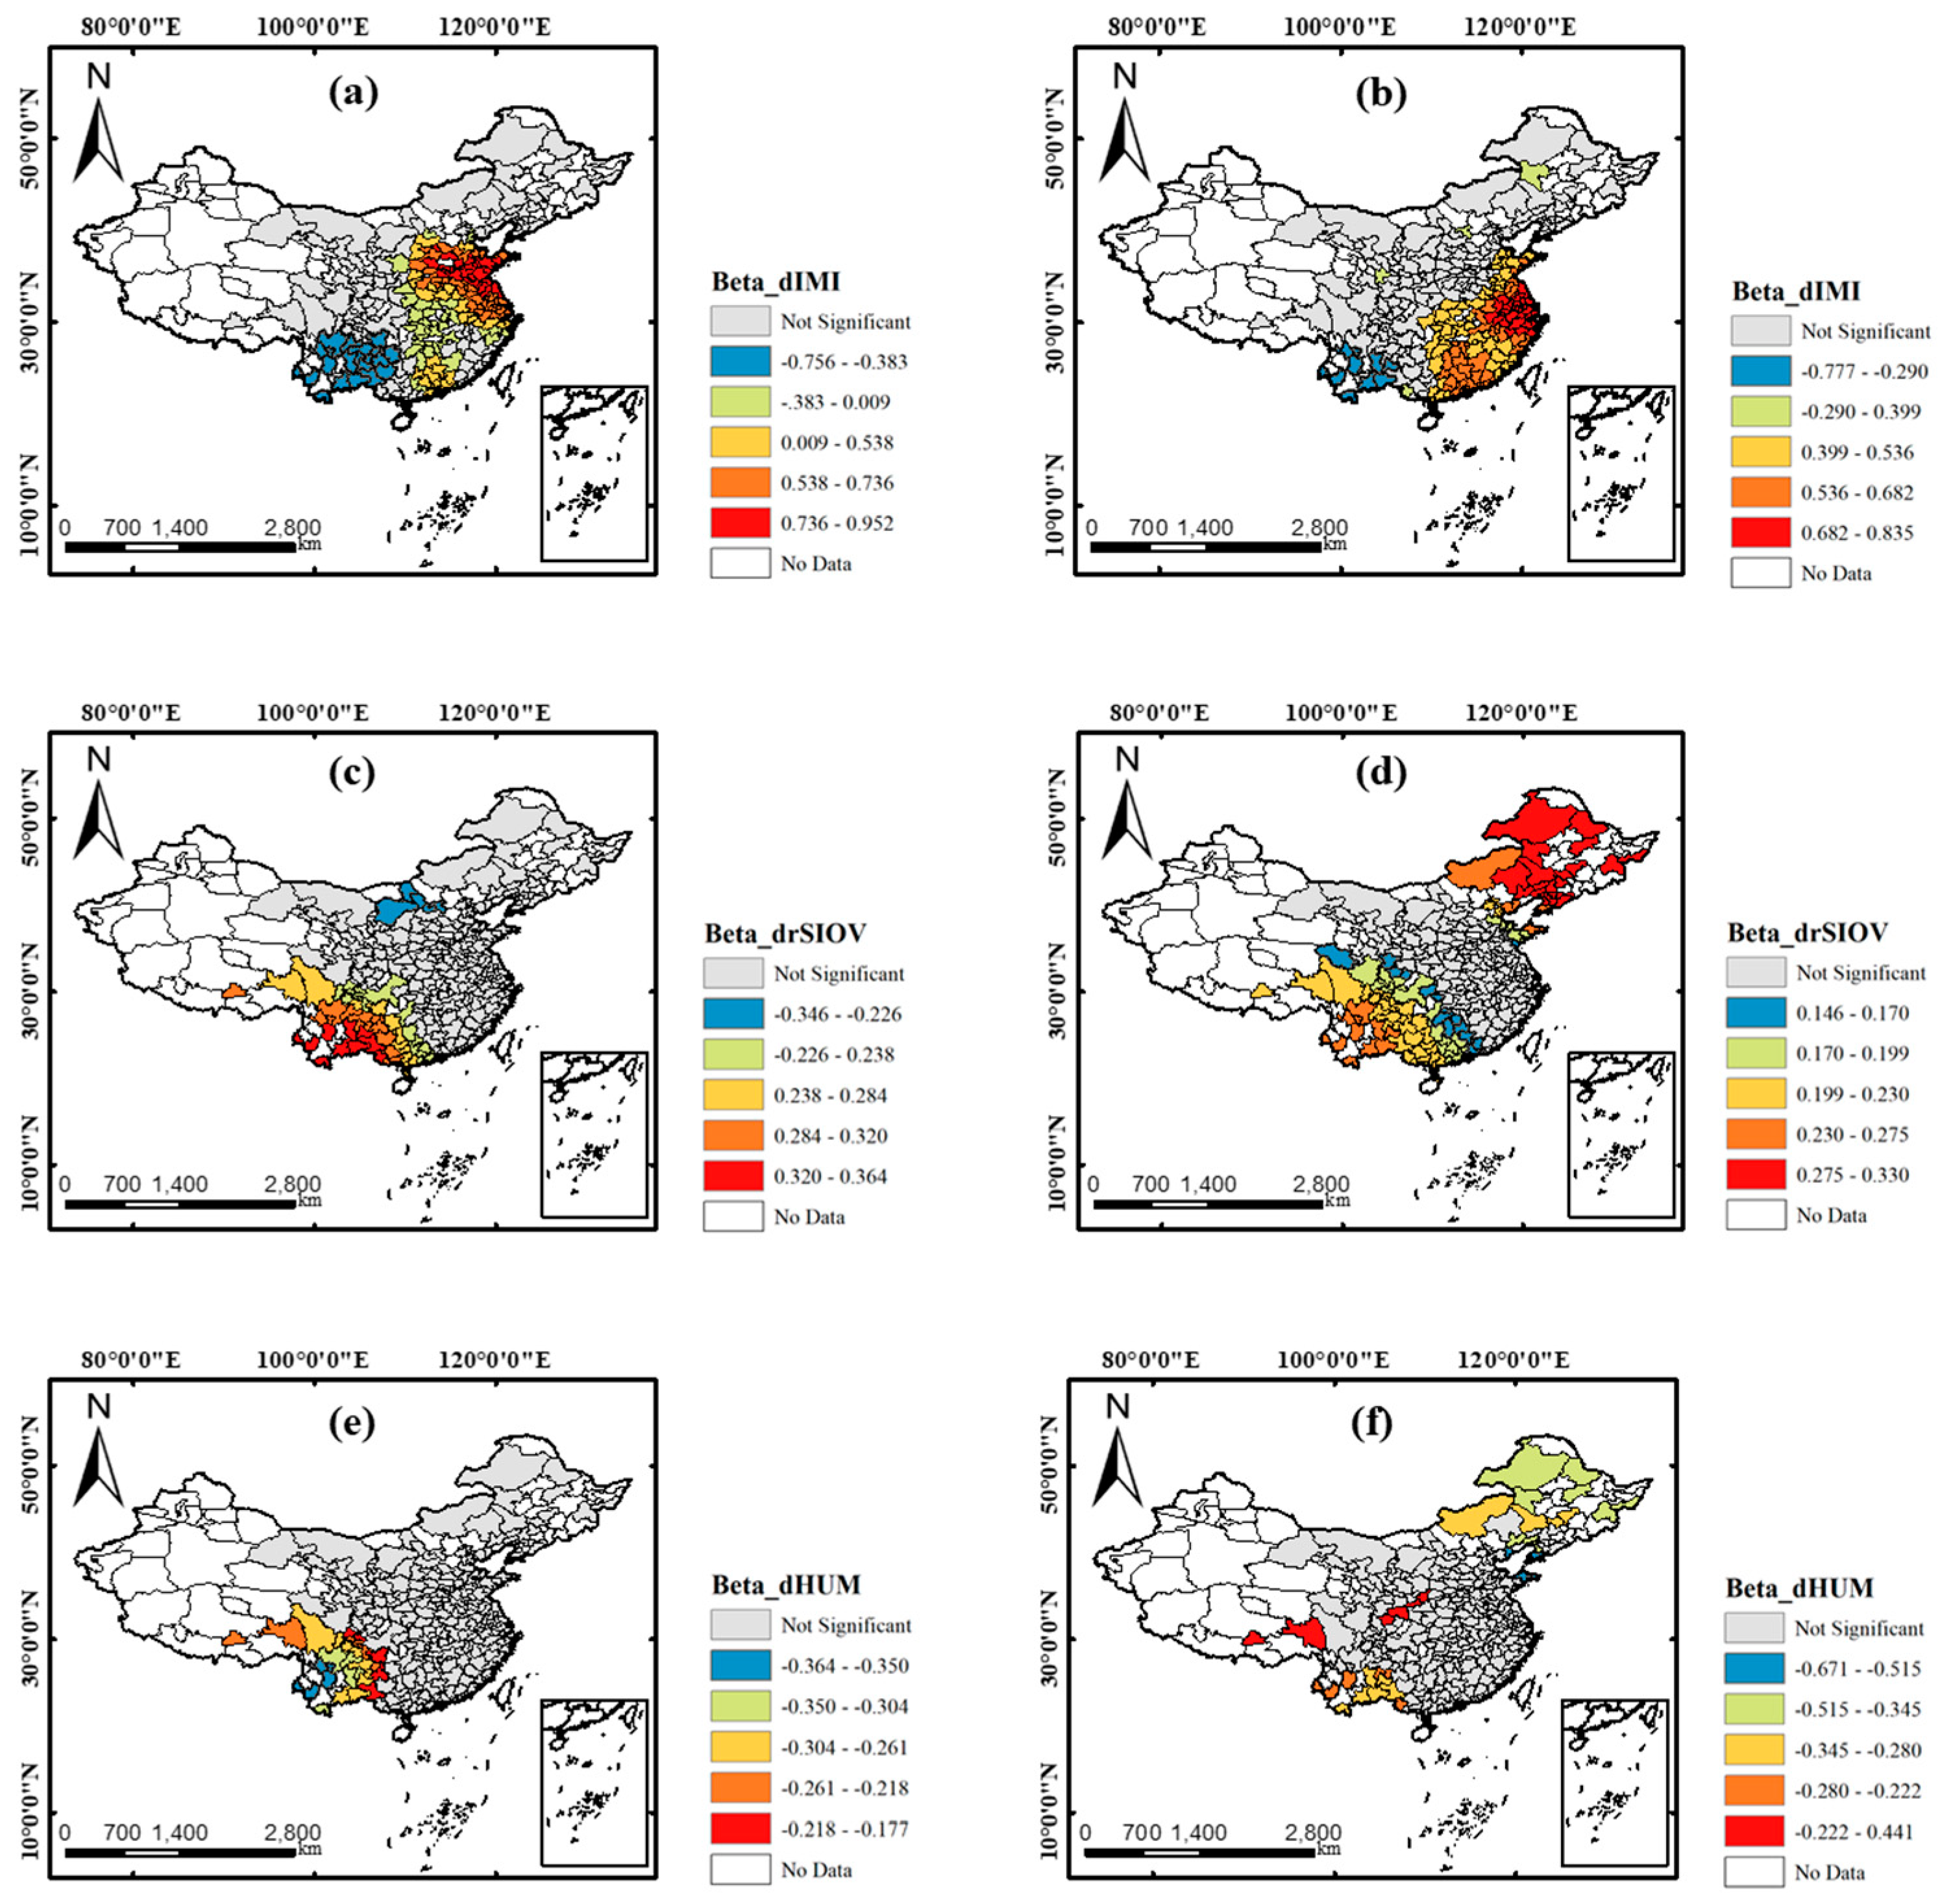
(2) IMI derived from Baidu and secondary industrial output values derived from local government bulletins were adopted to measure the influence of the decline of traffic mobility and industrial operation. These two variables showed an obvious positive relationship with the decline of PM2.5 and PM10.
(3) MGWR outperformed OLS and GWR, with R2 of 0.711 and 0.732 for drPM2.5 and drPM10, respectively. This reflected that the strategy that releases the restriction of constant scales was very effective in our research. Thus, the results of MGWR were applied in the analysis of influencing factors.
(4) In the results of MGWR, compared with meteorological variables, the decline of IMI and the decline rate of secondary industrial output values had a more significant impact on PM pollution reduction. It showed that the reduction of traffic mobility caused more reduction of PM2.5 in east China, such as Jiangsu and Zhejiang, while more reduction of PM10 in central regions, such as Shandong and Henan, were observed. In addition, it was found that the reduction of secondary industrial output values caused more PM2.5 drop in southwest regions of China and more PM10 drop in northeast of China.
This study also has some limitations. First, limited by data, this study only adopted the data of 264 prefectural cities, which may cause some biases. Second, there are some other influencing factors, such as biomass burning, sand dust, and biogenic and biological PM, were not involved. Third, most PM observation sites are in urban areas while sparsely distributed in rural areas. This may also induce some uncertainty to the results. Last, some other meteorological factors, like atmosphere stability, which are also related with PM are not involved in this study, and we will consider these when data is available.
In general, although the COVID-19 control measures restricted travel freedom and economic development and forced people to conduct tele-work and tele-study, it provided an excellent and precious opportunity for observing PM pollution improvement. The findings of our research reflect the spatiotemporal PM pollution decline pattern and the impact of related influencing factors, thus being helpful for air pollution mitigation and control for the government. However, it also should be recognized that, despite the remarkable reduction, the concentrations of PM2.5 and PM10 were several times higher than the WHO standards during the COVID-19 outbreak. Therefore, there is still a long way to go to limit the PM pollution of China in the future.
