Factors Influencing Walking and Exercise Adherence in Healthy Older Adults Using Monitoring and Interfacing Technology: Preliminary Evidence


Abstract
1. Introduction
1.1. Background
1.2. Role of Technology
1.3. Influencing Factors
1.4. Objectives
2. Methods
2.1. Participants and Study Design
2.2. Laboratory Examinations
2.3. Physical Activity Intervention
2.4. Adherence
2.5. PACE System
2.6. Statistical Analysis
3. Results
3.1. Program and Volume Adherence
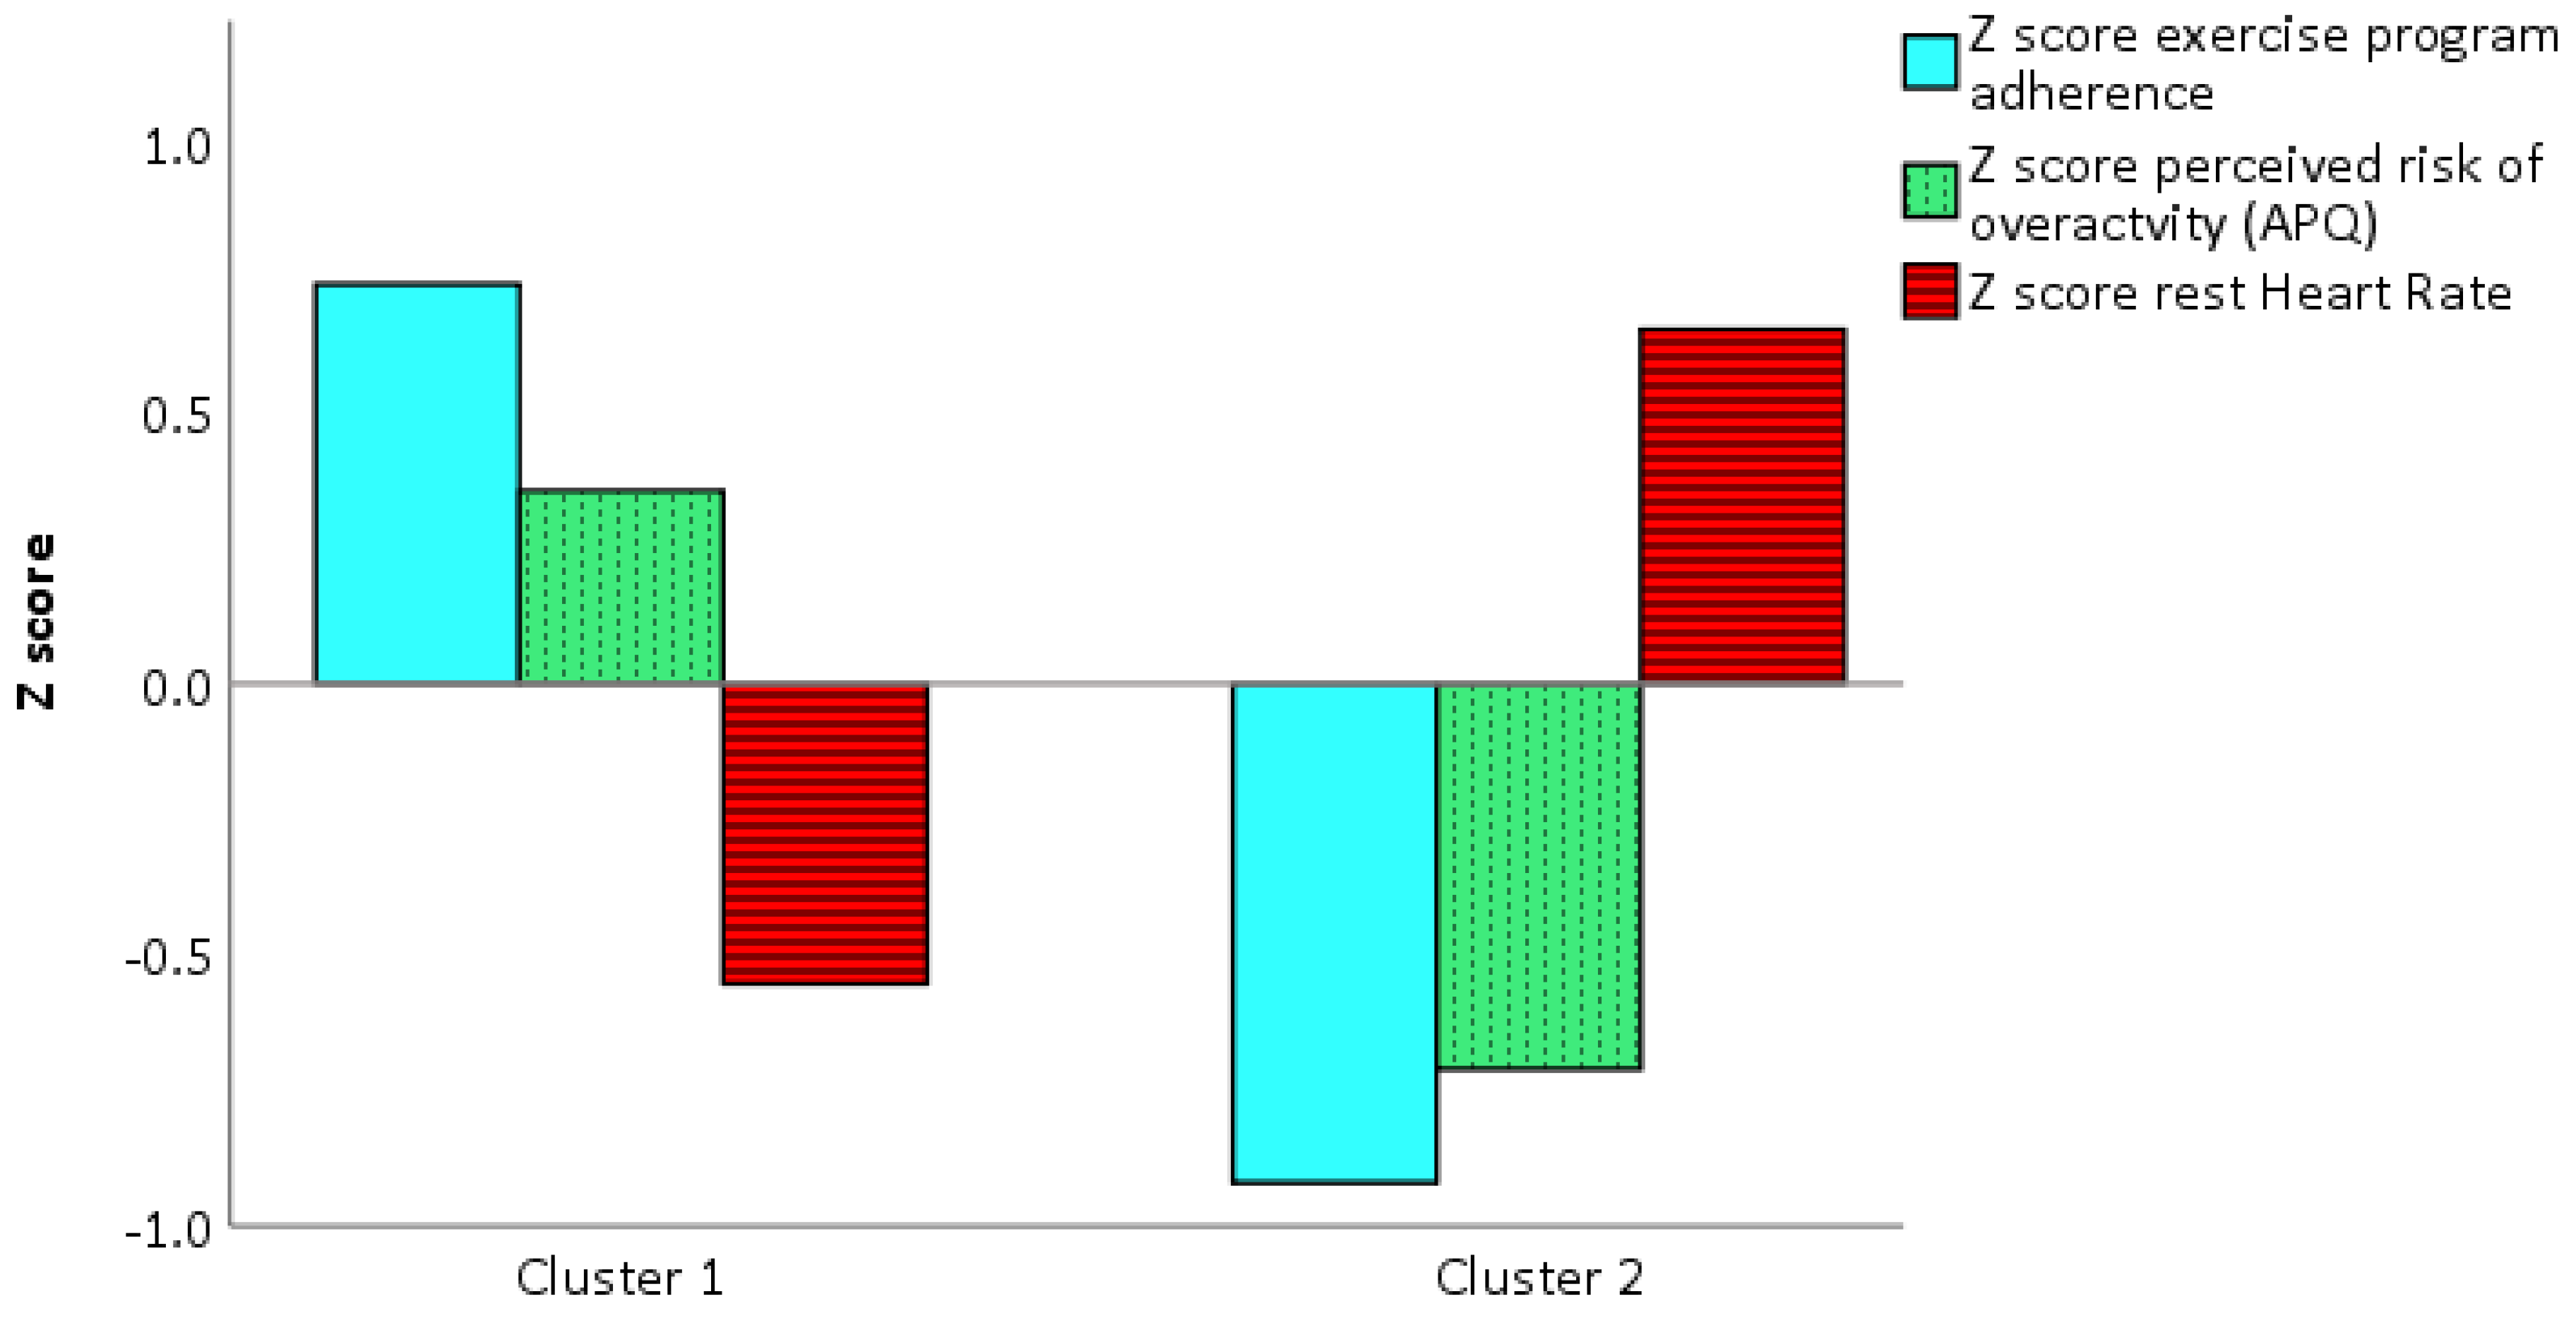
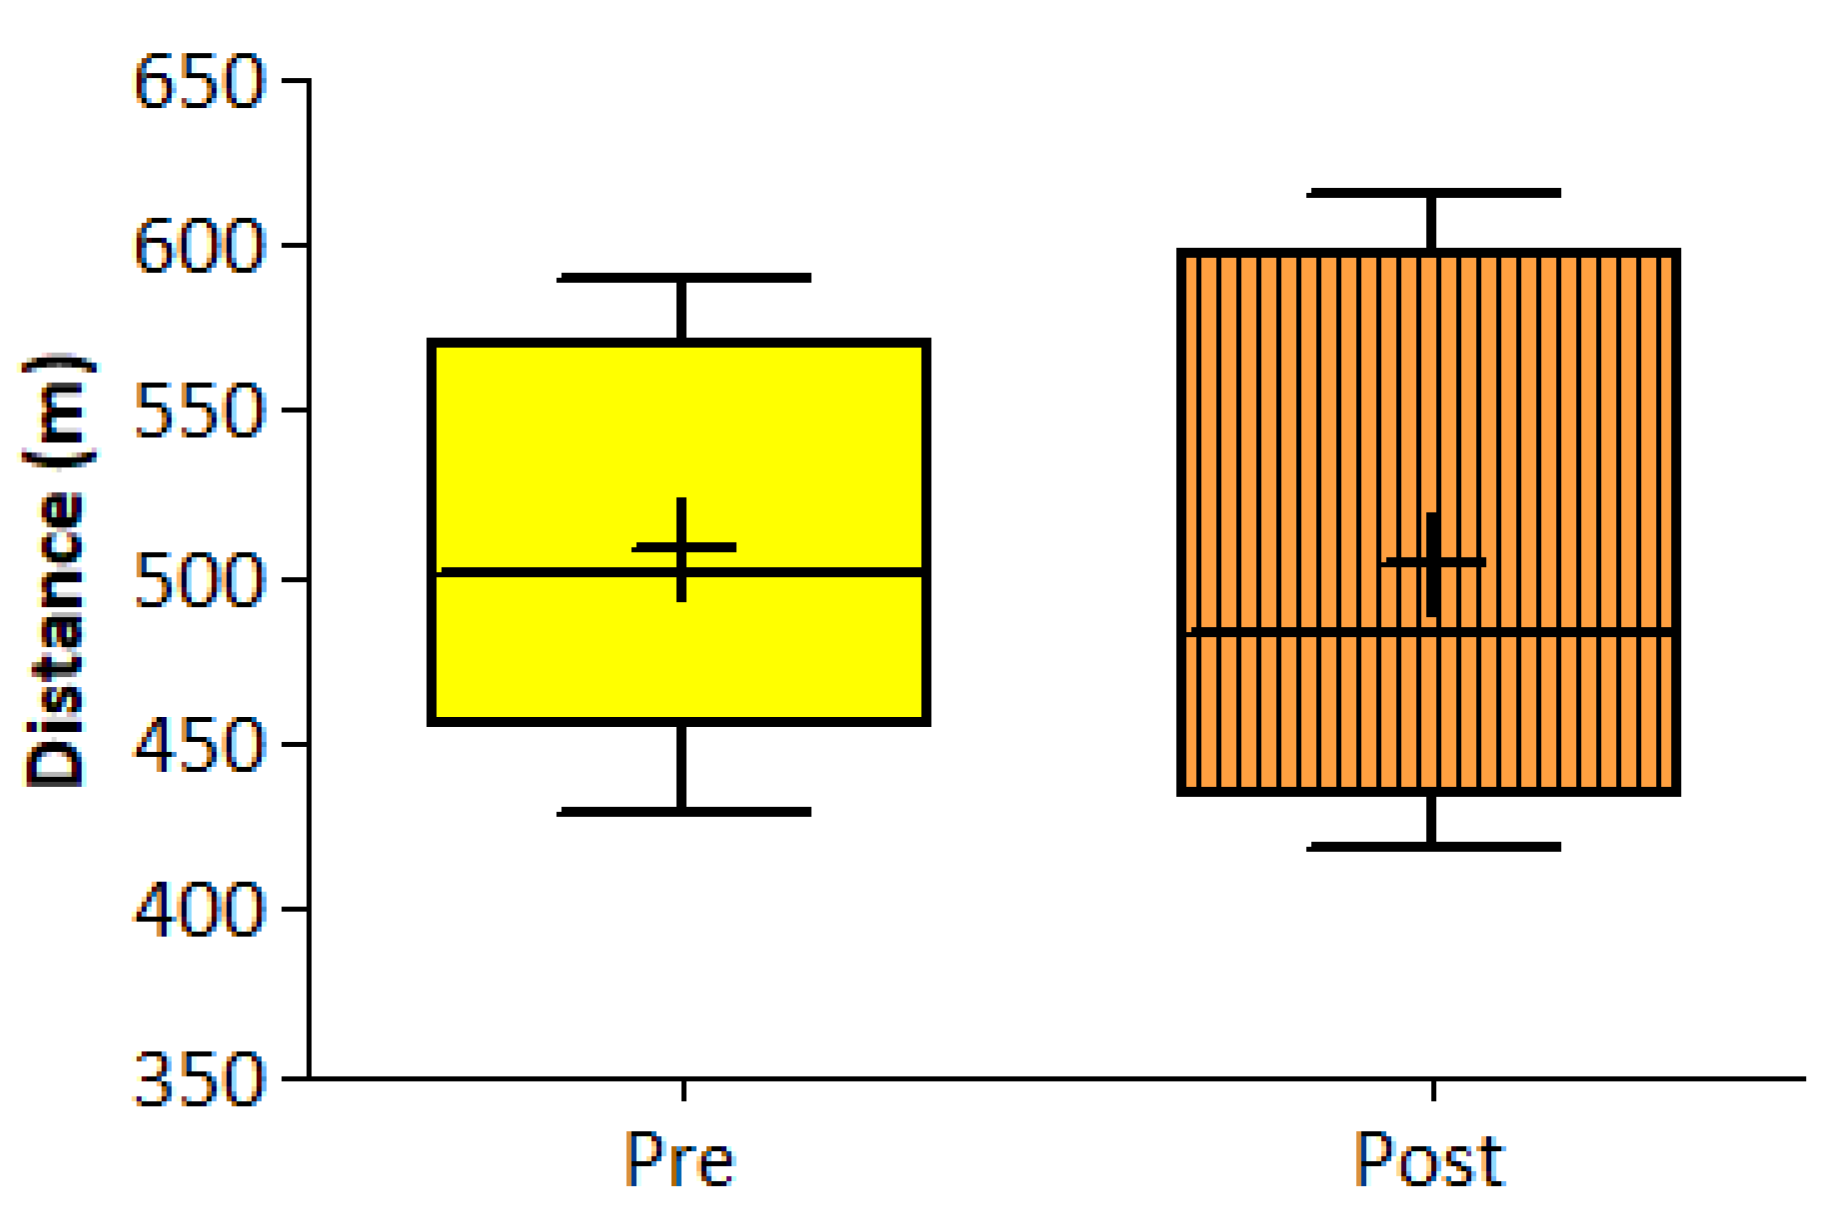
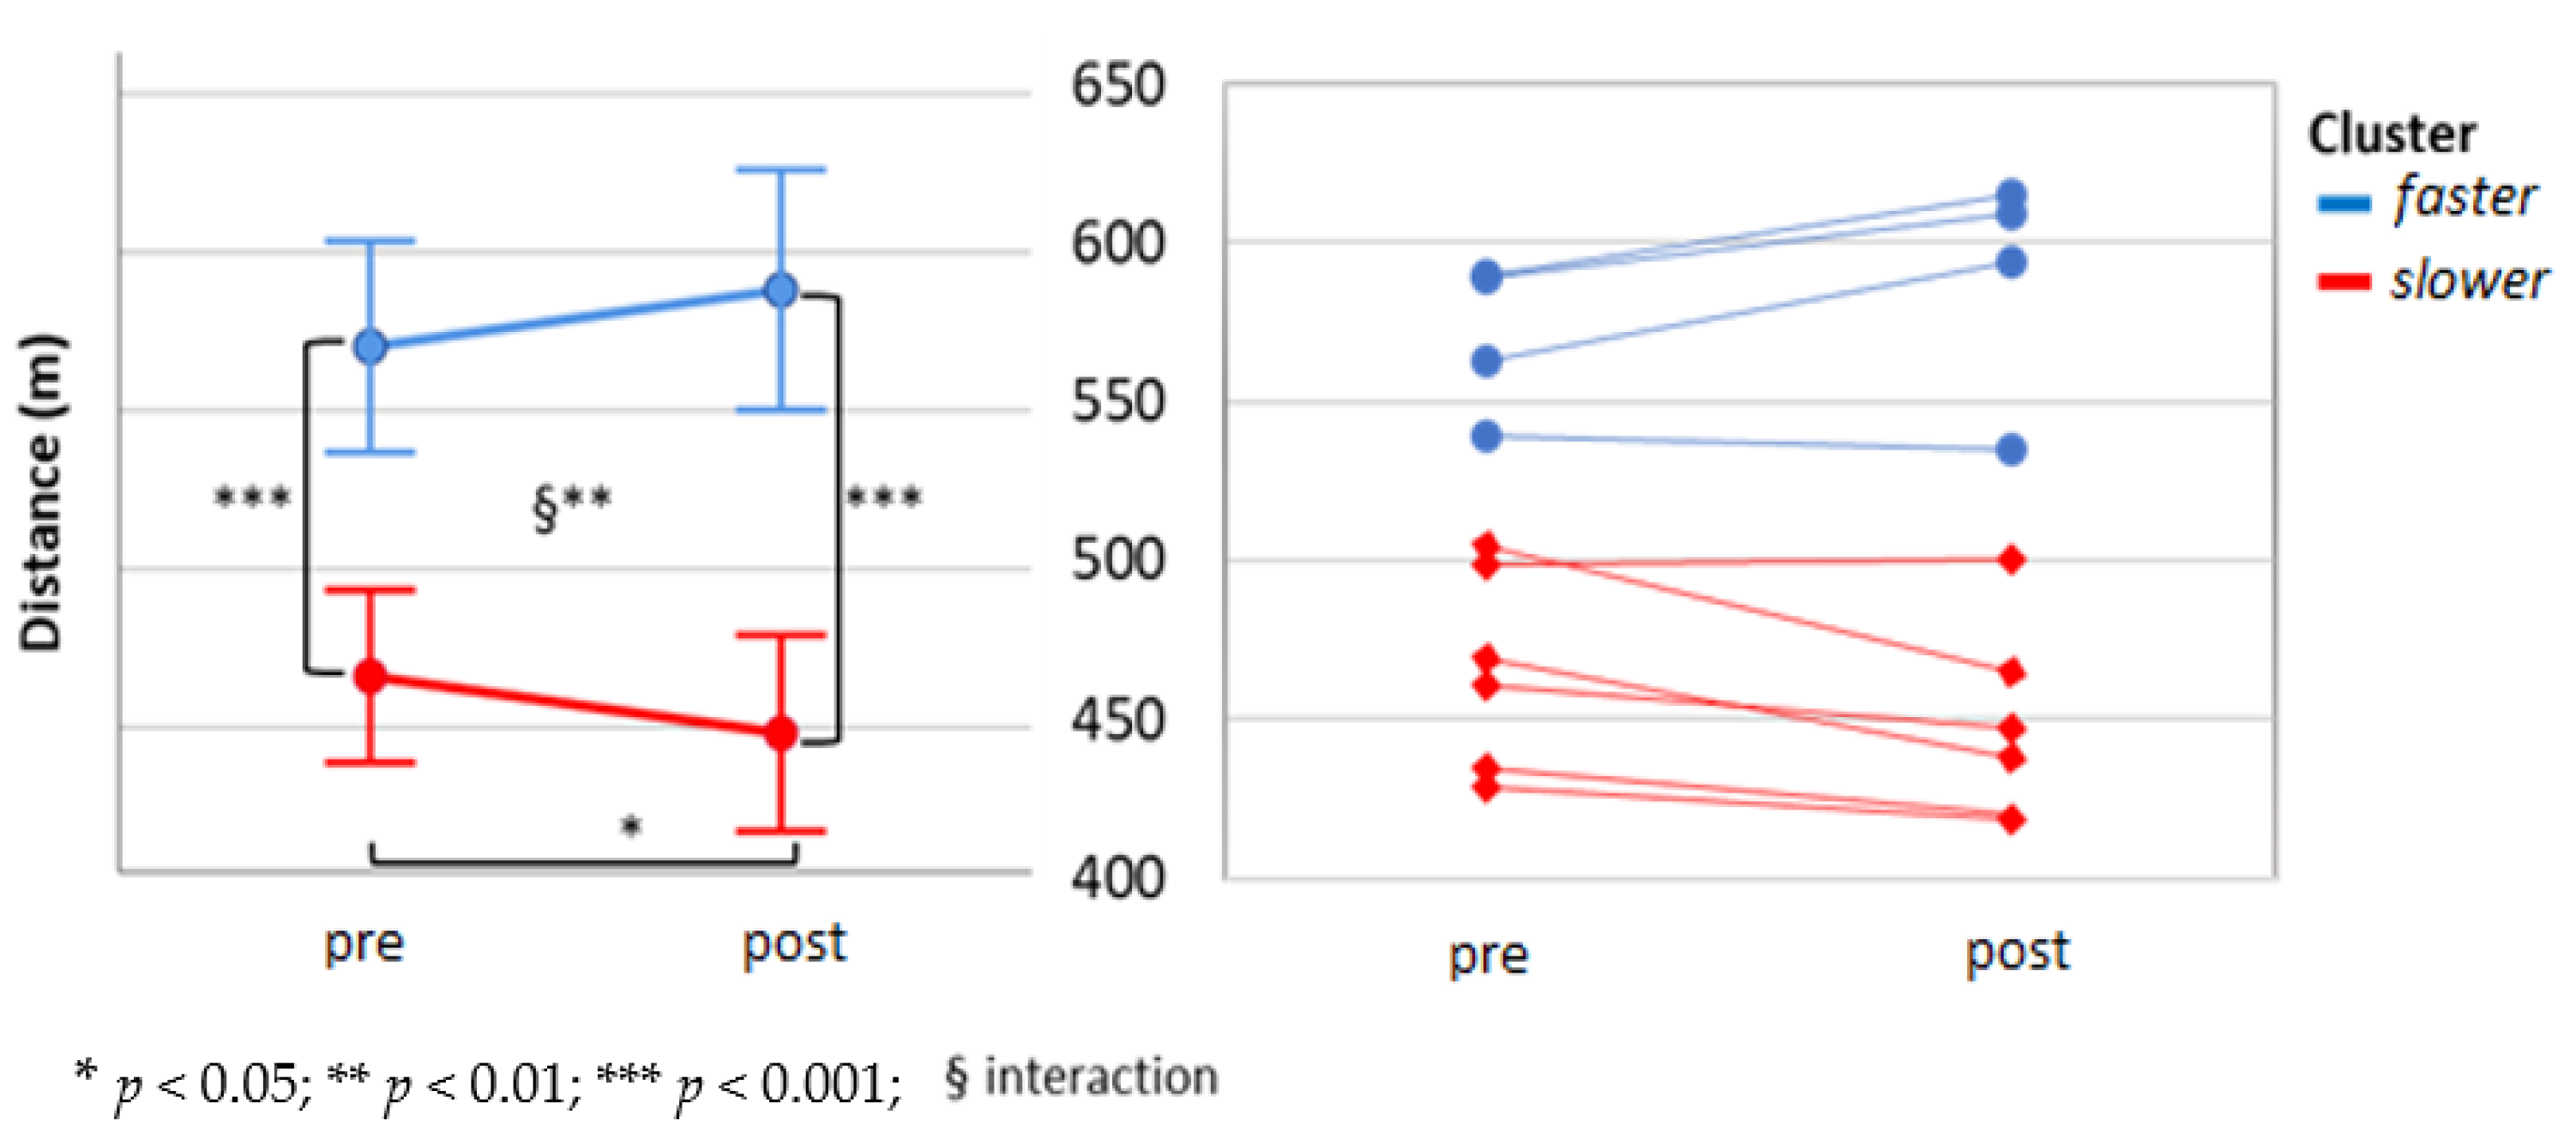
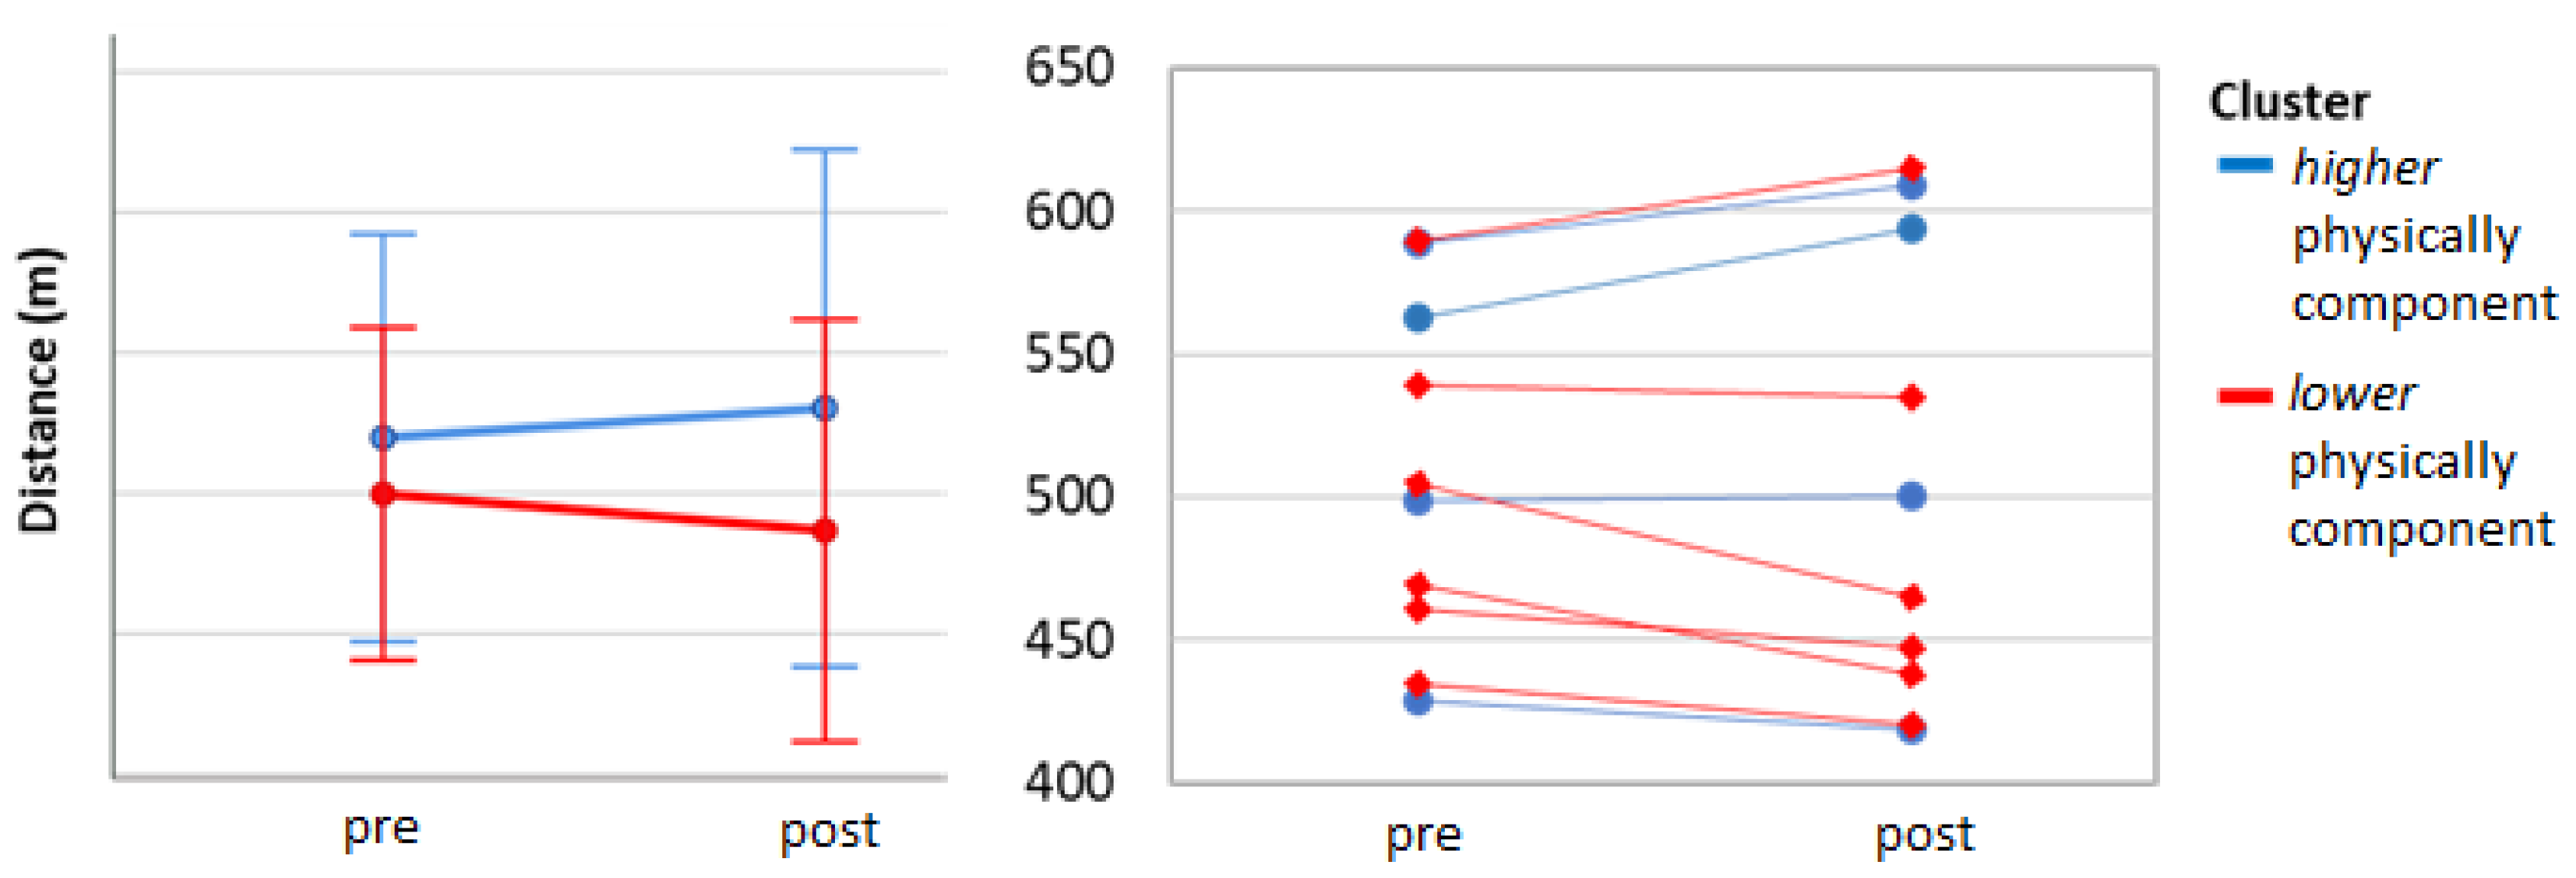
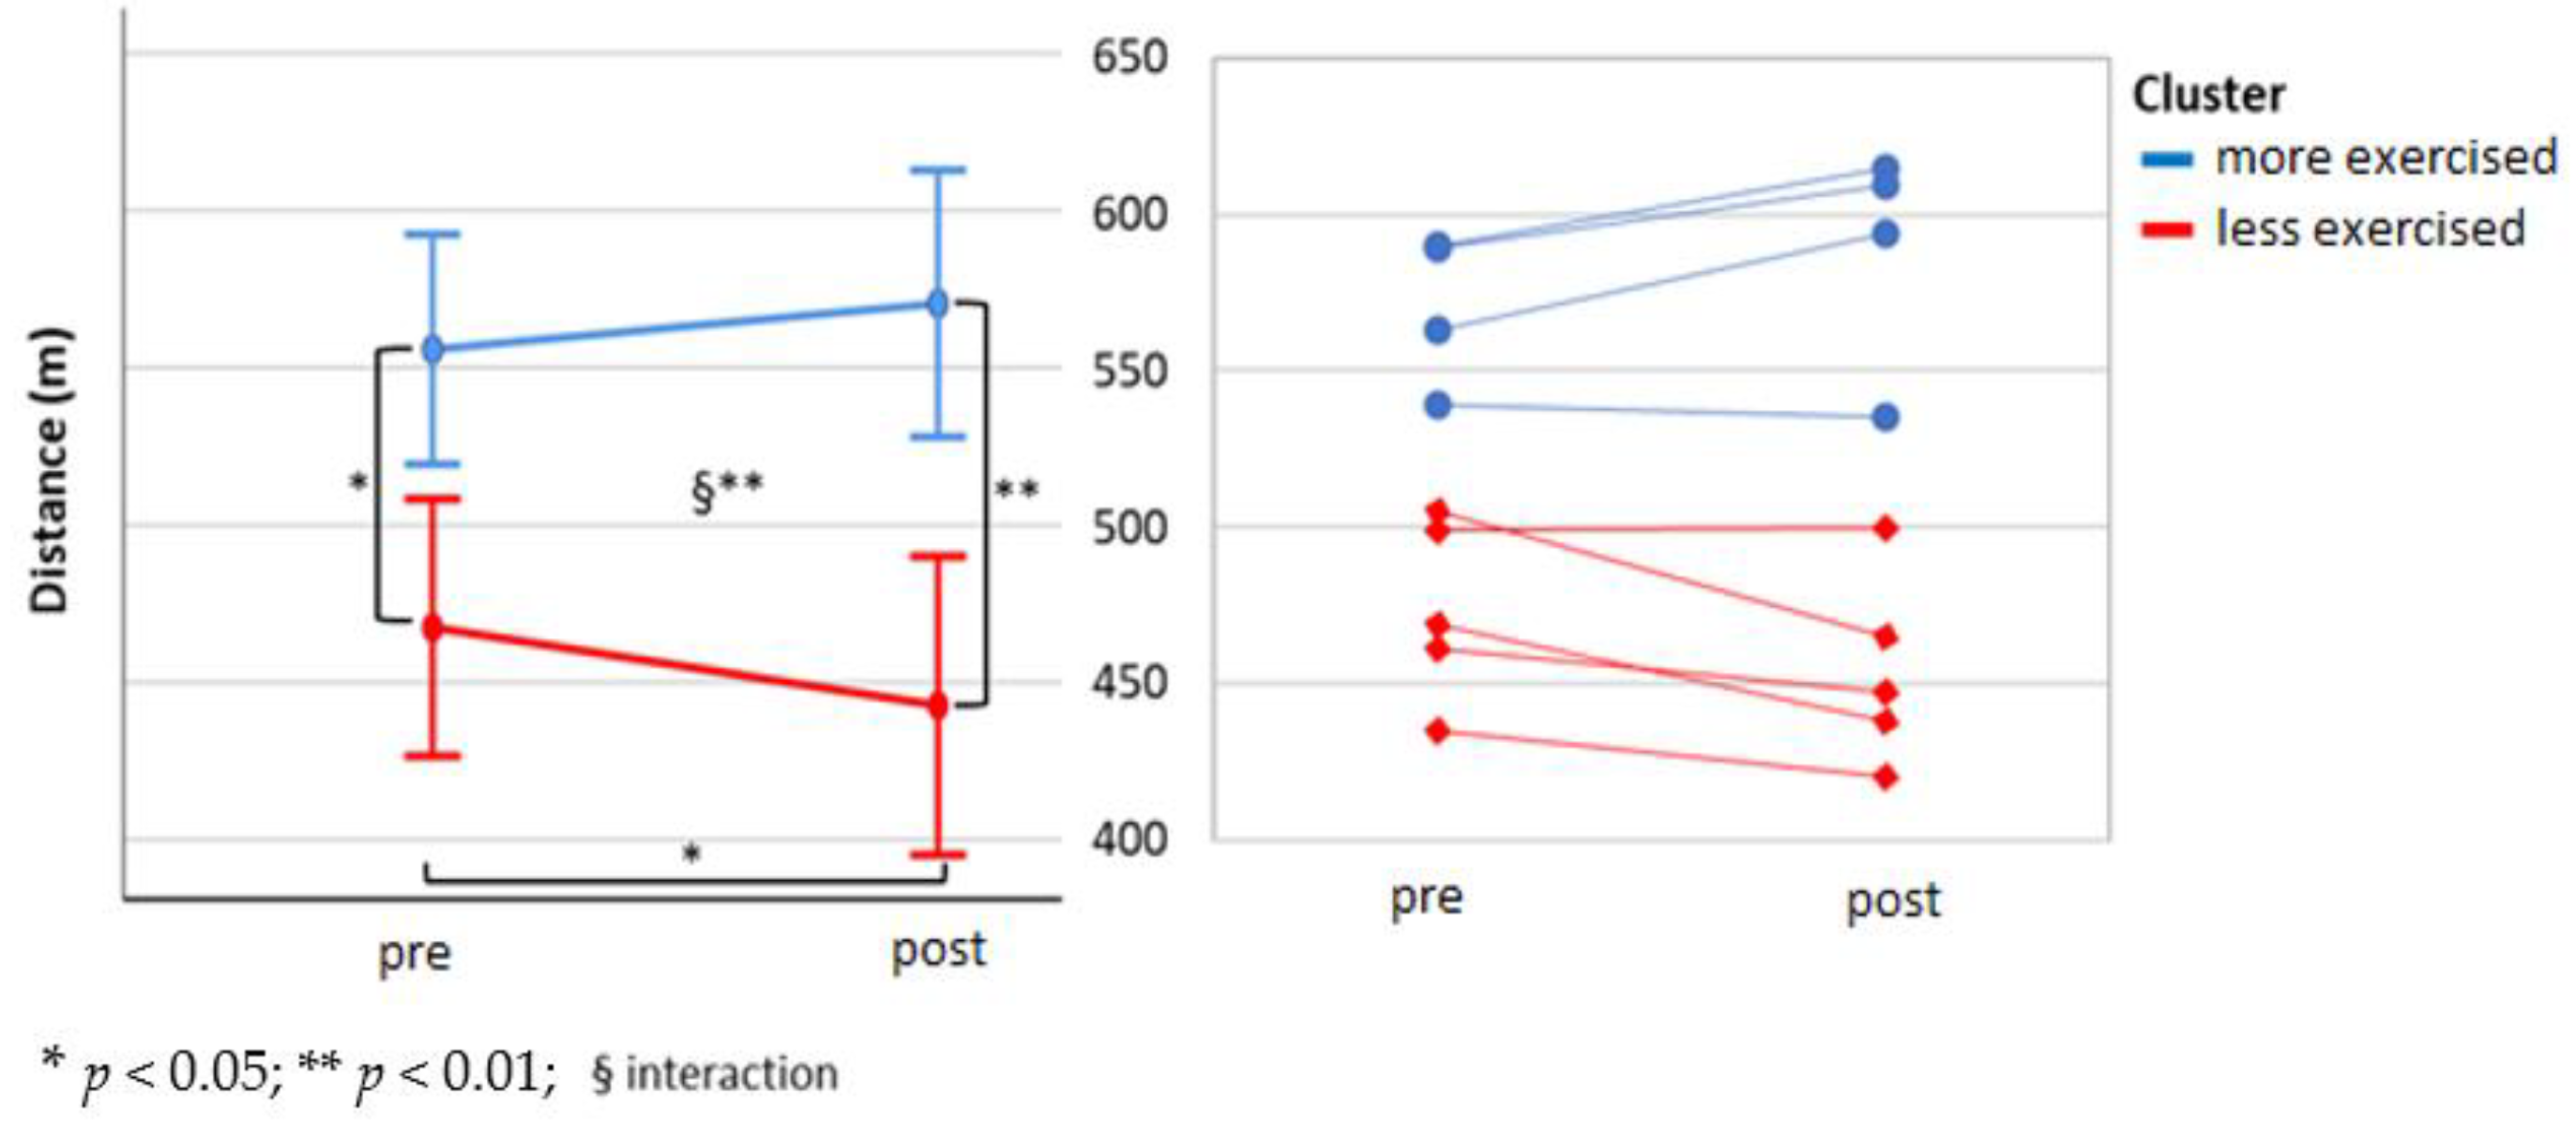
3.2. Profiling
3.3. Qualitative PACE App Usability
4. Discussion
4.1. Adherence
4.2. Profiling
4.3. General Consideration
4.4. Limitations
5. Conclusions
Author Contributions
Funding
Acknowledgments
Conflicts of Interest
References
- World Health Organization. Physical Activity: Global Recommendations on Physical Activity for Health Consequences of Physical Inactivity; WHO: København, Denmark, 2010. [Google Scholar]
- Piercy, K.L.; Troiano, R.; Ballard, R.M.; Carlson, S.A.; Fulton, J.E.; Galuska, D.A.; George, S.M.; Olson, R.D. The Physical Activity Guidelines for Americans. JAMA 2018, 320, 2020–2028. [Google Scholar] [CrossRef] [PubMed]
- Franco, M.R.; Tong, A.; Howard, K.; Sherrington, C.; Ferreira, P.; Pinto, R.Z.; Ferreira, M.L. Older people’s perspectives on participation in physical activity: A systematic review and thematic synthesis of qualitative literature. Br. J. Sports Med. 2015, 49, 1268–1276. [Google Scholar] [CrossRef] [PubMed]
- Carpenter, R.; Gilleland, D.; Information, P.E.K.F.C. Impact of an exercise program on adherence and fitness indicators. Appl. Nurs. Res. 2016, 30, 184–186. [Google Scholar] [CrossRef] [PubMed]
- Meseguer, C.M.; Galán, I.; Herruzo, R.; Zorrill, B.; Rodríguez-Artalejo, F. Leisure-Time Physical Activity in a Southern European Mediterranean Country: Adherence to Recommendations and Determining Factors. Rev. Española Cardiol. 2009, 62, 1125–1133. [Google Scholar] [CrossRef]
- Findorff, M.J.; Wyman, J.F.; Gross, C.R. Predictors of Long-term Exercise Adherence in a Community-Based Sample of Older Women. J. Women’s Heal. 2009, 18, 1769–1776. [Google Scholar] [CrossRef]
- Schutzer, K.A.; Graves, B.S. Barriers and motivations to exercise in older adults. Prev. Med. 2004, 39, 1056–1061. [Google Scholar] [CrossRef]
- Room, J.; Hannink, E.; Dawes, H.; Barker, K. What interventions are used to improve exercise adherence in older people and what behavioural techniques are they based on? A systematic review. BMJ Open 2017, 7, e019221. [Google Scholar] [CrossRef]
- Forkan, R.; Pumper, B.; Smyth, N.; Wirkkala, H.; Ciol, M.A.; Shumway-Cook, A. Exercise Adherence Following Physical Therapy Intervention in Older Adults With Impaired Balance. Phys. Ther. 2006, 86, 401–410. [Google Scholar] [CrossRef]
- Picorelli, A.M.A.; Pereira, L.S.M.; Pereira, D.S.; Felício, D.; Sherrington, C. Adherence to exercise programs for older people is influenced by program characteristics and personal factors: A systematic review. J. Physiother. 2014, 60, 151–156. [Google Scholar] [CrossRef]
- Loew, L.; Brosseau, L.; Kenny, G.P.; Durand-Bush, N.; Poitras, S.; De Angelis, G.; Wells, G.A. Factors influencing adherence among older people with osteoarthritis. Clin. Rheumatol. 2015, 35, 2283–2291. [Google Scholar] [CrossRef]
- Yu, D.S.; Lee, D.T.; Man, N.W. Fatigue among older people: A review of the research literature. Int. J. Nurs. Stud. 2010, 47, 216–228. [Google Scholar] [CrossRef] [PubMed]
- McPhee, J.S.; French, D.P.; Jackson, D.; Nazroo, J.; Pendleton, N.; Degens, H. Physical activity in older age: Perspectives for healthy ageing and frailty. Biogerontology 2016, 17, 567–580. [Google Scholar] [CrossRef]
- Paul, L.; Brewster, S.; Wyke, S.; McFadyen, A.; Sattar, N.; Gill, J.M.; Dybus, A.; Gray, C.M. Increasing physical activity in older adults using STARFISH, an interactive smartphone application (app); a pilot study. J. Rehabil. Assist. Technol. Eng. 2017, 4. [Google Scholar] [CrossRef] [PubMed]
- Albergoni, A.; Hettinga, F.; La Torre, A.; Bonato, M.; Sartor, F. The Role of Technology in Adherence to Physical Activity Programs in Patients with Chronic Diseases Experiencing Fatigue: A Systematic Review. Sports Med.Open 2019, 5, 41. [Google Scholar] [CrossRef]
- Valenzuela, T.; Okubo, Y.; Woodbury, A.; Lord, S.R.; Delbaere, K. Adherence to Technology-Based Exercise Programs in Older Adults. J. Geriatr. Phys. Ther. 2018, 41, 49–61. [Google Scholar] [CrossRef] [PubMed]
- Stut, W.J.J.; Heesemans, M.; Sartor, F.; Gorzelniak, L.S.; Stet, W. Display Screen with Graphical User Interface. U.S. Patent Application No. 29/235,750, 19 June 2018. [Google Scholar]
- Hendrikx, J.; Ruijs, L.S.; Cox, L.G.E.; Lemmens, P.M.C.; Schuijers, E.G.; Goris, A.; Parak, J.; Grainger, R. Clinical Evaluation of the Measurement Performance of the Philips Health Watch: A Within-Person Comparative Study. JMIR Mhealth Uhealth 2017, 5, e10. [Google Scholar] [CrossRef] [PubMed]
- Sartor, F.; Papini, G.; Cox, L.G.E.; Cleland, J.G. Methodological Shortcomings of Wrist-Worn Heart Rate Monitors Validations. J. Med. Internet Res. 2018, 20, e10108. [Google Scholar] [CrossRef]
- Tedesco, S.; Sica, M.; Ancillao, A.; Timmons, S.; Barton, J.; O’Flynn, B. Accuracy of consumer-level and research-grade activity trackers in ambulatory settings in older adults. PLoS ONE 2019, 14, e0216891. [Google Scholar] [CrossRef]
- Abonie, U.S.; Hoekstra, F.; Seves, B.L.; Van Der Woude, L.H.; Dekker, R.; Hettinga, F. Associations between Activity Pacing, Fatigue, and Physical Activity in Adults with Multiple Sclerosis: A Cross Sectional Study. J. Funct. Morphol. Kinesiol. 2020, 5, 43. [Google Scholar] [CrossRef]
- Eldadah, B.A. Fatigue and Fatigability in Older Adults. PM R 2010, 2, 406–413. [Google Scholar] [CrossRef]
- Bláfoss, R.; Micheletti, J.K.; Sundstrup, E.; Jakobsen, M.D.; Bay, H.; Andersen, L.L. Is fatigue after work a barrier for leisure-time physical activity? Cross-sectional study among 10,000 adults from the general working population. Scand. J. Public Heal. 2018, 47, 383–391. [Google Scholar] [CrossRef]
- Abbiss, C.R.; Laursen, P.B. Describing and understanding pacing strategies during athletic competition. Sport. Med. Adis Int. Ltd. 2008, 38, 239–252. [Google Scholar] [CrossRef] [PubMed]
- Abonie, U.S.; Edwards, A.M.; Hettinga, F. Optimising activity pacing to promote a physically active lifestyle in medical settings: A narrative review informed by clinical and sports pacing research. J. Sports Sci. 2020, 38, 590–596. [Google Scholar] [CrossRef] [PubMed]
- Nielson, W.R.; Jensen, M.P.; Karsdorp, P.A.; Vlaeyen, J.W. Activity Pacing in Chronic Pain. Clin. J. Pain 2013, 29, 461–468. [Google Scholar] [CrossRef] [PubMed]
- Murphy, S.L.; Kratz, A.L. Activity pacing in daily life: A within-day analysis. Pain 2014, 155, 2630–2637. [Google Scholar] [CrossRef] [PubMed]
- Antcliff, D.; Keeley, P.; Campbell, M.; Woby, S.; Keenan, A.; McGowan, L. Activity pacing: Moving beyond taking breaks and slowing down. Qual. Life Res. 2018, 27, 1933–1935. [Google Scholar] [CrossRef] [PubMed]
- White, P.D.; Goldsmith, K.; Johnson, A.L.; Potts, L.; Walwyn, R.; DeCesare, J.C.; Baber, H.L.; Burgess, M.; Clark, L.V.; Cox, D.L.; et al. Comparison of adaptive pacing therapy, cognitive behaviour therapy, graded exercise therapy, and specialist medical care for chronic fatigue syndrome (PACE): A randomised trial. Lancet 2011, 377, 823–836. [Google Scholar] [CrossRef]
- Bandura, A. Guide for Constructing Self-Efficacy Scales. Self Effic. Beliefs Adolesc. 2006, 5, 307–337. [Google Scholar]
- Izawa, K.P.; Watanabe, S.; Oka, K.; Hiraki, K.; Morio, Y.; Kasahara, Y.; Osada, N.; Omiya, K.; Iijima, S. Age-Related Differences in Physiologic and Psychosocial Outcomes After Cardiac Rehabilitation. Am. J. Phys. Med. Rehabil. 2010, 89, 24–33. [Google Scholar] [CrossRef]
- Thompson, P.D.; Arena, R.; Riebe, D.; Pescatello, L.S. ACSM’s New Preparticipation Health Screening Recommendations from ACSM’s Guidelines for Exercise Testing and Prescription, Ninth Edition. Curr. Sports Med. Rep. 2013, 12, 215–217. [Google Scholar] [CrossRef]
- Whitfield, G.P.; Gabriel, K.K.P.; Rahbar, M.H.; Kohl, H.W. Application of the American Heart Association/American College of Sports Medicine Adult Preparticipation Screening Checklist to a Nationally Representative Sample of US Adults Aged ≥40 Years from the National Health and Nutrition Examination Survey 2001–2004; Lippincott Williams and Wilkins: Philadelphia, PA, USA, 2014; pp. 1113–1120. [Google Scholar]
- Shephard, R.J. PAR-Q, Canadian Home Fitness Test and Exercise Screening Alternatives. Sports Med. 1988, 5, 185–195. [Google Scholar] [CrossRef] [PubMed]
- Ware, J.E.; Kosinski, M.; Keller, S.D. A 12-Item Short-Form Health Survey. Med. Care 1996, 34, 220–233. [Google Scholar] [CrossRef] [PubMed]
- Mols, F.; Pelle, A.J.; Kupper, N. Normative data of the SF-12 health survey with validation using postmyocardial infarction patients in the Dutch population. Qual. Life Res. 2009, 18, 403–414. [Google Scholar] [CrossRef] [PubMed]
- Busija, L.; Pausenberger, E.; Haines, T.P.; Haymes, S.; Buchbinder, R.; Osborne, R.H. Adult measures of general health and health-related quality of life: Medical Outcomes Study Short Form 36-Item (SF-36) and Short Form 12-Item (SF-12) Health Surveys, Nottingham Health Profile (NHP), Sickness Impact Profile (SIP), Medical Outcomes Study Sh. Arthritis Rheum. 2011, 63, S383–S412. [Google Scholar] [CrossRef]
- Resnick, B.; Nahm, E.S. Reliability and validity testing of the revised 12-item Short-Form Health Survey in older adults. J. Nurs. Meas. 2001, 9, 151–161. [Google Scholar] [CrossRef]
- Krupp, L.B.; LaRocca, N.G.; Muir-Nash, J.; Steinberg, A.D. The Fatigue Severity Scale. Arch. Neurol. 1989, 46, 1121–1123. [Google Scholar] [CrossRef]
- Rietberg, M.B.; Van Wegen, E.E.H.; Kwakkel, G. Measuring fatigue in patients with multiple sclerosis: Reproducibility, responsiveness and concurrent validity of three Dutch self-report questionnaires. Disabil. Rehabil. 2010, 32, 1870–1876. [Google Scholar] [CrossRef]
- Hewlett, S.; Dures, E.; Almeida, C. Measures of fatigue: Bristol Rheumatoid Arthritis Fatigue Multi-Dimensional Questionnaire (BRAF MDQ), Bristol Rheumatoid Arthritis Fatigue Numerical Rating Scales (BRAF NRS) for Severity, Effect, and Coping, Chalder Fatigue Questionnaire (CFQ), Checklist. Arthritis Rheum. 2011, 63, S263–S286. [Google Scholar] [CrossRef]
- Schnelle, J.F.; Buchowski, M.S.; Ikizler, T.A.; Durkin, D.W.; Beuscher, L.; Simmons, S.F.; Ikizler, T.A. Evaluation of two fatigability severity measures in elderly adults. J. Am. Geriatr. Soc. 2012, 60, 1527–1533. [Google Scholar] [CrossRef]
- Alingh, R.; Hoekstra, F.; Van Der Schans, C.P.; Hettinga, F.; Dekker, R.; Van Der Woude, L.H.V. Protocol of a longitudinal cohort study on physical activity behaviour in physically disabled patients participating in a rehabilitation counselling programme: ReSpAct. BMJ Open 2015, 5. [Google Scholar] [CrossRef]
- Van Der Heijden, M.M.P.; Pouwer, F.; Pop, V.J. Psychometric Properties of the Exercise Self-efficacy Scale in Dutch Primary Care Patients with Type 2 Diabetes Mellitus. Int. J. Behav. Med. 2013, 21, 394–401. [Google Scholar] [CrossRef] [PubMed]
- Langan, M.E.; Marotta, S.A. Physical Activity and Perceived Self-Efficacy in Older Adults. Adultspan J. 2000, 2, 29–43. [Google Scholar] [CrossRef]
- Wendel-Vos, G. Reproducibility and relative validity of the short questionnaire to assess health-enhancing physical activity. J. Clin. Epidemiol. 2003, 56, 1163–1169. [Google Scholar] [CrossRef]
- Van Poppel, M.; Althuizen, E.; Van Mechelen, W. Construct validity and responsiveness of the SQUASH for measuring physical activity in pregnancy. J. Sci. Med. Sport 2010, 12, e131. [Google Scholar] [CrossRef]
- Arends, S.; Hofman, M.; Kamsma, Y.P.; Van Der Veer, E.; Houtman, P.M.; Kallenberg, C.G.; Spoorenberg, A.; Brouwer, E. Daily physical activity in ankylosing spondylitis: Validity and reliability of the IPAQ and SQUASH and the relation with clinical assessments. Arthritis Res. Ther. 2013, 15, R99. [Google Scholar] [CrossRef]
- Kervio, G.; Carré, F.; Ville, N.S. Reliability and Intensity of the Six-Minute Walk Test in Healthy Elderly Subjects. Med. Sci. Sports Exerc. 2003, 35, 169–174. [Google Scholar] [CrossRef]
- Enright, P.L. The Six-Minute Walk Test. Respir. Care 2003, 48, 783–785. [Google Scholar]
- Bautmans, I.; Lambert, M.; Mets, T. The six-minute walk test in community dwelling elderly: Influence of health status. BMC Geriatr. 2004, 4, 6. [Google Scholar] [CrossRef]
- Mylius, C.F.; Paap, D.; Takken, T. Reference value for the 6-minute walk test in children and adolescents: A systematic review. Expert Rev. Respir. Med. 2016, 10, 1335–1352. [Google Scholar] [CrossRef]
- Sartor, F.; Vernillo, G.; De Morree, H.M.; Bonomi, A.G.; La Torre, A.; Kubis, H.-P.; Veicsteinas, A. Estimation of Maximal Oxygen Uptake via Submaximal Exercise Testing in Sports, Clinical, and Home Settings. Sports Med. 2013, 43, 865–873. [Google Scholar] [CrossRef]
- Tanaka, H.; Monahan, K.D.; Seals, D.R. Age-predicted maximal heart rate revisited. J. Am. Coll. Cardiol. 2001, 37, 153–156. [Google Scholar] [CrossRef]
- Kursa, M.; Rudnicki, W.R. Feature Selection with the Boruta Package. J. Stat. Softw. 2010, 36, 1–13. [Google Scholar] [CrossRef]
- Tucker, P.; Gilliland, J. The effect of season and weather on physical activity: A systematic review. Public Heal. 2007, 121, 909–922. [Google Scholar] [CrossRef] [PubMed]
- Marcus, B.; Selby, V.C.; Niaura, R.; Rossi, J.S. Self-Efficacy and the Stages of Exercise Behavior Change. Res. Q. Exerc. Sport 1992, 63, 60–66. [Google Scholar] [CrossRef]
- Ogliari, G.; Mahinrad, S.; Stott, D.J.; Jukema, J.W.; Mooijaart, S.P.; Macfarlane, P.W.; Clark, E.N.; Kearney, P.M.; Westendorp, R.G.; De Craen, A.J.M.; et al. Resting heart rate, heart rate variability and functional decline in old age. Can. Med. Assoc. J. 2015, 187, E442–E449. [Google Scholar] [CrossRef]
- De Rooij, M.; Van Der Leeden, M.; Cheung, J.; Van Der Esch, M.; Häkkinen, A.; Haverkamp, D.; Roorda, L.D.; Twisk, J.; Vollebregt, J.; Lems, W.F.; et al. Efficacy of Tailored Exercise Therapy on Physical Functioning in Patients with Knee Osteoarthritis and Comorbidity: A Randomized Controlled Trial. Arthritis Rheum. 2017, 69, 807–816. [Google Scholar] [CrossRef]
- Kappen, D.; Mirza-Babaei, P.; Nacke, L. Gamification of Older Adults’ Physical Activity: An Eight-Week Study. In Proceedings of the 51st Hawaii International Conference on System Sciences, Waikoloa Village, HI, USA, 2–6 January 2018. [Google Scholar]


| Variable | Mean ± Standard Deviation | ||
|---|---|---|---|
| All | Faster (N = 4) | Slower (N = 6) | |
| Age (yr.) | 73.8 ± 2.3 | 74.3 ± 2.1 | 73.5 ± 2.6 |
| Sex (male/female) | 6/4 | 3/1 | 3/3 |
| Height (m) | 1.70 ± 0.11 | 1.68 ± 0.03 | 1.72 ± 0.14 |
| Body mass (kg) | 81.6 ± 13.8 | 78.4 ± 7.4 | 83.7 ± 17.3 |
| BMI (kg/m2) | 28.0 ± 2.0 | 27.8 ± 2.6 | 28.1 ± 1.8 |
| Resting heart rate (bpm) | 73 ± 13 | 65 ± 5 | 78 ± 15 |
| Estimated absolute CRF (mL/min) | 2086 ± 353 | 2144 ± 213 | 2047 ± 438 |
| Estimated relative CRF (mL/kg/min) | 25.7 ± 2.8 | 27.5 ± 2.9 | 24.5 ± 2.3 |
| Blood pressure lowering medications (n/tot) | 5/10 | 0/4 | 5/6 |
| Cholesterol lowering medications (n/tot) | 3/10 | 1/4 | 2/6 |
| Smokers | 2/10 | 1/4 | 1/6 |
| Variables | Baseline Visit | Pre-Intervention Visit | Post-Intervention Visit | Pre vs. Post T-Test (df) | Mean Difference (95% CI) | p-Value | ANOVA F (dft; dfe) | p-Value |
|---|---|---|---|---|---|---|---|---|
| Body Mass (kg) | 81.6 ± 13.8 | 81.4 ± 13.8 | 0.83 (9) | 0.20 (−0.34, 0.74) | 0.46 | |||
| BMI (kg/m2) | 28.0 ± 2.0 | 27.9 ± 2.1 | 0.81 (9) | 0.06 (−0.11, −0.24) | 0.44 | |||
| Resting heart rate (bpm) | 73 ± 13 | 73 ± 11 | ᵂ | ᵂ | 0.88 | |||
| 6-MWT a (m) | 508 ± 60 | 504 ± 79 | 0.49 (9) | 3.62 (−13.0, 20.2) | 0.63 | |||
| Estimated CRF b (mL/kg/min) | 25.7 ± 2.8 | 25.1 ± 3.0 | 1.28 (9) | 0.61 (−0.47, 1.69) | 0.23 | |||
| APQ c | ||||||||
| Engagement in pacing | 2.68 ± 0.92 | 2.86 ± 0.73 | 2.98 ± 0.75 | ∯ | 0.36 | |||
| Perceived risk of over-activity | 2.45 ± 0.98 | 3.00 ± 0.82 | 2.90 ± 0.84 | 2.28 (2; 18) | 0.13 | |||
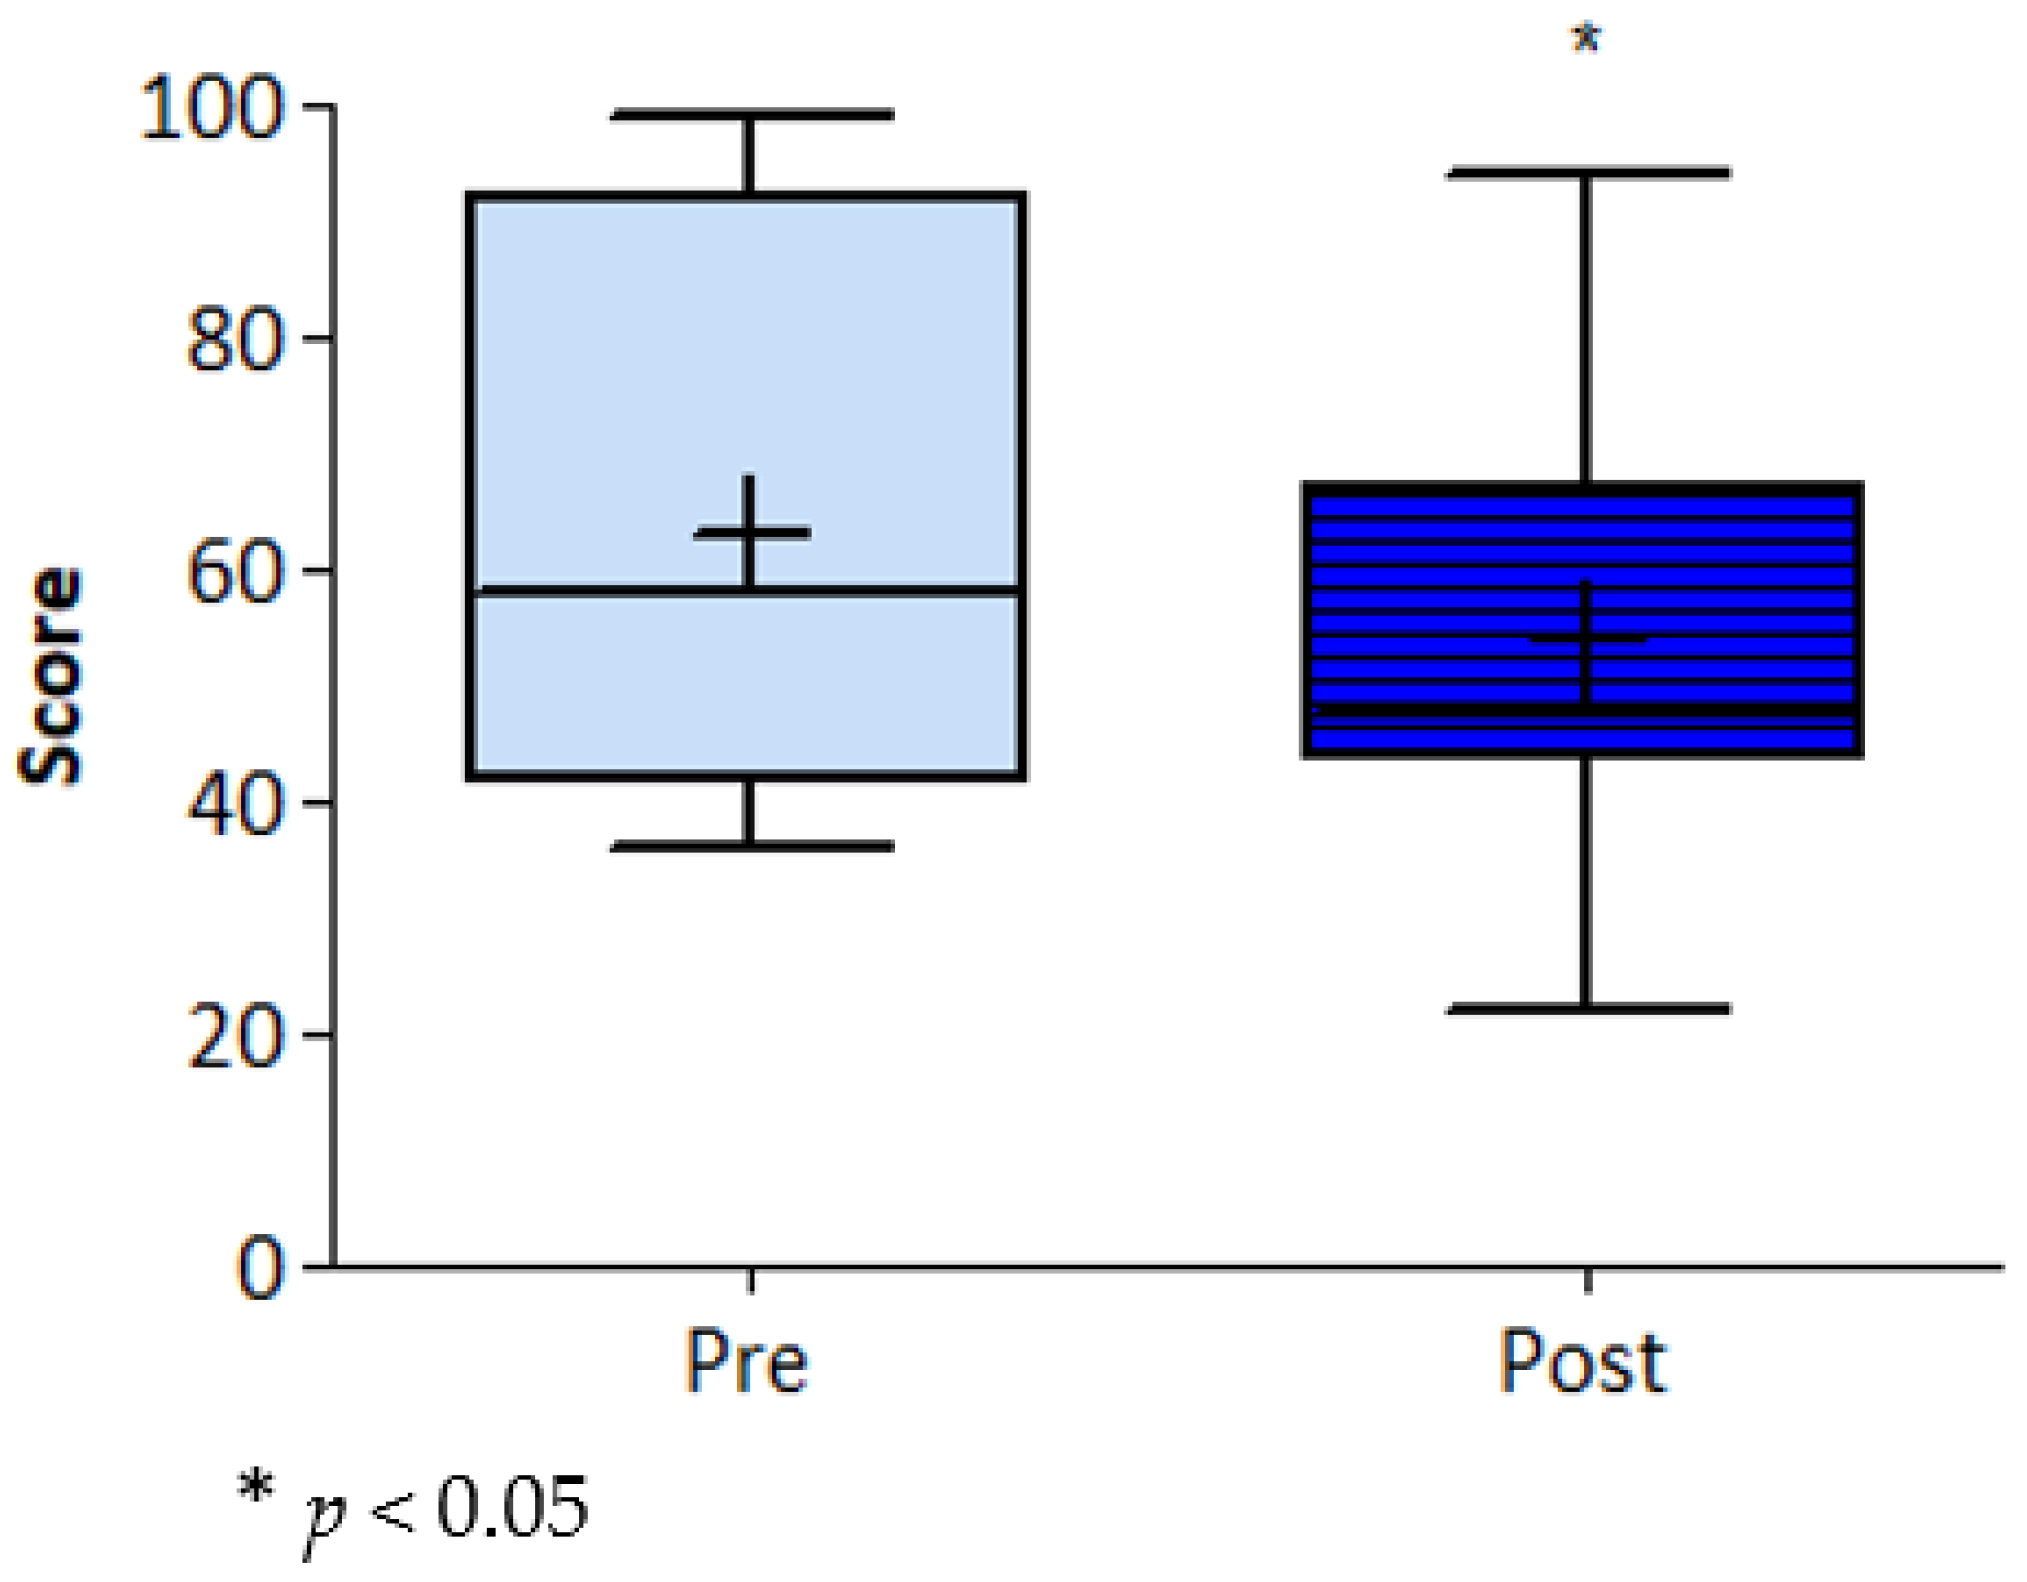
| ESE d | 62.7 ± 23.6 | 53.7 ± 20.6 | 2.72 (9) | 9.01, (1.52, 16.50) | 0.024 * | |||
| FSS f | 2.50 ± 0.77 | 2.76 ± 1.02 | 1.20 (9) | −0.26 (−0.74, 0.23) | 0.26 | |||
| SF-12 g PCS-12 h | 53.5 ± 3.2 | 53.6 ± 4.5 | ᵂ | ᵂ | 0.95 | |||
| MCS-12 i (9/10 θ) | 58.4 ± 2.1 | 56.0 ± 3.4 | 2.26 (8) | 2.38 (−0.05, 4.80) | 0.05 | |||
| SQUASH j | ||||||||
| Walking minutes | 153 ± 180 | 126 ± 134 | 199 ± 324 | ∯ | 0.81 | |||
| Cycling | 136 ± 56 | 147 ± 163 | 101 ± 128 | 2.20 (2;18) | 0.14 | |||
| Other sports | 120 ± 108 | 97 ± 65 | 90 ± 92 | 1.19 (2;18) | 0.28 |
| Adherence | Baseline Week | 1st Intervention Week | 2nd Intervention Week | ANOVA F (dft; dfe) | p-Value |
|---|---|---|---|---|---|
| Walking program adherence (%) | 32 ± 39 | 48 ± 38 | 54 ± 38 | 0.38 | |
| No. participants reaching the walking target | 1/10 | 2/10 | 2/10 | ||
| Walking volume adherence (%) | 66 ± 58 | 108 ± 63 | 104 ± 60 | 3.5 (2; 18) | 0.05 * |
| No. participants reaching the target walking volume | 3/10 | 4/10 | 4/10 | ||
| Exercise program adherence (%) | 96 ± 82 | 115 ± 99 | 111 ± 78 | 0.44 (2;16) | 0.65 |
| No. participants reaching the exercise target | 5/9 | 5/9 | 6/9 | ||
| Exercise volume adherence (%) | 263 ± 232 | 252 ± 181 | 260 ± 216 | 0.29 (2; 16) | 0.97 |
| No. participants reaching the target exercise volume | 7/9 | 6/9 | 6/9 |
© 2020 by the authors. Licensee MDPI, Basel, Switzerland. This article is an open access article distributed under the terms and conditions of the Creative Commons Attribution (CC BY) license (http://creativecommons.org/licenses/by/4.0/).
Share and Cite
Albergoni, A.; Hettinga, F.J.; Stut, W.; Sartor, F. Factors Influencing Walking and Exercise Adherence in Healthy Older Adults Using Monitoring and Interfacing Technology: Preliminary Evidence. Int. J. Environ. Res. Public Health 2020, 17, 6142. https://doi.org/10.3390/ijerph17176142
Albergoni A, Hettinga FJ, Stut W, Sartor F. Factors Influencing Walking and Exercise Adherence in Healthy Older Adults Using Monitoring and Interfacing Technology: Preliminary Evidence. International Journal of Environmental Research and Public Health. 2020; 17(17):6142. https://doi.org/10.3390/ijerph17176142
Chicago/Turabian StyleAlbergoni, Andrea, Florentina J. Hettinga, Wim Stut, and Francesco Sartor. 2020. "Factors Influencing Walking and Exercise Adherence in Healthy Older Adults Using Monitoring and Interfacing Technology: Preliminary Evidence" International Journal of Environmental Research and Public Health 17, no. 17: 6142. https://doi.org/10.3390/ijerph17176142
APA StyleAlbergoni, A., Hettinga, F. J., Stut, W., & Sartor, F. (2020). Factors Influencing Walking and Exercise Adherence in Healthy Older Adults Using Monitoring and Interfacing Technology: Preliminary Evidence. International Journal of Environmental Research and Public Health, 17(17), 6142. https://doi.org/10.3390/ijerph17176142