Under-Five Mortality and Associated Factors: Evidence from the Nepal Demographic and Health Survey (2001–2016)

 ,
,  , , , and
Abstract
1. Introduction
2. Materials and Methods
2.1. Data Source
2.2. Study Outcomes
2.3. Covariates
2.4. Statistical Analysis
2.5. Ethical Considerations
3. Results
Factors Associated with Childhood Mortality
4. Discussion
Strengths and Limitations
5. Conclusions
Supplementary Materials
Author Contributions
Funding
Acknowledgments
Conflicts of Interest
References
- United Nations Inter-Agency Group for Child Mortality Estimation (UN IGME). Levels & Trends in Child Mortality: Report 2017, Estimates Developed by the UN Inter-Agency Group for Child Mortality Estimation; United Nations Children’s Fund: New York, NY, USA, 2017. [Google Scholar]
- Liu, L.; Oza, S.; Hogan, D.; Chu, Y.; Perin, J.; Zhu, J.; Lawn, J.E.; Cousens, S.; Mathers, C.; Black, R.E. Global, regional, and national causes of under-five mortality in 2000–2015: An updated systematic analysis with implications for the Sustainable Development Goals. Lancet 2016, 388, 3027–3035. [Google Scholar] [CrossRef]
- Kyu, H.H.; Mumford, J.E.; Stanaway, J.D.; Barber, R.M.; Hancock, J.R.; Vos, T.; Murray, C.J.; Naghavi, M. Mortality from tetanus between 1990 and 2015: Findings from the global burden of disease study 2015. BMC Public Health 2017, 17, 179. [Google Scholar] [CrossRef]
- Ministry of Health and Population (MOHP) [Nepal], New ERA, and ICF International Inc. Nepal Demographic and Health Survey 2016; Ministry of Health and Population, New ERA, and ICF International: Kathmandu, Nepal; Calverton, MD, USA, 2017.
- Nisar, Y.B.; Dibley, M.J.; Mebrahtu, S.; Paudyal, N.; Devkota, M. Antenatal Iron-Folic Acid Supplementation Reduces Neonatal and Under-five Mortality in Nepal. J. Nutr. 2015, 145, 1873–1883. [Google Scholar] [CrossRef] [PubMed]
- Khadka, K.B.; Lieberman, L.S.; Giedraitis, V.; Bhatta, L.; Pandey, G. The socio-economic determinants of infant mortality in Nepal: Analysis of Nepal Demographic Health Survey, 2011. BMC Pediatr. 2015, 15, 152. [Google Scholar] [CrossRef] [PubMed]
- Christian, P.; Stewart, C.P.; LeClerq, S.C.; Wu, L.; Katz, J.; West, K.P., Jr.; Khatry, S.K. Antenatal and postnatal iron supplementation and childhood mortality in rural Nepal: A prospective follow-up in a randomized, controlled community trial. Am. J. Epidemiol. 2009, 170, 1127–1136. [Google Scholar] [CrossRef] [PubMed]
- Katz, J.; West, K.P., Jr.; Khatry, S.K.; Christian, P.; LeClerq, S.C.; Pradhan, E.K.; Shrestha, S.R. Risk factors for early infant mortality in Sarlahi district, Nepal. Bull. World Health Organ. 2003, 81, 717–725. [Google Scholar]
- Lamichhane, R.; Zhao, Y.; Paudel, S.; Adewuyi, E.O. Factors associated with infant mortality in Nepal: A comparative analysis of Nepal demographic and health surveys (NDHS) 2006 and 2011. BMC Public Health 2017, 17, 53. [Google Scholar] [CrossRef]
- Sreeramareddy, C.T.; Kumar, H.H.; Sathian, B. Time trends and inequalities of under-five mortality in Nepal: A secondary data analysis of four demographic and health surveys between 1996 and 2011. PLoS ONE 2013, 8, e79818. [Google Scholar] [CrossRef] [PubMed]
- Naz, S.; Page, A.; Agho, K.E. Potential impacts of modifiable behavioral and environmental exposures on reducing burden of under-five mortality associated with household air pollution in Nepal. Matern. Child Health J. 2018, 22, 59–70. [Google Scholar] [CrossRef] [PubMed]
- Hong, R. Effect of multiple birth on infant mortality in Bangladesh. J. Paediatr. Child Health 2006, 42, 630–635. [Google Scholar] [CrossRef]
- Ministry of Health [Nepal], New ERA, and ORC Macro. Nepal Demographic and Health Survey 2001; Family Health Division, Ministry of Health, New ERA, and ORC Macro: Calverton, MD, USA, 2002.
- Ministry of Health and Population (MOHP) [Nepal], New ERA, and Macro International Inc. Nepal Demographic and Health Survey 2006; Ministry of Health and Population, New ERA, and Macro International Inc.: Kathmandu, Nepal, 2007.
- Ministry of Health and Population (MOHP) [Nepal], New ERA, and ICF International Inc. Nepal Demographic and Health Survey 2011; Ministry of Health and Population, New ERA, and ICF International: Kathmandu, Nepal; Calverton, MD, USA, 2012.
- Keith, L.G.; Oleszczuk, J.J.; Keith, D.M. Multiple gestation: Reflections on epidemiology, causes, and consequences. Int. J. Fertil. Women’s Med. 2000, 45, 206–214. [Google Scholar]
- Titaley, C.R.; Dibley, M.J.; Agho, K.; Roberts, C.L.; Hall, J. Determinants of neonatal mortality in Indonesia. BMC Public Health 2008, 8, 232. [Google Scholar] [CrossRef]
- Mosley, W.H.; Chen, L.C. An analytical framework for the study of child survival in developing countries. Popul. Dev. Rev. 1984, 10, 25–45. [Google Scholar] [CrossRef]
- Abir, T.; Agho, K.E.; Page, A.N.; Milton, A.H.; Dibley, M.J. Risk factors for under-five mortality: Evidence from Bangladesh Demographic and Health Survey, 2004–2011. BMJ Open 2015, 5, e006722. [Google Scholar] [CrossRef]
- Filmer, D.; Pritchett, L.H. Estimating wealth effects without expenditure data-or tears: An application to educational enrollments in states of India. Demography 2001, 38, 115–132. [Google Scholar]
- UNICEF; WHO. Progress on Drinking Water and Sanitation Joint Monitoring Programme Update 2015; UNICEF: New York, NY, USA, 2015. [Google Scholar]
- Rutstein, S.O.; Rojas, G. Guide to DHS Statistics: Demographic and Health Surveys Methodology; ORC Macro: Calverton, MD, USA, 2006. [Google Scholar]
- Victora, C.G.; Huttly, S.R.; Fuchs, S.C.; Olinto, M.T. The role of conceptual frameworks in epidemiological analysis: A hierarchical approach. Int. J. Epideliol. 1997, 26, 224–227. [Google Scholar] [CrossRef]
- Stafford, R.J.; Schluter, P.J.; Wilson, A.J.; Kirk, M.D.; Hall, G.; Unicomb, L.; OzFoodNet Working Group. Population-attributable risk estimates for risk factors associated with Campylobacter infection, Australia. Emerg. Infect. Dis. 2008, 14, 895–901. [Google Scholar] [CrossRef]
- Krell, R.; Rabkin, L. The effects of sibling death on the surviving child: A family perspective. Fam. Process 1979, 18, 471–477. [Google Scholar] [CrossRef]
- Blencowe, H.; Lawn, J.; Vandelaer, J.; Roper, M.; Cousens, S. Tetanus toxoid immunization to reduce mortality from neonatal tetanus. Int. J. Epidemiol. 2010, 39, i102–i109. [Google Scholar] [CrossRef]
- Saha, U.R.; van Soest, A. Contraceptive use, birth spacing, and child survival in Matlab, Bangladesh. Stud. Fam. Plann. 2013, 44, 45–66. [Google Scholar] [CrossRef]
- Ghosh, R.; Bharati, P. Determinants of infant and child mortality in periurban areas of Kolkata city, India. Asia Pac. J. Public Health 2010, 22, 63–75. [Google Scholar] [CrossRef]
- Loto, O.M.; Ezechi, O.C.; Kalu, B.K.E.; Loto, A.B.; Ezechi, L.O.; Ogunniyi, S.O. Poor obstetric performance of teenagers: Is it age-or quality of care-related? J. Obstet. Gynaecol. 2004, 24, 395–398. [Google Scholar] [CrossRef]
- Yadav, S.; Choudhary, D.; Narayan, K.C.; Mandal, R.K.; Sharma, A.; Chauhan, S.S.; Agrawal, P. Adverse reproductive outcomes associated with teenage pregnancy. McGill J. Med. 2008, 11, 141–144. [Google Scholar]
- Sayem, A.M.; Nury, A.T. Factors associated with teenage marital pregnancy among Bangladeshi women. Reprod. Health 2011, 8, 16. [Google Scholar] [CrossRef]
- Oyefara, J.L. Maternal age at first birth and childhood mortality in yoruba society: The case of Osun State, Nigeria. Res. Humanit. Soc. Sci. 2013, 3, 246–254. [Google Scholar]
- Kamal, S.M. What is the association between maternal age and neonatal mortality? An analysis of the 2007 Bangladesh Demographic and Health Survey. Asia Pac. J. Public Health 2015, 27, 1106–1117. [Google Scholar] [CrossRef]
- Dibley, M.J.; Titaley, C.R.; d’Este, C.; Agho, K. Iron and folic acid supplements in pregnancy improve child survival in Indonesia. Am. J. Clin. Nutr. 2011, 95, 220–230. [Google Scholar] [CrossRef]
- Haider, B.A.; Olofin, I.; Wang, M.; Spiegelman, D.; Ezzati, M.; Fawzi, W.W. Anaemia, prenatal iron use, and risk of adverse pregnancy outcomes: Systematic review and meta-analysis. BMJ 2013, 346, f3443. [Google Scholar] [CrossRef]
- Imdad, A.; Bhutta, Z.A. Routine iron/folate supplementation during pregnancy: Effect on maternal anaemia and birth outcomes. Paediatr. Perinat. Epidemiol. 2012, 26, 168–177. [Google Scholar] [CrossRef]
- Nisar, Y.B.; Dibley, M.J. Earlier initiation and use of a greater number of iron-folic acid supplements during pregnancy prevents early neonatal deaths in Nepal and Pakistan. PLoS ONE 2014, 9, e112446. [Google Scholar] [CrossRef]


| Study Variable | n (% *) | NMR a (95% CI f) | PNMR b (95% CI) | IMR c (95% CI) | CMR d (95% CI) | U5MR e (95% CI) |
|---|---|---|---|---|---|---|
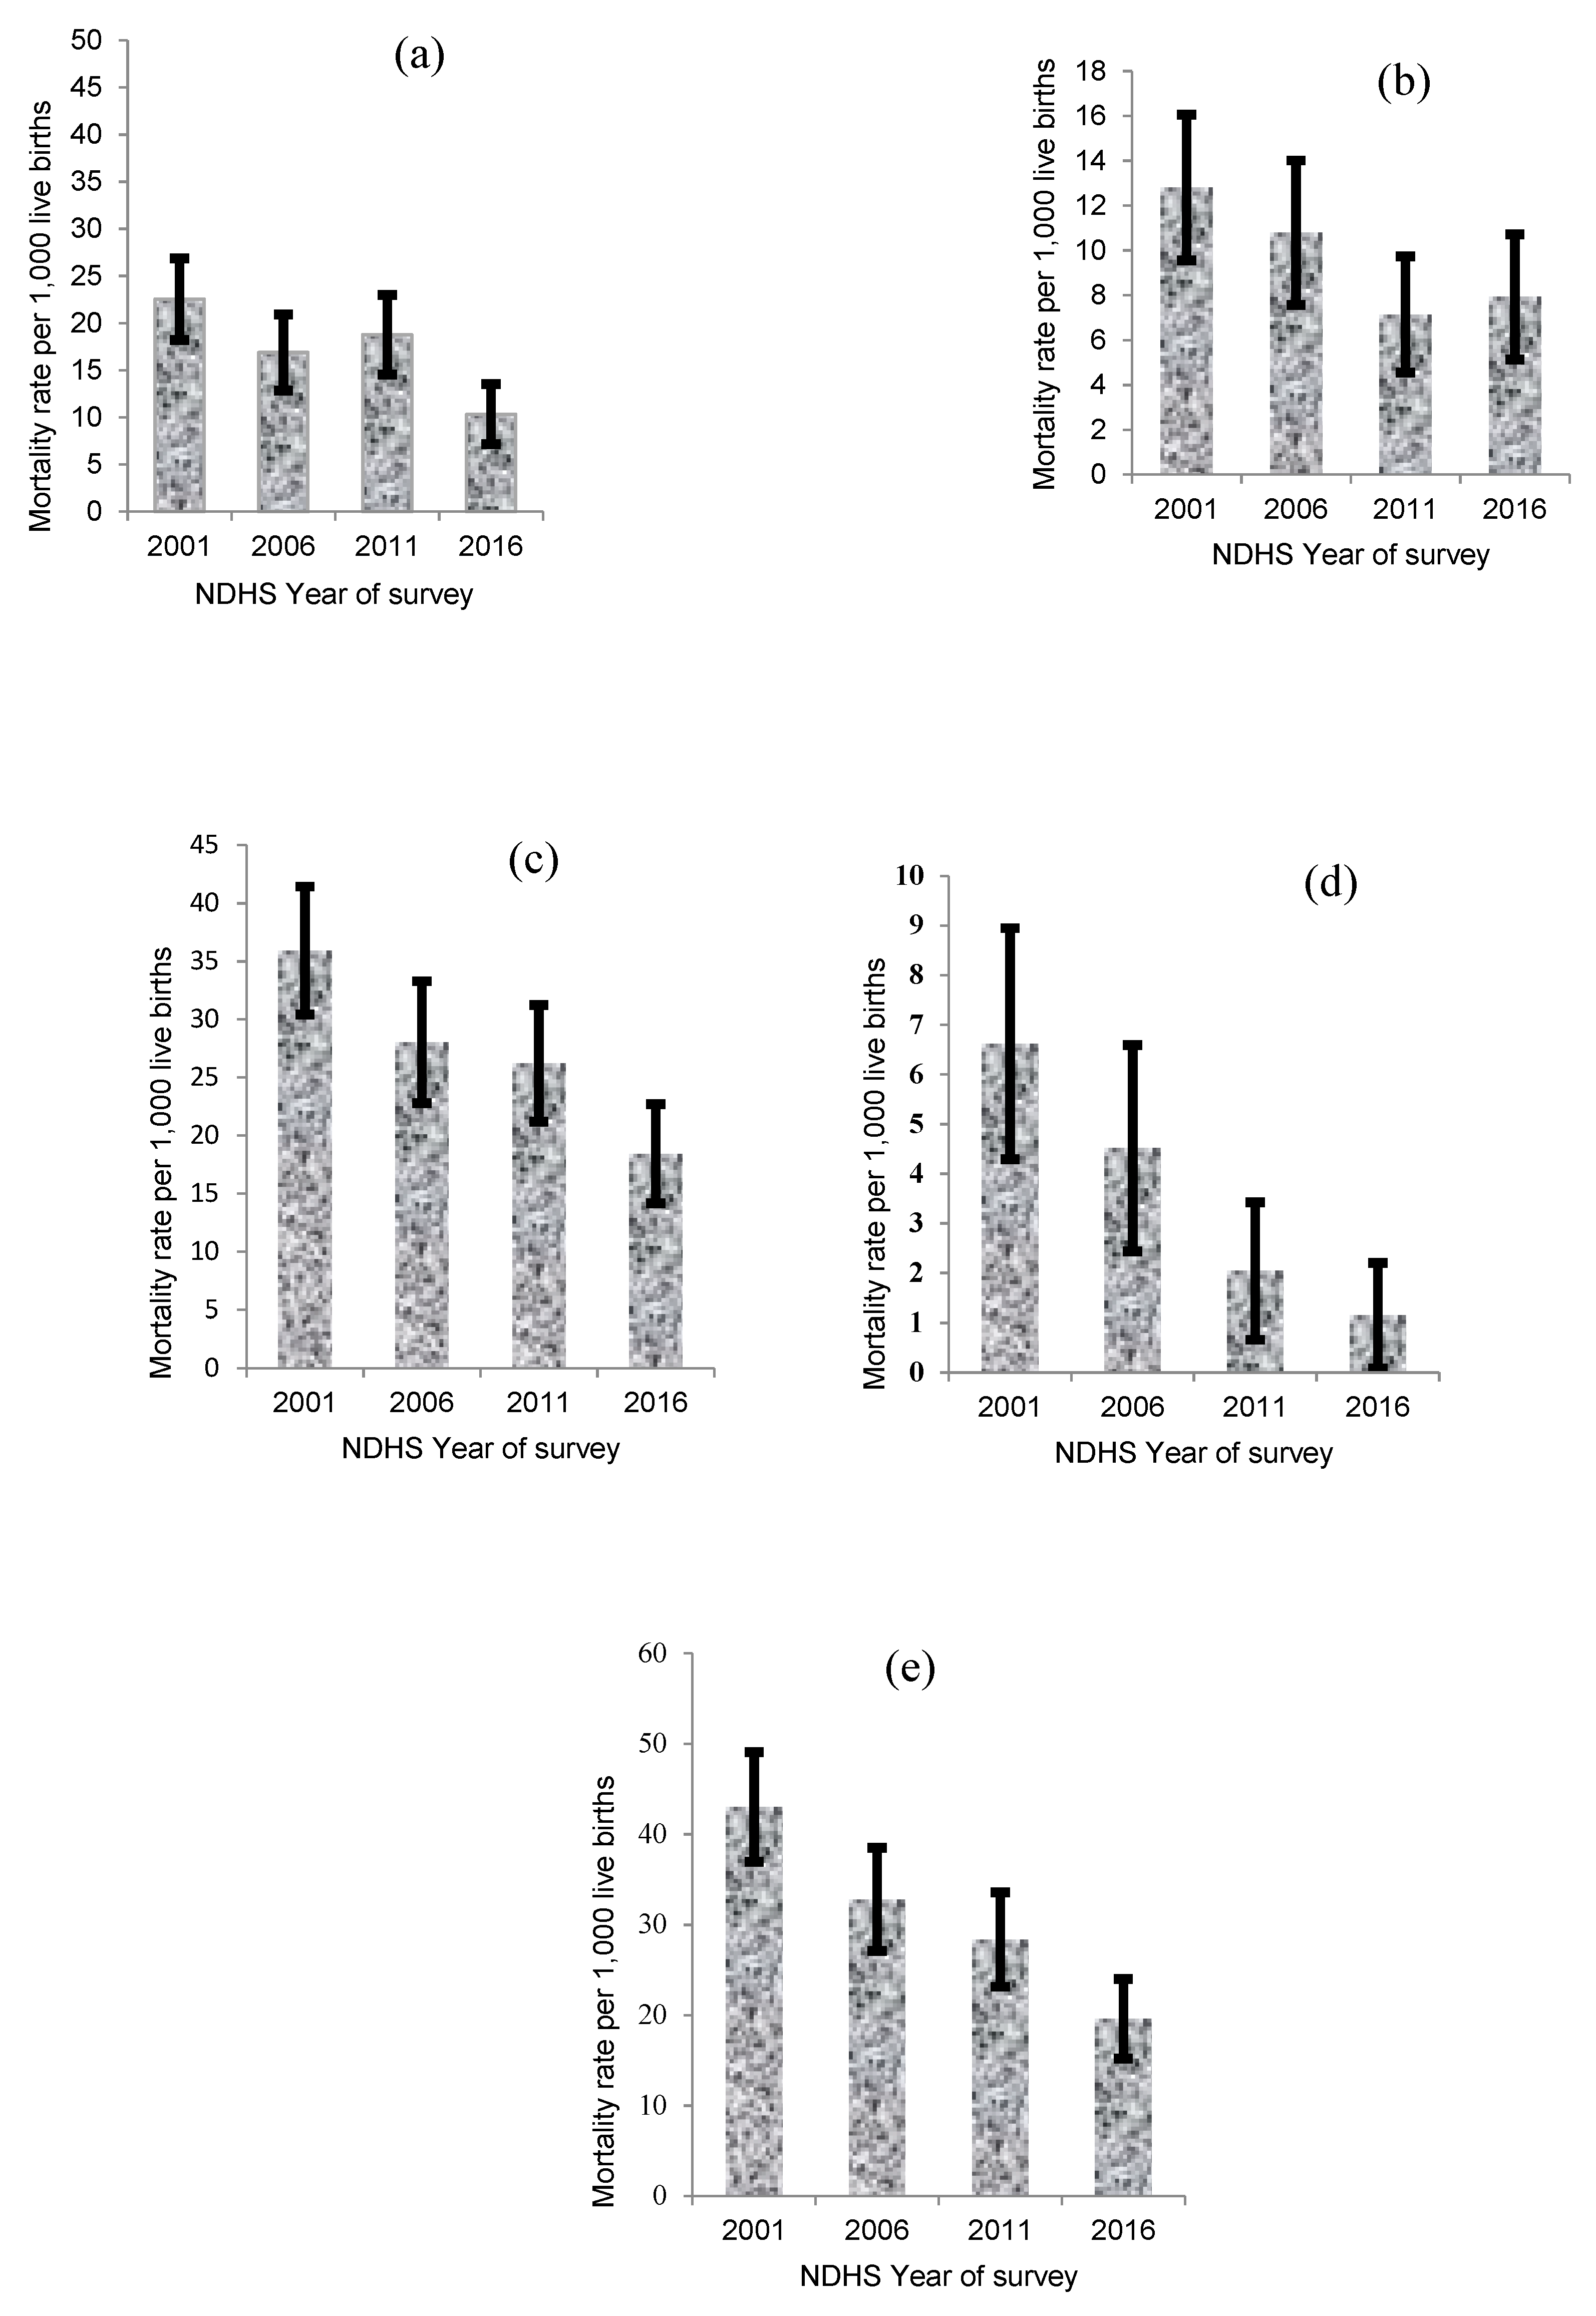
| Year of survey | ||||||
| 2001 | 4714 (28) | 22 (20, 23) | 13 (12, 14) | 35 (32, 37) | 7 (5, 8) | 42 (37, 45) |
| 2006 | 4029 (24) | 17 (15, 19) | 11 (9, 12) | 28 (24, 31) | 4 (3, 5) | 32 (27, 36) |
| 2011 | 4118 (25) | 18 (16, 21) | 7 (6, 8) | 25 (22, 29) | 2 (1, 3) | 27 (23, 32) |
| 2016 | 3941 (23) | 10 (9, 12) | 8 (7, 9) | 18 (16, 21) | 1 (1, 2) | 19 (17, 23) |
| Type of residence | ||||||
| Urban | 3461 (21) | 9 (8, 11) | 9 (7, 10) | 18 (15, 21) | 2 (1, 3) | 20 (16, 24) |
| Rural | 13,341 (79) | 19 (17, 21) | 10 (8, 11) | 29 (25, 32) | 4 (3, 5) | 33 (28, 37) |
| Ecological zone | ||||||
| Terai | 8663 (52) | 18 (16, 20) | 9 (8, 11) | 27 (24, 31) | 4 (3, 5) | 31 (27, 36) |
| Hill | 6871 (41) | 16 (14, 18) | 8 (7, 10) | 24 (21, 28) | 3 (2, 4) | 27 (23, 32) |
| Mountain | 1268 (8) | 20 (18, 22) | 19 (17, 21) | 39 (35, 43) | 5 (4, 6) | 44 (39, 49) |
| Wealth index | ||||||
| Rich | 3239 (19) | 9 (8, 11) | 6 (5, 7) | 15 (14, 18) | 2 (1, 3) | 17 (14, 21) |
| Middle | 6220 (37) | 18 (16, 20) | 10 (8, 11) | 28 (24, 31) | 3 (2, 4) | 31 (26, 35) |
| Poor | 7343 (44) | 20 (18, 22) | 11 (9, 13) | 31 (27, 35) | 5 (4, 6) | 36 (31, 41) |
| Religion | ||||||
| Buddhist | 1191 (7) | 14 (12, 16) | 5 (4, 6) | 19 (16, 22) | 4 (3, 5) | 23 (19, 27) |
| Hindu | 14,191 (84) | 17 (15, 19) | 10 (8, 11) | 27 (23, 30) | 4 (3, 5) | 31 (26, 35) |
| Others | 1420 (8) | 18 (16, 20) | 11 (10, 13) | 29 (26, 33) | 2 (1, 3) | 31 (27, 36) |
| Ethnicity | ||||||
| Brahmin/chettri | 4735 (28) | 15 (13, 16) | 9 (8, 11) | 24 (21, 27) | 2 (1, 3) | 26 (22, 30) |
| Dalit | 2550 (15) | 22 (20, 24) | 10 (9, 12) | 32 (29, 36) | 5 (4, 6) | 37 (33, 42) |
| Janajati | 5694 (34) | 12 (11, 14) | 8 (7, 10) | 20 (18, 24) | 4 (3, 5) | 24 (21, 29) |
| Madhesi | 3824 (23) | 24 (22, 27) | 12 (10, 13) | 36 (32, 40) | 4 (3, 5) | 40 (35, 45) |
| Mother education | ||||||
| Secondary or higher | 5000 (30) | 10 (9, 12) | 6 (5, 8) | 16 (14, 20) | 2 (1, 3) | 18 (15, 23) |
| Primary | 3010 (18) | 14 (12, 16) | 11 (10, 13) | 25 (22, 29) | 2 (1, 3) | 27 (23, 32) |
| No education | 8792 (52) | 22 (20, 24) | 11 (9, 13) | 33 (29, 37) | 6 (5, 7) | 39 (34, 44) |
| Mother’s literacy level (n = 16,800) | ||||||
| Can read | 8828 (53) | 12 (10, 13) | 8 (6, 9) | 20 (16, 22) | 2 (1, 3) | 22 (17, 25) |
| Cannot read | 7972 (47) | 23 (21, 25) | 12 (10, 13) | 35 (31, 38) | 6 (5, 7) | 41 (36, 45) |
| Father’s education (n = 16,770) | ||||||
| Secondary or higher | 8647 (51) | 14 (12, 15) | 9 (7, 10) | 23 (19, 24) | 3 (2, 4) | 26 (21, 28) |
| Primary | 4136 (25) | 19 (17, 21) | 11 (9, 12) | 30 (26, 33) | 5 (4, 6) | 35 (30, 39) |
| No education | 3986 (24) | 23 (21, 25) | 11 (9, 13) | 34 (30, 38) | 5 (4, 6) | 39 (35, 44) |
| Mother occupation (16,800) | ||||||
| Not working | 4226 (25) | 15 (13, 17) | 6 (5, 7) | 21 (18, 24) | 2 (1, 2) | 22 (20, 24) |
| Agriculture | 10,725 (64) | 17 (15, 19) | 11 (10, 13) | 28 (25, 32) | 5 (4, 6) | 33 (31, 36) |
| Skilled/professional | 1850 (11) | 19 (17, 22) | 10 (8, 11) | 29 (25, 33) | 3 (2, 4) | 32 (30, 35) |
| Mother’s age | ||||||
| 40–49 | 824 (5) | 21 (18, 23) | 11 (9, 13) | 32 (27, 36) | 15 (13, 16) | 47 (40, 52) |
| 30–39 | 4089 (24) | 15 (14, 17) | 10 (8, 11) | 25 (22, 28) | 4 (3, 5) | 29 (25, 33) |
| 20–29 | 10,525 (63) | 16 (14, 18) | 9 (8, 11) | 25 (22, 29) | 3 (2, 4) | 28 (24, 33) |
| <20 | 1364 (8) | 28 (25, 30) | 12 (11, 14) | 40 (36, 44) | 1 (1, 2) | 41 (37, 46) |
| Mother’s desire for Pregnancy (n = 16,801) | ||||||
| Wanted then | 11,695 (70) | 18 (16, 20) | 10 (9, 12) | 28 (25, 32) | 4 (3, 5) | 32 (28, 37) |
| Wanted later | 2165 (13) | 14 (12, 16) | 7 (6, 9) | 21 (19, 25) | NA | 21 (19, 25) |
| No more | 2940 (18) | 17 (15, 19) | 10 (8, 11) | 27 (23, 30) | 6 (5, 7) | 33 (28, 37) |
| Birth rank and birth interval | ||||||
| 2nd/3rd birth rank, >2 years | 5607 (33) | 13 (11, 15) | 9 (7, 10) | 22 (18, 25) | 2 (1, 3) | 24 (19, 28) |
| 1st child | 4881 (29) | 20 (18, 22) | 10 (8, 11) | 32 (26, 33) | 3 (2, 4) | 35 (28, 37) |
| 2nd/3rd child, interval ≤2 years | 1740 (10) | 20 (18, 22) | 9 (7, 10) | 29 (25, 32) | 3 (2, 4) | 32 (27, 36) |
| 4th/higher child, interval >2 years | 3503 (21) | 14 (12, 16) | 11 (10, 13) | 25 (22, 29) | 5 (4, 6) | 30 (26, 35) |
| 4th/higher child, interval ≤ 2 years | 1072 (6) | 31 (28, 33) | 11 (10, 13) | 42 (38, 46) | 11 (10, 13) | 53 (48, 59) |
| Previous Death of a child | ||||||
| No | 13,809 (82) | 8 (7, 9) | 5 (4, 6) | 13 (11, 15) | 1 (1, 2) | 14 (12, 17) |
| Yes | 2993 (18) | 59 (55, 63) | 30 (28, 33) | 89 (83, 96) | 15 (13, 17) | 104 (96, 113) |
| Child Sex | ||||||
| Male | 8822 (53) | 17 (15, 19) | 8 (7, 10) | 25 (22, 29) | 4 (3, 5) | 29 (25, 34) |
| Female | 7980 (47) | 17 (15, 19) | 11 (10, 13) | 28 (26, 32) | 4 (3, 5) | 32 (29, 37) |
| Types of drinking water source (15,659) | ||||||
| Improved | 13,199 (79) | 16 (14, 18) | 9 (8, 11) | 25 (22, 29) | 3 (2, 4) | 28 (24, 33) |
| Unimproved | 2460 (15) | 15 (13, 17) | 12 (10, 13) | 27 (23, 30) | 7 (5, 8) | 34 (28, 38) |
| Types of sanitation facilities (n = 15,652) | ||||||
| Improved | 6302 (38) | 12 (11, 14) | 9 (7, 10) | 21 (18, 24) | 1 (1, 2) | 22 (20, 24) |
| Unimproved | 9350 (56) | 19 (16, 21) | 10 (9, 12) | 29 (25, 33) | 5 (4, 6) | 34 (29, 39) |
| Types of Cooking Fuel (15,659) | ||||||
| Improved | 2478 (15) | 8 (6, 9) | 8 (6, 9) | 16 (12, 18) | 2 (1, 3) | 18 (13, 21) |
| Unimproved | 13,182 (78) | 18 (16, 20) | 10 (9, 12) | 28 (25, 32) | 4 (3, 5) | 32 (28, 37) |
| Number of ANC visits (n = 16,792) | ||||||
| 4+ANC visits | 6660 (40) | 9 (8, 11) | 8 (6, 9) | 17 (14, 20) | 2 (1, 3) | 19 (15, 23) |
| 1–3 ANC visits | 5825 (35) | 19 (17, 22) | 8 (7, 9) | 27 (24, 31) | 2 (1, 3) | 29 (25, 34) |
| No ANC visits | 4307 (26) | 26 (23, 28) | 15 (13, 17) | 41 (36, 45) | 9 (7, 10) | 50 (43, 55) |
| TT Pregnancy Times (n = 16,798) | ||||||
| Two or more TT | 10,143 (60) | 12 (10, 13) | 7 (6, 9) | 19 (16, 22) | 2 (1, 3) | 21 (17, 25) |
| One TT | 2441 (15) | 20 (18, 22) | 10 (9, 12) | 30 (27, 34) | 3 (2, 4) | 33 (29, 38) |
| No TT | 4214 (25) | 29 (26, 31) | 15 (13, 17) | 44 (39, 48) | 8 (6, 9) | 52 (45, 57) |
| IFA supplementation (16,801) | ||||||
| Yes | 10,168 (61) | 13 (11, 15) | 8 (7, 9) | 21 (18, 24) | 1 (1, 2) | 22 (19, 26) |
| No | 6633 (39) | 23 (21, 25) | 13 (11, 14) | 36 (32, 39) | 7 (6, 9) | 43 (38, 48) |
| Place of delivery (16,801) | ||||||
| Health facility | 5462 (33) | 12 (11, 14) | 8 (7, 10) | 20 (18, 24) | 1 (1, 2) | 21 (19, 26) |
| Home facility | 11,338 (67) | 19 (17, 21) | 10 (9, 12) | 29 (28, 33) | 5 (4, 6) | 34 (32, 39) |
| Delivery assistance (16,801) | ||||||
| Doctors/nurses | 4544 (27) | 12 (10, 14) | 9 (8, 11) | 21 (18, 25) | 1 (1, 2) | 22 (19, 27) |
| Others | 12,257 (73) | 19 (17, 21) | 10 (8, 11) | 29 (25, 32) | 5 (4, 6) | 34 (29, 38) |
| Mode of delivery (16,801) | ||||||
| Non caesarean | 16,006 (95) | 18 (16, 20) | 10 (8, 11) | 28 (24, 31) | 4 (3, 5) | 32 (27, 36) |
| Caesarean | 796 (5) | 6 (5, 7) | 10 (9, 12) | 16 (14, 19) | 2 (1, 3) | 18 (15, 22) |
| Current use of contraceptives at the time of the survey | ||||||
| Yes | 6422 (38) | 10 (8, 11) | 5 (4, 6) | 15 (12, 17) | 2 (1, 3) | 17 (13, 20) |
| No | 10,380 (62) | 22 (19, 24) | 13 (11, 14) | 35 (30, 38) | 5 (4, 6) | 40 (35, 44) |
| Variables | Neonatal Mortality (0–30 Days) | Post-Neonatal Mortality (1–11 Months) | Infant Mortality (0–11 Months) | Child Mortality (12–59 Months) | Under-Five Mortality (0–59 Months) | |||||
|---|---|---|---|---|---|---|---|---|---|---|
| aHR (95% CI) | p-value | aHR (95% CI) | p -value | aHR (95% CI) | p -value | aHR (95% CI) | p -value | aHR (95% CI) | p -value | |
| Religion | ||||||||||
| Buddhist | 1.00 | |||||||||
| Hindu | 2.48 (1.02, 6.03) | 0.046 | ||||||||
| Others | 3.55 (1.27, 9.93) | 0.016 | ||||||||
| Ethnicity | ||||||||||
| Brahmin/chettri | 1.00 | 1.00 | ||||||||
| Dalit | 1.19 (0.86, 1.65) | 0.285 | 1.16 (0.85, 1.59) | 0.341 | ||||||
| Janajati | 0.84 (0.63, 1.12) | 0.239 | 0.90 (0.70, 1.16) | 0.426 | ||||||
| Madhesi | 1.82 (1.35, 2.45) | <0.001 | 1.73 (1.29, 2.32) | <0.001 | ||||||
| Mother’s literacy level | ||||||||||
| Can read | 1.00 | 1.00 | ||||||||
| Cannot read | 1.57 (1.13, 2.17) | 0.007 | 1.33 (1.03, 1.72) | 0.031 | ||||||
| Mother’s occupation | ||||||||||
| Not working | 1.00 | 1.00 | 1.00 | |||||||
| Agriculture | 1.82 (1.03, 3.22) | 0.040 | 1.45 (1.06, 2.00) | 0.022 | 1.45 (1.06, 1.96) | 0.018 | ||||
| Skilled/professional | 2.33 (0.99, 5.46) | 0.053 | 2.15 (1.38, 3.35) | 0.001 | 2.15 (1.40, 3.30) | <0.001 | ||||
| Mother’s age | ||||||||||
| 40–49 | 1.00 | 1.00 | 1.00 | 1.00 | ||||||
| 30–39 | 1.46 (0.83, 2.58) | 0.192 | 2.20 (1.08, 4.50) | 0.031 | 1.68 (1.07, 2.63) | 0.025 | 1.41 (0.95, 2.08) | 0.085 | ||
| 20–29 | 1.71 (0.97, 3.01) | 0.065 | 3.28 (1.39, 7.77) | 0.007 | 2.09 (1.30, 3.37) | 0.002 | 1.88 (1.24, 2.86) | 0.003 | ||
| <20 | 2.39 (1.13, 5.05) | 0.022 | 5.04 (1.73, 14.7) | 0.003 | 3.05 (1.64, 5.66) | <0.001 | 2.76 (1.57, 4.85) | <0.001 | ||
| Birth rank and birth interval | ||||||||||
| 2nd/3rd birth rank, >2 years | 1.00 | 1.00 | 1.00 | 1.00 | 1.00 | |||||
| 1st child | 2.91 (1.79, 4.74) | <0.001 | 2.12 (1.10, 4.10) | 0.025 | 2.56 (1.72, 3.80) | <0.001 | 1.87 (0.54, 6.47) | 0.322 | 2.55 (1.77, 3.68) | <0.001 |
| 2nd/3rd birth rank, interval ≤2 years | 1.22 (0.75, 1.99) | 0.421 | 1.01 (0.53, 1.92) | 0.985 | 1.15 (0.76, 1.73) | 0.501 | 1.43 (0.44, 4.58) | 0.551 | 1.16 (0.78, 1.73) | 0.463 |
| 4th/higher birth rank, interval >2 years | 0.29 (0.17, 0.50) | <0.001 | 0.54 (0.27, 1.07) | 0.078 | 0.37 (0.24, 0.56) | <0.001 | 0.33 (0.14, 0.78) | 0.011 | 0.36 (0.24, 0.52) | <0.001 |
| 4th/higher birth rank, interval ≤ 2 years | 0.62 (0.34, 1.11) | 0.109 | 0.52 (0.26, 1.05) | 0.066 | 0.60 (0.38, 0.95) | 0.028 | 0.78 (0.39, 1.59) | 0.499 | 0.62 (0.42, 0.91) | 0.015 |
| Previous death of a child | ||||||||||
| No | 1.00 | 1.00 | 1.00 | 1.00 | 1.00 | |||||
| Yes | 17.33 (11.44, 26.26) | <0.001 | 13.05 (7.19, 23.67) | <0.001 | 15.90 (11.38, 22.22) | <0.001 | 16.98 (6.19, 46.58) | <0.001 | 15.97 (11.64, 21.92) | <0.001 |
| TT Pregnancy Times | ||||||||||
| Two or more TT | 1.00 | 1.00 | 1.00 | 1.00 | 1.00 | |||||
| One TT | 1.65 (1.04, 2.60) | 0.033 | 1.34 (0.78, 2.29) | 0.289 | 1.51 (1.06, 2.16) | 0.022 | 1.62 (0.58, 4.54) | 0.353 | 1.54 (1.09, 2.16) | 0.013 |
| No TT | 2.28 (1.68, 3.09) | <0.001 | 1.86 (1.24, 2.79) | 0.003 | 2.44 (1.89, 3.15) | <0.001 | 2.93 (1.51, 5.69) | 0.002 | 2.39 (1.89, 3.01) | <0.001 |
| Contraceptive use | ||||||||||
| yes | 1.00 | 1.00 | 1.00 | 1.00 | 1.00 | |||||
| No | 1.69 (1.21, 2.37) | 0.002 | 2.69 (1.67, 4.32) | <0.001 | 2.01 (1.53, 2.64) | <0.001 | 2.47 (1.30, 4.71) | 0.005 | 2.03 (1.57, 2.62) | <0.001 |
| Variable | Neonatal Mortality | Post-Neonatal Mortality | Infant Mortality | Child Mortality | Under-Five Mortality | ||||||||||
|---|---|---|---|---|---|---|---|---|---|---|---|---|---|---|---|
| Previous death of a child | n * | aHR $ | PAR (95% CI) | n * | aHR $ | PAR (95% CI) | n * | aHR $ | PAR (95% CI) | n * | aHR $ | PAR (95% CI) | n * | aHR $ | PAR (95% CI) |
| No | 38.2 | 1.00 | 44.1 | 1.00 | 40.4 | 1.00 | 27.1 | 1.00 | 38.8 | 1.00 | |||||
| Yes | 61.8 | 17.3 | 58.2 (50.5–65.2) | 55.9 | 13.05 | 51.6 (40.2–62.0) | 59.6 | 15.9 | 55.9 (49.6–61.7) | 72.9 | 16.98 | 68.6 (48.7–82.1) | 61.2 | 15.97 | 57.4 (51.5–62.9) |
| TT pregnancy times | |||||||||||||||
| Two or more | 40.8 | 1.00 | 46.8 | 1.00 | 43.0 | 1.00 | 33.6 | 1.00 | 41.8 | 1.00 | |||||
| One TT | 16.7 | 1.65 | 6.58 (0.45–14.2) | 15.3 | 1.34 | –– | 16.2 | 1.51 | 5.47 (0.70–11.3) | 12.4 | 1.62 | –– | 15.8 | 1.54 | 5.54 (1.01–10.9) |
| No TT | 42.4 | 2.28 | 23.8 (14.6–33.2) | 37.9 | 1.86 | 17.5 (5.81–29.8) | 40.8 | 2.44 | 24.1 (16.8–31.5) | 54.0 | 2.93 | 35.6 (14.2–54.5) | 42.4 | 2.39 | 24.7 (17.7–31.7) |
| Contraceptive use | |||||||||||||||
| Yes | 21.7 | 1.00 | 19.0 | 1.00 | 20.7 | 1.00 | 27.7 | 1.00 | 21.0 | 1.00 | |||||
| No | 78.3 | 1.69 | 32.0 (12.5–48.3) | 81.0 | 2.69 | 50.9 (29.6–66.6) | 79.3 | 2.01 | 39.9 (25.9–51.6) | 77.3 | 2.47 | 46.0 (15.1–67.8) | 79.0 | 2.03 | 40.1 (27.2–51.1) |
© 2019 by the authors. Licensee MDPI, Basel, Switzerland. This article is an open access article distributed under the terms and conditions of the Creative Commons Attribution (CC BY) license (http://creativecommons.org/licenses/by/4.0/).
Share and Cite
Ghimire, P.R.; Agho, K.E.; Ezeh, O.K.; Renzaho, A.M.N.; Dibley, M.; Raynes-Greenow, C. Under-Five Mortality and Associated Factors: Evidence from the Nepal Demographic and Health Survey (2001–2016). Int. J. Environ. Res. Public Health 2019, 16, 1241. https://doi.org/10.3390/ijerph16071241
Ghimire PR, Agho KE, Ezeh OK, Renzaho AMN, Dibley M, Raynes-Greenow C. Under-Five Mortality and Associated Factors: Evidence from the Nepal Demographic and Health Survey (2001–2016). International Journal of Environmental Research and Public Health. 2019; 16(7):1241. https://doi.org/10.3390/ijerph16071241
Chicago/Turabian StyleGhimire, Pramesh Raj, Kingsley E. Agho, Osita Kingsley Ezeh, Andre M. N. Renzaho, Michael Dibley, and Camille Raynes-Greenow. 2019. "Under-Five Mortality and Associated Factors: Evidence from the Nepal Demographic and Health Survey (2001–2016)" International Journal of Environmental Research and Public Health 16, no. 7: 1241. https://doi.org/10.3390/ijerph16071241
APA StyleGhimire, P. R., Agho, K. E., Ezeh, O. K., Renzaho, A. M. N., Dibley, M., & Raynes-Greenow, C. (2019). Under-Five Mortality and Associated Factors: Evidence from the Nepal Demographic and Health Survey (2001–2016). International Journal of Environmental Research and Public Health, 16(7), 1241. https://doi.org/10.3390/ijerph16071241