Effect of Nutritional Intervention Programs on Nutritional Status and Readmission Rate in Malnourished Older Adults with Pneumonia: A Randomized Control Trial


Abstract
:1. Introduction
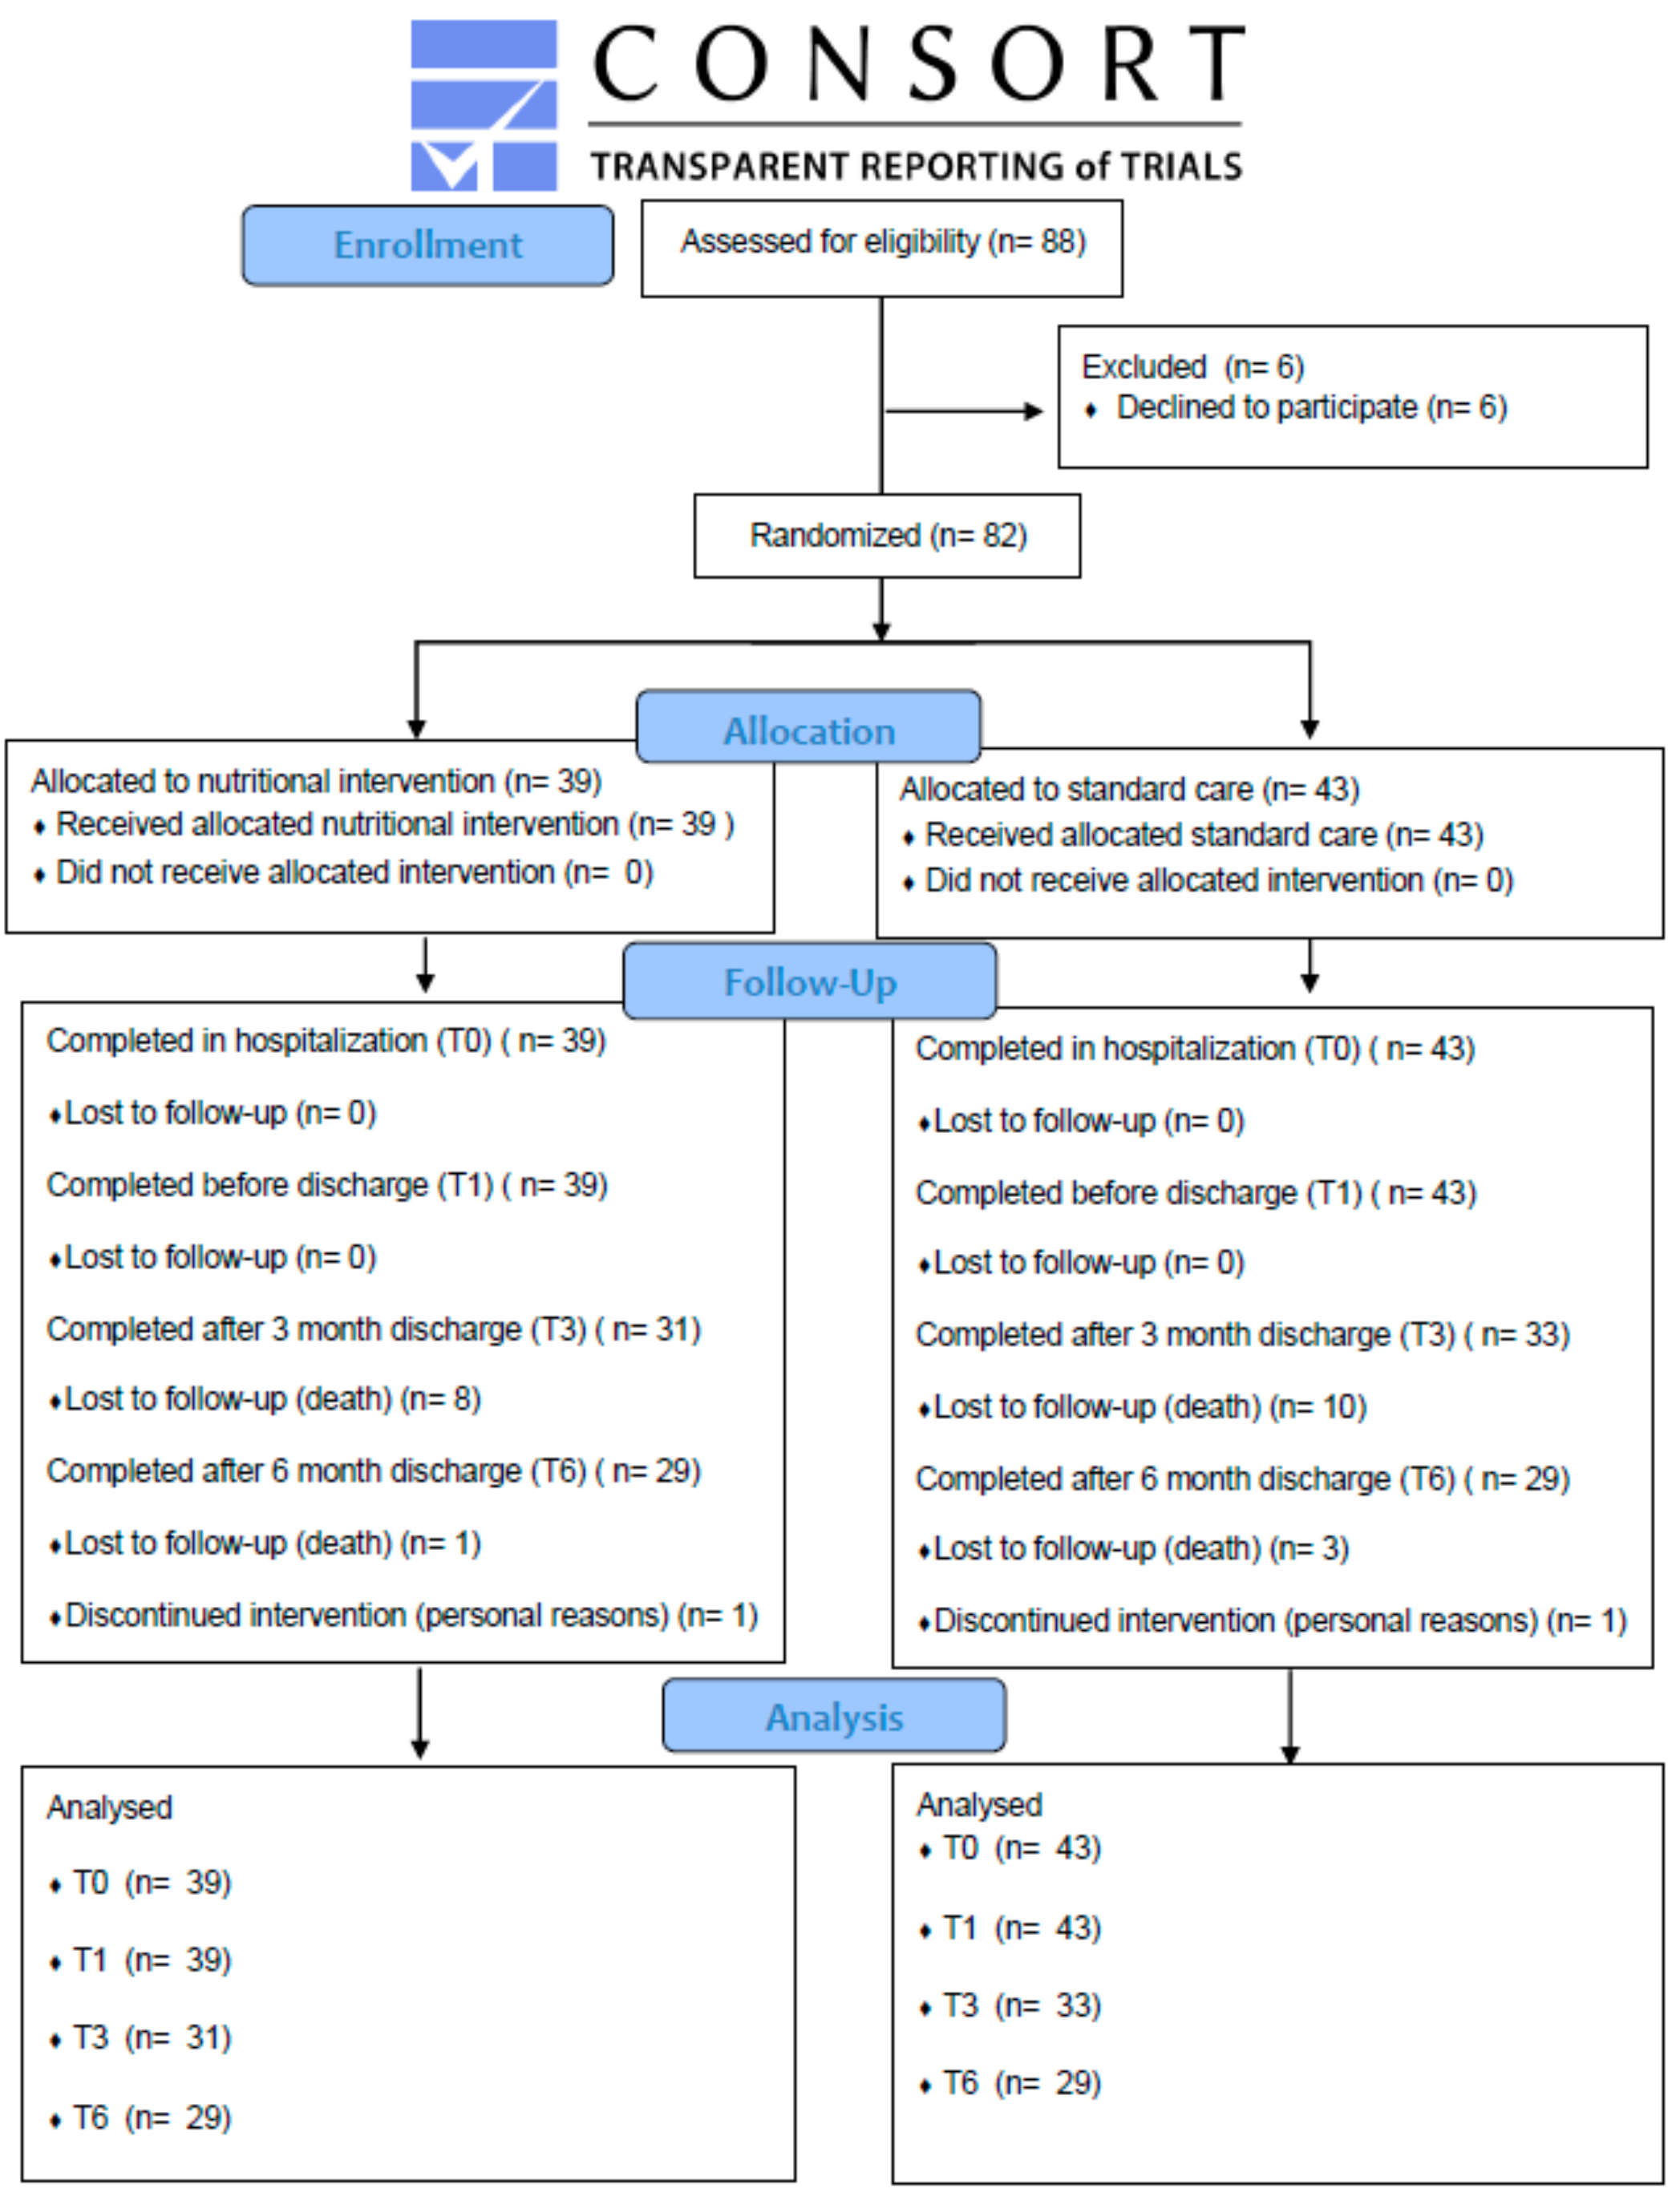
2. Methods
2.1. Study Design and Setting
2.2. Study Participants
2.3. Interventions
2.4. Outcomes Measures
2.4.1. Primary Outcomes
2.4.2. Secondary Outcomes
2.5. Statistical Analysis
3. Results
3.1. Baseline Characteristics of Patients
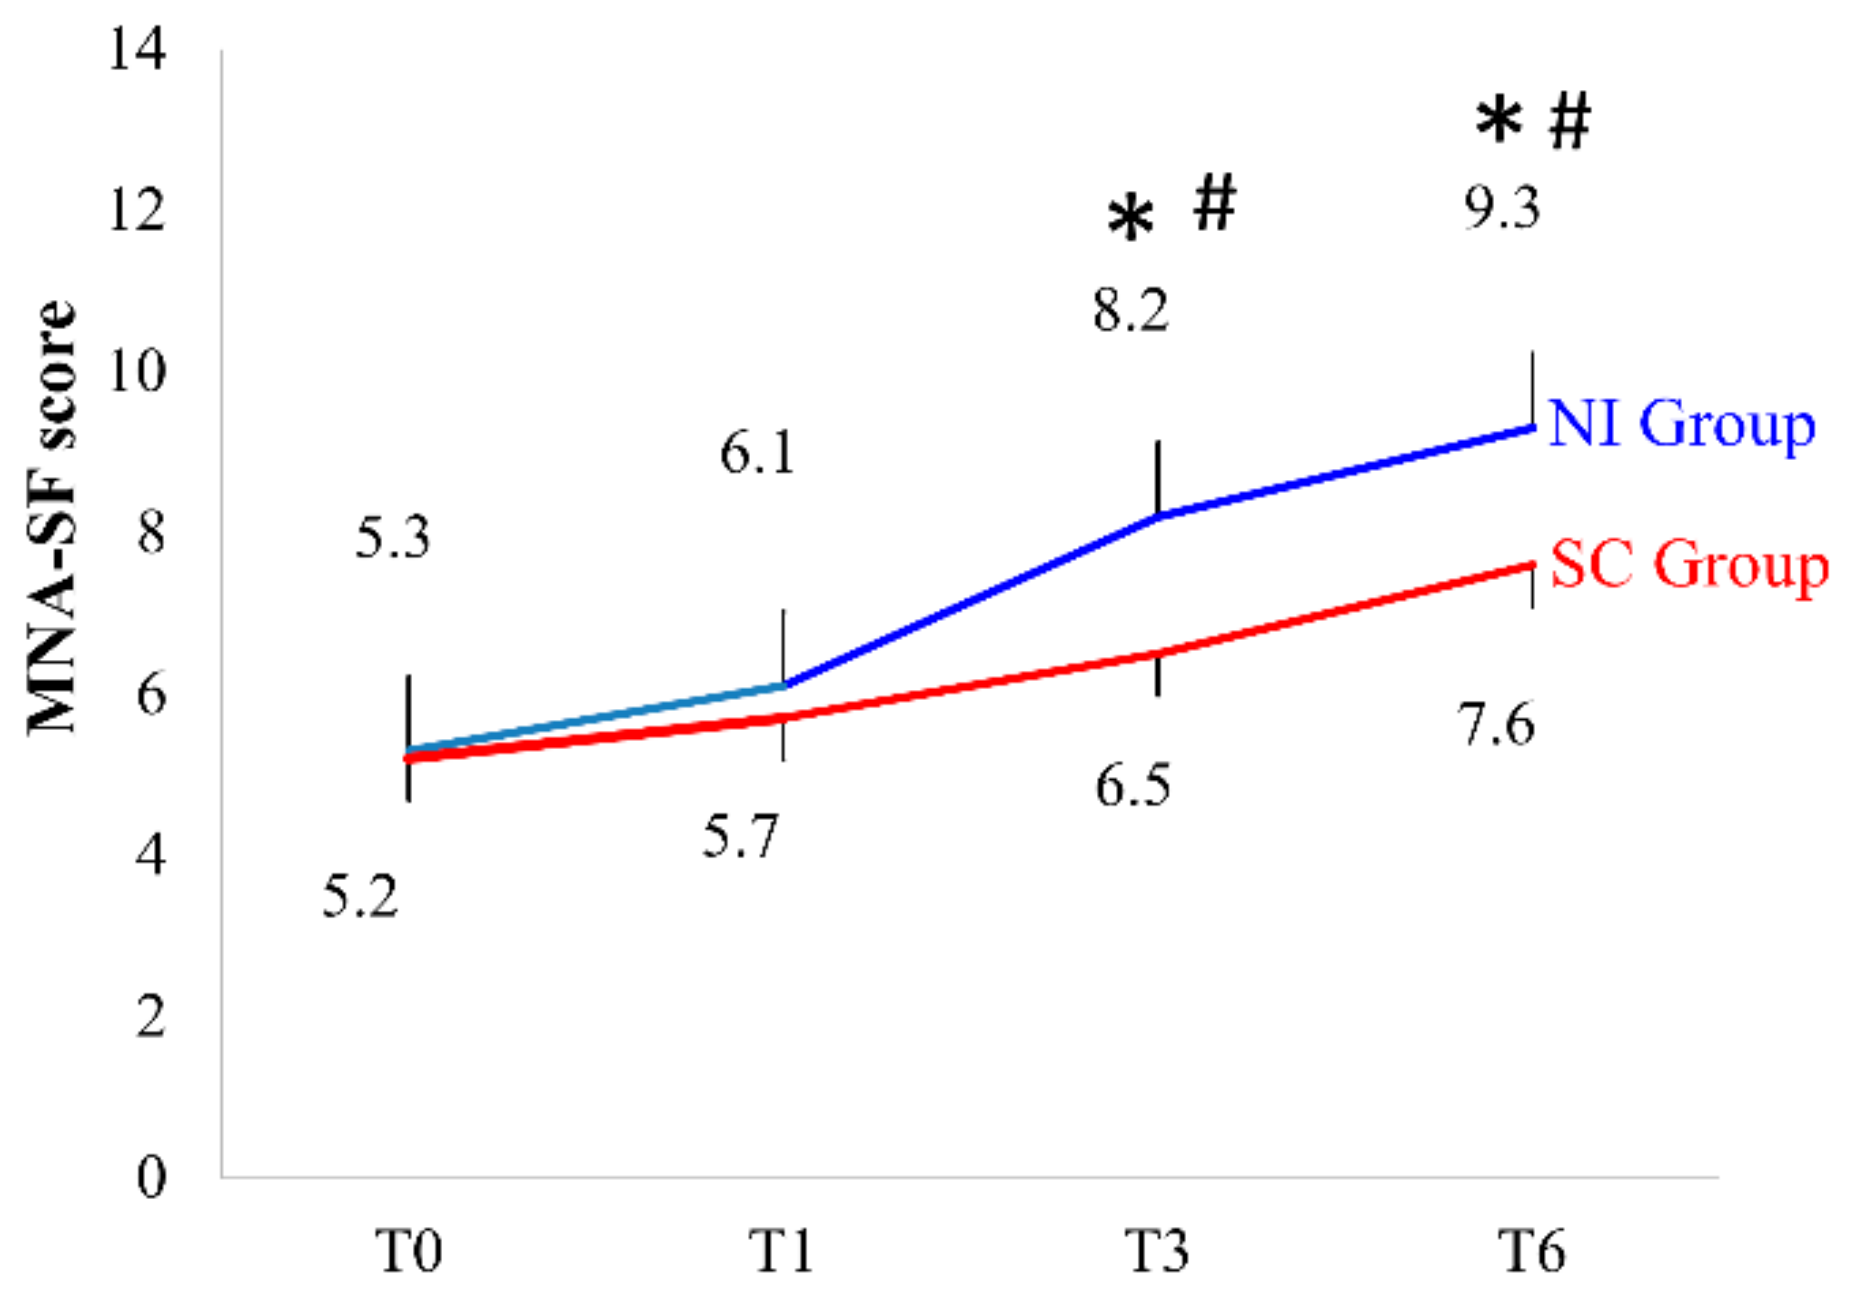
3.2. MNA-SF Assessment
3.3. Anthropometric Measurements
3.4. Blood Analysis
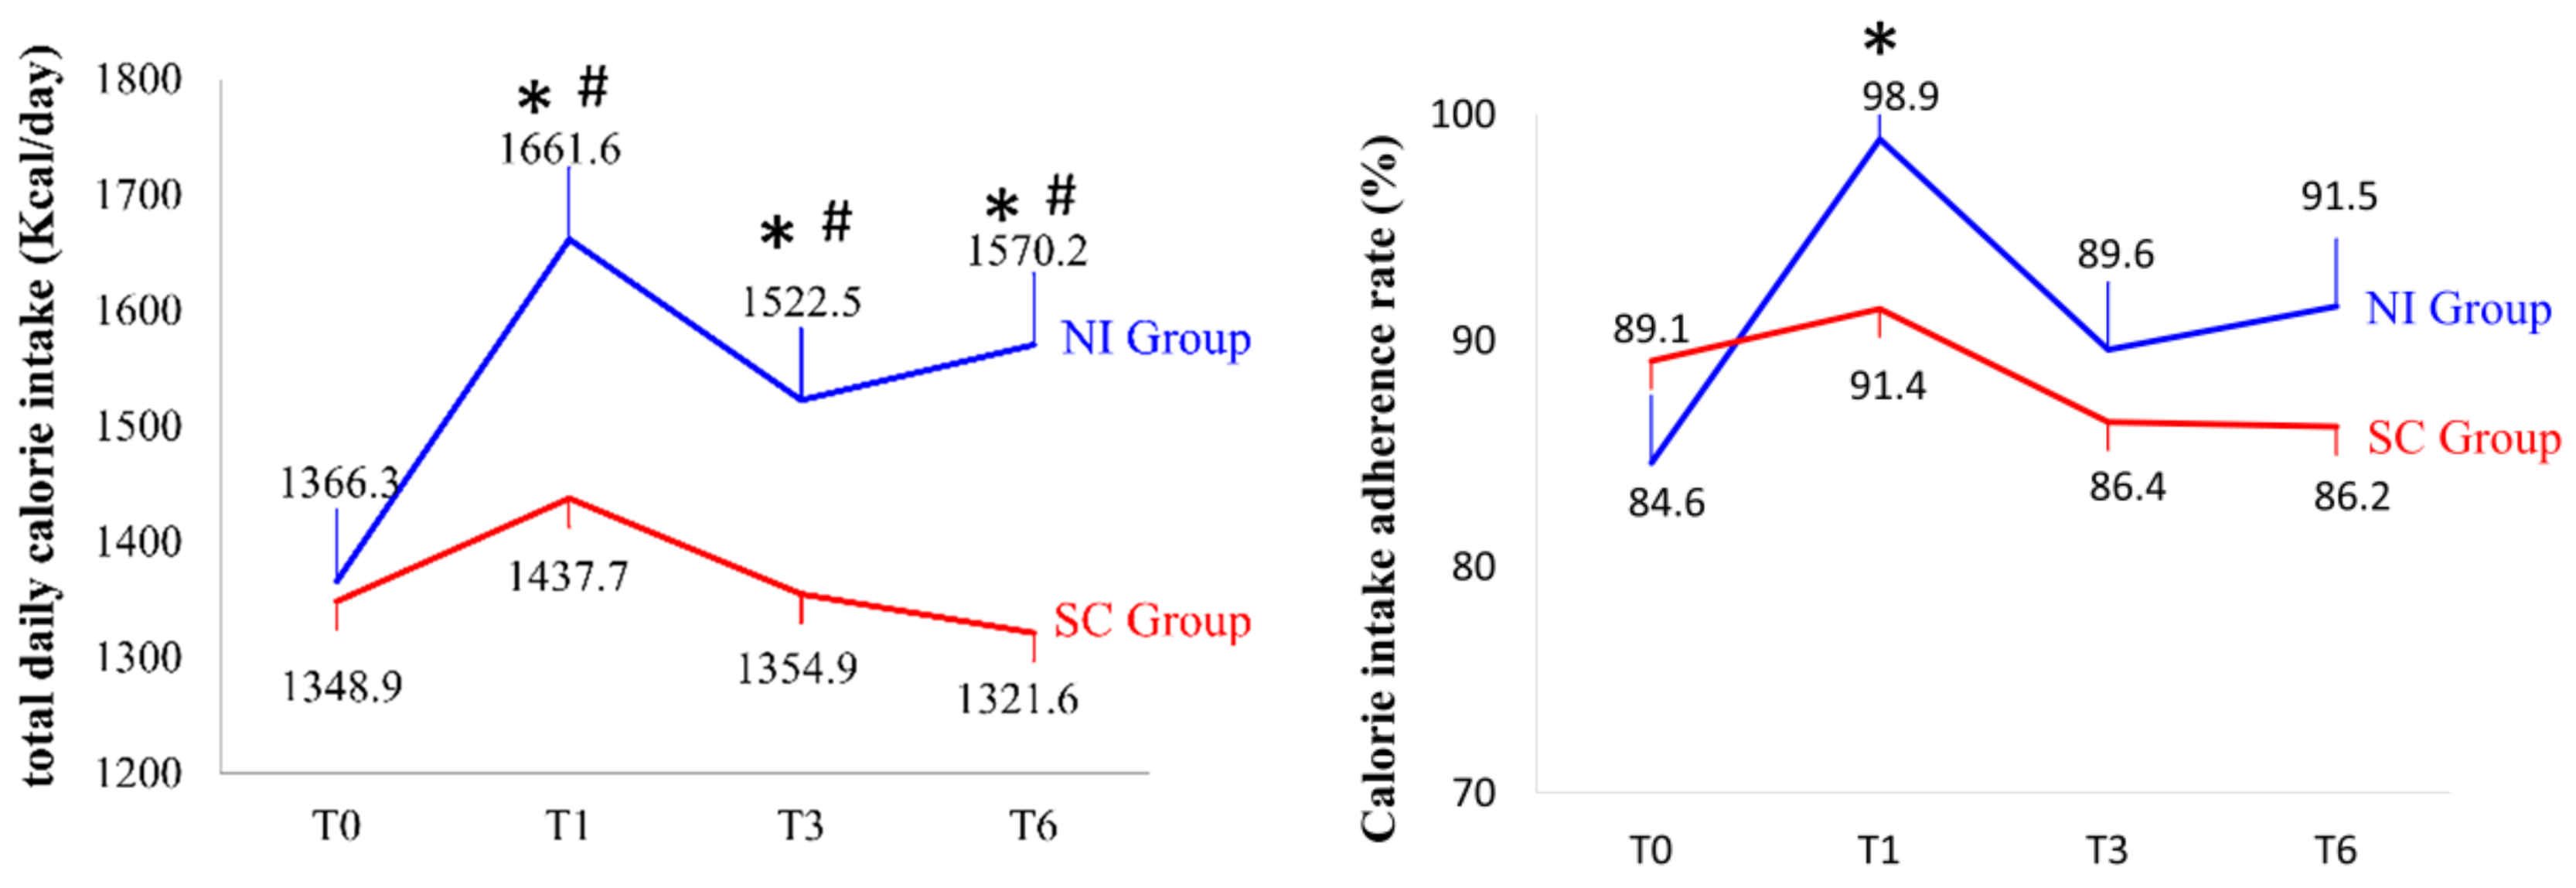
3.5. Assessment of Total Daily Calorie Intake, Calorie Intake Adherence Rate, and Three-Nutrient Ratios
3.6. Hospital Stay and Readmission Rate
4. Discussion
5. Conclusions
Author Contributions
Acknowledgments
Conflicts of Interest
References
- Revised Global Burden of Disease 2002 Estimates Geneva: WHO. Available online: https://www.who.int/healthinfo/global_burden_disease/en/ (accessed on 5 August 2019).
- Alcon, A.; Fabregas, N.; Torres, A. Pathophysiology of pneumonia. Clin. Chest Med. 2005, 26, 39–46. [Google Scholar] [CrossRef] [PubMed]
- Yardimci, B.; Aksoy, S.M.; Ozkaya, I.; Demir, T.; Tezcan, G.; Kaptanoglu, A.Y. Anthropometric measurements may be informative for nursing home-acquired pneumonia. Pak. J. Med. Sci. 2016, 32, 694–699. [Google Scholar] [CrossRef] [PubMed]
- Malaguti, C.; Napolis, L.M.; Villaca, D.; Neder, J.A.; Nery, L.E.; Dal Corso, S. Relationship between peripheral muscle structure and function in patients with chronic obstructive pulmonary disease with different nutritional status. J. Strength Cond. Res. 2011, 25, 1795–1803. [Google Scholar] [CrossRef]
- Maruyama, T.; Gabazza, E.C.; Morser, J.; Takagi, T.; D’Alessandro-Gabazza, C.; Hirohata, S.; Nakayama, S.; Ramirez, A.Y.; Fujiwara, A.; Naito, M.; et al. Community-acquired pneumonia and nursing home-acquired pneumonia in the very elderly patients. Respir. Med. 2010, 104, 584–592. [Google Scholar] [CrossRef] [PubMed]
- Lin, L.C.; Hsieh, P.C.; Wu, S.C. Prevalence and associated factors of pneumonia in patients with vegetative state in Taiwan. J. Clin. Nurs. 2008, 17, 861–868. [Google Scholar] [CrossRef]
- Fujiwara, A.; Minakuchi, H.; Uehara, J.; Miki, H.; Inoue-Minakuchi, M.; Kimura-Ono, A.; Nawachi, K.; Maekawa, K.; Kuboki, T. Loss of oral self-care ability results in a higher risk of pneumonia in older inpatients: A prospective cohort study in a Japanese rural hospital. Gerodontology 2019, 36, 236–243. [Google Scholar] [CrossRef]
- Ambrus, J.L., Sr.; Ambrus, J.L., Jr. Nutrition and infectious diseases in developing countries and problems of acquired immunodeficiency syndrome. Exp. Biol. Med. 2004, 229, 464–472. [Google Scholar] [CrossRef]
- Enwonwu, C.O.; Phillips, R.S.; Falkler, W.A., Jr. Nutrition and oral infectious diseases: State of the science. Compend. Contin. Educ. Dent. 2002, 23, 431–434. [Google Scholar]
- Dvir, D.; Cohen, J.; Singer, P. Computerized energy balance and complications in critically ill patients: An observational study. Clin. Nutr. 2006, 25, 37–44. [Google Scholar] [CrossRef]
- Rodriguez-Pecci, M.S.; Carlson, D.; Montero-Tinnirello, J.; Parodi, R.L.; Montero, A.; Greca, A.A. Nutritional status and mortality in community acquired pneumonia. Medicina 2010, 70, 120–126. [Google Scholar]
- Lilamand, M.; Kelaiditi, E.; Demougeot, L.; Rolland, Y.; Vellas, B.; Cesari, M. The Mini Nutritional Assessment-Short Form and mortality in nursing home residents—Results from the INCUR study. J. Nutr. Health Aging 2015, 19, 383–388. [Google Scholar] [CrossRef]
- Nykanen, I.; Rissanen, T.H.; Sulkava, R.; Hartikainen, S. Effects of individual dietary counseling as part of a comprehensive geriatric assessment (CGA) on nutritional status: A population-based intervention study. J. Nutr. Health Aging 2014, 18, 54–58. [Google Scholar] [CrossRef] [PubMed]
- Gariballa, S.; Forster, S.; Walters, S.; Powers, H. A randomized, double-blind, placebo-controlled trial of nutritional supplementation during acute illness. Am. J. Med. 2006, 119, 693–699. [Google Scholar] [CrossRef] [PubMed]
- Snider, J.T.; Jena, A.B.; Linthicum, M.T.; Hegazi, R.A.; Partridge, J.S.; LaVallee, C.; Lakdawalla, D.N.; Wischmeyer, P.E. Effect of hospital use of oral nutritional supplementation on length of stay, hospital cost, and 30-day readmissions among Medicare patients with COPD. Chest 2015, 147, 1477–1484. [Google Scholar] [CrossRef] [PubMed]
- Byun, S.E.; Shon, H.C.; Kim, J.W.; Kim, H.K.; Sim, Y. Risk factors and prognostic implications of aspiration pneumonia in older hip fracture patients: A multicenter retrospective analysis. Geriatr. Gerontol. Int. 2019, 19, 119–123. [Google Scholar] [CrossRef]
- Romanos-Nanclares, A.; Zazpe, I.; Santiago, S.; Marin, L.; Rico-Campa, A.; Martin-Calvo, N. Influence of parental healthy-eating attitudes and nutritional knowledge on nutritional adequacy and diet quality among preschoolers: The SENDO Project. Nutrients 2018, 10. [Google Scholar] [CrossRef]
- Slatyer, S.; Toye, C.; Popescu, A.; Young, J.; Matthews, A.; Hill, A.; Williamson, D.J. Early re-presentation to hospital after discharge from an acute medical unit: Perspectives of older patients, their family caregivers and health professionals. J. Clin. Nurs. 2013, 22, 445–455. [Google Scholar] [CrossRef]
- Tappenden, K.A.; Quatrara, B.; Parkhurst, M.L.; Malone, A.M.; Fanjiang, G.; Ziegler, T.R. Critical role of nutrition in improving quality of care: An interdisciplinary call to action to address adult hospital malnutrition. J. Acad. Nutr. Diet. 2013, 113, 1219–1237. [Google Scholar] [CrossRef]
- Mole, L.; Kent, B.; Abbott, R.; Wood, C.; Hickson, M. The nutritional care of people living with dementia at home: A scoping review. Health Soc. Care Community 2018, 26, 485–496. [Google Scholar] [CrossRef]
- World Medical Association. World Medical Association Declaration of Helsinki: Ethical principles for medical research involving human subjects. JAMA 2013, 310, 2191–2194. [Google Scholar] [CrossRef]
- Carrazco-Pena, K.B.; Tene, C.E.; Elizalde, A.M. Family dysfunction and malnutrition in the elderly. Revista Medica del Instituto Mexicano del Seguro Social 2015, 53, 14–19. [Google Scholar] [PubMed]
- Phillips, M.B.; Foley, A.L.; Barnard, R.; Isenring, E.A.; Miller, M.D. Nutritional screening in community-dwelling older adults: A systematic literature review. Asia Pac. J. Clin. Nutr. 2010, 19, 440–449. [Google Scholar] [PubMed]
- Kaiser, M.J.; Bauer, J.M.; Ramsch, C.; Uter, W.; Guigoz, Y.; Cederholm, T.; Thomas, D.R.; Anthony, P.; Charlton, K.E.; Maggio, M.; et al. Validation of the mini nutritional assessment short-form (MNA-SF): A practical tool for identification of nutritional status. J. Nutr. Health Aging 2009, 13, 782–788. [Google Scholar] [CrossRef] [PubMed]
- Pan, W.H.; Yeh, W.T.; Chen, H.J.; Chuang, S.Y.; Chang, H.Y.; Chen, L.; Wahlqvist, M.L. The U-shaped relationship between BMI and all-cause mortality contrasts with a progressive increase in medical expenditure: A prospective cohort study. Asia Pac. J. Clin. Nutr. 2012, 21, 577–587. [Google Scholar]
- Feijo, P.M.; Rodrigues, V.D.; Viana, M.S.; Dos Santos, M.P.; Abdelhay, E.; Viola, J.P.; de Pinho, N.B.; Martucci, R.B. Effects of omega-3 supplementation on the nutritional status, immune, and inflammatory profiles of gastric cancer patients: A randomized controlled trial. Nutrition 2018, 61, 125–131. [Google Scholar] [CrossRef]
- Heymsfield, S.B.; McManus, C.; Smith, J.; Stevens, V.; Nixon, D.W. Anthropometric measurement of muscle mass: Revised equations for calculating bone-free arm muscle area. Am. J. Clin. Nutr. 1982, 36, 680–690. [Google Scholar] [CrossRef]
- Lemmens, H.J.; Brodsky, J.B.; Bernstein, D.P. Estimating ideal body weight—A new formula. Obes. Surg. 2005, 15, 1082–1083. [Google Scholar] [CrossRef]
- Casey, P.H.; Goolsby, S.L.; Lensing, S.Y.; Perloff, B.P.; Bogle, M.L. The use of telephone interview methodology to obtain 24-h dietary recalls. J. Am. Diet. Assoc. 1999, 99, 1406–1411. [Google Scholar] [CrossRef]
- Hecker, J.; Prokopenko, D.; Lange, C.; Fier, H.L. PolyGEE: A generalized estimating equation approach to the efficient and robust estimation of polygenic effects in large-scale association studies. Biostatistics 2018, 19, 295–306. [Google Scholar] [CrossRef]
- Van Doorn-van Atten, M.N.; Haveman-Nies, A.; Pilichowski, P.; Roca, R.; de Vries, J.H.M.; de Groot, C. Telemonitoring to improve nutritional status in community-dwelling elderly: Design and methods for process and effect evaluation of a non-randomized controlled trial. BMC Geriatr. 2018, 18. [Google Scholar] [CrossRef]
- Hoogerduijn, J.G.; Schuurmans, M.J.; Duijnstee, M.S.; de Rooij, S.E.; Grypdonck, M.F. A systematic review of predictors and screening instruments to identify older hospitalized patients at risk for functional decline. J. Clin. Nurs. 2007, 16, 46–57. [Google Scholar] [CrossRef] [PubMed]
- Krzak, A.; Pleva, M.; Napolitano, L.M. Nutrition therapy for ALI and ARDS. Crit. Care Clin. 2011, 27, 647–659. [Google Scholar] [CrossRef] [PubMed]
- Martins, A.S.; Rezende, N.A.; Torres, H.O. Occurrence of complications and survival rates in elderly with neurological disorders undergoing enteral nutrition therapy. Revista da Associacao Medica Brasileira 2012, 58, 691–697. [Google Scholar] [PubMed]
- Gofferje, H.; Brand, O. The effect of combined parenteral-peroral nutrition on the protein status of undernourished elderly patients. Infusionstherapie und Klinische Ernahrung 1979, 6, 182–187. [Google Scholar] [PubMed]
- Barnett, J.B.; Hamer, D.H.; Meydani, S.N. Low zinc status: A new risk factor for pneumonia in the elderly? Nutr. Rev. 2010, 68, 30–37. [Google Scholar] [CrossRef] [PubMed]
- Wilson, M.M.; Purushothaman, R.; Morley, J.E. Effect of liquid dietary supplements on energy intake in the elderly. Am. J. Clin. Nutr. 2002, 75, 944–947. [Google Scholar] [CrossRef]
- Elsayh, K.I.; Sayed, D.M.; Zahran, A.M.; Saad, K.; Badr, G. Effects of pneumonia and malnutrition on the frequency of micronuclei in peripheral blood of pediatric patients. Int. J. Clin. Exp. Med. 2013, 6, 942–950. [Google Scholar]
- Fang, Y.Z.; Yang, S.; Wu, G. Free radicals, antioxidants, and nutrition. Nutrition 2002, 18, 872–879. [Google Scholar] [CrossRef]
- Natarajan, A.T. Chromosome aberrations: Past, present and future. Mutat. Res. 2002, 504, 3–16. [Google Scholar] [CrossRef]
- Gonzalez, C.; Najera, O.; Cortes, E.; Toledo, G.; Lopez, L.; Betancourt, M.; Ortiz, R. Susceptibility to DNA damage induced by antibiotics in lymphocytes from malnourished children. Teratog. Carcinog. Mutagen. 2002, 22, 147–158. [Google Scholar] [CrossRef]
- Kelaiditi, E.; Demougeot, L.; Lilamand, M.; Guyonnet, S.; Vellas, B.; Cesari, M. Nutritional status and the incidence of pneumonia in nursing home residents: Results from the INCUR study. J. Am. Med. Dir. Assoc. 2014, 15, 588–592. [Google Scholar] [CrossRef] [PubMed]

| Baseline Characteristics | Nutrition Intervention (NI) Group (n = 39) | Standard Care (SC) Group (n = 43) | p |
|---|---|---|---|
| Age (years old) | 80.9 ± 7.9 | 82.2 ± 7.7 | 0.453 |
| Gender | |||
| male/female | 35/4 | 31/12 | 0.044 * |
| Admission diagnosis number of people (%) | 0.930 | ||
| pneumonia, no pathogen | 32 (82.0%) | 32 (74.4%) | |
| bacterial pneumonia | 2 (5.1%) | 4 (9.3%) | |
| bronchopneumonia | 2 (5.1%) | 2 (4.6%) | |
| other pneumonia, no pathogen | 3 (7.7%) | 4 (9.3%) | |
| fever caused pneumonia | 0 (0.0%) | 1 (2.3%) | |
| Comorbidity Number (%) | |||
| COPD | 15 (38.4%) | 14 (32.5%) | 0.577 |
| DM | 13 (33.3%) | 14 (32.5%) | 0.941 |
| HTN | 26 (66.6%) | 24 (55.8%) | 0.314 |
| CVD | 8 (20.5%) | 6 (13.9%) | 0.430 |
| old stroke | 10 (25.6%) | 9 (20.9%) | 0.614 |
| dementia | 11 (28.2%) | 3 (6.9%) | 0.011 * |
| other lung diseases | 26 (66.6%) | 32 (74.4%) | 0.001 * |
| Anthropometry | NI Group | SC Group | p (Interaction) | p (Time) | p (Group) |
|---|---|---|---|---|---|
| BMI (kg/m2) | 0.345 | 0.010 * | 0.775 | ||
| T0 | 20.7 ± 3.4 | 20.1 ± 4.4 | |||
| T1 | 20.3 ± 3.1 | 19.8 ± 4.4 | |||
| T3 | 20.3 ± 3.1 | 20.3 ± 4.4 | |||
| T6 | 20.6 ± 3.1 | 21.8 ± 5.0 | |||
| TSF (mm) | 0.767 | 0.023 * | 0.450 | ||
| T0 | 15.0 ± 6.8 | 14.7 ± 6.5 | |||
| T1 | 13.8 ± 6.4 | 13.6 ± 6.5 | |||
| AC (cm) | 0.234 | <0.001 * | 0.417 | ||
| T0 | 23.1 ± 2.8 | 22.4 ± 3.2 | |||
| T1 | 22.6 ± 3.1 | 22.2 ± 3.4 | |||
| AMC (mm) | 0.205 | <0.001 * | 0.745 | ||
| T0 | 183.9 ± 29.0 | 180.8 ± 29.0 | |||
| T1 | 179.8 ± 30.9 | 178.7 ± 29.3 | |||
| AMA (mm2) | 0.236 | <0.001 * | 0.709 | ||
| T0 | 2757.6 ± 810.1 | 2667.1 ± 744.3 | |||
| T1 | 2647.4 ± 849.4 | 2607.9 ± 755.9 |
| Blood Analysis | NI Group | SC Group | p (Interaction) | p (Time) | p (Group) |
|---|---|---|---|---|---|
| Albumin (g/dL) | 0.953 | 0.082 | 0.071 | ||
| T0 | 2.7 ± 0.5 | 1.9 ± 0.4 | |||
| T1 | 2.1 ± 0.3 | 1.0 ± 0.3 | |||
| WBC (µL) | 0.054 | <0.001 * | 0.170 | ||
| T0 | 1132.8 ± 5519.6 | 1391.2 ± 7258.7 | |||
| T1 | 8681.6 ± 3564.6 | 8556.1 ± 3449.5 | |||
| Lym (%) | 0.108 | <0.001 * | 0.885 | ||
| T0 | 12.5 ± 6.8 | 11.2 ± 6.7 | |||
| T1 | 17.4 ± 9.1 | 18.5 ± 7.9 | |||
| TLC (cells/mm3) | 0.655 | 0.279 | 0.606 | ||
| T0 | 1284.6 ± 849.8 | 1432.0 ± 1199.8 | |||
| T1 | 1436.4 ± 924.3 | 1493.9 ± 803.3 |
| Three-Nutrient Intake | NI Group | SC Group | p (Interaction) | p (Time) | p (Group) |
|---|---|---|---|---|---|
| Protein (g/day) | 0.117 | <0.001 * | <0.001 * | ||
| T0 | 52.3 ± 15.2 | 48.2 ± 14.5 | |||
| T1 | 69.1 ± 10.2 | 56.5 ± 12.6 | |||
| T3 | 59.7 ± 14.4 | 51.8 ± 12.6 | |||
| T6 | 62.1 ± 10.5 | 51.3 ± 11.7 | |||
| Lipid (g/day) | 0.232 | <0.001 * | <0.001 * | ||
| T0 | 48.8 ± 19.0 | 44.0 ± 12.2 | |||
| T1 | 67.5 ± 23.3 | 53.7 ± 16.0 | |||
| T3 | 54.8 ± 19.6 | 44.2 ± 20.5 | |||
| T6 | 57.4 ± 16.7 | 45.1 ± 15.8 | |||
| Carbohydrate (g/day) | 0.116 | 0.811 | 0.255 | ||
| T0 | 183.4 ± 49.9 | 202.8 ± 111.1 | |||
| T1 | 197.8 ± 46.6 | 183.2 ± 47.5 | |||
| T3 | 187.3 ± 41.0 | 187.3 ± 41.0 | |||
| T6 | 203.1 ± 41.2 | 176.1 ± 40.2 |
© 2019 by the authors. Licensee MDPI, Basel, Switzerland. This article is an open access article distributed under the terms and conditions of the Creative Commons Attribution (CC BY) license (http://creativecommons.org/licenses/by/4.0/).
Share and Cite
Yang, P.-H.; Lin, M.-C.; Liu, Y.-Y.; Lee, C.-L.; Chang, N.-J. Effect of Nutritional Intervention Programs on Nutritional Status and Readmission Rate in Malnourished Older Adults with Pneumonia: A Randomized Control Trial. Int. J. Environ. Res. Public Health 2019, 16, 4758. https://doi.org/10.3390/ijerph16234758
Yang P-H, Lin M-C, Liu Y-Y, Lee C-L, Chang N-J. Effect of Nutritional Intervention Programs on Nutritional Status and Readmission Rate in Malnourished Older Adults with Pneumonia: A Randomized Control Trial. International Journal of Environmental Research and Public Health. 2019; 16(23):4758. https://doi.org/10.3390/ijerph16234758
Chicago/Turabian StyleYang, Pei-Hsin, Meng-Chih Lin, Yi-Ying Liu, Chia-Lun Lee, and Nai-Jen Chang. 2019. "Effect of Nutritional Intervention Programs on Nutritional Status and Readmission Rate in Malnourished Older Adults with Pneumonia: A Randomized Control Trial" International Journal of Environmental Research and Public Health 16, no. 23: 4758. https://doi.org/10.3390/ijerph16234758
APA StyleYang, P.-H., Lin, M.-C., Liu, Y.-Y., Lee, C.-L., & Chang, N.-J. (2019). Effect of Nutritional Intervention Programs on Nutritional Status and Readmission Rate in Malnourished Older Adults with Pneumonia: A Randomized Control Trial. International Journal of Environmental Research and Public Health, 16(23), 4758. https://doi.org/10.3390/ijerph16234758