Has the High-Tech Industry along the Belt and Road in China Achieved Green Growth with Technological Innovation Efficiency and Environmental Sustainability?


Abstract
:1. Introduction
2. Literature Review
- Some scholars have studied the TIE among different high-tech industries from the perspective of industry differences [13,14,15], while many others study the TIE of HTI from the perspective of regional differences [16] or compare the TIE of HTI at a provincial level in China [17,18], or focus on a particular province or city [19,20,21,22]. In recent years, however, scholars have paid more attention to the development of regional economies, research on the TIE of HTI in a certain economic zone has increased than ever before, especially for the Yangtze River economic belt and the Silk Road Economic Belt, and research on the TIE of regional HTI has increased [23,24,25].
- From the perspective of research content, scholars treated HTI’s innovation activities as black boxes in the past and the internal mechanism and transformation process of the HTI innovation system has not been clear. In recent years, with the increased understanding of the innovation process and value chain of HTI, scholars have begun to decompose the efficiency of different stages of technological innovation from the value chain perspective [26,27,28,29,30]. In addition, with the extensive attention of the international community on ecological and environmental issues, the environmental impact of technological innovation on enterprise has gradually received attention [31]. Compared with traditional technological innovation, enterprise should achieve sustainable development of technology, environment, and economy by saving energy and reducing pollutant emissions. Therefore, more scholars have begun to explore the environmental, economic, and social integration of sustainable TIE [32,33,34,35].
- From the perspective of research methods, parametric and nonparametric research methods are used in the study of TIE in HTI. Among them, the parametric method is based on the stochastic frontier analysis (SFA), but there is a deviation in the function model setting. The nonparametric method is based on data envelopment analysis (DEA). Some scholars suggest the two-stage DEA method to measure industrial TIE and its influencing factors, which makes up for the defects of the traditional DEA model [36,37]. The two-stage DEA model can analyze the influencing factors of TIE but still cannot eliminate the influences of environmental factors and random errors. Therefore, the three-stage DEA model, which eliminates the influences of environmental factors and random errors with the help of the SFA model, is increasingly being used by scholars [38]. However, the technological innovation process often leads to a loss of expected output (undesirable output), and ignoring this would significantly influence the innovation efficiency value. A small number of scholars consider the unexpected output when studying TIE in HTI [39]. Most of the above are static efficiency analyses, which cannot accurately reflect the dynamic change in TIE. Some scholars use the DEA–Malmquist model to decompose the change of TIE into technical efficiency change and technical progress and analyze the changing trends of TIE in HTI [40,41].
3. Model, Variables, and Data
3.1. Model
3.1.1. Directional Distance Function Model Considering Undesirable Output
3.1.2. Global Malmquist—Luenberger Index Method
3.1.3. Panel Data Tobit Regression Model
3.2. Variables
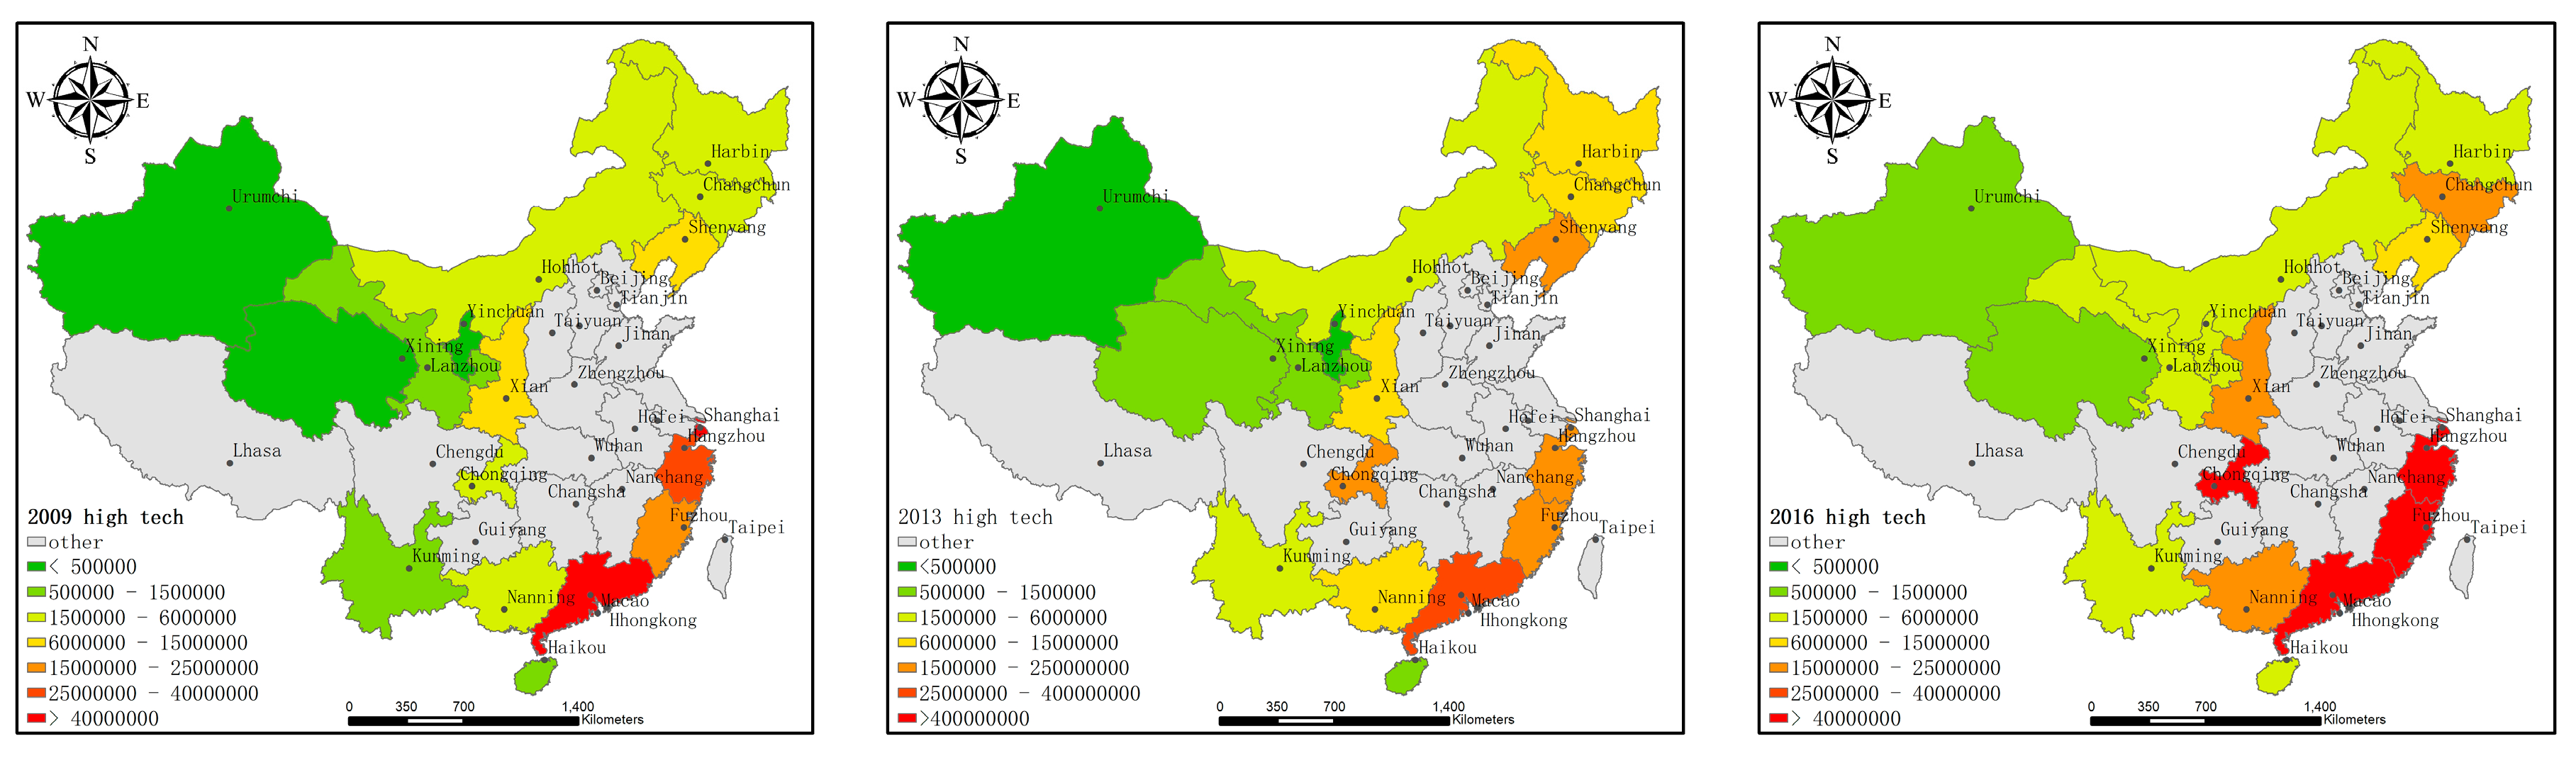
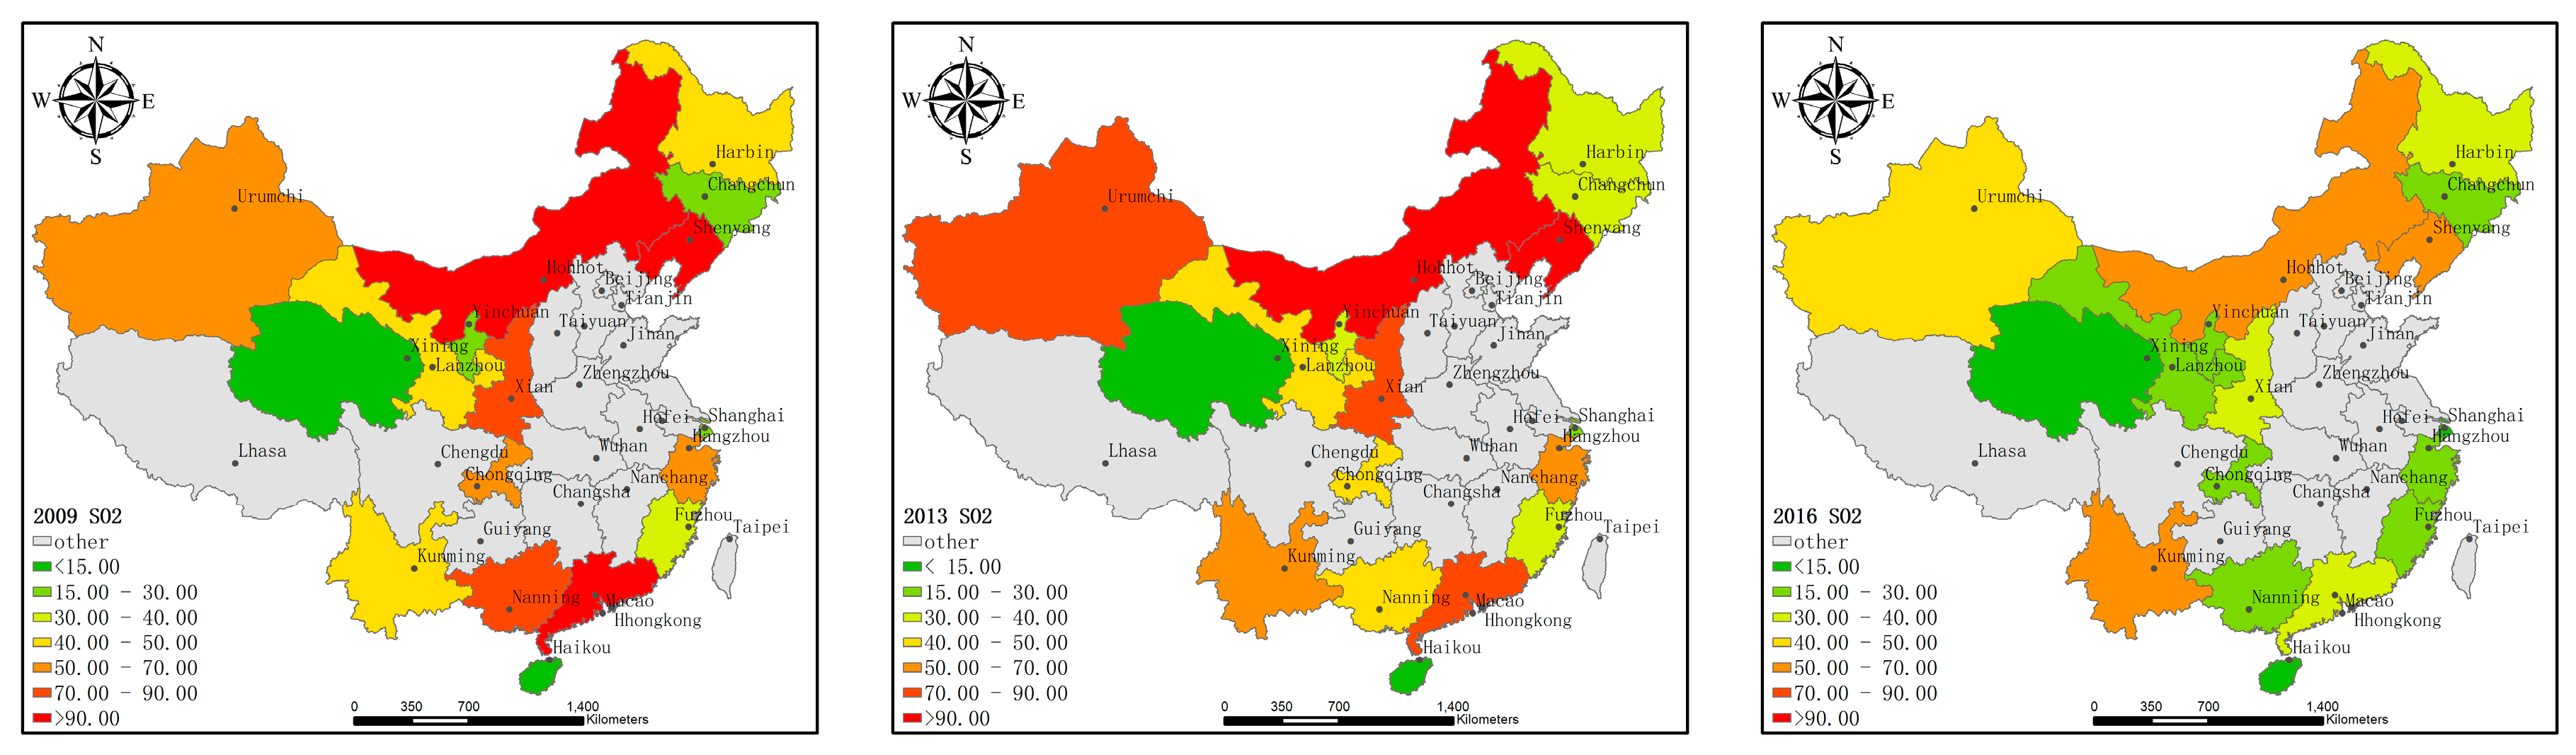
3.2.1. Input and Output Variables
3.2.2. Influencing Factors
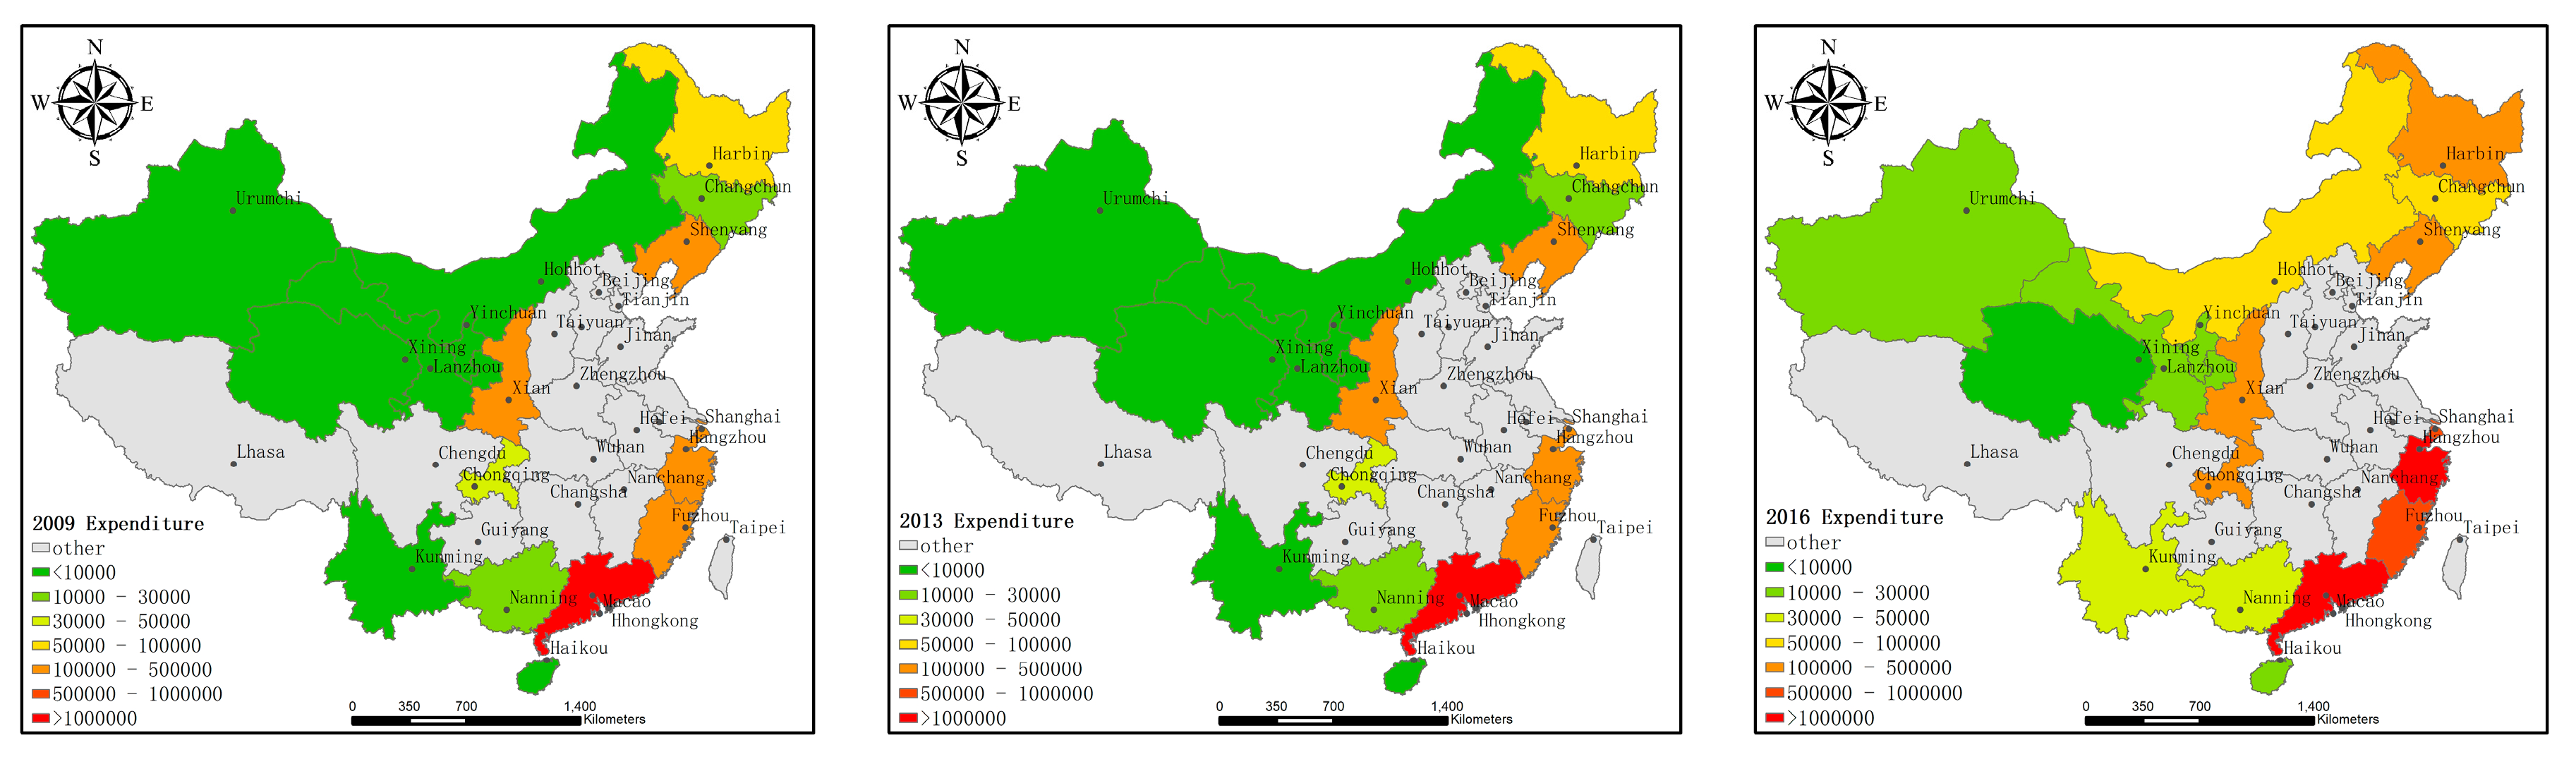
3.3. Data Source and Processing
4. Results and Discussion
4.1. Technological Innovation Efficiency
4.2. Analysis of Influencing Factors
- The impact of government financial support on the TIE is not significant. The government should play an auxiliary role, providing better policies and mechanisms to guide the technological innovation direction of HTI, rather than participating and investing in technological innovation and R&D. Companies with stronger R&D capabilities and greater demand for technological innovation are willing to invest more in R&D of new technologies and products rather than relying on government and financial institutions;
- The elasticity coefficient of R&D intensity is negative for the TIE and is significant at the 95% confidence level. This shows that the intensity of R&D has a significantly negative impact on the TIE. When the R&D intensity is too high, too much investment is likely to cause the waste of R&D resources. R&D results cannot be quickly converted into economic benefits; this may lead to an increase in technological innovation but too much of this will lead to a lower TIE. During the research period, it was observed that most industries were at a stage of higher technological progress and lower technical efficiency, and therefore, even when the R&D investment is increased, TIE cannot be improved. On the contrary, this may lead to the waste of investment in R&D resources, which could further lead to a decline in technical efficiency;
- The elasticity coefficient of the quality of laborers to the TIE is positive, and it is significant at the 95% confidence level, which indicates that the positive correlation between the quality of laborers and the TIE of HTI is significant. The higher the quality of R&D personnel in HTI, the easier it is to improve the TIE. Therefore, HTI should attach importance to and strengthen the introduction of talent;
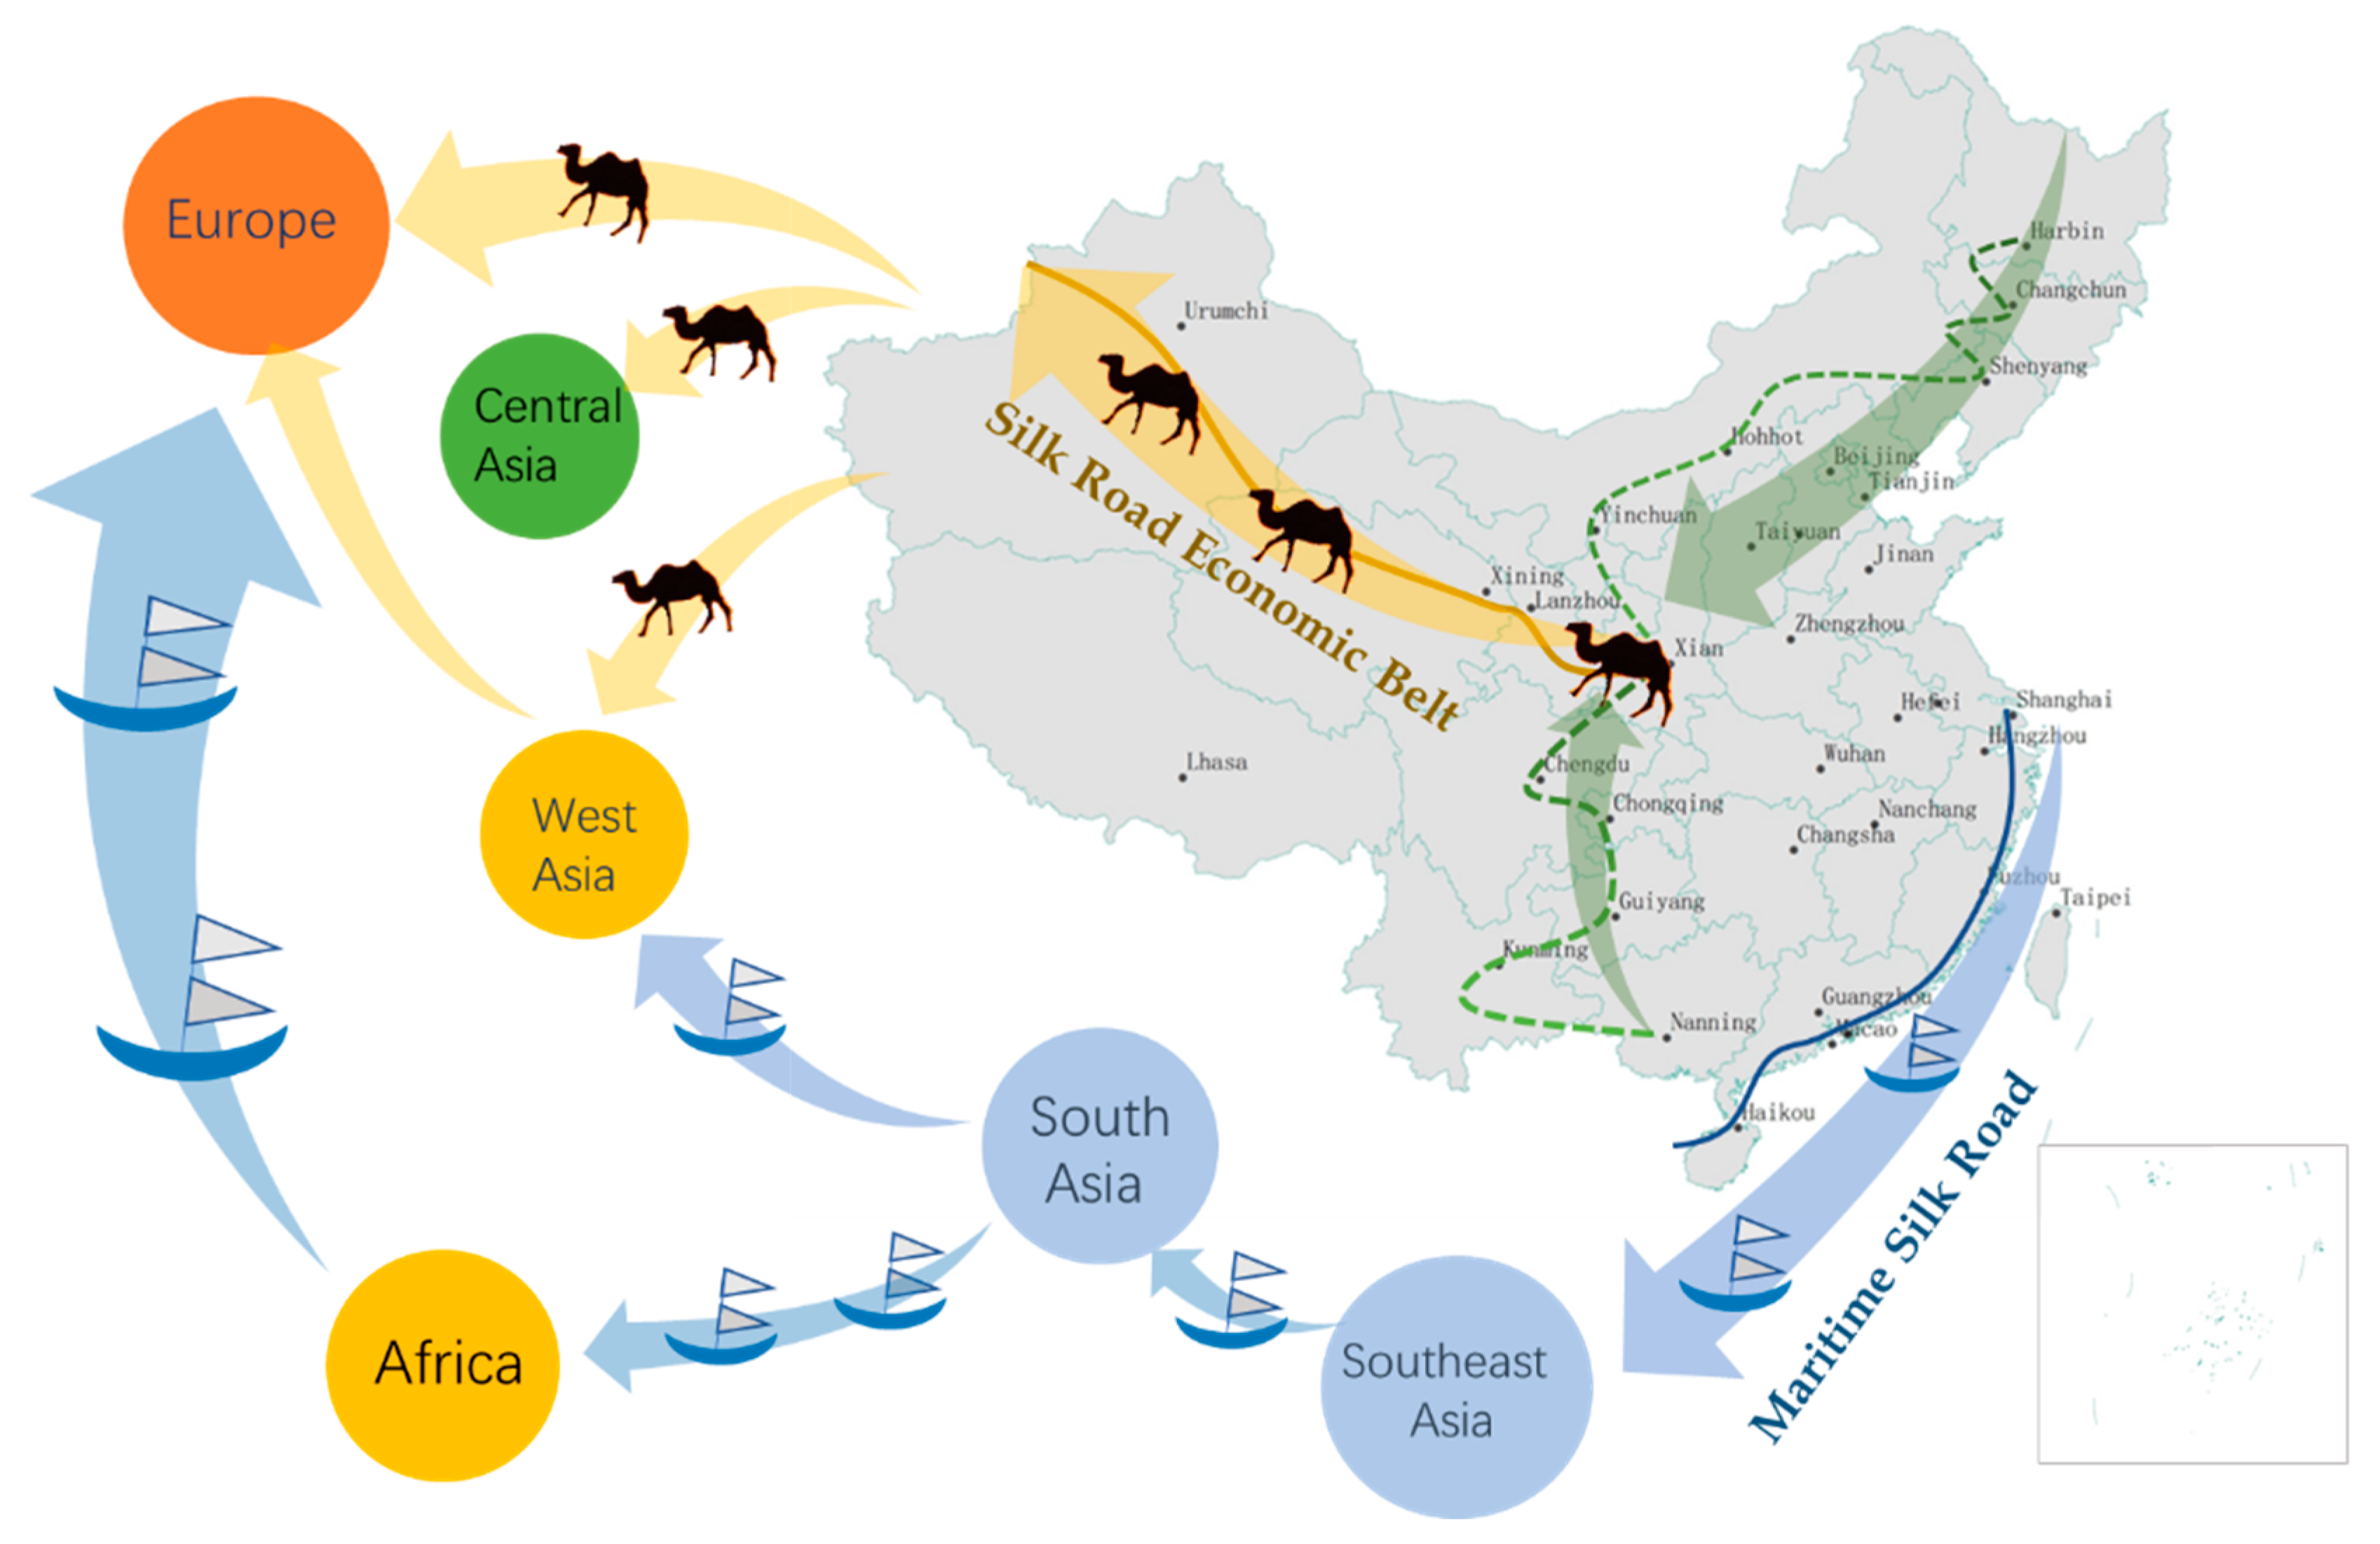
- The degree of openness to the outside world has a significant positive impact on the TIE. Openness can not only bring in funds but also introduces technology. In particular, the introduction of technology in HTI can significantly increase green technology innovation capabilities. The provinces and municipalities along the B&R have benefited from the “One Belt, One Road” strategy. Foreign trade can rapidly introduce advanced science and technology and management methods, with obvious advantages for technological innovation. Therefore, foreign trade can significantly promote the rise of TIE;
- The elasticity coefficient of environmental regulation on the TIE is positive and significant at the 99% confidence level. This shows that environmental regulation has a significant positive impact on the TIE. Reasonable and rigorous environmental regulation can promote technological innovation activities, in line with the Potter effect in economics. The government’s environmental regulation can guide HTI to enhance technological innovation while considering the constraints of environmental pollution emissions. The more effective environmental regulations are, the higher the TIE, which considers undesirable environmental outputs.
5. Conclusions, Policy Implications, and Limitations
5.1. Main Conclusions
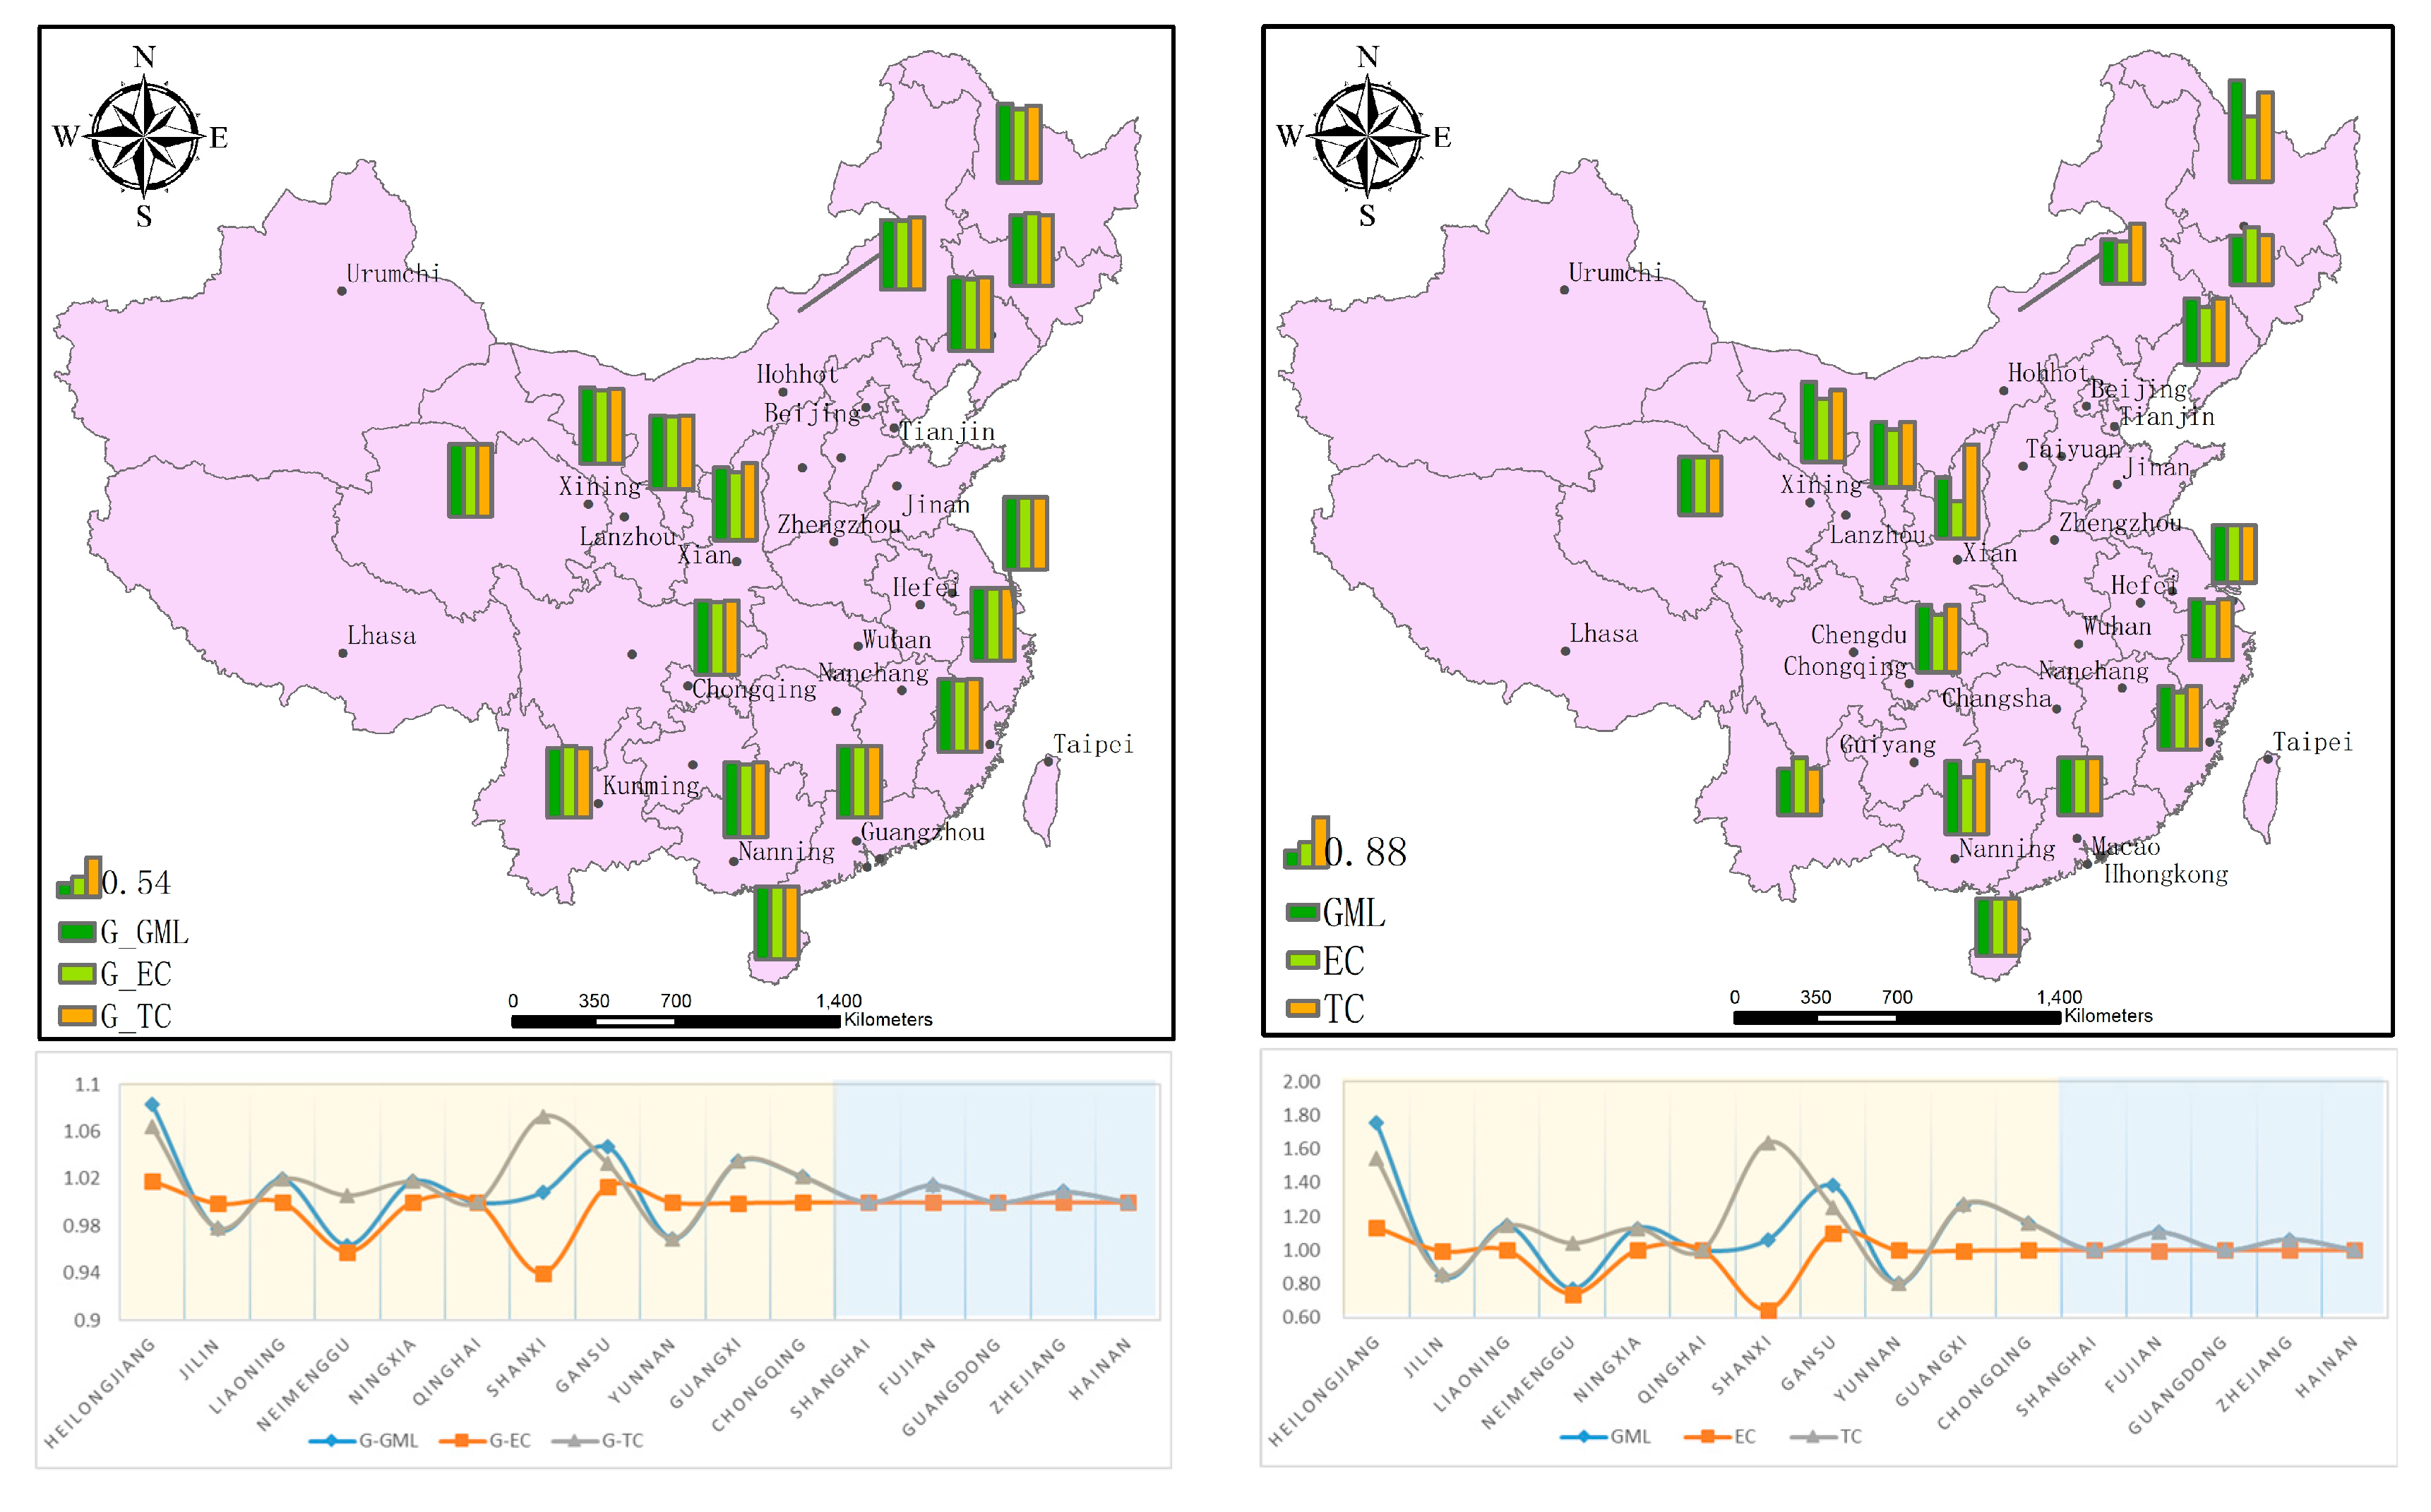
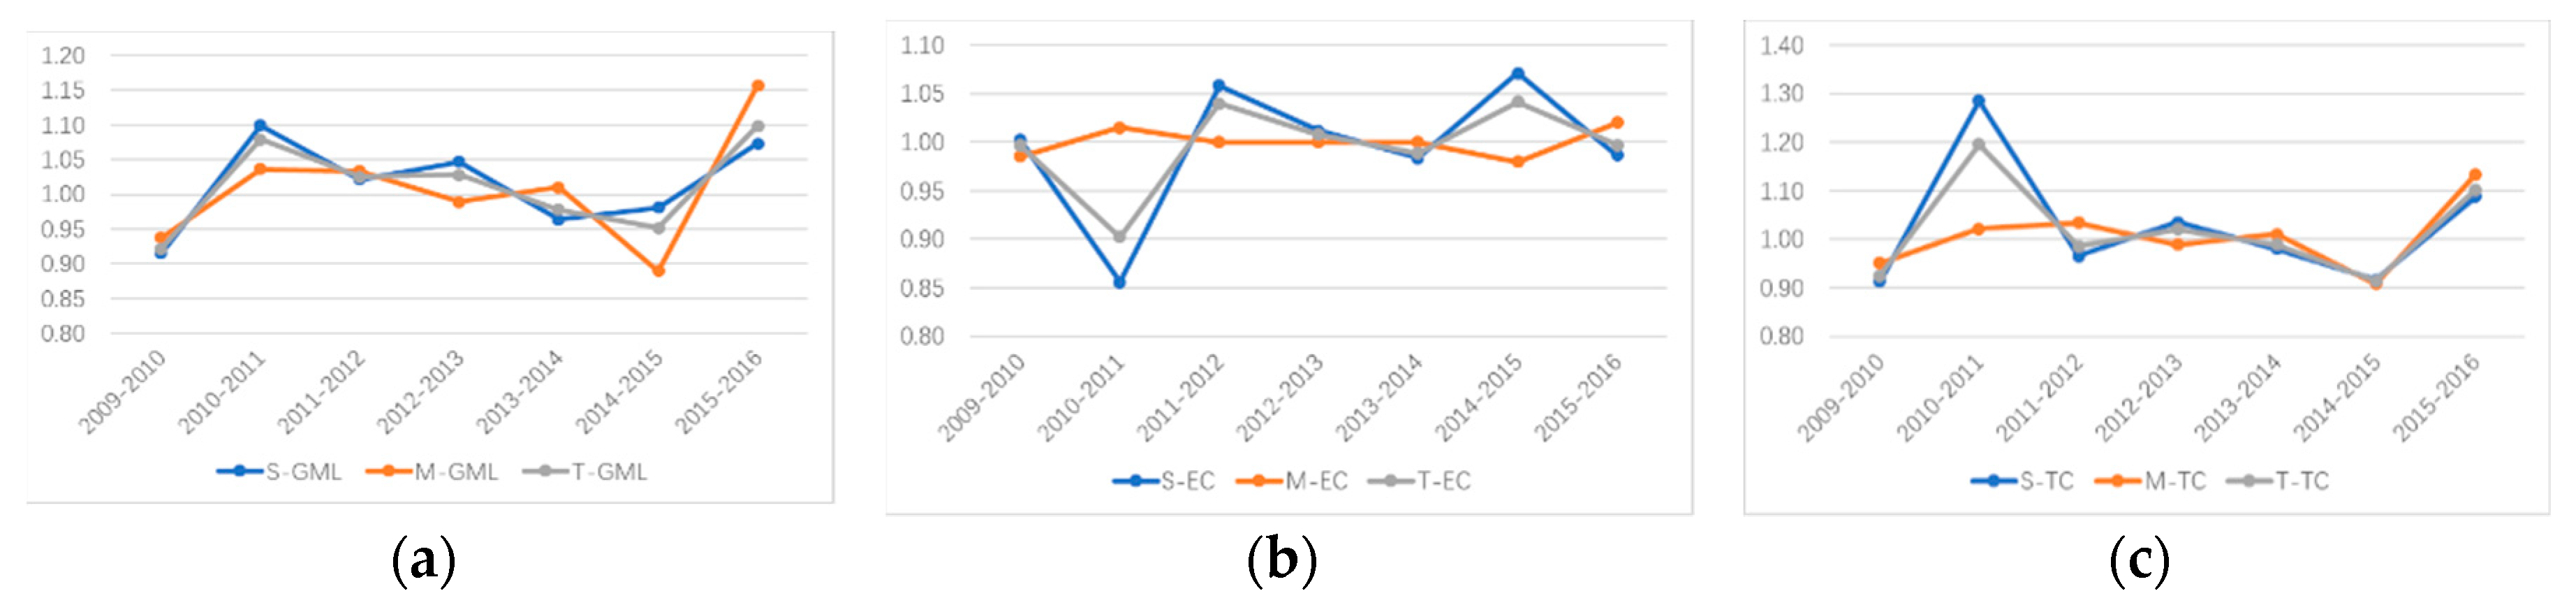
- In general, between 2009 and 2016, with environmental immersion as the undesirable output, the TIE of the HTI along the B&R fluctuated, however, it showed a rising trend. The overall TIE showed that the HTI along the B&R had not yet achieved green growth. The results of the TIE decomposition show that the increase in TIE was mainly brought about by technological progress and that the decline in technical efficiency hindered the improvement of TIE. This indicates that during the study period, HTI along the B&R generally attached importance to R&D and investment in technological innovation, ignoring the problem of input and output resource allocation, which resulted in excessive R&D capital investment and waste of R&D resources. Therefore, HTI should actively adjust the innovation structure and model, attach importance to the waste of scientific research resources, and accelerate the commercialization and marketization of technological achievements;
- From the perspective of geography, the TIE of HTI along the Silk Road Economic Belt from 2009 to 2016 was higher than that of the Maritime Silk Road. This improvement was brought about by technological advancement and an inefficient allocation of resources. The utilization rate of innovation resources was low, and the cost of resource consumption and environmental pollutant emissions was higher than economic benefits. However, combined with the results of time-series data, the TIE of HTI along the Silk Road Economic Belt and the Maritime Silk Road Economic Belt also fell sharply, with the turning point between 2014 and 2015. However, it rose sharply in 2015–2016, and this fluctuation was mainly because of technological progress. This shows that high-tech enterprises were affected by the promotion and implementation of the B&R initiative and the innovation-driven strategy proposed by China in 2013–2014 and that the development mode of technological innovation was constantly adjusted. The improvement in TIE during 2015–2016 was high, which shows that the technology industry successfully adjusted the technological innovation and economic development model and began to shift to the sustainable green development of TIE, environment, and economy;
- Considering the influencing factors, the results from the 2009–2016 study period show that the government’s direct funding support had no impact on the improvement of technological innovation in HTI. On the contrary, the government’s regulation of environmental pollution can significantly affect the efficiency of industrial technology innovation. The higher the level of R&D personnel in HTI, the more helpful it is to improve the TIE. Therefore, HTI should pay attention to cultivating and introducing high-tech talents. Additionally, TIE can be promoted by strengthening cooperation with other countries along the B&R and increasing the amount of foreign trade in HTI.
5.2. Policy Implications
5.3. Limitations
Author Contributions
Funding
Acknowledgments
Conflicts of Interest
References
- Song, M.; Peng, J.; Wang, J.; Dong, L. Better resource management: An improved resource and environmental efficiency evaluation approach that considers undesirable outputs. Resour. Conserv. Recycl. 2018, 128, 197–205. [Google Scholar] [CrossRef]
- Luo, Y.; Li, Q.; Yang, K.; Xie, W.; Zhou, X.; Shang, C.; Xu, Y.; Zhang, Y.; Zhang, C. Thermodynamic analysis of air-ground and water-ground energy exchange process in urban space at micro scale. Sci. Total Environ. 2019, 694, 133612. [Google Scholar]
- Bowen, A.; Fankhauser, S. The Green Growth Narrative: Paradigm Shift or Just Spin. Glob. Environ. Chang. 2011, 21, 1157–1159. [Google Scholar] [CrossRef]
- OECD. Towards Green Growth. 2011. Available online: http://www.oecd.org/dataoecd/37/34/48224539.pdf (accessed on 16 June 2013).
- UNEP (2011a): Towards a GREEN economy. Pathways to Sustainable Development and Poverty 862 Eradication. Available online: http://www.unep.org/greeneconomy/Portals/88/documents/ger/ger_final_dec_2011/Green%864 20EconomyReport_Final_Dec2011.pdf (accessed on 16 June 2013).
- World Bank (2012): Inclusive Green Growth. The Pathway to Sustainable Development. Available online: https://openknowledge.worldbank.org/bitstream/handle/10986/6058/9780821395516.pdf?se894quence=1 (accessed on 23 June 2013).
- Jakob, M.; Edenhofer, O. Green growth, degrowth, and the commons. Oxf. Rev. Econ. Policy 2014, 30, 447–468. [Google Scholar] [CrossRef]
- Porter, M.E.; Van der Linde, C. Green and competitive: Ending the stalemate. Harv. Bus. Rev. 1995, 73, 120–134. [Google Scholar]
- De Miguel, C.; Pazó, C. Environmental protection, innovation and price-setting behavior in Spanish manufacturing firms. Energy Econ. 2017, 68, 116–124. [Google Scholar] [CrossRef]
- Debnath, S.C. Environmental regulations become restriction or a cause for innovation—A case study of Toyota Prius and Nissan Leaf. Procedia Soc. Behav. Sci. 2015, 195, 324–333. [Google Scholar] [CrossRef]
- Wang, J.; Ye, X.; Wei, Y.D. Effects of Agglomeration, Environmental Regulations, and Technology on Pollutant Emissions in China: Integrating Spatial, Social, and Economic Network Analyses. Sustainability 2019, 11, 363. [Google Scholar] [CrossRef]
- Liu, Z.; Chen, X.; Chu, J.; Zhu, Q. Industrial development environment and innovation efficiency of high-tech industry: Analysis based on the framework of innovation systems. Technol. Anal. Strateg. Manag. 2018, 30, 434–446. [Google Scholar] [CrossRef]
- Sun, C.H.; Kalirajan, K.P. Gauging the sources of growth of high-tech and low-tech industries. The case of Korean manufacturing. Aust. Econ. Pap. 2005, 44, 170–185. [Google Scholar] [CrossRef]
- Lin, Y.Y.; Deng, N.Q.; Gao, H.L. Research on Technological Innovation Efficiency of Tourist Equipment Manufacturing Enterprises. Sustainability 2018, 10, 4826. [Google Scholar] [CrossRef]
- Feng, F.; Ma, L.; Zhang, L. Research on Efficiency of China’s S&T Input-Output in Two-stage Chain Perspective: Based on the Data from 17 Sub-industries of High-Tech Industry. Sci. Sci. Manag. 2011, 10, 21–26. [Google Scholar]
- Segarra-Blasco, A. Innovation and productivity in manufacturing and service firms in Catalonia: A regional approach. Econ. Innov. New Technol. 2010, 19, 233–258. [Google Scholar] [CrossRef]
- Fan, D.C.; Li, S.N. Research on R&D innovation efficiency of regional high-tech industry considering spatial effect. In Proceedings of the International Conference on Management Science and Engineering (ICMSE), Guangxi, China, 18–20 August 2017. [Google Scholar] [CrossRef]
- Li, L.B.; Liu, B.L.; Liu, W.L.; Chiu, Y.H. Efficiency evaluation of the regional high-tech industry in China: A new framework based on meta-frontier dynamic DEA analysis. Socio Econ. Plan. Sci. 2017, 60, 24–33. [Google Scholar] [CrossRef]
- Feng, Y.; Teng, J. Evaluation on technology innovation efficiency of high-tech industry in Jiangsu Province. Sci. Sci. Manag. 2010, 8, 107–112. [Google Scholar]
- Li, H.; Zhang, J.X.; Wang, C.; Wang, Y.J. Vaughan Coffey. An Evaluation of the Impact of Environmental Regulation on the Efficiency of Technology Innovation Using the Combined DEA Model: A Case Study of Xi’an, China. Sustain. Cities Soc. 2018, 42, 355–369. [Google Scholar] [CrossRef]
- Ji, R.J.; Wang, H.D. Evaluating technological innovation efficiency of high-tech industry in Tianjin based on DEA model. In Proceedings of the International Conference on Business Management and Electronic Information, Guangzhou, China, 13–15 May 2011. [Google Scholar] [CrossRef]
- Zhang, J.Q. An empirical analysis on influencing factor of innovation efficiency of beijing high-tech industry. In Proceedings of the International Conference on Information Management, Innovation Management and Industrial Engineering, Shenzhen, China, 26–27 November 2011. [Google Scholar] [CrossRef]
- Wei, F.Q.; Huang, Z.X. Research on efficiency variation of high-tech industries based on malmquist approach-empirical research on Jiangsu, Zhejiang, Shanghai, Beijing, Guangdong and Shandong. In Proceedings of the International Conference on Multimedia Technology, Ningbo, China, 29–31 October 2010. [Google Scholar] [CrossRef]
- Caijun, W.; Gennian, T. Spatial Agglomeration, Congestion of Production Factors and the Forewarning for the Manufacturing Industry Agglomeration Suitability in Yangtze River Delta. Stat. Res. 2011, 2, 59–64. [Google Scholar]
- Feng, F.; Zhou, N.; Zhang, L.Y.; Du, Y.N.; Ma, L. Research on the Performance Evaluation and S&T Resources Allocation of High-Tech Industry of China: Evidence Based on Three Different Economic Regions. Int. J. Bus. Manag. 2013. [Google Scholar] [CrossRef]
- Yao, L.; Liao, L. Efficiency research on ecological technology innovation of enterprises in view of low carbon strategy based on two-stage chain DEA model and Tobit regression, Modelling. Meas. Control D 2015, 36, 10–31. [Google Scholar]
- Zhang, J.; Liu, Y.; Chang, Y.; Zhang, L. Industrial eco-efficiency in China: A provincial quantification using three-stage data envelopment analysis. J. Clean. Prod. 2017, 143, 238–249. [Google Scholar] [CrossRef]
- Brown, R.; Mason, C. Inside the high-tech black box: A critique of technology entrepreneurship policy. Technovation 2014, 34, 773–784. [Google Scholar] [CrossRef]
- Fu, Q.; Ma, Y. Double-Efficiency Research of Technological Innovation of High-tech Industry in China Based on Value Chain. Sci. Sci. Manag. 2011, 8, 93–97. [Google Scholar]
- Chen, X.; Liu, Z.; Zhu, Q. Performance evaluation of China’s high-tech innovation process: Analysis based on the innovation value chain. Technovation 2018, 74, 42–53. [Google Scholar] [CrossRef]
- Zhu, Y.; Wang, Z.; Qiu, S.; Zhu, L. Effects of environmental regulations on technological innovation efficiency in China’s industrial enterprises: A spatial analysis. Sustainability 2019, 11, 2186. [Google Scholar] [CrossRef]
- Zhang, J.; Chang, Y.; Wang, C.; Zhang, L. The green efficiency of industrial sectors in China: A comparative analysis based on sectoral and supply-chain quantifications. Resour. Conserv. Recycl. 2018, 132, 269–277. [Google Scholar] [CrossRef]
- Miao, C.; Fang, D.; Sun, L.; Luo, Q. Natural resources utilization efficiency under the influence of green technological innovation. Resour. Conserv. Recycl. 2017, 126, 153–161. [Google Scholar] [CrossRef]
- Schiederig, T.; Tietze, F.; Herstatt, C. Green innovation in technology and innovation management—An exploratory literature review. R&D Manag. 2012, 42, 180–192. [Google Scholar]
- Li, W.; Bi, K.; Sun, B. Research on the effect of environmental regulation intensity on green technological innovation of pollution intensive industries—Empirical test based on panel data of 2003–2010. R&D Manag. 2013, 25, 72–81. [Google Scholar]
- Zhu, Y.W.; Xu, K.N. The Empirical Research on R&D Efficiency of Chinese High-tech Industries. China Ind. Econ. 2006, 11, 38–45. [Google Scholar]
- Jing, H. An empirical analysis on China’s high-technology industry innovation efficiency based on SFA. Stud. Sci. Sci. 2010, 3, 021. [Google Scholar]
- Li, T.; Liang, L.; Han, D. Research on the Efficiency of Green Technology Innovation in China’s Provincial High-End Manufacturing Industry Based on the RAGA-PP-SFA Model. Math. Probl. Eng. 2018, 1–13. [Google Scholar] [CrossRef]
- Lv, C.L. An Empirical study of technology innovation efficiency of regional high-tech industry based on DEA-Malmquist Index Approach. In Proceedings of the International Conference on Management and Service Science, Bangkok, Thailand, 7–9 May 2011. [Google Scholar] [CrossRef]
- Dai, F.Q.; Liu, G.C. R&D efficiency and productivity growth: A Malmquist index analysis of High-Tech industries in China. In Proceedings of the 2009 International Conference on Management Science and Engineering, Moscow, Russia, 14–16 September 2009. [Google Scholar] [CrossRef]
- Emrouznejad, A.; Yang, G.L. A framework for measuring global Malmquist–Luenberger productivity index with CO2 emissions on Chinese manufacturing industries. Energy 2016, 115, 840–856. [Google Scholar] [CrossRef]
- Färe, R.; Grosskopf, S.; Pasurka, C.A., Jr. Environmental production functions and environmental directional distance functions. Energy 2007, 32, 1055–1066. [Google Scholar] [CrossRef]
- Chung, Y.H.; Färe, R.; Grosskopf, S. Productivity and undesirable outputs: A directional distance function approach. J. Environ. Manag. 1997, 51, 229–240. [Google Scholar] [CrossRef]
- Oh, D.H. A global Malmquist-Luenberger productivity index. J. Product. Anal. 2010, 34, 183–197. [Google Scholar] [CrossRef]
- Amemiya, T. Tobit models: A survey. J. Econ. 1984, 24, 3–61. [Google Scholar] [CrossRef]
- Amemiya, T. Tobit models. In Advanced Econometrics; Basil Blackwell: Oxford, UK, 1985; pp. 360–411. ISBN 0-631-13345-3. [Google Scholar]
- Gouriéroux, C. The Tobit model. In Econometrics of Qualitative Dependent Variables; Cambridge University Press: New York, NY, USA, 2000; pp. 170–207. ISBN 0-521-58985-1. [Google Scholar]
- Guan, J.; Chen, K. Measuring the innovation production process: A cross-region empirical study of China’s high-tech innovations. Technovation 2010, 30, 348–358. [Google Scholar] [CrossRef]
- Liu, K. Researches on the Inter-Provincial R&D Innovation Efficiency for Chinese High-Tech Industry. Mod. Econ. 2016, 7, 921. [Google Scholar]
- Yan, G.; Sun, Q.; Chen, C.; Zhong, H.; Ren, J. Research on the Evaluation Indicator System for Innovation Level in Chinese National Hi-tech Industrial Development Zone. China Soft Sci. 2008, 4, 141–148. [Google Scholar]
- Shi, W.L. Analysis and evaluation of innovation efficiency in the national hi-tech zone based on DEA. In Proceedings of the International Conference on Machine Learning and Cybernetics, Qingdao, China, 11–14 July 2010. [Google Scholar] [CrossRef]
- Huang-Bao, G. Innovation efficiency and its influencing factors of China’s high-tech industry based on the spatial econometric model. Econ. Geogr. 2014, 34, 100–107. [Google Scholar]
- Li, H.W.; Ren, N.; Tao, M. Research on the influencing factors analysis of the input-output efficiency of the High-tech industries. In Proceedings of the IEEE International Conference on Grey Systems and Intelligent Services, Nanjing, China, 15–18 September 2011. [Google Scholar] [CrossRef]
- Liu, Z.K.; Li, X. Has China’s belt and road initiative promoted its green total factor productivity? Evidence from primary provinces along the route. Energy Policy 2019, 129, 360–369. [Google Scholar] [CrossRef]
- CSY. National Bureau of Statistics of China. China Statistical Yearbook 2010; China Statistical Press: Beijing, China, 2010.
- CSY. National Bureau of Statistics of China. China Statistical Yearbook 2011; China Statistical Press: Beijing, China, 2011.
- CSY. National Bureau of Statistics of China. China Statistical Yearbook 2012; China Statistical Press: Beijing, China, 2012.
- CSY. National Bureau of Statistics of China. China Statistical Yearbook 2013; China Statistical Press: Beijing, China, 2013.
- CSY. National Bureau of Statistics of China. China Statistical Yearbook 2014; China Statistical Press: Beijing, China, 2014.
- CSY. National Bureau of Statistics of China. China Statistical Yearbook 2015; China Statistical Press: Beijing, China, 2015.
- CSY. National Bureau of Statistics of China. China Statistical Yearbook 2016; China Statistical Press: Beijing, China, 2016.
- CSY. National Bureau of Statistics of China. China Statistical Yearbook 2017; China Statistical Press: Beijing, China, 2017.


| Index | Variable Abbreviation | Measurement Method | Unit |
|---|---|---|---|
| Input | I1 | Full-time Equivalent | man-year |
| I2 | R&D Personnel | 10,000 yuans | |
| I3 | Intramural Expenditure on R&D | 10,000 people | |
| I4 | Expenditure on New Product Development | 10,000 yuans | |
| Expected Output | O1 | Patent Applications | piece |
| O2 | New Products | item | |
| O3 | Sales Revenue of New Products | 10,000 yuans | |
| Undesirable Output | O4 | Volume of Sulfur Dioxide Emission by Industry | 1000 ton |
| Variable Abbreviation | Variables | Measurement Method | Unit |
|---|---|---|---|
| GOV | Government Support | The funding of R&D comes from the government | 10,000 yuan |
| OPE | Economic openness degree | Import and export trade volume | 100 million yuan |
| RD | R&D intensity | The ratio of internal R&D expenditure to the main business income | % |
| LAB | Laborer’s Quality | The ratio of internal R&D expenditure to the main business income | % |
| ER | Environmental Regulation | Pollution control accounts for the proportion of GDP | % |
| Region | Cumulative Change Value | Geometric Mean | ||||
|---|---|---|---|---|---|---|
| GML | EC | TC | GML | EC | TC | |
| Heilongjiang | 1.7535 | 1.1355 | 1.5443 | 1.0835 | 1.0183 | 1.0641 |
| Jilin | 0.8516 | 0.9930 | 0.8576 | 0.9773 | 0.9990 | 0.9783 |
| Liaoning | 1.1462 | 1.0001 | 1.1462 | 1.0197 | 1.0000 | 1.0197 |
| Neimenggu | 0.7719 | 0.7404 | 1.0426 | 0.9637 | 0.9580 | 1.0060 |
| Ningxia | 1.1305 | 1.0000 | 1.1305 | 1.0177 | 1.0000 | 1.0177 |
| Qinghai | 0.9999 | 1.0000 | 0.9999 | 0.9999 | 1.0000 | 0.9999 |
| Shanxi | 1.0612 | 0.6478 | 1.6383 | 1.0085 | 0.9399 | 1.0731 |
| Gansu | 1.3828 | 1.1002 | 1.2569 | 1.0474 | 1.0137 | 1.0332 |
| Yunnan | 0.8039 | 0.9995 | 0.8039 | 0.9693 | 0.9999 | 0.9693 |
| Guangxi | 1.2686 | 0.9966 | 1.2729 | 1.0346 | 0.9995 | 1.0351 |
| Chongqing | 1.1635 | 1.0000 | 1.1635 | 1.0219 | 1.0000 | 1.0219 |
| Shanghai | 1.0000 | 1.0000 | 1.0000 | 1.0000 | 1.0000 | 1.0000 |
| Fujian | 1.1070 | 0.9991 | 1.1079 | 1.0146 | 0.9999 | 1.0147 |
| Guangdong | 1.0000 | 1.0000 | 1.0000 | 1.0000 | 1.0000 | 1.0000 |
| Zhejiang | 1.0651 | 1.0000 | 1.0651 | 1.0090 | 1.0000 | 1.0090 |
| Hainan | 1.0000 | 1.0000 | 1.0000 | 1.0000 | 1.0000 | 1.0000 |
| Silk Road Economic Belt | 1.1213 | 0.9536 | 1.1688 | 1.0125 | 0.9935 | 1.0194 |
| Maritime Silk Road | 1.0344 | 0.9998 | 1.0346 | 1.0047 | 1.0000 | 1.0047 |
| B&R | 1.0941 | 0.9678 | 1.1269 | 1.0101 | 0.9955 | 1.0148 |
| Period | Silk Road Economic Belt | Maritime Silk Road | Belt and Road | ||||||
|---|---|---|---|---|---|---|---|---|---|
| GML | EC | TC | GML | EC | TC | GML | EC | TC | |
| 2009–2010 | 0.9150 | 1.0019 | 0.9133 | 0.9374 | 0.9852 | 0.9514 | 0.921936 | 0.996678 | 0.925009 |
| 2010–2011 | 1.0991 | 0.8556 | 1.2845 | 1.0365 | 1.0150 | 1.0212 | 1.079127 | 0.902543 | 1.195652 |
| 2011–2012 | 1.0215 | 1.0581 | 0.9654 | 1.0335 | 1.0000 | 1.0335 | 1.025215 | 1.039587 | 0.986175 |
| 2012–2013 | 1.0467 | 1.0117 | 1.0346 | 0.9894 | 1.0000 | 0.9894 | 1.028431 | 1.008013 | 1.020256 |
| 2013–2014 | 0.9639 | 0.9838 | 0.9798 | 1.0101 | 1.0000 | 1.0101 | 0.978104 | 0.988834 | 0.989149 |
| 2014–2015 | 0.9811 | 1.0708 | 0.9162 | 0.8901 | 0.9800 | 0.9083 | 0.951709 | 1.041568 | 0.913727 |
| 2015–2016 | 1.0728 | 0.9864 | 1.0876 | 1.1570 | 1.0203 | 1.1340 | 1.098406 | 0.996844 | 1.101884 |
| Factors | Coef. | Std. Err. | z | p Value |
|---|---|---|---|---|
| GOV | −0.0747 | 0.05461 | −0.27 | 0.786 |
| OPE | 0.7417 ** | 0.3779 | 1.96 | 0.049 |
| RD | −4.726 ** | 2.1133 | −2.24 | 0.025 |
| LAB | 1.2008 ** | 0.5971 | 2.01 | 0.044 |
| ER | 4.53174 *** | 1.62105 | 2.80 | 0.005 |
| Wald chi2(5) = 15.11 Log likelihood = 47.41 Prob ≥ chi2 = 0.0098 LR test of sigma_u = 0: chibar2(01) = 68.85 Prob ≥ chibar2 = 0.000 | ||||
© 2019 by the authors. Licensee MDPI, Basel, Switzerland. This article is an open access article distributed under the terms and conditions of the Creative Commons Attribution (CC BY) license (http://creativecommons.org/licenses/by/4.0/).
Share and Cite
Li, C.; Li, M.; Zhang, L.; Li, T.; Ouyang, H.; Na, S. Has the High-Tech Industry along the Belt and Road in China Achieved Green Growth with Technological Innovation Efficiency and Environmental Sustainability? Int. J. Environ. Res. Public Health 2019, 16, 3117. https://doi.org/10.3390/ijerph16173117
Li C, Li M, Zhang L, Li T, Ouyang H, Na S. Has the High-Tech Industry along the Belt and Road in China Achieved Green Growth with Technological Innovation Efficiency and Environmental Sustainability? International Journal of Environmental Research and Public Health. 2019; 16(17):3117. https://doi.org/10.3390/ijerph16173117
Chicago/Turabian StyleLi, Chang, Mingyang Li, Lu Zhang, Tingyi Li, Hanzhen Ouyang, and Sanggyun Na. 2019. "Has the High-Tech Industry along the Belt and Road in China Achieved Green Growth with Technological Innovation Efficiency and Environmental Sustainability?" International Journal of Environmental Research and Public Health 16, no. 17: 3117. https://doi.org/10.3390/ijerph16173117
APA StyleLi, C., Li, M., Zhang, L., Li, T., Ouyang, H., & Na, S. (2019). Has the High-Tech Industry along the Belt and Road in China Achieved Green Growth with Technological Innovation Efficiency and Environmental Sustainability? International Journal of Environmental Research and Public Health, 16(17), 3117. https://doi.org/10.3390/ijerph16173117