Evaluation of Policies on Inappropriate Treatment of Dead Hogs from the Perspective of Loss Aversion

Abstract
:1. Introduction
2. Literature Review
3. Theoretical and Research Framework
3.1. Theoretical Framework
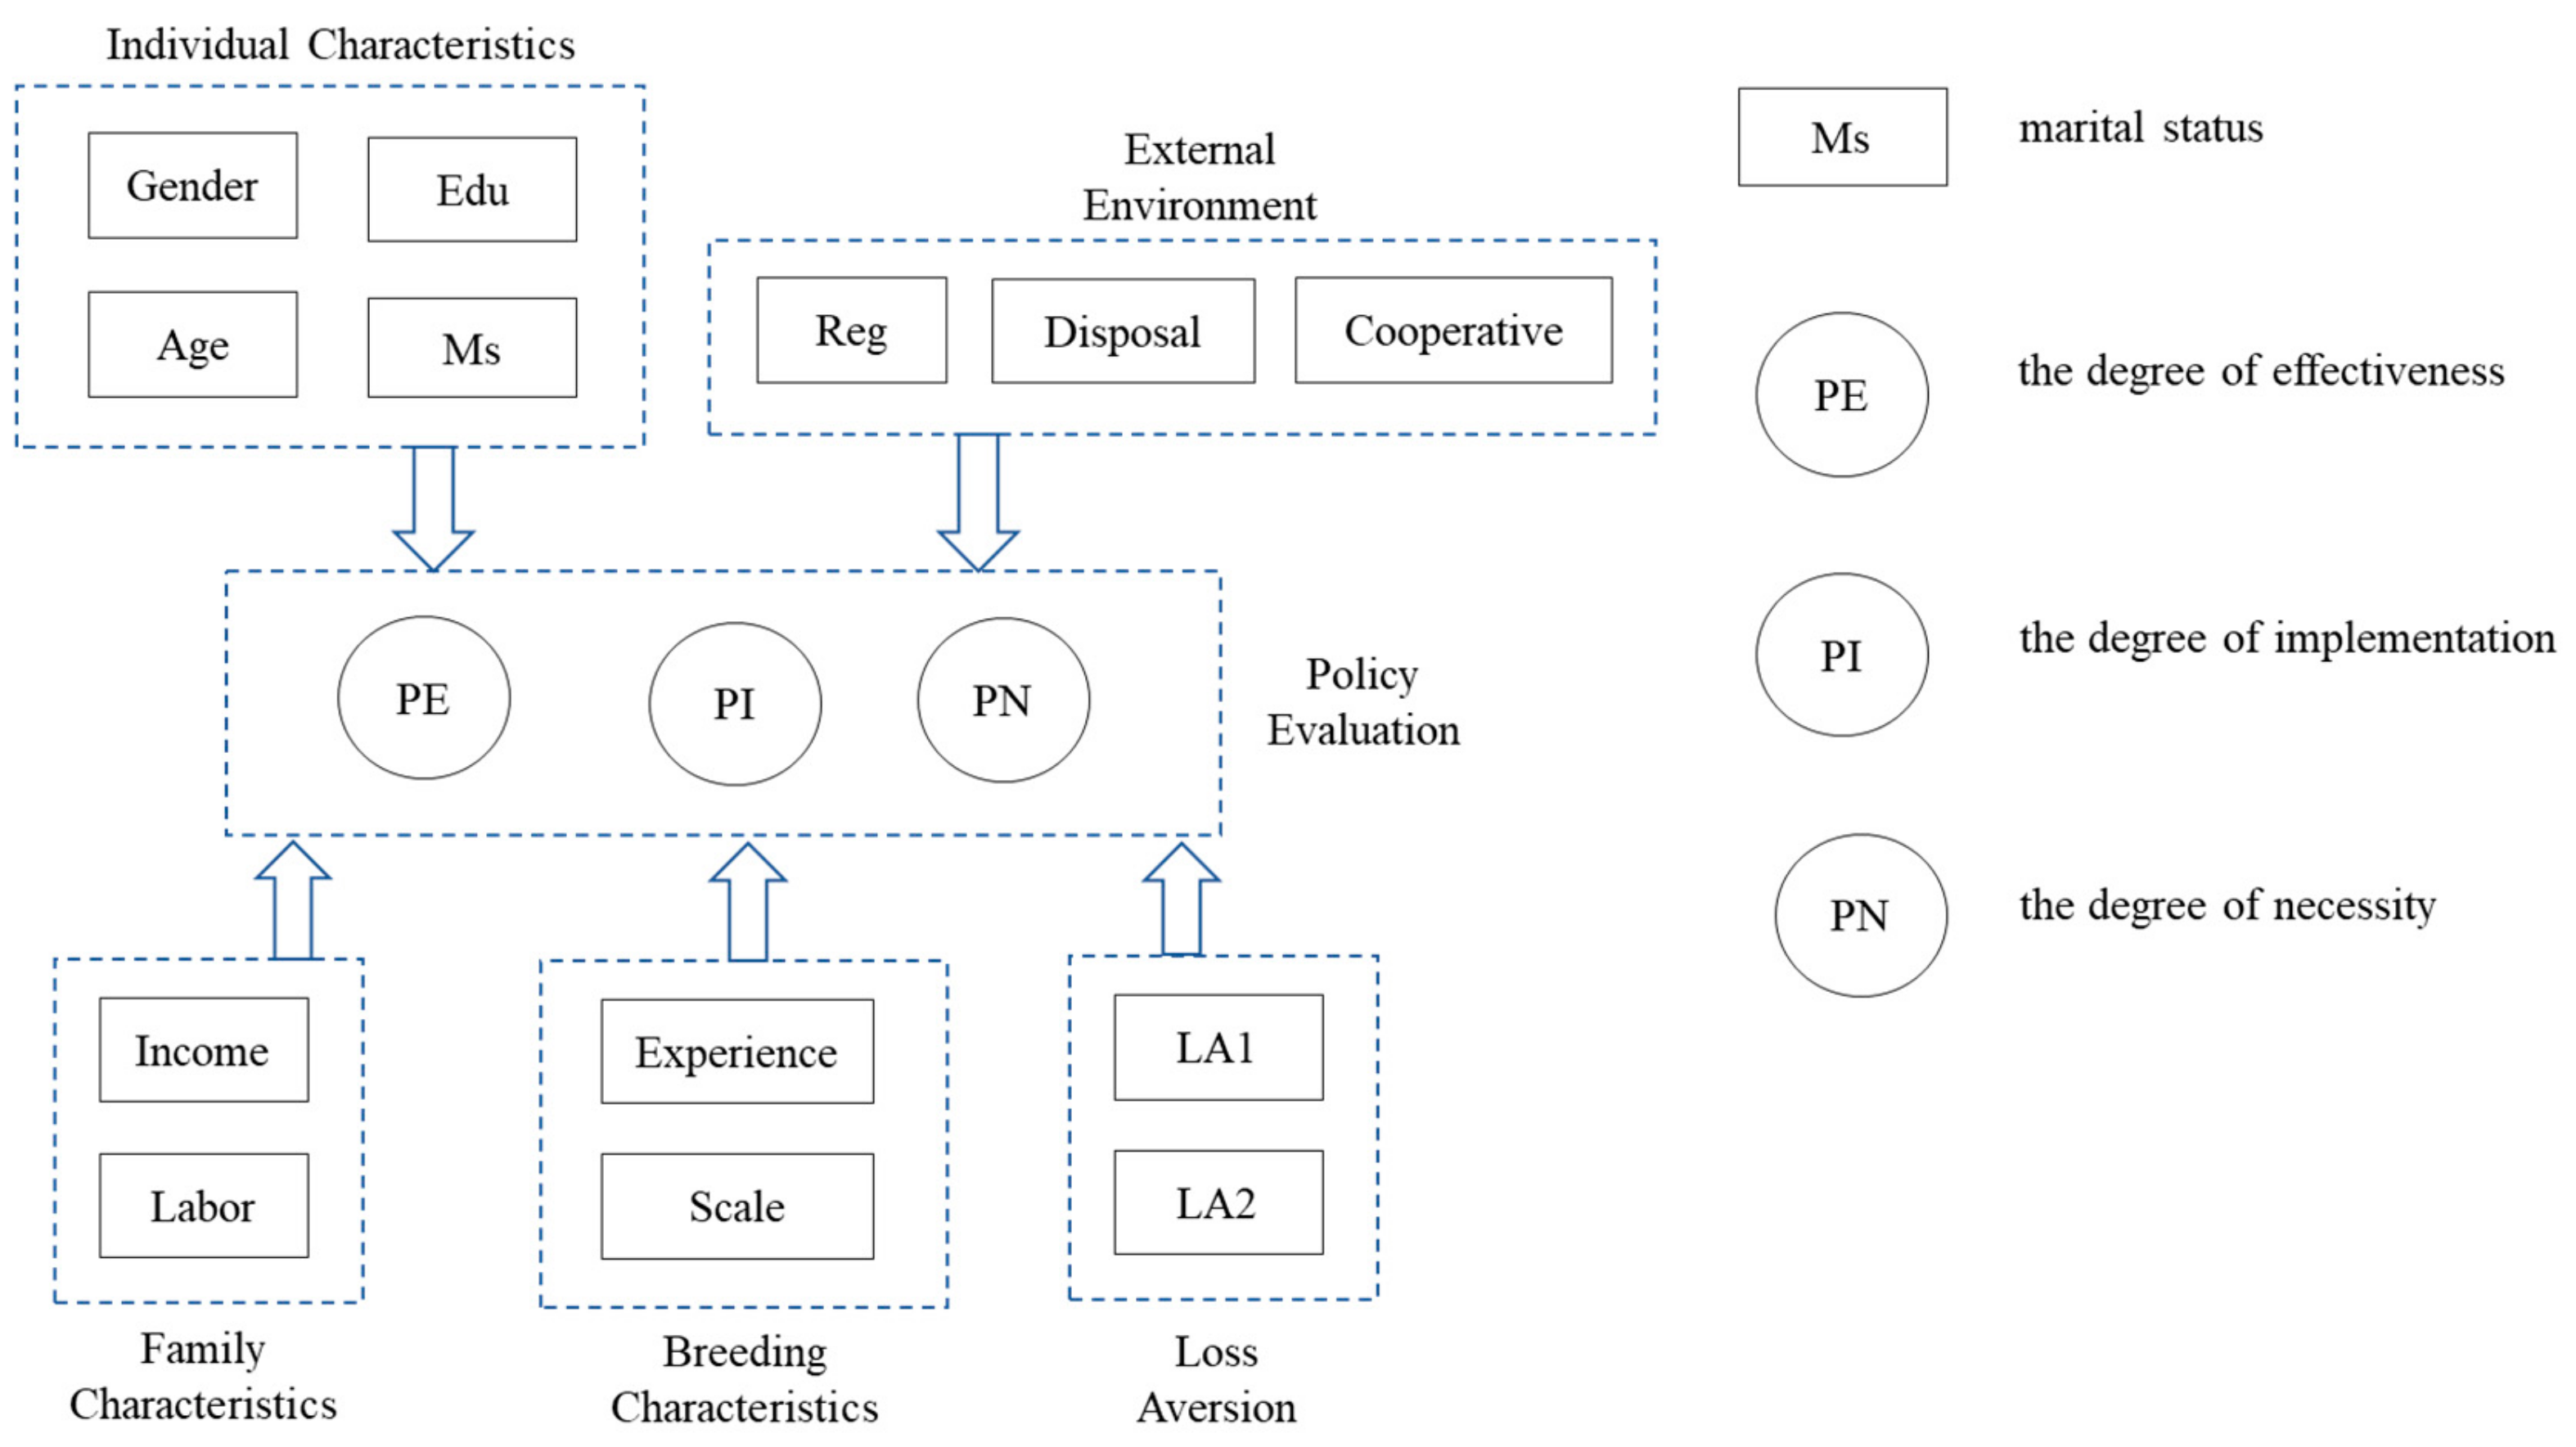
3.2. Research Framework
4. Data Source and Sample Characteristics
4.1. Data Source
4.2. Variable Description and Sample Characteristics
4.3. Ordered Probit Model
5. Experimental Design
6. Empirical Analysis
6.1. Current Status of Farmers’ Evaluation of Punishment Policies for the Inappropriate Treatment of Dead Hogs
6.2. Results and Discussion
6.3. Policy Recommendations
7. Conclusions
Author Contributions
Funding
Conflicts of Interest
References
- Gimpel, H. Loss Aversion and Reference-Dependent Preferences in Multi-Attribute Negotiations. Group Decis. Negot. 2007, 16, 303–319. [Google Scholar] [CrossRef]
- Tversky, A.; Kahneman, D. Loss Aversion in Riskless Choice: A Reference-dependent Model. Q. J. Econ. 1991, 106, 1039–1061. [Google Scholar] [CrossRef]
- Kahneman, D.; Tversky, A. Prospect theory: An Analysis of Decision under Risk. Econ. J. Econ. Soc. 1979, 47, 263–291. [Google Scholar] [CrossRef]
- Kahneman, D.; Knetsch, J.L.; Thaler, R.H. Experimental Tests of the Endowment Effect and the Coase Theorem. J. Political Econ. 1990, 98, 1325–1348. [Google Scholar] [CrossRef] [Green Version]
- Chen, X.; Qiu, G.; Wu, L.; Xu, G.; Wang, J.; Hu, W. Influential Impacts of Combined Government Policies for Safe Disposal of Dead Pigs on Farmer Behavior. Env. Sci. Pollut. Res. Int. 2017, 24, 3997–4007. [Google Scholar] [CrossRef] [PubMed]
- Fei, W. Game Analysis on the Safety Problem of Recycling and Processing in Food Supply Chain—Taking the Case of “Abandoning Pig” as an Example. Issues Agric. Econ. 2015, 36, 94–101. (In Chinese) [Google Scholar]
- Crabbé, A.; Leroy, P. The Handbook of Environmental Policy Evaluation; Earthscan: London, UK, 2008. [Google Scholar]
- Xiaolin, T.; Jieqiong, W.; Biao, Z.; Lingxian, Z. Application of the DEA on the Performance Evaluation of the Agricultural Support Policy in China. Agric. Econ. Zemed. Ekon. 2017, 63, 510–523. [Google Scholar] [CrossRef]
- Moser, S.; Mußhoff, O. Ex-ante Evaluation of Policy Measures: Effects of Reward and Punishment for Fertiliser Reduction in Palm Oil Production. J. Agric. Econ. 2016, 67, 84–104. [Google Scholar] [CrossRef]
- Lynch, J.; Donnellan, T.; Finn, J.A.; Dillon, E.; Ryan, M. Potential Development of Irish Agricultural Sustainability Indicators for Current and Future Policy Evaluation Needs. J. Env. Manag. 2019, 230, 434–445. [Google Scholar] [CrossRef]
- Borges, P.J.; Fragoso, R.; Garciagonzalo, J. Assessing Impacts of Common Agricultural Policy Changes on Regional Land Use Patterns with a Decision Support System: An Application in Southern Portugal. Policy Econ. 2010, 12, 111–120. [Google Scholar] [CrossRef]
- Zhou, F.J.; Liu, X. Research on Satisfaction of Agricultural Subsidy Policy and Its Influencing Factors—Based on Probit Regression Model. Price Theory Pr. 2018, 2, 75–78. (In Chinese) [Google Scholar]
- Pufahl, A.; Weiss, C.R. Evaluating the Effects of Farm Programmes: Results from Propensity Score Matching. Eur. Assoc. Agric. Econ. 2009, 36, 79–101. [Google Scholar] [CrossRef]
- Barbiroli, G. Economic Consequences of the Transition Process toward Green and Sustainable Economies: Costs and Advantages. Int. J. Sustain. Dev. World Ecol. 2011, 18, 17–27. [Google Scholar] [CrossRef]
- Zhan, L. Effectiveness Evaluation of High-Tech Industrial Policy of Hubei Province. Forum Sci. Technol. China 2015, 5, 89–95. (In Chinese) [Google Scholar]
- Huang, Z.; Du, X. Assessment and Determinants of Residential Satisfaction with Public Housing in Hangzhou, China. Habitat Int. 2015, 47, 218–230. [Google Scholar] [CrossRef]
- Zhou, F.Z.; Yang, Y.M.; Chen, H. Reform Exploration on the Use Control of Territory Space: An Application of Libertarian Paternalism. China Land Sci. 2018, 32, 23–29. (In Chinese) [Google Scholar]
- Kibeta, N.; Obareb, G.A.; Lagatb, J.K. Risk Attitude Effects on Global-GAP Certification Decisions by Smallholder French Bean Farmers in Kenya. J. Behav. Exp. Financ. 2018, 18, 18–29. [Google Scholar] [CrossRef]
- Tanaka, T.; Camerer, C.; Nguyen, Q. Risk and Time Preferences: Linking Experimental and Household Survey Data from Vietnam. Am. Econ. Rev. 2010, 100, 557–571. [Google Scholar] [CrossRef]
- Holt, C.A.; Laury, S.K. Risk Aversion and Incentive Effects. Am. Econ. Rev. 2002, 92, 1644–1655. [Google Scholar] [CrossRef] [Green Version]
- Campbell, J.Y.; Mankiw, N.G. Permanent Income, Current Income, and Consumption. Soc. Sci. Electron. Publ. 1990, 8, 265–279. [Google Scholar] [Green Version]
- Nelson, R.R.; Winter, S.G. Evolutionary Theorizing in Economics. J. Econ. Perspect. 2002, 16, 23–46. [Google Scholar] [CrossRef] [Green Version]
- Binswanger, H.P. Attitudes Toward Risk: Experimental Measurement in Rural India. Am. J. Agric. Econ. 1980, 62, 395–407. [Google Scholar] [CrossRef] [Green Version]
- Gong, Y.; Baylis, K.; Kozak, R.; Bull, G. Farmers’ Risk Preferences and Pesticide Use Decisions: Evidence From Field Experiments in China. Agric. Econ. 2016, 47, 411–421. [Google Scholar] [CrossRef]
- Liu, E.M.; Huang, J.K. Risk Preferences and Pesticide Use by Cotton Farmers in China. J. Dev. Econ. 2013, 103, 202–215. [Google Scholar] [CrossRef]
- Jayachandran, N. A Probit Latent Variable Model of Nutriton Information and Dietary Intake. Am. J. Agric. Econ. 1996, 78, 628–639. [Google Scholar]
- Kemel, E.; Paraschiv, C. Deciding about Human Lives: An Experimental Measure of Risk Attitudes under Prospect Theory. Soc. Choice Welf. 2018, 51, 163–192. [Google Scholar] [CrossRef]
- Schijven, M.; Hitt, M.A. The Vicarious Wisdom of Crowds: Toward a Behavioral Perspective on Investor Reactions to Acquisition Announcements. Strat. Manag. J. 2012, 33, 1247–1268. [Google Scholar] [CrossRef]
- Foss, N.J.; Frederiksen, L.; Rullani, F. Problem-Formulation and Problem-Solving in Self-Organized Communities: How Modes of Communication Shape Project Behaviors in The Free Open-Source Software Community. Strat. Manag. J. 2016, 37, 22. [Google Scholar] [CrossRef]


| Variable | Variable Assignment | Frequency (Mean) | Frequency (Standard Deviation) | |
|---|---|---|---|---|
| Individual Characteristics (IC) | Sex | Female = 0 | 120 | 29.7% |
| Male = 1 | 284 | 70.3% | ||
| Age | Years | (49.33) | (8.68) | |
| Education | Schooling years | (7.34) | (4.39) | |
| Marital Status | Unmarried = 0 | 16 | 4% | |
| Married = 1 | 388 | 96% | ||
| Family Characteristics (FC) | Income | 0%–20% = 1 | 73 | 18.1% |
| 21%–40% = 2 | 110 | 27.2% | ||
| 41%–60% = 3 | 86 | 21.3% | ||
| 61%–80% = 4 | 72 | 17.8% | ||
| 81%–100% = 5 | 63 | 15.6% | ||
| Labor | 0%–20% = 1 | 102 | 25.2% | |
| 21%–40% = 2 | 154 | 38.1% | ||
| 41%–60% = 3 | 98 | 24.3% | ||
| 61%–80% = 4 | 44 | 10.9% | ||
| 81%–100% = 5 | 6 | 1.5% | ||
| Breeding Characteristics (BC) | Experience | Numerical Value | (12.72) | (9.22) |
| Scale | 0–51 = 1 | 216 | 53.5% | |
| 51–500 = 2 | 169 | 41.8% | ||
| 501–3000 = 3 | 14 | 3.5% | ||
| 3001–10,000 = 4 | 4 | 1.0% | ||
| 10,001 and above = 5 | 1 | 0.2% | ||
| Dummy Variable (DV) | Reg | Cities below the second tier = 0 | 343 | 84.9% |
| Second-tier cities and above = 1 | 61 | 15.1% | ||
| External Environment (EE) | Disposal | No = 0 | 181 | 44.8% |
| Yes = 1 | 223 | 55.2% | ||
| Cooperative | No = 0 | 278 | 68.8% | |
| Yes = 1 | 126 | 31.2% | ||
| Question Number | The First Case | The Second Case |
|---|---|---|
| 1 | 50% may be found and a fine 1000 yuan, and 50% may not be found | 100% found and a fine of 500 yuan |
| Question Number | The First Case | The Second Case |
|---|---|---|
| 1 | 100% found and a fine of 50 yuan | 50% may be found and a fine of 500 yuan |
| 2 | 100% found and a fine of 100 yuan | 50% may be found and a fine of 500 yuan |
| 3 | 100% found and a fine of 150 yuan | 50% may be found and a fine of 500 yuan |
| 4 | 100% found and a fine of 200 yuan | 50% may be found and a fine of 500 yuan |
| 5 | 100% found and a fine of 250 yuan | 50% may be found and a fine of 500 yuan |
| 6 | 100% found and a fine of 300 yuan | 50% may be found and a fine of 500 yuan |
| 7 | 100% found and a fine of 350 yuan | 50% may be found and a fine of 500 yuan |
| 8 | 100% found and a fine of 400 yuan | 50% may be found and a fine of 500 yuan |
| 9 | 100% found and a fine of 450 yuan | 50% may be found and a fine of 500 yuan |
| 10 | 100% found and a fine of 500 yuan | 50% may be found and a fine of 500 yuan |
| Question Number | The First Case | The Second Case |
|---|---|---|
| 1 | 100% found and detention for 1 h | 50% may be found and detention for 10 h |
| 2 | 100% found and detention for 2 h | 50% may be found and detention for 10 h |
| 3 | 100% found and detention for 3 h | 50% may be found and detention for 10 h |
| 4 | 100% found and detention for 4 h | 50% may be found and detention for 10 h |
| 5 | 100% found and detention for 5 h | 50% may be found and detention for 10 h |
| 6 | 100% found and detention for 6 h | 50% may be found and detention for 10 h |
| 7 | 100% found and detention for 7 h | 50% may be found and detention for 10 h |
| 8 | 100% found and detention for 8 h | 50% may be found and detention for 10 h |
| 9 | 100% found and detention for 9 h | 50% may be found and detention for 10 h |
| 10 | 100% found and detention for 10 h | 50% may be found and detention for 10 h |
| Variable | Variable Assignment | Frequency | Rate of Recurrence | |
|---|---|---|---|---|
| Policy evaluation | How necessary do you think the punishment policy is for the inappropriate treatment of dead hogs? (PN) | Totally unnecessary = 1 | 12 | 3.00% |
| Unnecessary = 2 | 31 | 7.70% | ||
| General = 3 | 73 | 18.10% | ||
| Necessary = 4 | 144 | 35.60% | ||
| Very necessary = 5 | 144 | 35.60% | ||
| How well do you think the local government is implementing the punishment policy for the inappropriate treatment of dead hogs? (PI) | Not executed at all = 1 | 27 | 6.70% | |
| Basically not Executed = 2 | 72 | 17.80% | ||
| General = 3 | 108 | 26.70% | ||
| Mostly executed = 4 | 109 | 27.00% | ||
| Fully executed = 5 | 88 | 21.80% | ||
| How effective do you think the current policy is for the inappropriate treatment of dead hogs? (PE) | Totally ineffective = 1 | 21 | 5.20% | |
| No effect = 2 | 38 | 9.40% | ||
| General = 3 | 103 | 25.50% | ||
| Mostly effective = 4 | 139 | 34.40% | ||
| Very effective = 5 | 103 | 25.50% | ||
| Variable | Model I | |||||
|---|---|---|---|---|---|---|
| Coefficients (DV = PN) | Margin (1) | Margin (2) | Margin (3) | Margin (4) | Margin (5) | |
| Sex | −0.010 (0.118) | 0.002 | 0.003 | 0.001 | −0.002 | −0.004 |
| Age | 0.005 (0.007) | −0.001 | −0.001 | −0.000 | −0.000 | 0.001 |
| Education | 0.016 (0.276) | 0.001 | 0.001 | –0.000 | –0.001 | –0.002 |
| Marital Status | 0.015 (0.019) | –0.002 | –0.002 | –0.000 | 0.001 | 0.003 |
| Income | 0.156 *** (0.054) | –0.024 | –0.028 | –0.006 | 0.017 | 0.041 |
| Labor | 0.048 (0.062) | –0.006 | –0.007 | –0.001 | 0.004 | 0.010 |
| Experience | –0.016 ** (0.007) | 0.002 | 0.003 | 0.001 | –0.002 | –0.004 |
| Scale | 0.204 * (0.106) | –0.037 | –0.042 | –0.009 | 0.026 | 0.062 |
| Reg | 0.197 (0.173) | –0.026 | –0.030 | –0.007 | 0.019 | 0.044 |
| Disposal | 0.391 *** (0.117) | –0.060 | –0.069 | –0.015 | 0.043 | 0.101 |
| Cooperative | 0.241 ** (0.116) | –0.036 | –0.041 | –0.009 | 0.025 | 0.060 |
| LA1 | 0.001 (0.021) | –0.009 | –0.010 | –0.002 | 0.006 | 0.015 |
| LA2 | ||||||
| Observations | 404 | |||||
| Log likelihood | –203.751 | |||||
| Prob > chi2 | 0.000 | |||||
| Pseudo R2 | 0.159 | |||||
| Variable | Model II | |||||
|---|---|---|---|---|---|---|
| Coefficients (DV = PN) | Margin (1) | Margin (2) | Margin (3) | Margin (4) | Margin (5) | |
| Sex | –0.015 (0.118) | 0.002 | 0.003 | 0.001 | –0.002 | –0.004 |
| Age | 0.004 (0.007) | –0.001 | –0.001 | 0.000 | 0.000 | 0.001 |
| Education | 0.008 (0.275) | 0.001 | 0.001 | 0.000 | –0.001 | –0.002 |
| Marital Status | 0.012 (0.019) | –0.002 | –0.002 | 0.000 | 0.001 | 0.003 |
| Income | 0.164 *** (0.053) | –0.024 | –0.028 | –0.006 | 0.017 | 0.041 |
| Labor | 0.039 (0.062) | –0.006 | –0.007 | –0.001 | 0.004 | 0.010 |
| Experience | –0.016 ** (0.007) | 0.002 | 0.003 | 0.001 | –0.002 | –0.004 |
| Scale | 0.251 ** (0.107) | –0.037 | –0.042 | –0.009 | 0.026 | 0.062 |
| Reg | 0.177 (0.173) | –0.026 | –0.030 | –0.007 | 0.019 | 0.044 |
| Disposal | 0.408 *** (0.117) | –0.060 | –0.069 | –0.015 | 0.043 | 0.101 |
| Cooperative | 0.244 ** (0.116) | –0.036 | –0.041 | –0.009 | 0.025 | 0.060 |
| LA1 | ||||||
| LA2 | 0.060 *** (0.023) | –0.009 | –0.010 | –0.002 | 0.006 | 0.015 |
| Observations | 404 | |||||
| Log likelihood | –203.982 | |||||
| Prob > chi2 | 0.000 | |||||
| Pseudo R2 | 0.158 | |||||
| Variable | Model III | |||||
|---|---|---|---|---|---|---|
| Coefficients (DV = PI) | Margin (1) | Margin (2) | Margin (3) | Margin (4) | Margin (5) | |
| Sex | –0.161 (0.119) | 0.039 | 0.013 | –0.011 | –0.023 | –0.018 |
| Age | 0.011 (0.007) | –0.003 | –0.001 | 0.001 | 0.002 | 0.001 |
| Education | 0.005 (0.019) | –0.021 | –0.007 | 0.006 | 0.012 | 0.010 |
| Marital Status | 0.086 (0.288) | –0.001 | 0.000 | 0.000 | 0.001 | 0.001 |
| Income | 0.050 (0.054) | –0.012 | –0.004 | 0.004 | 0.007 | 0.006 |
| Labor | 0.255 *** (0.064) | –0.062 | –0.021 | 0.018 | 0.037 | 0.029 |
| Experience | –0.018 *** (0.007) | 0.004 | 0.002 | –0.001 | –0.003 | –0.002 |
| Scale | 0.296 *** (0.108) | –0.072 | –0.025 | 0.021 | 0.042 | 0.034 |
| Reg | 0.237 (0.173) | –0.058 | –0.020 | 0.017 | 0.034 | 0.027 |
| Disposal | 0.738 *** (0.118) | –0.180 | –0.062 | 0.052 | 0.106 | 0.084 |
| Cooperative | 0.119 (0.118) | –0.029 | –0.010 | 0.008 | 0.017 | 0.014 |
| LA1 | 0.044 ** (0.021) | –0.011 | –0.004 | 0.003 | 0.006 | 0.005 |
| LA2 | ||||||
| Observations | 404 | |||||
| Log likelihood | –550.397 | |||||
| Prob > chi2 | 0.000 | |||||
| Pseudo R2 | 0.107 | |||||
| Variable | Model IV | |||||
|---|---|---|---|---|---|---|
| Coefficients (DV = PI) | Margin (1) | Margin (2) | Margin (3) | Margin (4) | Margin (5) | |
| Sex | –0.163 (0.119) | 0.040 | 0.014 | –0.012 | –0.024 | –0.019 |
| Age | 0.010 (0.007) | –0.002 | –0.001 | 0.001 | 0.001 | 0.001 |
| Education | 0.004 (0.019) | –0.006 | –0.002 | 0.002 | 0.004 | 0.003 |
| Marital Status | 0.025 (0.286) | –0.001 | 0.000 | 0.000 | 0.001 | 0.000 |
| Income | 0.026 (0.053) | –0.006 | –0.002 | 0.002 | 0.004 | 0.003 |
| Labor | 0.256 *** (0.064) | –0.063 | –0.022 | 0.018 | 0.037 | 0.029 |
| Experience | –0.019 *** (0.007) | 0.005 | 0.002 | –0.001 | –0.003 | –0.002 |
| Scale | 0.333 *** (0.109) | –0.081 | –0.029 | 0.024 | 0.048 | 0.038 |
| Reg | 0.213 (0.172) | –0.052 | –0.018 | 0.015 | 0.031 | 0.024 |
| Disposal | 0.761 *** (0.118) | –0.186 | –0.065 | 0.054 | 0.110 | 0.087 |
| Cooperative | 0.127 (0.118) | –0.031 | –0.011 | 0.009 | 0.018 | 0.015 |
| LA1 | ||||||
| LA2 | 0.016 (0.023) | –0.004 | –0.001 | 0.001 | 0.002 | 0.002 |
| Observations | 404 | |||||
| Log likelihood | –552.298 | |||||
| Prob > chi2 | 0.000 | |||||
| Pseudo R2 | 0.104 | |||||
| Variable | Model V | |||||
|---|---|---|---|---|---|---|
| Coefficients (DV = PE) | Margin (1) | Margin (2) | Margin (3) | Margin (4) | Margin (5) | |
| Sex | –0.096 (0.119) | 0.026 | 0.006 | –0.013 | –0.010 | –0.009 |
| Age | 0.006 (0.007) | –0.002 | 0.000 | 0.001 | 0.001 | 0.001 |
| Education | 0.022 (0.019) | 0.034 | 0.008 | –0.017 | –0.013 | –0.012 |
| Marital Status | –0.125 (0.282) | –0.006 | –0.001 | 0.003 | 0.002 | 0.002 |
| Income | 0.002 (0.054) | 0.000 | 0.000 | 0.000 | 0.000 | 0.000 |
| Labor | 0.253 *** (0.064) | –0.068 | –0.016 | 0.034 | 0.027 | 0.024 |
| Experience | –0.009 (0.007) | 0.002 | 0.001 | –0.001 | –0.001 | –0.001 |
| Scale | 0.559 *** (0.112) | –0.151 | –0.035 | 0.075 | 0.059 | 0.052 |
| Reg | 0.169 (0.174) | –0.046 | –0.011 | 0.023 | 0.018 | 0.016 |
| Disposal | 0.289 ** (0.118) | –0.078 | –0.018 | 0.039 | 0.031 | 0.027 |
| Cooperative | 0.259 ** (0.119) | –0.070 | –0.016 | 0.035 | 0.027 | 0.024 |
| LA1 | 0.022 (0.022) | –0.006 | –0.001 | 0.003 | 0.002 | 0.002 |
| LA2 | ||||||
| Observations | 404 | |||||
| Log likelihood | –527.046 | |||||
| Prob > chi2 | 0.000 | |||||
| Pseudo R2 | 0.094 | |||||
| Variable | Model VI | |||||
|---|---|---|---|---|---|---|
| Coefficients (DV = PE) | Margin (1) | Margin (2) | Margin (3) | Margin (4) | Margin (5) | |
| Sex | –0.091 (0.120) | 0.024 | 0.006 | –0.012 | –0.009 | –0.008 |
| Age | 0.006 (0.007) | –0.002 | 0.000 | 0.001 | 0.001 | 0.001 |
| Education | 0.024 (0.019) | 0.037 | 0.009 | −0.018 | −0.014 | −0.013 |
| Marital Status | −0.137 (0.282) | −0.006 | −0.001 | 0.003 | 0.002 | 0.002 |
| Income | −0.017 (0.053) | 0.004 | 0.001 | −0.002 | −0.002 | −0.002 |
| Labor | 0.263 *** (0.064) | −0.071 | −0.017 | 0.035 | 0.028 | 0.025 |
| Experience | −0.010 (0.007) | 0.003 | 0.001 | −0.001 | −0.001 | −0.001 |
| Scale | 0.549 *** (0.113) | −0.147 | −0.035 | 0.073 | 0.057 | 0.051 |
| Reg | 0.179 (0.174) | −0.048 | −0.011 | 0.024 | 0.019 | 0.017 |
| Disposal | 0.292 ** (0.118) | −0.078 | −0.018 | 0.039 | 0.031 | 0.027 |
| Cooperative | 0. 264 ** (0.119) | −0.071 | −0.017 | 0.035 | 0.028 | 0.025 |
| LA1 | ||||||
| LA2 | −0.042 * (0.023) | 0.011 | 0.003 | −0.006 | −0.004 | −0.004 |
| Observations | 404 | |||||
| Log likelihood | −525.860 | |||||
| Prob > chi2 | 0.000 | |||||
| Pseudo R2 | 0.096 | |||||
© 2019 by the authors. Licensee MDPI, Basel, Switzerland. This article is an open access article distributed under the terms and conditions of the Creative Commons Attribution (CC BY) license (http://creativecommons.org/licenses/by/4.0/).
Share and Cite
Yang, C.; Wang, J. Evaluation of Policies on Inappropriate Treatment of Dead Hogs from the Perspective of Loss Aversion. Int. J. Environ. Res. Public Health 2019, 16, 2938. https://doi.org/10.3390/ijerph16162938
Yang C, Wang J. Evaluation of Policies on Inappropriate Treatment of Dead Hogs from the Perspective of Loss Aversion. International Journal of Environmental Research and Public Health. 2019; 16(16):2938. https://doi.org/10.3390/ijerph16162938
Chicago/Turabian StyleYang, Chenchen, and Jianhua Wang. 2019. "Evaluation of Policies on Inappropriate Treatment of Dead Hogs from the Perspective of Loss Aversion" International Journal of Environmental Research and Public Health 16, no. 16: 2938. https://doi.org/10.3390/ijerph16162938
APA StyleYang, C., & Wang, J. (2019). Evaluation of Policies on Inappropriate Treatment of Dead Hogs from the Perspective of Loss Aversion. International Journal of Environmental Research and Public Health, 16(16), 2938. https://doi.org/10.3390/ijerph16162938