Feeling Vital or Fatigued? Relations with Demands and Resources in a University Context


Abstract
:1. Introduction
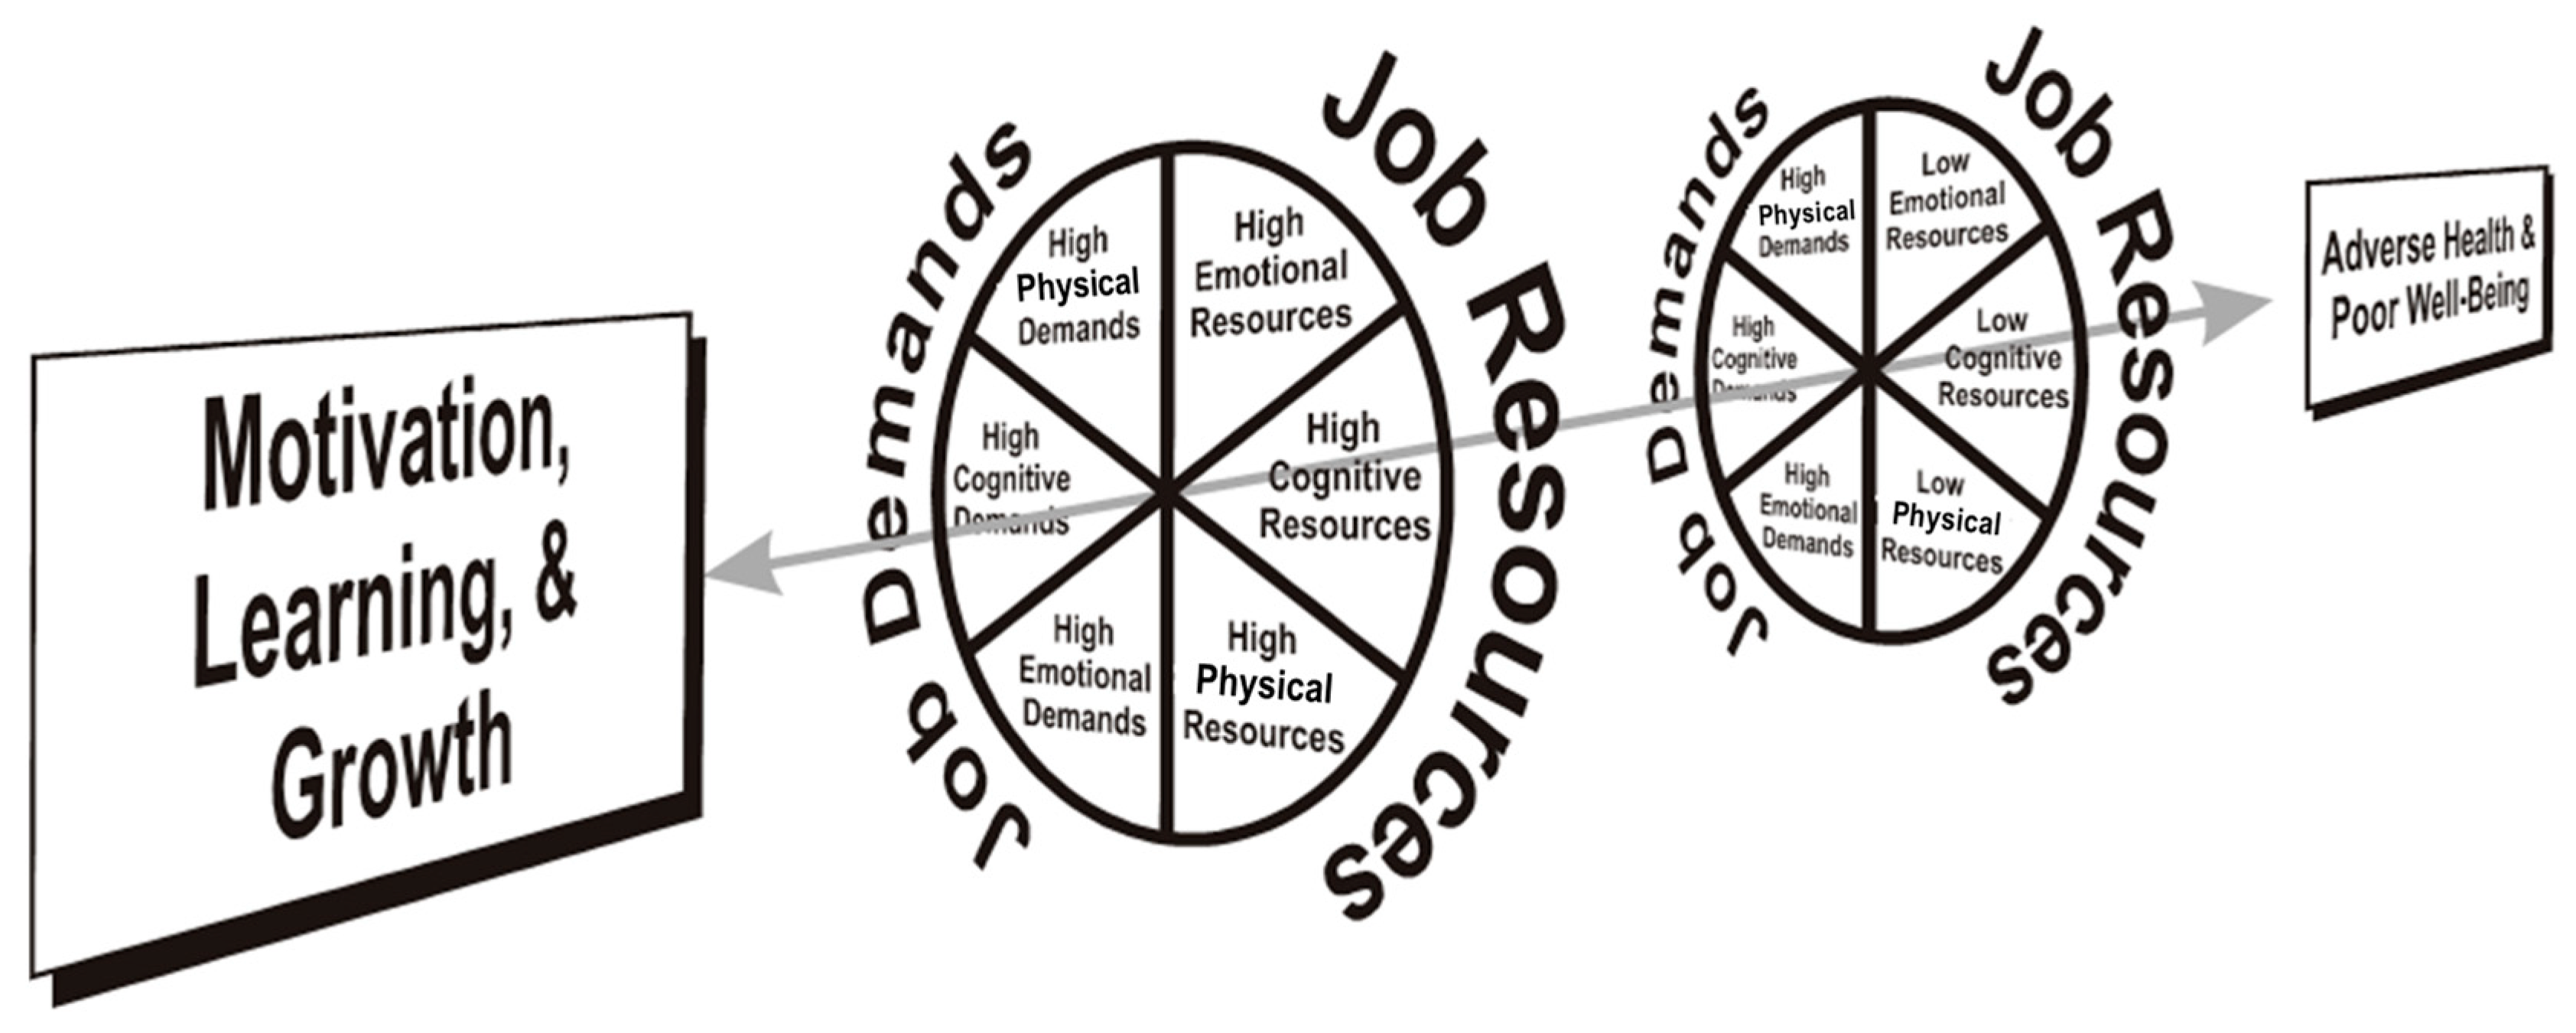
The Demand-Induced Strain Compensation Model
2. Materials and Methods
2.1. Study Design, Data, and Procedure
2.2. Variables and Instruments
2.2.1. Demands and Resources at Work/Study
2.2.2. Employee/Student Vitality and Fatigue
2.2.3. Demographics
2.3. Statistical Analysis
3. Results
3.1. Demands and Resources as Predictors of Vitality
3.1.1. Predictors of Employee Vitality
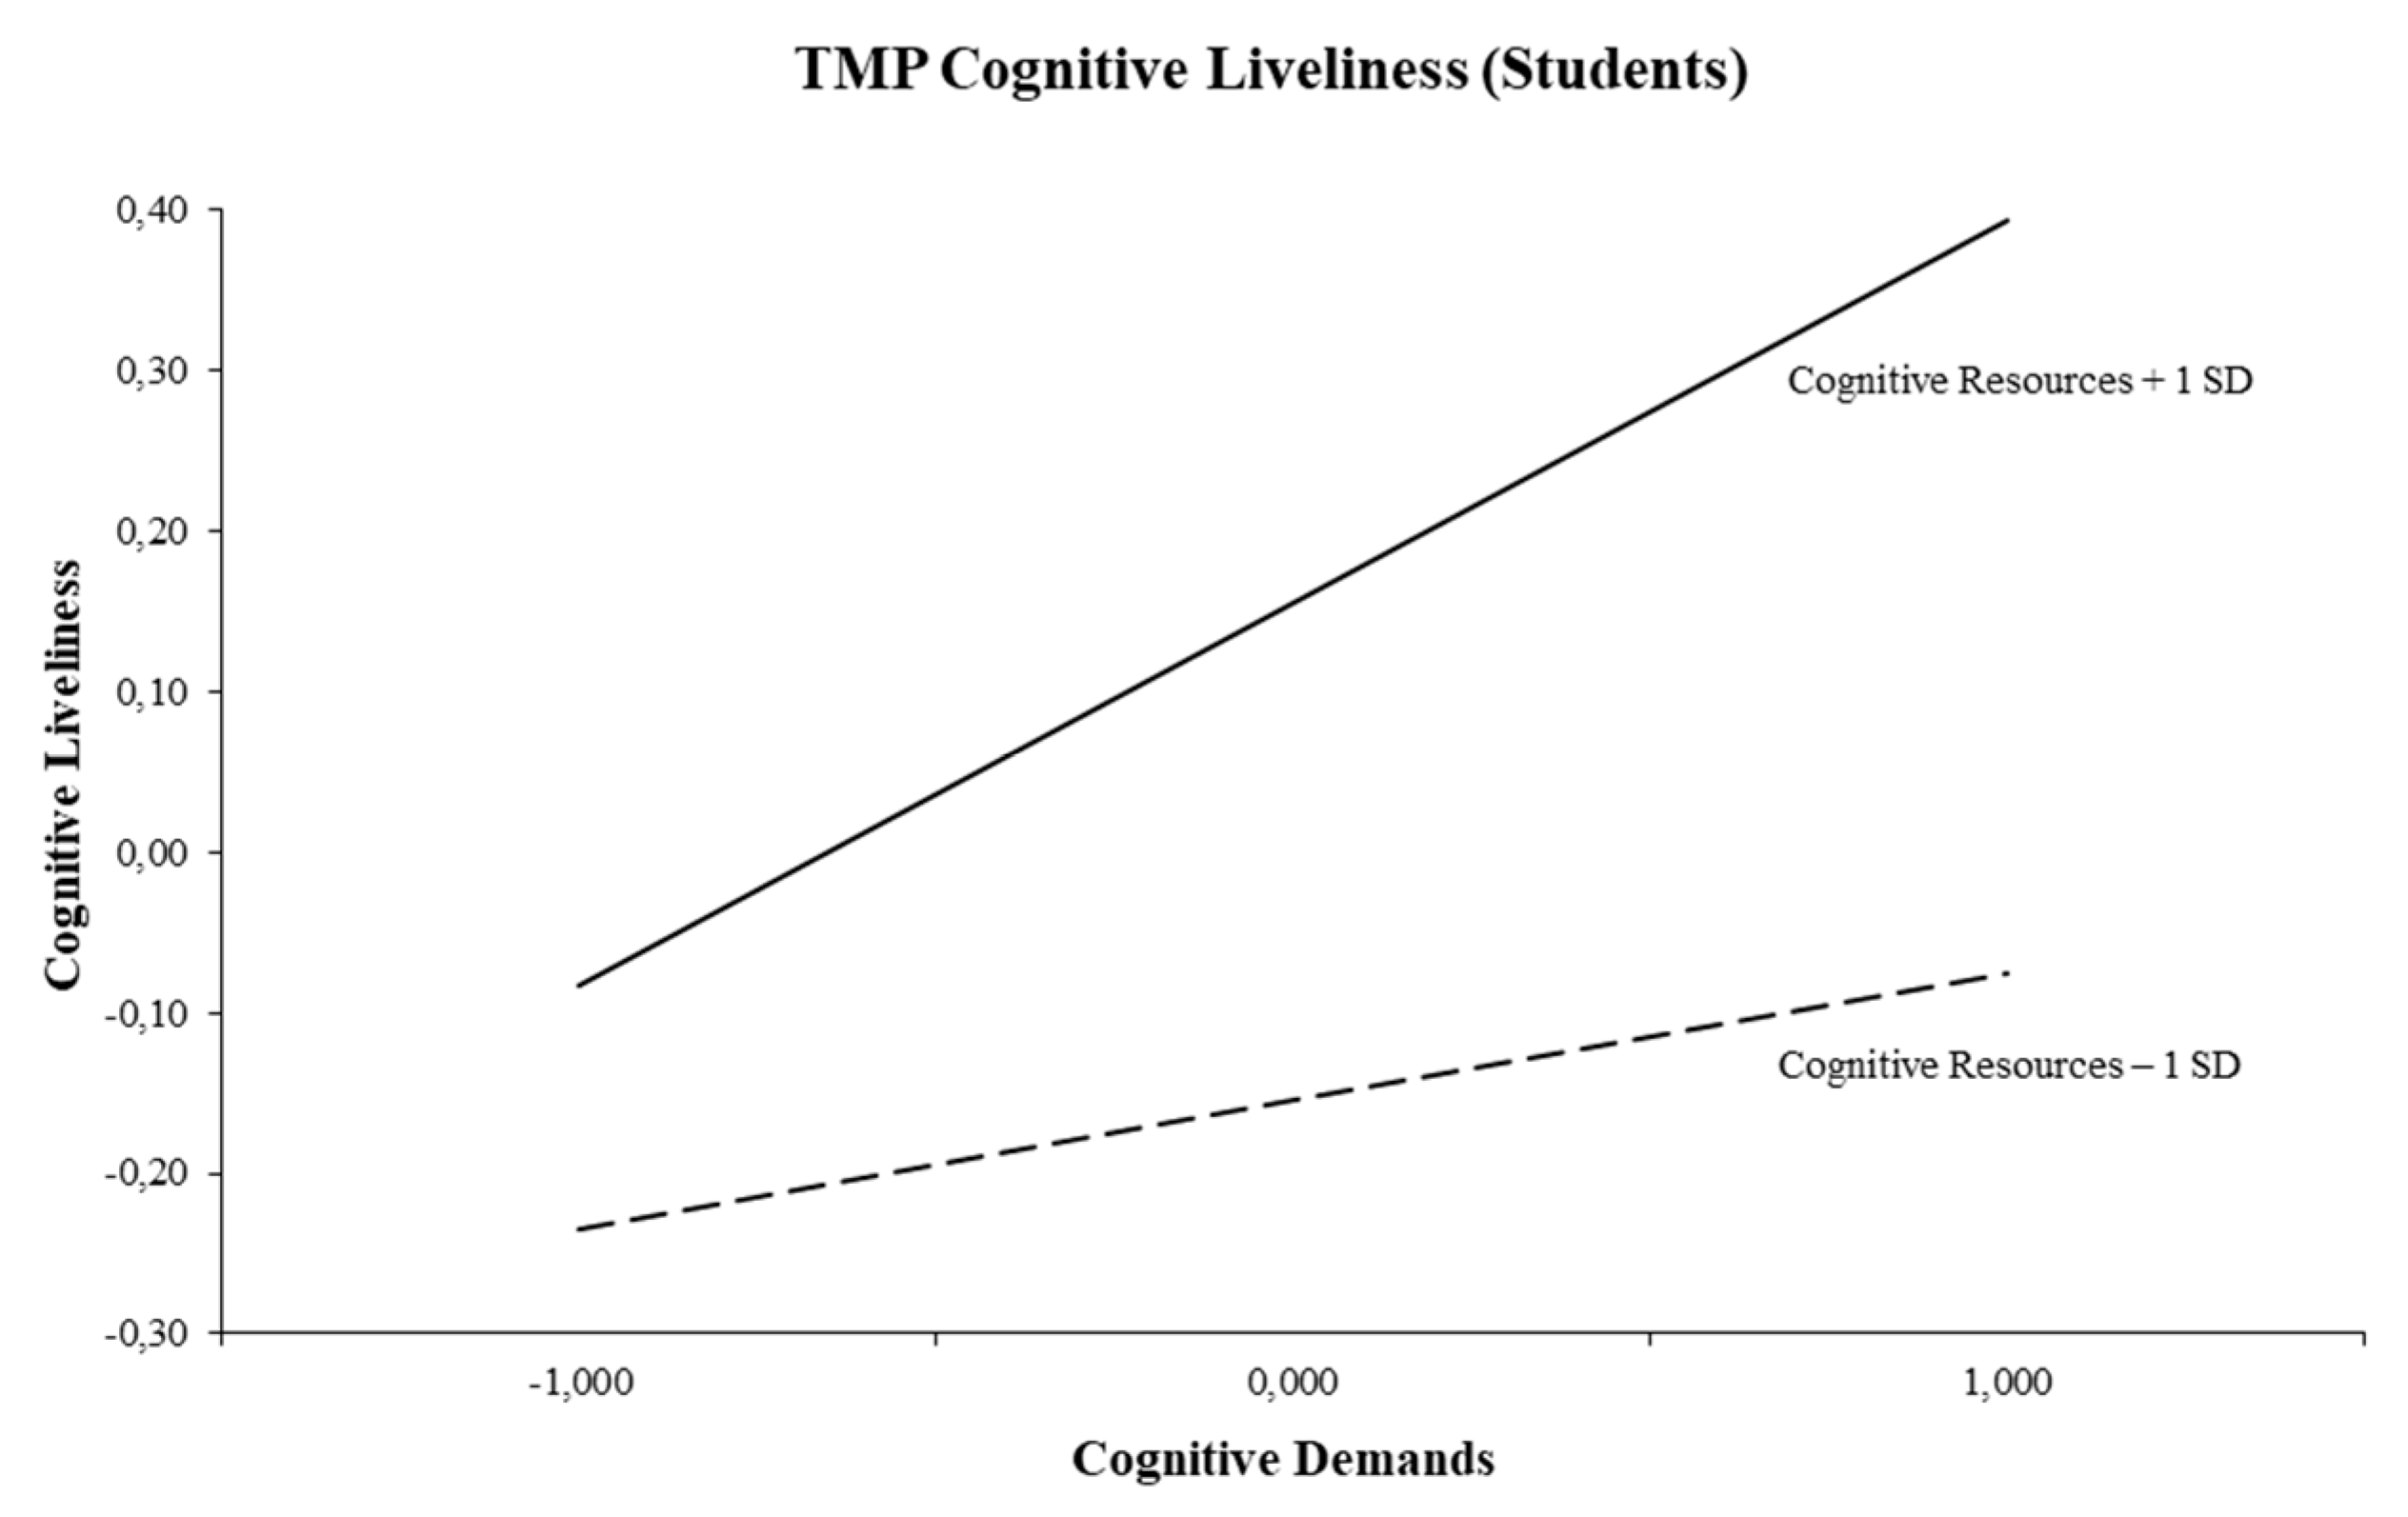
3.1.2. Predictors of Student Vitality
3.2. Demands and Resources as Predictors of Fatigue
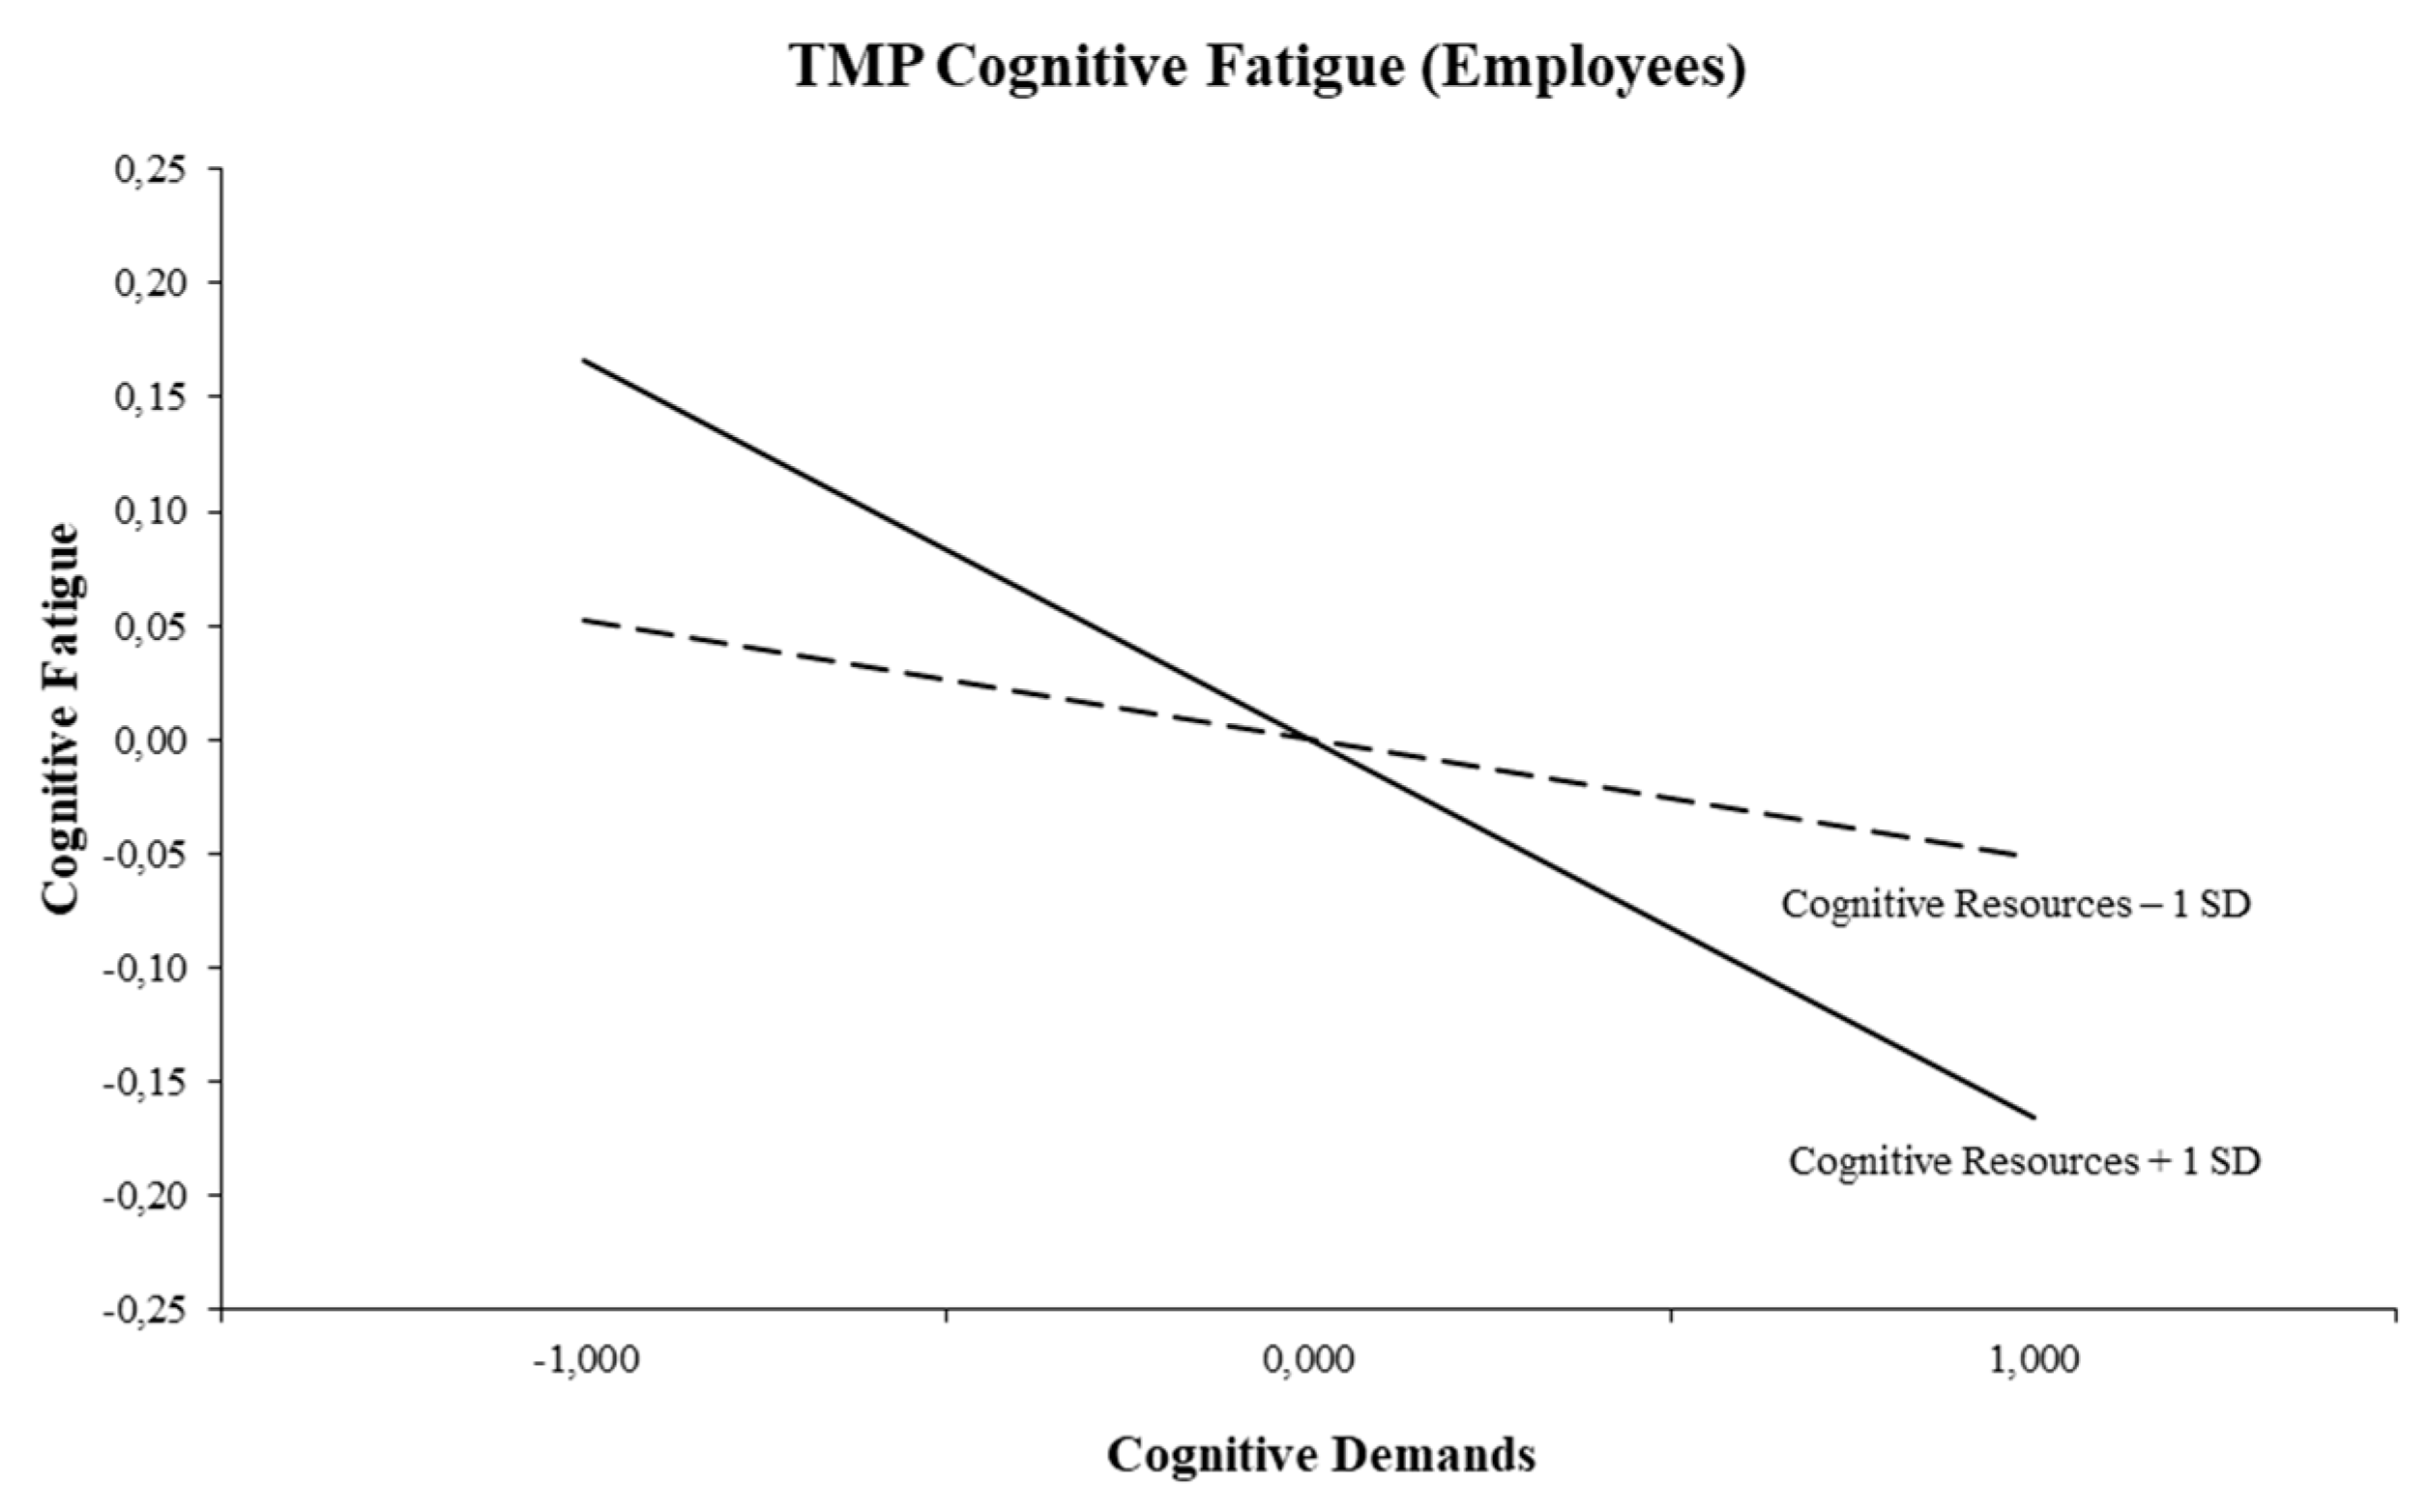
3.2.1. Predictors of Employee Fatigue
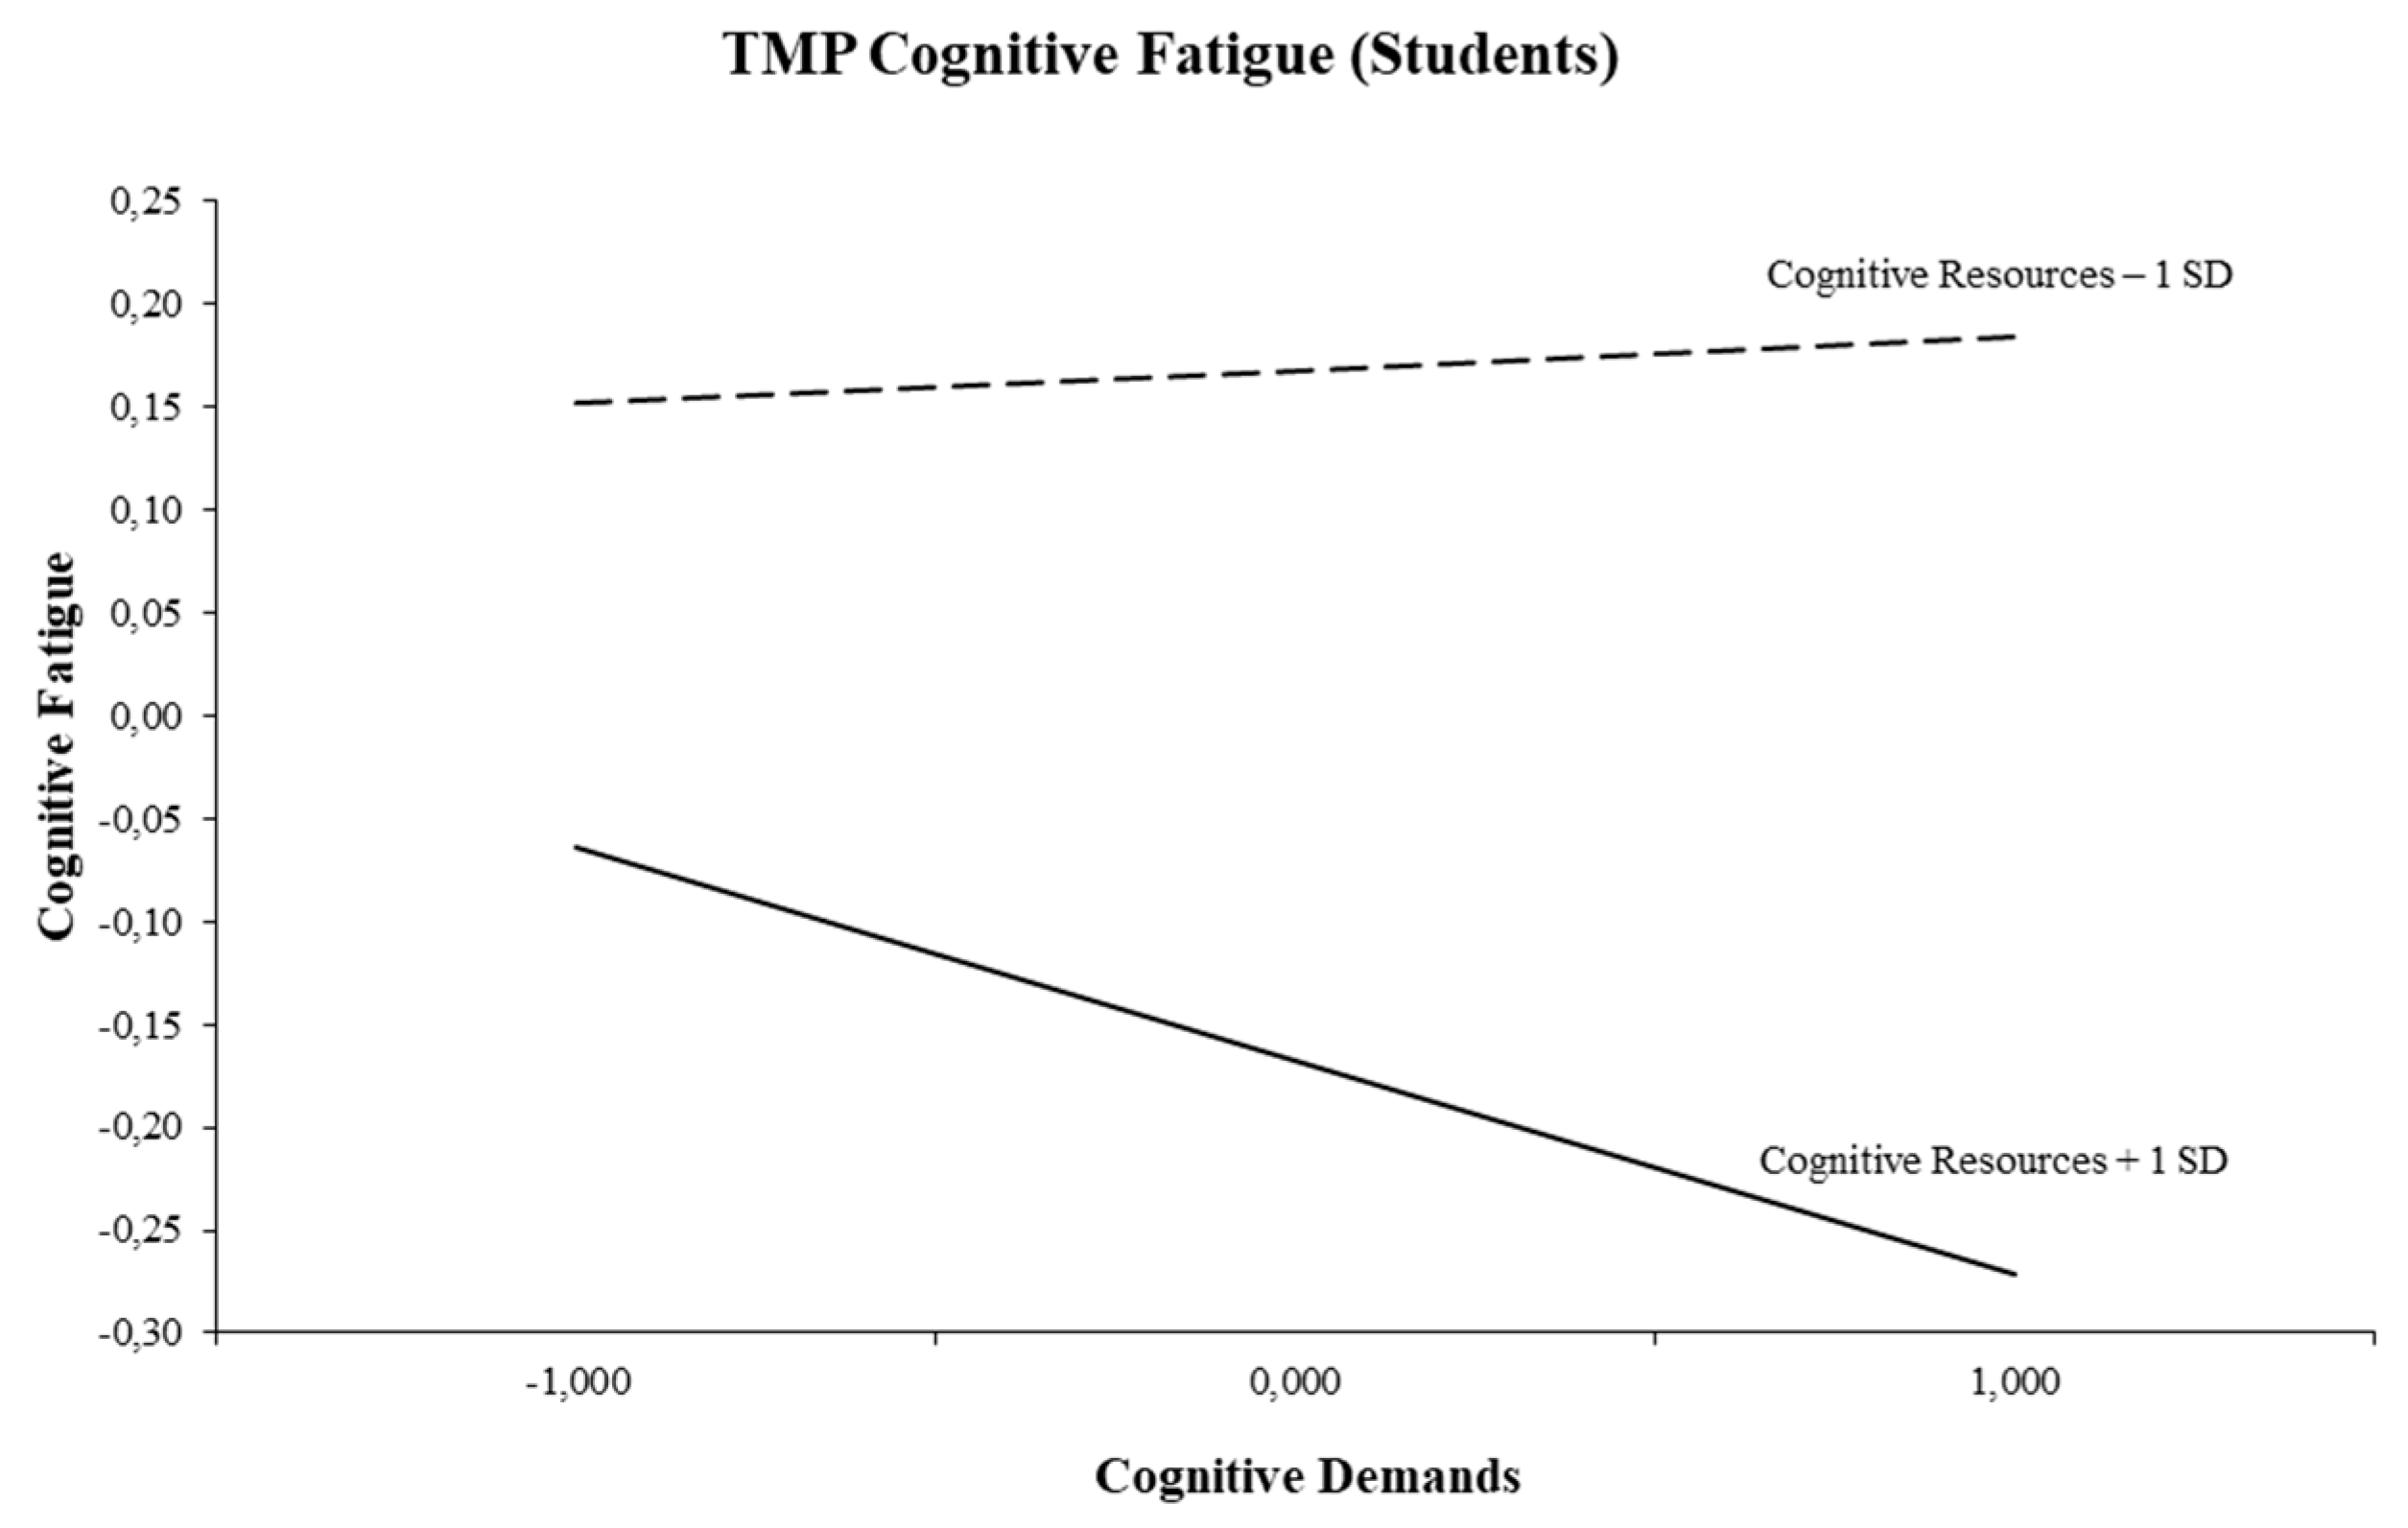
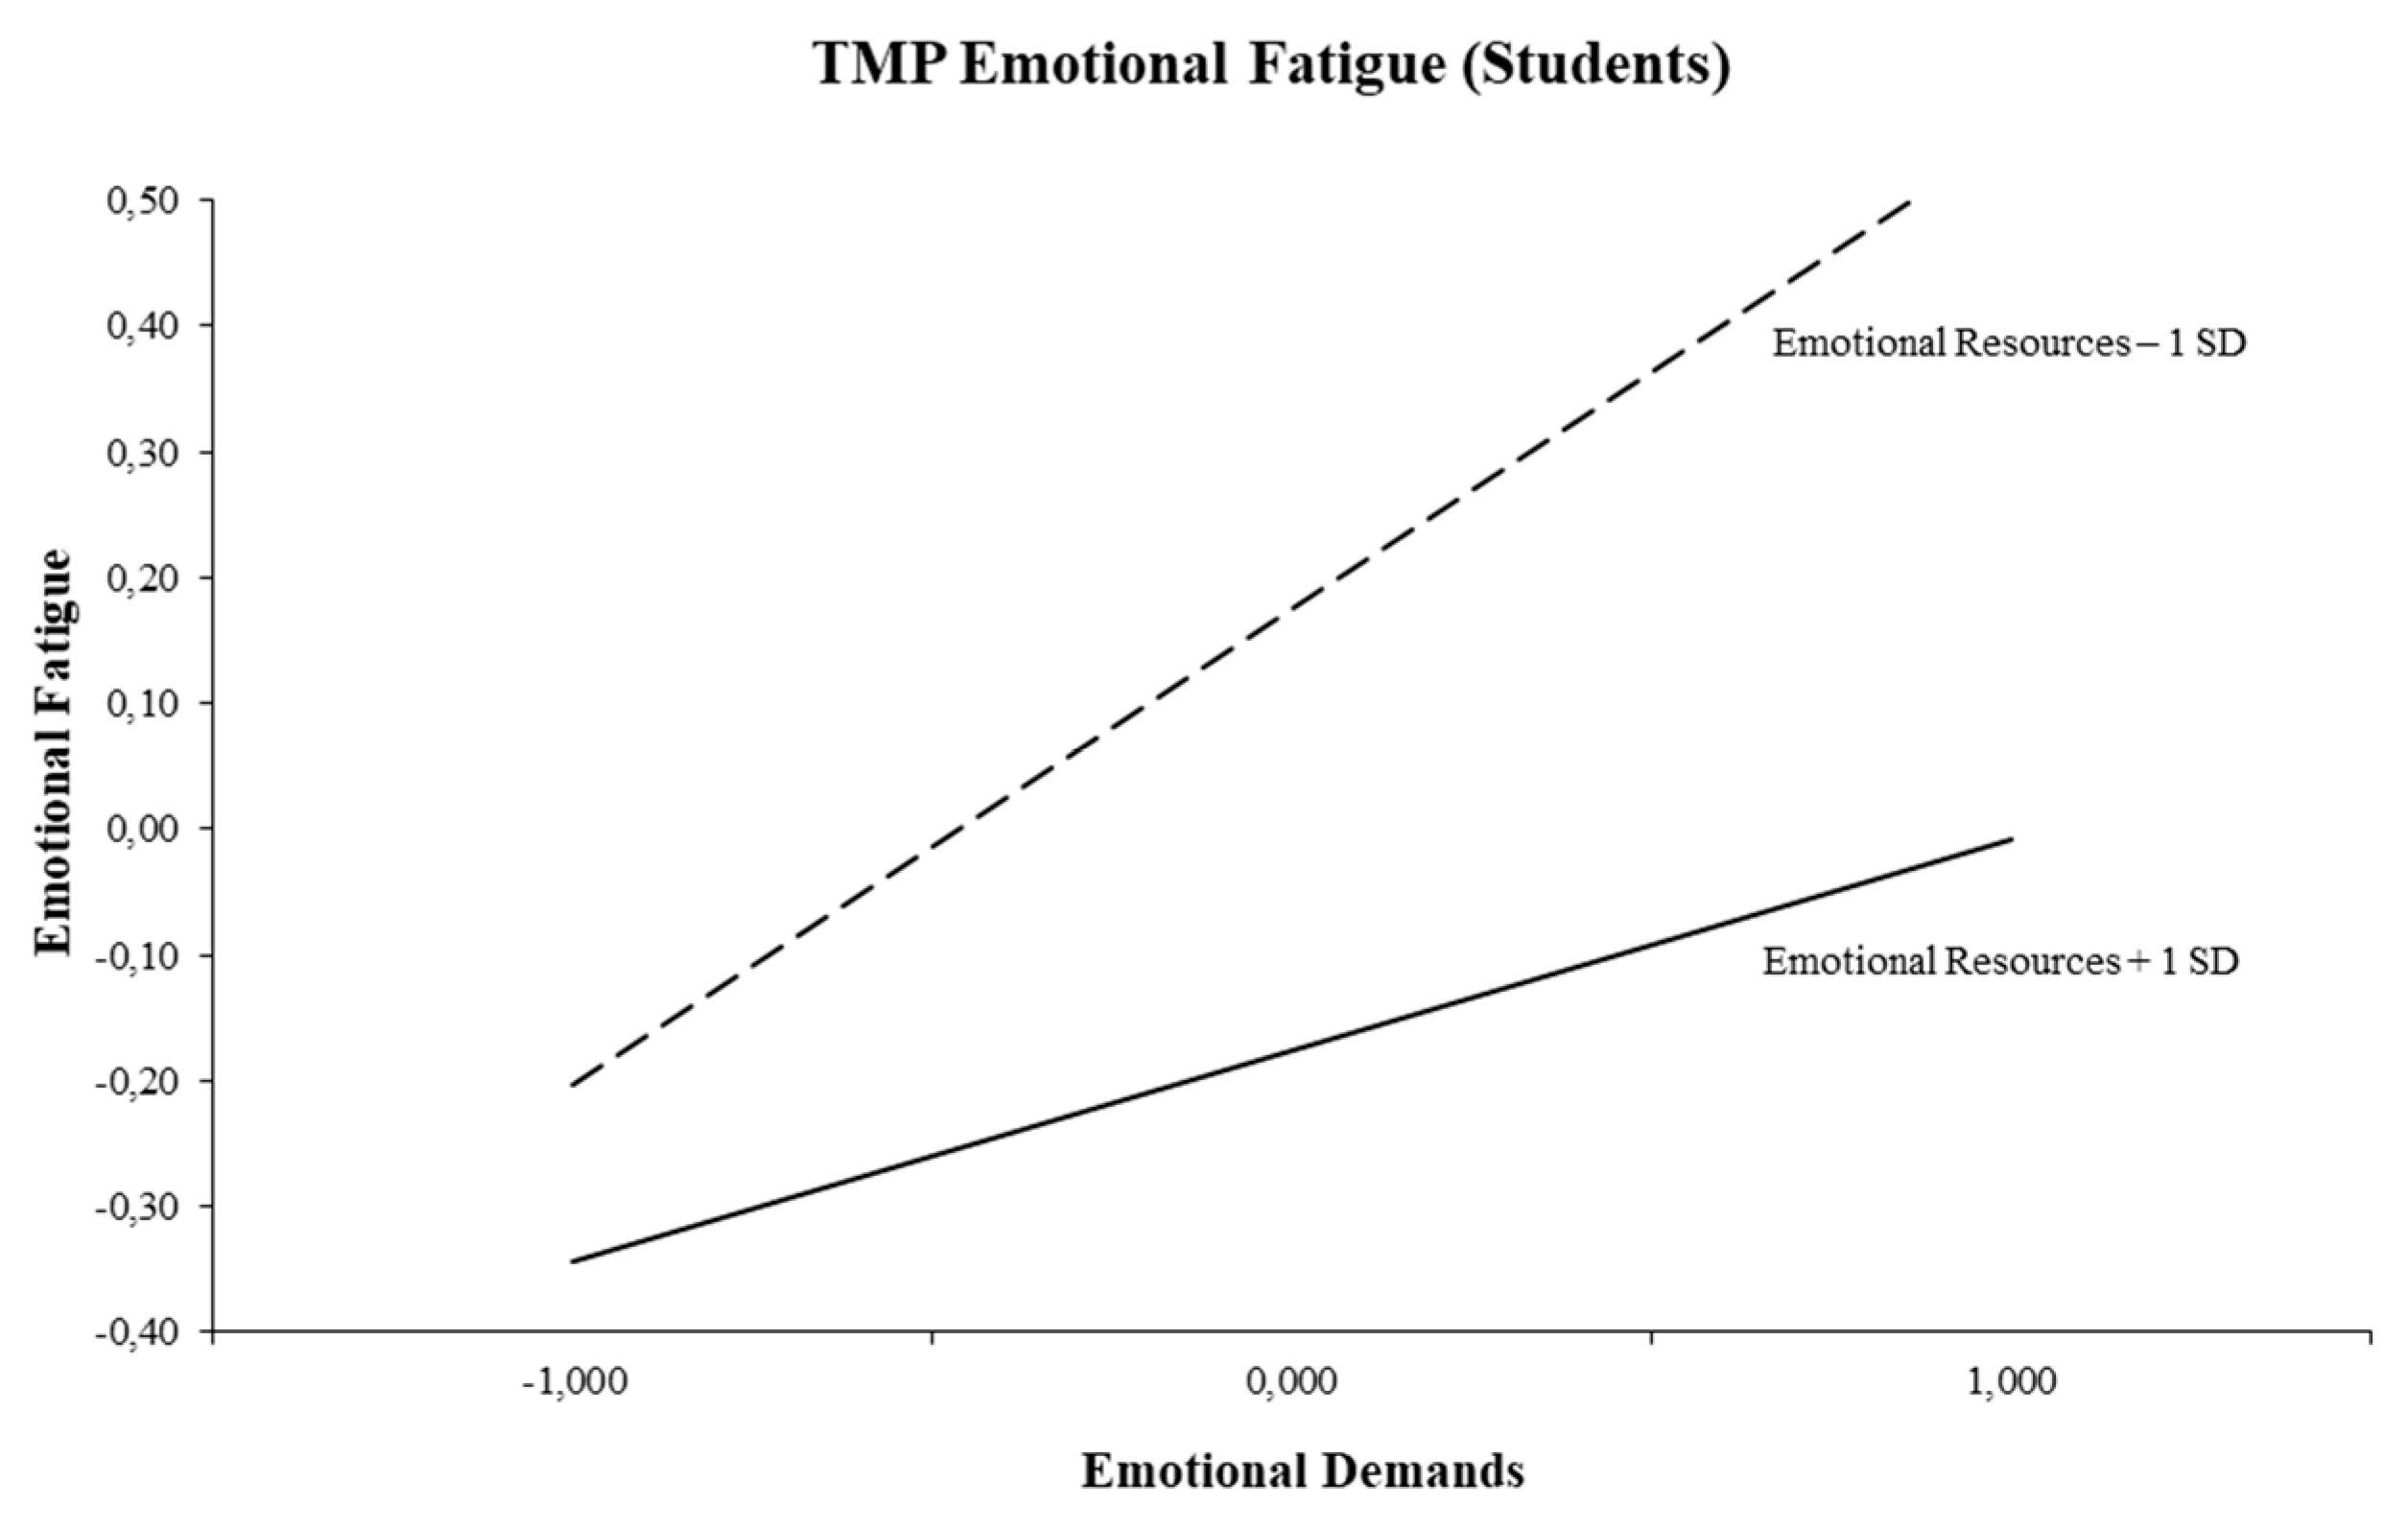
3.2.2. Predictors of Student Fatigue
3.3. Remaining Demand–Resource Interactions as Predictors of Vitality and Fatigue
3.4. Demand–Resource Interactions and the Degree of Match
4. Discussion
4.1. Theoretical Implications
4.1.1. Predictors of Vitality
4.1.2. Predictors of Fatigue
4.1.3. Demand–Resource Interactions and the Degree of Match
4.2. Strengths and Limitations
4.3. Future Research
4.4. Practical Implications
5. Conclusions
Author Contributions
Funding
Acknowledgments
Conflicts of Interest
Appendix A

| Source | Dependent Variable | |||||||||||
|---|---|---|---|---|---|---|---|---|---|---|---|---|
| Vitality | Fatigue | |||||||||||
| Cognitive Liveliness | Emotional Energy | Physical Strength | Cognitive | Emotional | Physical | |||||||
| B | SE | B | SE | B | SE | B | SE | B | SE | B | SE | |
| Control Variables | ||||||||||||
| Age | 0.02 ** | 0.00 | 0.01 ** | 0.00 | 0.01 * | 0.00 | −0.01 ** | 0.00 | −0.01 ** | 0.00 | −0.00 | 0.00 |
| Gender | −0.09 | 0.11 | 0.31 ** | 0.10 | −0.07 | 0.12 | 0.05 | 0.08 | 0.06 | 0.07 | 0.05 | 0.07 |
| Education | 0.09 * | 0.05 | 0.06 | 0.05 | −0.10 | 0.05 | 0.07 * | 0.03 | 0.08 ** | 0.03 | 0.01 | 0.03 |
| Demands and Resources | ||||||||||||
| Cognitive demands | 0.19 ** | 0.06 | 0.12 * | 0.06 | 0.17 * | 0.07 | −0.11 * | 0.05 | −0.04 | 0.04 | −0.03 | 0.04 |
| Emotional demands | −0.14 * | 0.06 | −0.01 | 0.06 | −0.32 ** | 0.07 | 0.23 ** | 0.05 | 0.26 ** | 0.04 | 0.11 ** | 0.04 |
| Physical demands | 0.07 | 0.06 | −0.06 | 0.06 | 0.09 | 0.07 | 0.07 | 0.04 | 0.04 | 0.04 | 0.15 ** | 0.04 |
| Cognitive resources | 0.21 ** | 0.06 | 0.14 * | 0.06 | 0.16 * | 0.07 | 0.01 | 0.05 | −0.05 | 0.04 | 0.01 | 0.04 |
| Emotional resources | 0.31 ** | 0.06 | 0.30 ** | 0.06 | 0.30 ** | 0.07 | −0.09 | 0.05 | −0.13 ** | 0.04 | −0.10 * | 0.04 |
| Physical resources | −0.15 ** | 0.05 | 0.01 | 0.05 | −0.18 ** | 0.06 | 0.07 | 0.04 | 0.10 ** | 0.04 | 0.05 | 0.03 |
| Interaction effects | ||||||||||||
| Cogn. demands × emo. resources | −0.07 N | 0.06 | 0.01 D | 0.04 | −0.02 D | 0.04 | −0.07 N | 0.03 | ||||
| Cogn. demands × phys. resources | 0.12 D | 0.07 | −0.06 D | 0.05 | −0.06 N | 0.04 | −0.05 D | 0.04 | ||||
| Emo. demands × cogn. resources | 0.00 N | 0.06 | −0.09 * D | 0.04 | −0.05 D | 0.04 | −0.01 N | 0.04 | ||||
| Emo. demands × phys. resources | −0.16 ** D | 0.06 | 0.08 * N | 0.04 | 0.09 * D | 0.04 | 0.06 D | 0.04 | ||||
| Phys. demands × cogn. resources | −0.07 D | 0.07 | 0.01 D | 0.05 | 0.03 N | 0.04 | 0.07 D | 0.04 | ||||
| Phys. demands × emo. resources | 0.01 D | 0.07 | −0.00 N | 0.05 | −0.01 D | 0.05 | 0.02 D | 0.04 | ||||
| Model test | R2 = 0.28 | R2 = 0.23 | R2 = 0.27 | R2 = 0.20 | R2 = 0.29 | R2 = 0.16 | ||||||
| F (9, 387) = 16.61 ** | F (9, 387) = 13.38 ** | F (15, 381) = 9.52 ** | F (15, 381) = 6.31 ** | F (15, 381) = 10.40 ** | F (15, 381) = 4.91 ** | |||||||
| Delta R2 interaction model | 0.03 | 0.04 | 0.03 | 0.03 | ||||||||
| Source | Dependent Variable | |||||||||||
|---|---|---|---|---|---|---|---|---|---|---|---|---|
| Vitality | Fatigue | |||||||||||
| Cognitive Liveliness | Emotional Energy | Physical Strength | Cognitive | Emotional | Physical | |||||||
| B | SE | B | SE | B | SE | B | SE | B | SE | B | SE | |
| Control Variables | ||||||||||||
| Age | 0.01 | 0.01 | 0.00 | 0.01 | −0.00 | 0.01 | −0.00 | 0.01 | −0.01 | 0.00 | 0.00 | 0.01 |
| Gender | −0.12 | 0.09 | 0.42 ** | 0.09 | −0.16 | 0.10 | 0.05 | 0.07 | 0.23 ** | 0.07 | 0.19 ** | 0.06 |
| Education | −0.06 | 0.05 | −0.00 | 0.05 | −0.09 | 0.05 | 0.00 | 0.04 | 0.02 | 0.03 | 0.06 * | 0.03 |
| Demands and Resources | ||||||||||||
| Cognitive demands | 0.16 ** | 0.05 | 0.14 ** | 0.05 | 0.16 ** | 0.06 | −0.04 | 0.04 | 0.06 | 0.04 | −0.01 | 0.03 |
| Emotional demands | −0.10 | 0.06 | −0.10 | 0.06 | −0.36 ** | 0.05 | 0.22 ** | 0.05 | 0.31 ** | 0.04 | 0.14 ** | 0.04 |
| Physical demands | 0.07 | 0.05 | 0.01 | 0.05 | 0.11 * | 0.06 | −0.09 * | 0.04 | −0.10 ** | 0.04 | 0.01 | 0.03 |
| Cognitive resources | 0.17 ** | 0.06 | −0.01 | 0.06 | 0.22 ** | 0.06 | −0.18 ** | 0.05 | −0.10 * | 0.04 | −0.08 * | 0.04 |
| Emotional resources | 0.24 ** | 0.05 | 0.37 ** | 0.05 | 0.20 ** | 0.06 | −0.10 * | 0.04 | −0.16 ** | 0.04 | −0.06 | 0.03 |
| Physical resources | 0.09 | 0.06 | 0.04 | 0.05 | −0.03 | 0.06 | 0.05 | 0.04 | 0.08 | 0.04 | 0.00 | 0.03 |
| Interaction effects | ||||||||||||
| Cogn. demands × emo. resources | −0.02 D | 0.05 | −0.04 D | 0.05 | −0.02 D | 0.04 | −0.03 N | 0.03 | ||||
| Cogn. demands × phys. resources | 0.00 D | 0.06 | 0.04 N | 0.06 | −0.01 D | 0.05 | −0.02 D | 0.04 | ||||
| Emo. demands × cogn. resources | 0.13 * D | 0.06 | 0.14 * D | 0.06 | −0.10 * D | 0.05 | 0.02 N | 0.04 | ||||
| Emo. demands × phys. resources | 0.13 * N | 0.06 | 0.15 * D | 0.06 | −0.03 N | 0.05 | −0.00 D | 0.04 | ||||
| Phys. demands × cogn. resources | 0.00 D | 0.06 | −0.12 * N | 0.06 | −0.02 D | 0.05 | −0.03 D | 0.04 | ||||
| Phys. demands × emo. resources | 0.08 N | 0.05 | −0.01 D | 0.05 | −0.02 N | 0.04 | −0.06 D | 0.03 | ||||
| Model test | R2 = 0.16 | R2 = 0.20 | R2 = 0.17 | R2 = 0.15 | R2 = 0.22 | R2 = 0.13 | ||||||
| F (15, 481) = 6.05 ** | F (15, 481) = 8.01 ** | F (9, 487) = 11.37 ** | F (15, 481) = 5.71 ** | F (9, 487) = 15.43 ** | F (15, 481) = 4.90 ** | |||||||
| Delta R2 interaction model | 0.05 | 0.03 | 0.03 | 0.02 | ||||||||
References
- De Jonge, J.; Peeters, M.C.W. The vital worker: Towards sustainable performance at work. Int. J. Environ. Res. Public Health 2019, 16, 910. [Google Scholar] [CrossRef] [PubMed]
- Pfeffer, J. Building sustainable organizations: The human factor. Acad. Manag. Perspect. 2010, 24, 34–45. [Google Scholar]
- Hazelhet, E.; Picco, E.; Houkes, I.; Bosma, H.; De Rijk, A. Effectiveness of interventions to promote sustainable employability: A systematic review. Int. J. Environ. Res. Public Health 2019, 16, 1985. [Google Scholar] [CrossRef] [PubMed]
- Docherty, P.; Forslin, J.; Shani, A.B. Creating Sustainable Work Systems: Emerging Perspectives and Practice; Routledge: London, UK, 2002. [Google Scholar]
- Gillespie, N.A.; Walsh, M.; Winefield, A.H.; Dua, J.; Stough, C. Occupational stress in universities: Staff perceptions of the causes, consequences and moderators of stress. Work Stress 2001, 15, 53–72. [Google Scholar] [CrossRef]
- Winefield, A.H.; Jarrett, R. Occupational stress in university staff. Int. J. Stress Manag. 2001, 8, 285–298. [Google Scholar] [CrossRef]
- Kinman, G.; Court, S. Psychosocial hazards in UK universities: Adopting a risk assessment approach. High. Educ. Q. 2010, 64, 413–428. [Google Scholar] [CrossRef]
- Regehr, C.; Glancy, D.; Pitts, A. Interventions to reduce stress in university students: A review and meta-analysis. J. Affect. Disord. 2013, 148, 1–11. [Google Scholar] [CrossRef]
- Williams, G.; Thomas, K.; Smith, A.P. Stress and well-being of university staff: An investigation using the Demands-Resources-Individual Effects (DRIVE) model and Well-being Process Questionnaire (WPQ). Psychology 2017, 8, 1919–1940. [Google Scholar] [CrossRef]
- Mark, G.; Smith, A.P. A qualitative study of stress in university staff. Adv. Soc. Sci. Res. J. 2018, 5, 238–247. [Google Scholar] [CrossRef]
- Ribeiro, I.J.S.; Pereira, R.; Freire, I.V.; De Oliveira, B.G.; Casotti, C.A.; Boery, E.N. Stress and quality of life among university students: A systematic literature review. Health Prof. Educ. 2018, 4, 70–77. [Google Scholar] [CrossRef]
- Tomaselli, K.G. Making Sense of Research; Van Schaik: Pretoria, South Africa, 2018. [Google Scholar]
- Cotton, S.J.; Dollard, M.F.; De Jonge, J. Stress and student job design: Satisfaction, well-being, and performance in university students. Int. J. Stress Manag. 2002, 9, 147–162. [Google Scholar] [CrossRef]
- Chambel, M.J.; Curral, L. Stress in academic life: Work characteristics as predictors of student well-being and performance. Appl. Psychol. Int. Rev. 2005, 54, 135–147. [Google Scholar] [CrossRef]
- Rahmati, Z. The study of academic burnout in students with high and low level of self-efficacy. Procedia Soc. Behav. Sci. 2015, 171, 49–55. [Google Scholar] [CrossRef]
- Creed, P.A.; French, J.; Hood, M. Working while studying at university: The relationship between work benefits and demands and engagement and well-being. J. Vocat. Behav. 2015, 86, 48–57. [Google Scholar] [CrossRef] [Green Version]
- Hefner, J.; Eisenberg, D. Social support and mental health among college students. Am. J. Orthopsychiatr. 2009, 79, 491–499. [Google Scholar] [CrossRef] [PubMed]
- National Union of Students. Mental Health Poll November 2015; National Union of Students: London, UK, 2016. [Google Scholar]
- Radboud University Nijmegen. Research into Well-Being of Students of the Radboud University Nijmegen; Radboud University of Nijmegen: Nijmegen, The Netherlands, 2017. [Google Scholar]
- Darolia, R. Working (and studying) day and night: Heterogeneous effects of working on the academic performance of full-time and part-time students. Econ. Educ. Rev. 2014, 38, 38–50. [Google Scholar] [CrossRef]
- Karasek, R.A.; Theorell, T. Healthy Work. Stress, Productivity, and the Reconstruction of Working Life; Basic Books: New York, NY, USA, 1990. [Google Scholar]
- De Jonge, J.; Dormann, C. Why is my job so stressful? Characteristics, processes, and models of stress at work. In An Introduction to Work and Organisational Psychology: An International Perspective, 3rd ed.; Chmiel, N., Fraccaroli, F., Sverke, M., Eds.; Wiley-Blackwell: Chichester, UK, 2017; pp. 80–101. [Google Scholar]
- Daniels, K.; Le Blanc, P.M.; Davis, M. The models that made job design. In An Introduction to Contemporary Work Psychology; Peeters, M.C.W., De Jonge, J., Taris, T.W., Eds.; Wiley-Blackwell: Chichester, UK, 2014; pp. 63–88. [Google Scholar]
- Viswesvaran, C.; Sanchez, J.I.; Fisher, J. The role of social support in the process of work stress: A meta-analysis. J. Vocat. Behav. 1999, 54, 314–334. [Google Scholar] [CrossRef]
- Cohen, S.; Wills, T.A. Stress, social support, and the buffering hypothesis. Psychol. Bull. 1985, 98, 310–357. [Google Scholar] [CrossRef] [PubMed]
- Cutrona, C.E.; Russell, D.W. Type of social support and specific stress: Toward a theory of optimal matching. In Social Support: An Interactional View; Sarason, B.R., Sarason, I.G., Pierce, G.R., Eds.; Wiley: New York, NY, USA, 1990; pp. 319–366. [Google Scholar]
- De Jonge, J.; Dormann, C. The DISC Model: Demand induced strain compensation mechanisms in job stress. In Occupational Stress in the Service Professions; Dollard, M.F., Winefield, A.H., Winefield, H.R., Eds.; Taylor & Francis: London, UK, 2003; pp. 43–74. [Google Scholar]
- De Jonge, J.; Dormann, C. Stressors, resources, and strain at work: A longitudinal test of the triple-match principle. J. Appl. Psychol. 2006, 91, 1359–1374. [Google Scholar] [CrossRef] [PubMed]
- De Jonge, J.; Demerouti, E.; Dormann, C. Current theoretical perspectives in work psychology. In An Introduction to Contemporary Work Psychology; Peeters, M.C.W., De Jonge, J., Taris, T.W., Eds.; Wiley-Blackwell: Chichester, UK, 2014; pp. 89–113. [Google Scholar]
- De Jonge, J.; Dormann, C.; Van den Tooren, M. The demand induced strain compensation model: Renewed theoretical considerations and empirical evidence. In The Individual in the Changing Working Life; Näswall, K., Hellgren, J., Sverke, M., Eds.; Taylor & Francis: London, UK, 2008; pp. 67–87. [Google Scholar]
- Taris, T.W.; Kompier, M.A.J. Job characteristics and learning behavior: Review and psychological mechanisms. In Exploring Interpersonal Dynamics (Research in Occupational Stress and Well-Being, Volume 4); Perrewé, P.L., Ganster, D.C., Eds.; Emerald Group Publishing: Bingley, UK, 2004; pp. 127–166. [Google Scholar]
- De Jonge, J.; Gevers, J.M.P.; Dollard, M.F. Managing employee creativity and health in nursing homes: The moderating role of matching job resources and matching occupational rewards. Int. J. Stress Manag. 2014, 21, 361–383. [Google Scholar] [CrossRef]
- Hobfoll, S.E. Social and psychological resources and adaptation. Rev. Gen. Psychol. 2002, 6, 307–324. [Google Scholar] [CrossRef]
- Vohs, K.D.; Baumeister, R.F.; Ciarocco, N.J. Self-regulation and self-presentation: Regulatory resource depletion impairs impression management and effortful self-presentation depletes regulatory resources. J. Personal. Soc. Psychol. 2005, 88, 632–657. [Google Scholar] [CrossRef]
- Frese, M. Social support as a moderator of the relationship between work stressors and psychological dysfunctioning: A longitudinal study with objective measures. J. Occup. Health Psych. 1999, 4, 179–192. [Google Scholar] [CrossRef]
- Spreitzer, G.; Porath, C.L.; Gibson, C.B. Toward human sustainability: How to enable more thriving at work. Organ. Dyn. 2012, 41, 155–162. [Google Scholar] [CrossRef]
- Shirom, A. Feeling vigorous at work? The construct of vigor and the study of positive affect in organizations. In Emotional and Physiological Processes and Positive Intervention Strategies; Perrewe, P.L., Ganster, D.C., Eds.; Elsevier: Oxford, UK, 2004; Volume 3, pp. 135–164. [Google Scholar]
- Stein, K.; Martin, S.; Hann, D.; Jacobsen, P. A multidimensional measure of fatigue for use with cancer patients. Cancer Pract. 1998, 6, 143–152. [Google Scholar] [CrossRef]
- Van den Tooren, M.; De Jonge, J.; Dormann, C. The demand-induced strain compensation model: Background, key principles, theoretical underpinnings, and extended empirical evidence. In New Challenges for a Healthy Workplace in Human Services; Caetano, A., Silva, S.A., Chambel, M.J., Eds.; Rainer Hampp Verlag: Mering, Germany, 2011; pp. 13–59. [Google Scholar]
- De Jonge, J.; Dormann, C.; Van Vegchel, N.; Von Nordheim, T.; Dollard, M.; Cotton, S.; Van den Tooren, M. DISQ 2.1: The DISC Questionnaire English Version 2.1; Eindhoven University of Technology: Eindhoven, The Netherlands, 2009. [Google Scholar]
- Bova, N.; De Jonge, J.; Guglielmi, D. The demand-induced strain compensation questionnaire: A cross-national validation study. Stress Health 2015, 31, 236–244. [Google Scholar] [CrossRef]
- Van de Ven, B. Psychosocial Well-Being of Employees in the Technology Sector: The Interplay of Job Demands and Job Resources; Ghent University: Ghent, Belgium, 2011. [Google Scholar]
- Niks, I.M.W.; De Jonge, J.; Gevers, J.M.P.; Houtman, I.L.D. Divergent effects of detachment from work: A day-level study on employee creativity. Eur. J. Work Organ. Psychol. 2017, 26, 183–194. [Google Scholar] [CrossRef]
- Aiken, L.S.; West, S.G. Multiple Regression: Testing and Interpreting Interactions; Sage Publications: Newbury Park, CA, USA, 1991. [Google Scholar]
- Van den Tooren, M.; De Jonge, J. Managing job stress in nursing: What kind of resources do we need? J. Adv. Nurs. 2008, 63, 75–84. [Google Scholar] [CrossRef]
- Dawson, J.F.; Richter, A.W. Probing three-way interactions in moderated multiple regression: Development and application of a slope difference test. J. Appl. Psychol. 2006, 91, 917–926. [Google Scholar] [CrossRef]
- Van Vegchel, N.; De Jonge, J.; Landsbergis, P.A. Occupational stress in (inter)action: The interplay between job demands and job resources. J. Organ. Behav. 2005, 26, 535–560. [Google Scholar] [CrossRef]
- Lepine, J.A.; Podsakoff, N.P.; Lepine, M.A. A meta-analytic test of the challenge stressor-hindrance stressor framework: An explanation for inconsistent relationships among stressors and performance. Acad. Manag. J. 2005, 48, 764–775. [Google Scholar] [CrossRef]
- Van de Ven, B.; De Jonge, J.; Vlerick, P. Testing the triple-match principle in the technology sector: A two-wave longitudinal panel study. Appl. Psychol. Int. Rev. 2014, 63, 300–325. [Google Scholar] [CrossRef]
- Van de Ven, B.; Vlerick, P. Testing the triple-match principle among technology employees. Eur. J. Work Organ. Psychol. 2013, 22, 658–669. [Google Scholar] [CrossRef]
- Vonk, R. Schemes. In Cognitive Social Psychology: The Psychology of Daily Thinking and Acting; Vonk, R., Ed.; Lemma: Utrecht, The Netherlands, 1999; pp. 143–194. [Google Scholar]
- Baron, R.M.; Boudreau, L.A. An ecological perspective on integrating personality and social psychology. J. Personal. Soc. Psychol. 1987, 53, 1222–1228. [Google Scholar] [CrossRef]
- Gibson, J.J. The Ecological Approach to Visual Perception; Houghton Mifflin: Boston, MA, USA, 1979. [Google Scholar]
- Van den Tooren, M.; De Jonge, J.; Dormann, C. A matter of match? An experiment on choosing specific job resources in different demanding situations. Int. J. Stress Manag. 2012, 19, 311–332. [Google Scholar] [CrossRef]
- Daniels, K.; De Jonge, J. Match-making and match-breaking: Exploring the nature of match within and around job design. J. Occup. Organ. Psychol. 2010, 83, 1–16. [Google Scholar] [CrossRef]
- De Jonge, J.; Dormann, C.; Janssen, P.P.M.; Dollard, M.F.; Landeweerd, J.A.; Nijhuis, F.J.N. Testing reciprocal relationships between job characteristics and psychological well-being: A cross-lagged structural equation model. J. Occup. Organ. Psychol. 2001, 74, 29–46. [Google Scholar] [CrossRef]
- Ter Doest, L.; De Jonge, J. Testing causal models of job characteristics and psychological well-being: A replication study using cross-lagged structural equation modelling. J. Occup. Organ. Psychol. 2006, 79, 499–507. [Google Scholar] [CrossRef]
- Spector, P.E. Do not cross me: Optimizing the use of cross-sectional designs. J. Bus. Psychol. 2019, 34, 125–137. [Google Scholar] [CrossRef]
- Spector, P.E. Method variance in organizational research: Truth or urban legend? Organ. Res. Methods 2006, 9, 221–232. [Google Scholar] [CrossRef]
- Lance, C.E.; Dawson, B.; Birkelbach, D.; Hoffman, B.J. Method effects, measurement error, and substantive conclusions. Organ. Res. Methods 2010, 13, 435–455. [Google Scholar] [CrossRef]
- Podsakoff, P.M.; MacKenzie, S.B.; Podsakoff, N.P. Sources of method bias in social science research and recommendations how to control it. Ann. Rev. Psychol. 2012, 63, 539–569. [Google Scholar] [CrossRef]
- Tuckey, M.R.; Hayward, R. Global and occupation-specific emotional resources as buffers against the emotional demands of fire-fighting. Appl. Psychol. Int. Rev. 2011, 60, 1–23. [Google Scholar] [CrossRef]
- Siltaloppi, M.; Kinnunen, U.; Feldt, T. Recovery experiences as moderators between psychosocial work characteristics and occupational well-being. Work Stress 2009, 23, 330–348. [Google Scholar] [CrossRef]
- De Jonge, J.; Spoor, E.; Sonnentag, S.; Dormann, C.; Van den Tooren, M. “Take a break?!”: Off-job recovery, job demands and job resources as predictors of health, active learning, and creativity. Eur. J. Work Organ. Psychol. 2012, 21, 321–348. [Google Scholar] [CrossRef]
- Van den Tooren, M.; De Jonge, J. The role of matching job resources in different demanding situations at work: A vignette study. J. Occup. Organ. Psychol. 2010, 83, 39–54. [Google Scholar] [CrossRef]
- Van den Heuvel, M.; Demerouti, E.; Peeters, M.C.W. The job crafting intervention: Effects on job resources, self-efficacy, and affective well-being. J. Occup. Organ. Psychol. 2015, 88, 511–532. [Google Scholar] [CrossRef] [Green Version]
- Dorenbosch, L. Striking a balance between work effort and resource regeneration. In Sustainability and Human Resource Management; Ehnert, I., Harry, W., Zink, K.J., Eds.; Springer: Berlin/Heidelberg, Germany, 2014; pp. 155–180. [Google Scholar]


| Variables | M | SD | 1 | 2 | 3 | 4 | 5 | 6 | 7 | 8 | 9 | 10 | 11 | 12 | 13 | 14 | 15 |
|---|---|---|---|---|---|---|---|---|---|---|---|---|---|---|---|---|---|
| 1. Age | 27.47 | 12.49 | |||||||||||||||
| 2. Gender | 0.42 | 0.49 | 0.11 ** | ||||||||||||||
| 3. Education | 4.76 | 1.44 | 0.40 ** | 0.01 | |||||||||||||
| 4. Cognitive Demands | 3.50 | 0.62 | 0.02 | 0.01 | 0.12 ** | ||||||||||||
| 5. Emotional Demands | 2.22 | 0.73 | 0.07 * | 0.09 * | 0.06 | 0.42 ** | |||||||||||
| 6. Physical Demands | 1.50 | 0.68 | −0.07 * | −0.06 | −0.07 * | 0.21 ** | 0.42 ** | ||||||||||
| 7. Cognitive Resources | 3.68 | 0.69 | 0.08 * | 0.01 | 0.09 ** | 0.08 * | 0.19 ** | −0.05 | |||||||||
| 8. Emotional Resources | 3.29 | 0.81 | 0.08 * | 0.14 ** | 0.03 | 0.12 ** | −0.12 ** | −0.01 | 0.47 ** | ||||||||
| 9. Physical Resources | 3.32 | 1.21 | 0.04 | 0.04 | 0.01 | 0.08 * | −0.09 ** | 0.00 | 0.34 ** | 0.34 ** | |||||||
| 10. Cognitive Fatigue | 2.01 | 0.84 | −0.15 ** | 0.03 | −0.04 | 0.09 * | 0.28 ** | 0.12 ** | −0.11 ** | −0.13 ** | 0.02 | ||||||
| 11. Emotional Fatigue | 1.91 | 0.83 | −0.17 ** | 0.08 * | −0.01 | 0.19 ** | 0.38 ** | 0.13 ** | −0.15 ** | −0.20 ** | 0.02 | 0.68 ** | |||||
| 12. Physical Fatigue | 1.56 | 0.68 | −0.02 | 0.09 * | 0.05 | 0.12 * | 0.27 ** | 0.19 ** | −0.07 * | −0.10 ** | 0.01 | 0.51 ** | 0.57 ** | ||||
| 13. Cognitive Liveliness | 5.04 | 1.13 | 0.15 ** | −0.02 | 0.04 | 0.15 ** | −0.06 | 0.03 | 0.28 ** | 0.32 ** | 0.09 ** | −0.36 ** | −0.38 ** | −0.21 ** | |||
| 14. Emotional Energy | 5.30 | 1.11 | 0.12 ** | 0.21 ** | 0.06 | 0.14 ** | −0.02 | −0.03 | 0.22 ** | 0.38 ** | 0.14 ** | −0.15 ** | −0.17 ** | −0.07 * | 0.49 ** | ||
| 15. Physical Strength | 4.69 | 1.21 | 0.28 ** | −0.03 | −0.07 * | 0.08 * | −0.21 ** | 0.01 | 0.30 ** | 0.32 ** | 0.07 * | −0.42 ** | −0.52 ** | −0.35 ** | 0.57 ** | 0.39 ** |
| Source | Dependent Variable | |||||||||||
|---|---|---|---|---|---|---|---|---|---|---|---|---|
| Vitality | Fatigue | |||||||||||
| Cognitive Liveliness | Emotional Energy | Physical Strength | Cognitive | Emotional | Physical | |||||||
| B | SE | B | SE | B | SE | B | SE | B | SE | B | SE | |
| Control Variables | ||||||||||||
| Age | 0.02 ** | 0.00 | 0.01 ** | 0.00 | 0.01 ** | 0.00 | −0.01 ** | 0.00 | −0.01 ** | 0.00 | −0.00 | 0.00 |
| Gender | 0.10 | 0.11 | 0.28 ** | 0.10 | −0.02 | 0.11 | 0.04 | 0.08 | 0.05 | 0.07 | 0.05 | 0.07 |
| Education | 0.09 * | 0.05 | 0.06 | 0.05 | −0.07 | 0.05 | 0.06 | 0.03 | 0.07 * | 0.03 | −0.00 | 0.03 |
| Demands and Resources | ||||||||||||
| Cognitive demands | 0.19 ** | 0.06 | 0.08 | 0.06 | 0.20 ** | 0.06 | −0.11 * | 0.04 | −0.03 | 0.04 | −0.02 | 0.04 |
| Emotional demands | −0.14 * | 0.06 | −0.02 | 0.06 | −0.31 ** | 0.07 | 0.22 ** | 0.04 | 0.25 ** | 0.04 | 0.11 ** | 0.04 |
| Physical demands | 0.07 | 0.06 | −0.08 | 0.06 | 0.13 * | 0.06 | 0.08 | 0.04 | 0.04 | 0.04 | 0.14 ** | 0.04 |
| Cognitive resources | 0.21 ** | 0.06 | 0.11 | 0.06 | 0.21 ** | 0.07 | 0.00 | 0.05 | −0.05 | 0.04 | 0.02 | 0.04 |
| Emotional resources | 0.31 ** | 0.06 | 0.29 ** | 0.06 | 0.33 ** | 0.07 | −0.12 * | 0.05 | −0.16 ** | 0.04 | −0.13 ** | 0.04 |
| Physical resources | −0.15 ** | 0.05 | −0.05 | 0.06 | −0.15 ** | 0.06 | 0.11 * | 0.04 | 0.13 ** | 0.04 | 0.08 * | 0.04 |
| Interaction Effects | ||||||||||||
| Cogn. demands × cogn. resources | −0.03 D | 0.03 | −0.06 * T | 0.02 | −0.06 ** D | 0.02 | −0.05 * D | 0.02 | ||||
| Emo. demands × emo. resources | 0.03 T | 0.05 | −0.05 D | 0.04 | −0.05 T | 0.04 | −0.02 D | 0.03 | ||||
| Phys. demands × phys. resources | −0.15 * D | 0.07 | 0.12 * D | 0.05 | 0.11 * D | 0.05 | 0.09 T | 0.05 | ||||
| Model test | R2 = 0.28 | R2 = 0.25 | R2 = 0.24 | R2 = 0.20 | R2 = 0.30 | R2 = 0.16 | ||||||
| F (9, 387) = 16.61 ** | F (12, 384) = 10.86 ** | F (9, 387) = 13.91 ** | F (12, 384) = 8.17 ** | F (12, 384) = 13.78 ** | F (12, 384) = 5.90 ** | |||||||
| Delta R2 interaction model | 0.02 | 0.04 | 0.04 | 0.02 | ||||||||
| Source | Dependent Variable | |||||||||||
|---|---|---|---|---|---|---|---|---|---|---|---|---|
| Vitality | Fatigue | |||||||||||
| Cognitive Liveliness | Emotional Energy | Physical Strength | Cognitive | Emotional | Physical | |||||||
| B | SE | B | SE | B | SE | B | SE | B | SE | B | SE | |
| Control Variables | ||||||||||||
| Age | 0.01 | 0.01 | 0.00 | 0.01 | −0.00 | 0.01 | −0.00 | 0.01 | −0.00 | 0.01 | 0.00 | 0.01 |
| Gender | −0.11 | 0.09 | 0.43 ** | 0.09 | −0.16 | 0.10 | 0.05 | 0.07 | 0.24 ** | 0.07 | 0.19 ** | 0.06 |
| Education | −0.06 | 0.05 | 0.01 | 0.05 | −0.09 | 0.05 | 0.01 | 0.04 | 0.03 | 0.03 | 0.06 * | 0.03 |
| Demands and Resources | ||||||||||||
| Cognitive demands | 0.16 ** | 0.05 | 0.12 * | 0.05 | 0.16 ** | 0.06 | −0.04 | 0.04 | 0.04 | 0.04 | −0.01 | 0.03 |
| Emotional demands | −0.10 | 0.06 | −0.12 * | 0.06 | −0.36 ** | 0.06 | 0.23 ** | 0.05 | 0.27 ** | 0.04 | 0.13 ** | 0.04 |
| Physical demands | 0.07 | 0.05 | 0.03 | 0.05 | 0.11 * | 0.05 | −0.09 * | 0.04 | −0.09 * | 0.04 | 0.02 | 0.03 |
| Cognitive resources | 0.16 ** | 0.06 | −0.03 | 0.06 | 0.22 ** | 0.06 | −0.17 ** | 0.05 | −0.13 ** | 0.04 | −0.08 * | 0.04 |
| Emotional resources | 0.24 ** | 0.05 | 0.36 ** | 0.05 | 0.20 ** | 0.06 | −0.10 * | 0.04 | −0.18 ** | 0.04 | −0.07 * | 0.03 |
| Physical resources | 0.12 * | 0.06 | 0.00 | 0.05 | −0.03 | 0.06 | 0.03 | 0.05 | 0.07 | 0.04 | −0.01 | 0.04 |
| Interaction Effects | ||||||||||||
| Cogn. demands × cogn. resources | 0.08 * T | 0.03 | −0.06 * T | 0.03 | −0.03 D | 0.02 | −0.03 D | 0.02 | ||||
| Emo. demands × emo. resources | 0.06 D | 0.05 | −0.04 D | 0.04 | −0.11 ** T | 0.04 | −0.04 D | 0.03 | ||||
| Phys. demands × phys. resources | 0.18 * D | 0.07 | −0.08 D | 0.05 | 0.01 D | 0.05 | −0.05 T | 0.04 | ||||
| Model test | R2 = 0.15 | R2 = 0.18 | R2 = 0.17 | R2 = 0.15 | R2 = 0.25 | R2 = 0.13 | ||||||
| F (12, 484) = 7.31 ** | F (9, 487) = 10.84 ** | F (9, 487) = 11.37 ** | F (12, 484) = 6.84 ** | F (12, 484) = 13.20 ** | F (12, 484) = 5.86 ** | |||||||
| Delta R2 interaction model | 0.05 | 0.03 | 0.03 | 0.02 | ||||||||
| Interaction Pattern | Valid Interactions | Reversed Interactions | Tested Interactions | Ratio of Valid Interactions/Interactions Tested (%) |
|---|---|---|---|---|
| Employees (n = 397) Triple-match Double-match Non-match | 1 3 0 | 0 5 1 | 6 36 12 | 16.7% 8.3% 0.0% |
| Students (n = 497) Triple-match Double-match Non-match | 3 5 1 | 0 0 1 | 6 36 12 | 50.0% 13.9% 8.3% |
| Total (n = 894) Triple-match Double-match Non-match | 4 8 1 | 0 5 2 | 12 72 24 | 33.3% 11.1% 4.2% |
© 2019 by the authors. Licensee MDPI, Basel, Switzerland. This article is an open access article distributed under the terms and conditions of the Creative Commons Attribution (CC BY) license (http://creativecommons.org/licenses/by/4.0/).
Share and Cite
de Jonge, J.; Peeters, M.C.W.; Taris, T.W. Feeling Vital or Fatigued? Relations with Demands and Resources in a University Context. Int. J. Environ. Res. Public Health 2019, 16, 2893. https://doi.org/10.3390/ijerph16162893
de Jonge J, Peeters MCW, Taris TW. Feeling Vital or Fatigued? Relations with Demands and Resources in a University Context. International Journal of Environmental Research and Public Health. 2019; 16(16):2893. https://doi.org/10.3390/ijerph16162893
Chicago/Turabian Stylede Jonge, Jan, Maria C.W. Peeters, and Toon W. Taris. 2019. "Feeling Vital or Fatigued? Relations with Demands and Resources in a University Context" International Journal of Environmental Research and Public Health 16, no. 16: 2893. https://doi.org/10.3390/ijerph16162893
APA Stylede Jonge, J., Peeters, M. C. W., & Taris, T. W. (2019). Feeling Vital or Fatigued? Relations with Demands and Resources in a University Context. International Journal of Environmental Research and Public Health, 16(16), 2893. https://doi.org/10.3390/ijerph16162893