Corruption, Hidden Economy and Environmental Pollution: A Spatial Econometric Analysis Based on China’s Provincial Panel Data


Abstract
1. Introduction
2. Literature Review
2.1. Corruption and Environmental Pollution
2.2. Hidden Economy and Environmental Pollution
2.3. Limitations of Existing Research
3. Calculation of the Size of the Hidden Economy in China’s Provinces
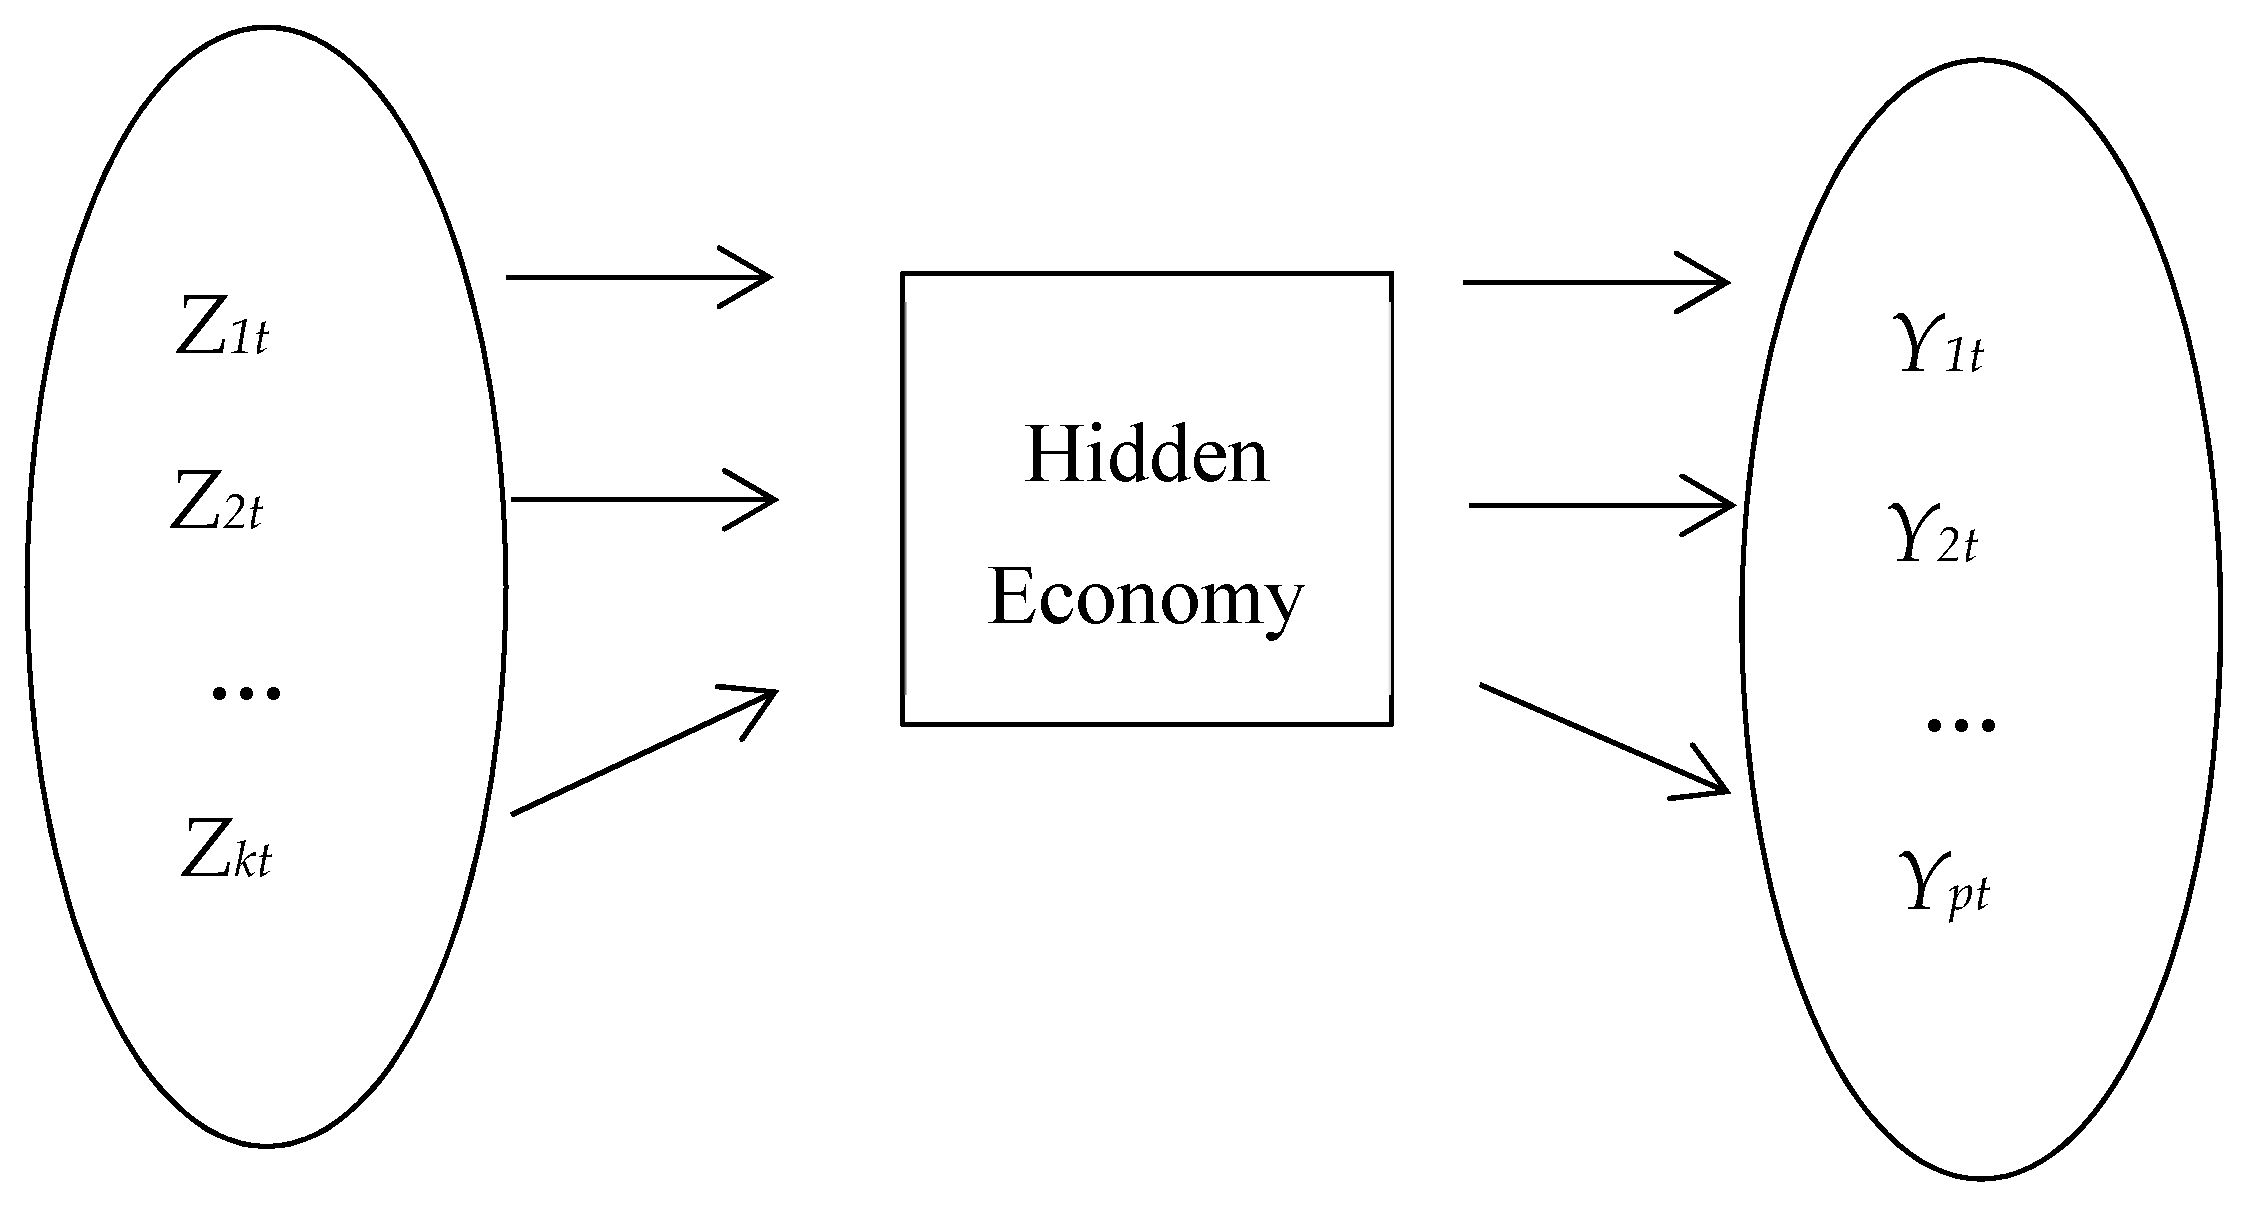
3.1. Calculation Method of the Hidden Economy
3.2. Explanation of Causes and Indicators
3.2.1. Causes
3.2.2. Indicators
3.2.3. Source of Data
3.3. Estimation Results of the MIMIC Model
3.4. Calculation Results of the Hidden Economy and Analysis
4. Empirical Analysis of the Influence of Corruption and Hidden Economy on Environmental Pollution
4.1. Specifications of the Econometric Model
4.2. Explanation of Variables
4.3. Empirical Results and Analysis
4.4. Robustness Test
4.5. Empirical Results in Different Regions
4.6. Discussion
5. Conclusions
Author Contributions
Funding
Acknowledgments
Conflicts of Interest
Appendix A

| Province | 1998 | 1999 | 2000 | 2001 | 2002 | 2003 | 2004 | 2005 | 2006 | 2007 |
|---|---|---|---|---|---|---|---|---|---|---|
| Beijing | 14.01 | 14.31 | 15.99 | 20.13 | 16.62 | 13.01 | 13.93 | 20.30 | 19.11 | 19.68 |
| Tianjin | 6.00 | 11.36 | 12.50 | 13.89 | 14.53 | 13.88 | 13.84 | 13.46 | 13.20 | 13.44 |
| Hebei | 7.34 | 8.13 | 8.99 | 11.39 | 13.02 | 14.10 | 14.38 | 14.13 | 13.71 | 13.92 |
| Liaoning | 10.31 | 10.82 | 11.17 | 9.74 | 18.92 | 18.96 | 19.18 | 16.59 | 15.10 | 12.84 |
| Shanghai | 9.71 | 11.48 | 11.48 | 1.75 | 14.72 | 14.75 | 14.08 | 1.09 | 13.07 | 13.12 |
| Jiangsu | 9.18 | 9.96 | 11.53 | 13.01 | 14.84 | 14.55 | 13.43 | 12.11 | 11.58 | 11.01 |
| Zhejiang | 13.18 | 14.51 | 14.76 | 16.26 | 17.82 | 17.48 | 17.11 | 15.62 | 14.58 | 13.73 |
| Fujian | 9.70 | 10.50 | 12.47 | 17.83 | 19.23 | 18.51 | 18.23 | 18.11 | 18.00 | 18.04 |
| Shandong | 10.70 | 10.69 | 11.28 | 11.77 | 12.53 | 12.24 | 11.47 | 11.22 | 11.12 | 10.93 |
| Guangdong | 8.74 | 9.20 | 9.96 | 11.56 | 11.83 | 13.11 | 10.00 | 9.18 | 9.25 | 9.06 |
| Hainan | 17.02 | 17.13 | 17.11 | 17.98 | 16.28 | 20.86 | 17.54 | 18.39 | 18.66 | 18.20 |
| Eastern China Average | 10.53 | 11.65 | 12.48 | 13.21 | 15.48 | 15.59 | 14.84 | 13.66 | 14.31 | 14.00 |
| Shanxi | 7.27 | 7.31 | 7.77 | 9.02 | 11.22 | 9.67 | 10.13 | 10.26 | 10.82 | 10.80 |
| Jilin | 6.36 | 6.98 | 7.89 | 6.93 | 7.82 | 9.44 | 8.87 | 8.87 | 8.82 | 8.35 |
| Heilongjiang | 4.19 | 4.58 | 6.15 | 8.70 | 9.10 | 7.78 | 8.42 | 8.22 | 8.16 | 8.01 |
| Anhui | 10.95 | 11.24 | 11.54 | 12.80 | 13.60 | 13.94 | 14.28 | 14.92 | 14.47 | 14.21 |
| Jiangxi | 11.95 | 12.80 | 14.30 | 16.28 | 16.44 | 17.30 | 17.13 | 16.42 | 16.86 | 16.18 |
| Henan | 10.23 | 10.55 | 10.75 | 11.68 | 12.05 | 12.63 | 13.61 | 13.67 | 13.91 | 13.69 |
| Hubei | 12.86 | 13.68 | 14.81 | 16.84 | 17.87 | 17.72 | 17.43 | 17.86 | 17.41 | 17.35 |
| Hunan | 9.19 | 9.44 | 9.23 | 10.08 | 10.09 | 11.22 | 10.89 | 10.57 | 10.65 | 10.70 |
| Central China Average | 9.12 | 9.57 | 10.31 | 11.54 | 12.27 | 12.47 | 12.59 | 12.60 | 12.64 | 12.41 |
| Neimenggu | 13.17 | 13.45 | 14.08 | 15.46 | 17.09 | 19.07 | 19.88 | 18.62 | 17.85 | 17.41 |
| Guangxi | 6.05 | 6.41 | 6.31 | 7.05 | 7.21 | 6.70 | 7.80 | 7.82 | 7.79 | 7.14 |
| Sichuan and Chongqing | 7.78 | 7.83 | 8.09 | 8.91 | 9.24 | 8.58 | 8.93 | 9.29 | 9.08 | 8.60 |
| Guizhou | 15.47 | 16.85 | 16.20 | 17.06 | 17.45 | 17.31 | 17.37 | 17.74 | 17.37 | 17.13 |
| Yunnan | 5.05 | 6.02 | 6.28 | 7.57 | 8.83 | 7.80 | 9.20 | 8.91 | 9.08 | 9.06 |
| Shaanxi | 16.99 | 14.86 | 15.26 | 18.02 | 17.86 | 20.97 | 21.08 | 22.88 | 22.34 | 22.28 |
| Gansu | 16.56 | 14.69 | 14.38 | 15.00 | 16.78 | 22.13 | 17.38 | 16.58 | 18.28 | 16.90 |
| Qinghai | 15.79 | 16.19 | 15.43 | 21.34 | 21.67 | 20.85 | 22.69 | 22.68 | 22.49 | 22.29 |
| Ningxia | 15.95 | 15.61 | 16.01 | 15.65 | 15.15 | 10.53 | 15.31 | 15.34 | 14.55 | 14.25 |
| Xinjiang | 9.12 | 8.92 | 9.05 | 8.85 | 8.86 | 6.93 | 8.20 | 9.07 | 9.00 | 9.19 |
| Western China Average | 12.19 | 12.08 | 12.11 | 13.49 | 14.01 | 14.09 | 14.78 | 14.89 | 14.78 | 14.43 |
| National Average | 10.72 | 11.22 | 11.75 | 12.85 | 14.09 | 14.21 | 14.20 | 13.79 | 14.01 | 13.71 |
| Province | 2008 | 2009 | 2010 | 2011 | 2012 | 2013 | 2014 | 2015 | 2016 | 2017 |
|---|---|---|---|---|---|---|---|---|---|---|
| Beijing | 20.58 | 16.70 | 15.71 | 17.11 | 15.81 | 15.30 | 13.09 | 12.42 | 12.27 | 11.24 |
| Tianjin | 13.52 | 13.63 | 13.69 | 13.89 | 13.82 | 14.06 | 13.80 | 13.70 | 13.28 | 13.25 |
| Hebei | 14.50 | 14.05 | 14.47 | 14.02 | 13.97 | 14.15 | 13.78 | 13.60 | 13.49 | 13.77 |
| Liaoning | 11.77 | 11.55 | 10.99 | 11.25 | 10.96 | 10.38 | 9.88 | 9.16 | 10.92 | 10.94 |
| Shanghai | 12.96 | 12.90 | 13.08 | 10.86 | 9.39 | 11.80 | 12.19 | 12.69 | 11.62 | 11.53 |
| Jiangsu | 10.76 | 10.59 | 10.13 | 10.28 | 10.00 | 9.21 | 9.05 | 8.79 | 7.86 | 7.80 |
| Zhejiang | 14.64 | 13.73 | 13.35 | 13.20 | 12.71 | 12.28 | 11.10 | 9.85 | 10.27 | 9.14 |
| Fujian | 17.69 | 17.46 | 16.88 | 16.61 | 16.26 | 16.25 | 15.52 | 15.67 | 15.54 | 15.75 |
| Shandong | 12.52 | 11.46 | 11.33 | 11.29 | 11.26 | 10.96 | 10.93 | 10.76 | 10.68 | 10.52 |
| Guangdong | 9.23 | 9.32 | 9.02 | 9.05 | 9.06 | 8.83 | 8.34 | 7.97 | 7.31 | 7.65 |
| Hainan | 20.23 | 19.32 | 18.09 | 11.95 | 13.41 | 13.96 | 14.86 | 14.85 | 14.46 | 13.91 |
| Eastern China Average | 14.40 | 13.70 | 13.34 | 12.68 | 12.42 | 12.47 | 12.05 | 11.77 | 11.61 | 11.41 |
| Shanxi | 11.15 | 12.94 | 11.85 | 11.56 | 11.16 | 10.60 | 11.19 | 11.21 | 10.90 | 11.04 |
| Jilin | 8.45 | 8.31 | 7.80 | 7.60 | 7.47 | 7.45 | 6.69 | 6.65 | 6.50 | 6.50 |
| Heilongjiang | 7.88 | 7.94 | 7.86 | 7.58 | 7.60 | 8.13 | 8.35 | 8.56 | 7.87 | 7.98 |
| Anhui | 13.92 | 14.01 | 13.25 | 13.56 | 13.42 | 12.61 | 11.82 | 11.44 | 11.19 | 10.22 |
| Jiangxi | 16.25 | 16.42 | 15.77 | 14.12 | 14.58 | 15.67 | 15.99 | 16.14 | 15.97 | 15.23 |
| Henan | 13.63 | 13.89 | 13.41 | 13.30 | 12.33 | 12.81 | 12.19 | 12.07 | 11.85 | 11.17 |
| Hubei | 17.21 | 17.02 | 16.82 | 16.38 | 15.22 | 13.51 | 11.39 | 9.44 | 8.13 | 8.90 |
| Hunan | 10.40 | 10.26 | 10.23 | 10.20 | 10.30 | 10.28 | 10.05 | 9.53 | 10.15 | 9.52 |
| Central China Average | 12.36 | 12.60 | 12.12 | 11.79 | 11.51 | 11.38 | 10.96 | 10.63 | 10.32 | 10.07 |
| Neimenggu | 17.59 | 17.10 | 16.92 | 16.47 | 15.91 | 15.14 | 14.57 | 15.01 | 15.13 | 15.04 |
| Guangxi | 7.04 | 7.05 | 6.92 | 6.53 | 6.40 | 6.22 | 5.89 | 5.35 | 5.15 | 3.97 |
| Sichuan and Chongqing | 9.24 | 8.80 | 8.65 | 8.66 | 8.34 | 8.50 | 8.36 | 7.91 | 7.64 | 7.10 |
| Guizhou | 17.01 | 16.46 | 16.01 | 15.95 | 14.79 | 14.59 | 14.53 | 14.10 | 13.00 | 12.80 |
| Yunnan | 9.14 | 9.25 | 9.29 | 8.94 | 8.91 | 8.75 | 8.48 | 8.35 | 7.34 | 6.56 |
| Shaanxi | 21.86 | 22.16 | 21.88 | 20.48 | 17.75 | 17.95 | 18.17 | 17.99 | 17.48 | 17.64 |
| Gansu | 16.43 | 16.42 | 16.17 | 15.66 | 13.79 | 12.04 | 11.42 | 11.16 | 10.88 | 13.34 |
| Qinghai | 22.55 | 22.97 | 22.92 | 22.91 | 20.85 | 21.06 | 20.16 | 20.27 | 18.77 | 18.89 |
| Ningxia | 14.58 | 14.66 | 14.50 | 14.74 | 14.14 | 14.02 | 13.47 | 12.95 | 11.90 | 12.08 |
| Xinjiang | 8.90 | 9.24 | 8.03 | 8.42 | 8.72 | 8.81 | 8.24 | 7.33 | 6.54 | 6.65 |
| Western China Average | 14.43 | 14.41 | 14.13 | 13.88 | 12.96 | 12.71 | 12.33 | 12.04 | 11.38 | 11.41 |
| National Average | 13.85 | 13.64 | 13.28 | 12.85 | 12.36 | 12.25 | 11.84 | 11.55 | 11.18 | 11.04 |
References
- Chen, H.; Yu, H.; Li, J.; Song, X. The impact of environmental regulation, shadow economy, and corruption on environmental quality: Theory and empirical evidence from China. J. Clean. Product. 2018, 195, 200–214. [Google Scholar] [CrossRef]
- Huang, P.C. China’s neglected informal economy: Reality and theory. Mod. China 2009, 35, 405–438. [Google Scholar] [CrossRef]
- Feige, E.L. The underground economy and the currency enigma. Public Finance 1994, 49, 119–136. [Google Scholar]
- Blackman, A. Informal sector pollution control: What policy options do we have? World Dev. 2000, 28, 2067–2082. [Google Scholar] [CrossRef]
- Desai, U. Ecological Policy and Politics in Developing Countries: Economic Growth, Democracy, and Environment; State University of New York Press: New York, NY, USA, 1998. [Google Scholar]
- Pellegrini, L.; Gerlagh, R. Corruption and environmental policies: What are the implications for the enlarged EU? Environ. Policy Gov. 2006, 16, 139–154. [Google Scholar] [CrossRef]
- Ivanova, K. Corruption and air pollution in Europe. Q. J. Econ. 2011, 63, 49–70. [Google Scholar] [CrossRef]
- Hubbard, T.N. An empirical examination of moral hazard in the vehicle inspection market. Rand J. Econ. 1998, 29, 406–426. [Google Scholar] [CrossRef]
- Oliva, P. Environmental regulations and corruption: Automobile emissions in Mexico City. J. Polit. Econ. 2015, 123, 686–724. [Google Scholar] [CrossRef]
- Zhang, Y.J.; Jin, Y.L.; Chevallier, J.; Shen, B. The effect of corruption on carbon dioxide emissions in APEC countries: A panel quantile regression analysis. Technol. Forecast. Soc. Chang. 2016, 112, 220–227. [Google Scholar] [CrossRef]
- Lisciandra, M.; Migliardo, C. An empirical study of the impact of corruption on environmental performance: Evidence from panel data. Environ. Res. Econ. 2017, 68, 297–318. [Google Scholar] [CrossRef]
- Chang, C.P.; Hao, Y. Environmental performance, corruption and economic growth: Global evidence using a new data set. Appl. Econ. 2017, 49, 498–514. [Google Scholar] [CrossRef]
- Lapatinas, A.; Litina, A.; Sartzetakis, E.S. Environmental projects in the presence of corruption. Int. Tax Public Finance 2018, 26, 103–144. [Google Scholar] [CrossRef]
- Wang, Z.; Danish; Zhang, B.; Bo, W. The moderating role of corruption between economic growth and CO2 emissions: Evidence from BRICS economies. Energy 2018, 148, 506–513. [Google Scholar] [CrossRef]
- Dincer, O.C.; Fredriksson, P.G. Corruption and environmental regulatory policy in the United States: Does trust matter? Res. Energy Econ. 2018, 54, 212–225. [Google Scholar] [CrossRef]
- Arminen, H.; Menegaki, A.N. Corruption, climate and the energy-environment-growth nexus. Energy Econ. 2019, 80, 621–634. [Google Scholar] [CrossRef]
- Dirienzo, C.E.; Das, J. Women in government, environment, and corruption. Environ. Dev. 2019, 30, 103–113. [Google Scholar] [CrossRef]
- Sinha, A.; Gupta, M.; Shahbaz, M.; Sengupta, T. Impact of corruption in public sector on environmental quality: Implications for sustainability in BRICS and next 11 countries. J. Clean. Prod.. 2019, 232, 1379–1393. [Google Scholar] [CrossRef]
- Balsalobre-Lorente, D.; Shahbaz, M.; Jabbour, C.J.C.; Driha, O.M. The role of energy innovation and corruption in carbon emissions: Evidence based on the EKC hypothesis. Energy Environ. Strateg. Era Glob. 2019, 271–304. [Google Scholar]
- Huynh, C.M.; Hoang, H.H. Foreign direct investment and air pollution in Asian countries: Does institutional quality matter? Appl. Econ. Lett. 2019, 26, 1388–1392. [Google Scholar] [CrossRef]
- Chaudhuri, S.; Mukhopadhyay, U. Pollution and informal sector: A theoretical analysis. J. Econ. Integr. 2006, 21, 363–378. [Google Scholar] [CrossRef]
- Baksi, S.; Bose, P. Environmental regulation in the presence of an informal sector. Am. J. Cardiol. 2010, 105, 152–157. [Google Scholar]
- Elgin, C.; Mazhar, U. Environmental regulation, pollution and the informal economy. SBP Res. Bull. 2013, 9, 62–81. [Google Scholar]
- Abid, M. The close relationship between informal economic growth and carbon emissions in Tunisia since 1980: The (ir)relevance of structural breaks. Sustain. Cities Soc. 2015, 15, 11–21. [Google Scholar] [CrossRef]
- Imamoglu, H. Is the informal economic activity a determinant of environmental quality? Environ. Sci. Pollut. Res. 2018, 25, 29078–29088. [Google Scholar] [CrossRef]
- Canh, N.P.; Thanh, S.D.; Schinckus, C.; Bensemann, J.; Thanh, L.T. Global emissions: A new contribution from the shadow economy. Int. J. Energy Econ. Policy 2019, 9, 320–337. [Google Scholar] [CrossRef]
- Zhou, Z. The underground economy and carbon dioxide (CO2) emissions in China. Sustainability 2019, 11, 2802. [Google Scholar] [CrossRef]
- Elgin, C.; Oztunali, O. Pollution and informal economy. Econ. Syst. 2014, 38, 333–349. [Google Scholar] [CrossRef]
- Biswas, A.K.; Farzanegan, M.R.; Thum, M. Pollution, shadow economy and corruption: Theory and evidence. Ecol. Econ. 2012, 75, 114–125. [Google Scholar] [CrossRef]
- Anselin, L. Spatial Econometrics: Methods and Models; Klwer Academic Plublishers: Dordrecht, The Netherlands, 1988. [Google Scholar]
- Cantekin, K.; Elgin, C. Extent and growth effects of informality in Turkey: Evidence from a firm-level survey. Singap. Econ. Rev. 2017, 62, 1017–1037. [Google Scholar] [CrossRef]
- Medvedev, D.; Oviedo, A.M. Informality and profitability: Evidence from a new firm survey in Ecuador. J. Dev. Stud. 2016, 52, 412–427. [Google Scholar] [CrossRef]
- Danopoulos, C.P.; Znidaric, B. Informal economy, tax evasion, and poverty in a democratic setting: Greece. Mediterr. Q. 2007, 18, 67–84. [Google Scholar] [CrossRef]
- Elgin, C.; Erturk, F. Informal economies around the world: Measures, determinants and consequences. Eurasian Econ. Rev. 2019, 9, 221–237. [Google Scholar] [CrossRef]
- Tanzi, V. The underground economy in the United States: Annual estimates, 1930–1980. IMF Staff Pap. 1983, 30, 283–305. [Google Scholar] [CrossRef]
- Orsi, R.; Raggi, D.; Turino, F. Size, trend, and policy implications of the underground economy. Rev. Econ. Dyn. 2014, 17, 417–436. [Google Scholar] [CrossRef]
- Bajada, C.; Schneider, F. The shadow economies of the Asia-Pacific. Pac. Econ. Rev. 2005, 10, 379–401. [Google Scholar] [CrossRef]
- Dell’anno, R.; Solomon, O.H. Shadow economy and unemployment rate in USA: Is there a structural relationship? An empirical analysis. Appl. Econ. 2008, 40, 2537–2555. [Google Scholar] [CrossRef]
- Popescu, G.; Davidescu, A.; Huidumac, C. Researching the main causes of the Romanian shadow economy at the micro and macro levels: Implications for sustainable development. Sustainability 2018, 10, 3518. [Google Scholar] [CrossRef]
- Giles, D.E.A. Modelling the hidden economy and the tax-gap in New Zealand. Empir. Econ. 1999, 24, 621–640. [Google Scholar] [CrossRef]
- Alañón, A.; Gómez-Antonio, M. Estimating the size of the shadow economy in Spain: A structural model with latent variables. Appl. Econ. 2005, 37, 1011–1025. [Google Scholar] [CrossRef]
- Thomas, J.J. Informal Economic Activity; University of Michigan Press: Michigan, MI, USA, 1992. [Google Scholar]
- Schneider, F.; Buehn, A.; Montenegro, C.E. Shadow economies all over the world: New estimates for 162 countries from 1999 to 2007. World Bank Policy Research Working Paper; World Bank Group: Washington, WA, USA, 2010. [Google Scholar]
- Schneider, F.G. Shadow economies around the world: What do we know? Eur. J. Polit. Econ. 2005, 21, 598–642. [Google Scholar] [CrossRef]
- Schneider, F.; Dell’anno, R. The shadow economy of Italy and other OECD countries: What do we know? J. Publ. Finance Public Choice 2003, 21, 97–120. [Google Scholar]
- Schneider, F. Estimating the size of the Danish shadow economy using the currency demand approach: An attempt. Scand. J. Econ. 1986, 88, 643–668. [Google Scholar] [CrossRef]
- Schneider, F.; Enste, D.H. Shadow economies: Size, causes, and consequences. J. Econ. Lit. 2000, 38, 77–114. [Google Scholar] [CrossRef]
- Saafi, S.; Farhat, A. Is there a causal relationship between unemployment and informal economy in Tunisia: Evidence from linear and non-linear Granger causality. Econ. Bull. 2015, 35, 1191–1204. [Google Scholar]
- Ihrig, J.; Moe, K.S. Lurking in the shadows: The informal sector and government policy. J. Dev. Econ. 2004, 73, 541–557. [Google Scholar] [CrossRef]
- Bordignon, M.; Zanardi, A. Tax evasion in Italy. Giornale Degli Economisti e Annali di Economia 1997, 56, 169–210. [Google Scholar]
- Jin-Chang, L.; Ai-Ting, X. Research on estimation method of non-observed economy. Stat. Res. 2005, 21–26. (In Chinese) [Google Scholar]
- Tobler, W. A computer movie simulating urban growth in the Detroit region. Econ. Geogr. 1970, 234–240. [Google Scholar] [CrossRef]
- Danaeifar, I. The estimation parameters of Kuznets spatial environmental curve in European countries (a case study of CO2 and PM10 and incidence of tuberculosis and life expectancy at birth). Eur. Online J. Nat. Soc. Sci. Proc. 2014, 3, 439–448. [Google Scholar]
- Sinha, A.; Bhatt, M. Environmental kuznets curve for CO2 and NOx emissions: A case study of India. Eur. J. Sustain. Dev. 2017, 6, 267–276. [Google Scholar] [CrossRef]
- Ge, X.; Zhou, Z.; Zhou, Y.; Ye, X.; Liu, S. A spatial panel data analysis of economic growth, urbanization, and NOx emissions in China. Int. J. Environ. Res Public Health 2018, 15, 725. [Google Scholar] [CrossRef] [PubMed]
- Dong, K.; Hochman, G.; Kong, X.; Sun, R.; Wang, Z. Spatial econometric analysis of China’s PM10 pollution and its influential factors: Evidence from the provincial level. Ecol. Indic. 2019, 96, 317–328. [Google Scholar] [CrossRef]
- Wang, Y.; Han, R.; Kubota, J. Is there an environmental Kuznets curve for SO2 emissions? A semi-parametric panel data analysis for China. Renew. Sustain. Energy Rev. 2016, 54, 1182–1188. [Google Scholar] [CrossRef]
- Tao, S.; Zheng, T.; Lianjun, T. An empirical test of the environmental Kuznets curve in China: A panel cointegration approach. China Econ. Rev. 2008, 19, 381–392. [Google Scholar]
- He, J.; Wang, H. Economic structure, development policy and environmental quality: An empirical analysis of environmental Kuznets curves with Chinese municipal data. Ecol. Econ. 2012, 76, 49–59. [Google Scholar] [CrossRef]
- National Bureau of Statistics of China. China Statistical Yearbook 2018; China Statistical Press: Beijing, China, 2018.
- Li, X. Measuring local corruption in China: A cautionary tale. J. Chin. Polit. Sci. 2016, 21, 21–38. [Google Scholar] [CrossRef]
- Treisman, D. What have we learned about the causes of corruption from ten years of cross-national empirical research? Annu. Rev. Polit. Sci. 2007, 10, 211–244. [Google Scholar] [CrossRef]
- Wang, Y. Institutions and bribery in an authoritarian state. Stud. Comp. Int. Dev. 2014, 49, 217–241. [Google Scholar] [CrossRef]
- Fisman, R.; Gatti, R. Decentralization and corruption: Evidence across countries. J. Public Econ. 2002, 83, 325–345. [Google Scholar] [CrossRef]
- Cole, M.A.; Elliott, R.J.; Zhang, J. Corruption, governance and FDI location in China: A province-level analysis. J. Dev. Stud. 2009, 45, 1494–1512. [Google Scholar] [CrossRef]
- Xu, X.; Li, Y.; Liu, X.; Gan, W. Does religion matter to corruption? Evidence from China. China Econ. Rev. 2017, 42, 34–49. [Google Scholar] [CrossRef]
- Mirshojaeian, H.H.; Rahbar, F. Spatial environmental Kuznets curve for asian countries: Study of CO2 and PM10. J. Environ. Stud. 2011, 37, 1–3. [Google Scholar]
- Maddison, D. Modelling sulphur emissions in Europe: A spatial econometric approach. Oxf. Econ. Pap. 2007, 59, 726–743. [Google Scholar] [CrossRef]
- Qian, L.; Song, J.; Wang, E.; Hao, H.; Zhang, J.; Wang, Y. Economic growth and pollutant emissions in China: A spatial econometric analysis. Stoch. Environ. Res. Risk Assess. 2014, 28, 429–442. [Google Scholar]
- Yin, J.; Zheng, M.; Chen, J. The effects of environmental regulation and technical progress on CO2 Kuznets curve: An evidence from China. Energy Policy 2015, 77, 97–108. [Google Scholar] [CrossRef]
- Wang, Q.; Zeng, Y.-E.; Wu, B.-W. Exploring the relationship between urbanization, energy consumption, and CO2 emissions in different provinces of China. Renew. Sustain. Energy Rev. 2016, 54, 1563–1579. [Google Scholar] [CrossRef]
- Wang, P.; Wu, W.; Zhu, B.; Wei, Y. Examining the impact factors of energy-related CO2 emissions using the STIRPAT model in Guangdong Province, China. Appl. Energy 2013, 106, 65–71. [Google Scholar] [CrossRef]
- Lee, C.C.; Chiu, Y.B.; Sun, C.H. Does one size fit all? A reexamination of the environmental Kuznets curve using the dynamic panel data approach. Rev. Agric. Econ. 2009, 31, 751–778. [Google Scholar] [CrossRef]
- Yu, H.; Chen, H.; Zhang, Q. Will income inequality affect environmental quality? Analysis based on China’s provincial panel data. Ecol. Indic. 2016, 67, 533–542. [Google Scholar]
- Du, L.; Chu, W.; Cai, S. Economic development and carbon dioxide emissions in China: Provincial panel data analysis. China Econ. Rev. 2012, 23, 371–384. [Google Scholar] [CrossRef]
- Grossman, G.M.; Krueger, A.B. Environmental impacts of a North American free trade agreement. Natl. Bur. Econ. Res. 1991. [Google Scholar] [CrossRef]
- Sun, W.; Chen, Z.; Wang, D. Can land marketization help reduce industrial pollution? Int. J. Environ. Res. Public Health 2019, 16, 2213. [Google Scholar] [CrossRef]
- Podojil, S.; Jacob, M.C.; Tuccillo, C.; Maier, D. FDI in Chinese cities: Spillovers and impact on growth. World Economy 2010, 30, 837–862. [Google Scholar]
- Rey, S.J.; Montouri, B.D. US regional income convergence: A spatial econometric perspective. Reg. Stud. 1999, 33, 143–156. [Google Scholar] [CrossRef]
- Elhorst, J.P. Unconditional maximum likelihood estimation of linear and log-linear dynamic models for spatial panels. Geogr. Anal. 2005, 37, 85–106. [Google Scholar] [CrossRef]
- Lacombe, D.J. Does econometric methodology matter? An analysis of public policy using spatial econometric techniques. Geogr. Anal. 2004, 36, 105–118. [Google Scholar] [CrossRef]
- Blonigen, B.A.; Davies, R.B.; Waddell, G.R.; Naughton, H.T. FDI in space: Spatial autoregressive relationships in foreign direct investment. Eur. Econ. Rev. 2007, 51, 1303–1325. [Google Scholar]
- Anselin, L.; Bera, A.K.; Florax, R.; Yoon, M.J. Simple diagnostic tests for spatial dependence. Region. Sci. Urban Econ. 1996, 26, 77–104. [Google Scholar]
- Cole, M.A. Corruption, income and the environment: An empirical analysis. Ecolog. Econ. 2007, 62, 637–647. [Google Scholar] [CrossRef]

| Variables | (1) | (2) | (3) | (4) | (5) | (6) | (7) |
|---|---|---|---|---|---|---|---|
| TT | 0.12 *** (0.06) | ||||||
| IT | 2.16 *** (0.22) | 2.01 *** (0.11) | 1.72 *** (0.15) | 1.75 *** (0.18) | 1.71 *** (0.13) | 1.65 *** (0.17) | |
| DT | −1.6 *** (0.27) | −1.2 *** (0.11) | −1.9 *** (0.14) | −1.8 *** (0.17) | −1.9 *** (0.13) | −2.1 *** (0.20) | |
| INC | −0.06 * (0.03) | −0.1 *** (0.01) | −0.1 *** (0.01) | −0.1 *** (0.01) | −0.1 *** (0.01) | ||
| UNE | 0.69 *** (0.14) | 0.33 *** (0.12) | 0.77 *** (0.13) | 0.69 *** (0.12) | 0.36 ** (0.18) | 1.11 *** (0.16) | |
| GR | −2.2 *** (0.36) | −2.3 *** (0.16) | |||||
| SFE | −0.09 *** (0.02) | −0.01 (0.02) | −0.01 (0.01) | −0.02 ** (0.01) | |||
| RGDP | 1 | 1 | 1 | 1 | 1 | 1 | 1 |
| LAB | −1.08 ** (0.53) | −0.71 * (0.37) | −1.23 *** (0.28) | −1.41 *** (0.26) | −1.36 *** (0.28) | −1.08 *** (0.32) | −0.42 *** (0.39) |
| 16.74 p = 0.02 | 19.27 p = 0.01 | 13.40 p = 0.03 | 1.89 p = 0.58 | 0.96 p = 0.75 | 1.49 p = 0.62 | 0.23 p = 0.81 | |
| df (degree of freedom) | 6 | 4 | 5 | 3 | 4 | 2 | 2 |
| RMSEA | 0.11 | 0.12 | 0.12 | 0.15 | 0.07 | 0.02 | 0.01 |
| CFI | 0.83 | 0.80 | 0.88 | 0.86 | 0.93 | 1.00 | 1.00 |
| SRMR | 0.14 | 0.12 | 0.13 | 0.08 | 0.09 | 0.05 | 0.01 |
| Variable | Meaning | Unit |
|---|---|---|
| EP1 | Per capita industrial waste gas emission | normal cubic meter/person |
| EP2 | Per capita industrial waste water dischare | ton/person |
| COR1 | Number of duty crime cases per public servant | case/ten thousand people |
| COR2 | Number of duty crime cases per capita | case/million people |
| SE | Share of hidden economy in GDP | % |
| Y | Per capita gross domestic product | Yuan/person |
| IS | Added value of second industry’s share of GDP | % |
| PD | Population at the end of the year per land area | person/suare kilometer |
| OPEN | Value of import and export’s share of GDP | % |
| EE | Energy consumption per real GDP | tons of stadard coal/100,000 yuan |
| URB | Urban population’s share of total pollution at the end of the year | % |
| Explanatory Variables | EP1 | EP2 | ||||
|---|---|---|---|---|---|---|
| (1) | (2) | (3) | (4) | (5) | (6) | |
| COR1 | 0.16 ** | 0.16 ** | 0.14 ** | 0.26 ** | 0.30 *** | 0.29 *** |
| (0.09) | (0.09) | (0.09) | (0.11) | (0.11) | (0.11) | |
| SE | 0.04 ** | 0.04 ** | 0.04 ** | 0.05 ** | 0.05 ** | 0.05 ** |
| (0.02) | (0.02) | (0.02) | (0.02) | (0.02) | (0.02) | |
| COR1* SE | 0.01 *** | 0.01 *** | 0.01 *** | 0.01 *** | 0.01 ** | 0.01 ** |
| (0.01) | (0.01) | (0.01) | (0.01) | (0.01) | (0.01) | |
| Y | 1.62 *** | 1.61 *** | 1.65 *** | 0.51 * | 0.25 ** | 0.33 ** |
| (0.24) | (0.22) | (0.23) | (0.16) | (0.16) | (0.16) | |
| Y2 | −0.04 *** | −0.04 *** | −0.04 *** | −0.03 *** | −0.02 *** | −0.03 *** |
| (0.01) | (0.01) | (0.01) | (0.04) | (0.04) | (0.04) | |
| IS | 0.01 *** | 0.01 *** | 0.01 *** | 0.01 *** | 0.01 ** | 0.01 *** |
| (0.01) | (0.01) | (0.01) | (0.02) | (0.01) | (0.01) | |
| PD | −0.47 *** | −0.37 ** | −0.32 ** | −0.77 *** | −0.60 *** | −0.65 *** |
| (0.15) | (0.14) | (0.14) | (0.18) | (0.18) | (0.18) | |
| OPEN | 0.01 ** | 0.01 ** | 0.01 *** | 0.01 ** | 0.01 ** | 0.01 * |
| (0.01) | (0.01) | (0.01) | (0.01) | (0.01) | (0.01) | |
| EE | 0.73 *** | 0.73 *** | 0.73 *** | 0.87 *** | 0.77 *** | 0.79 *** |
| (0.05) | (0.05) | (0.05) | (0.07) | (0.07) | (0.07) | |
| URB | 0.02 *** | 0.02 *** | 0.02 *** | 0.01 ** | 0.01 * | 0.01 * |
| (0.01) | (0.01) | (0.01) | (0.01) | (0.01) | (0.01) | |
| 0.28 *** | 0.22 *** | 0.18 *** | 0.59 ** | 0.16 ** | 0.04 ** | |
| (0.06) | (0.04) | (0.04) | (0.13) | (0.07) | (0.06) | |
| R2 | 0.86 | 0.84 | 0.79 | 0.88 | 0.81 | 0.79 |
| LM Lag | 359 *** | 15 *** | 34.9 *** | 5.45 ** | 4.61 ** | 3.32 ** |
| LM Lag (Robust) | 357 *** | 15 *** | 34.8 *** | 5.51 ** | 4.56 ** | 3.28 ** |
| LM Error | 1.91 | 0.05 | 0.11 | 0.01 | 0.05 | 0.04 |
| LM Error (Robust) | 0.17 | 0.01 | 0.01 | 0.07 | 0.01 | 0.01 |
| Weight Type | WD | WE | WM | WD | WE | WM |
| Explanatory Variables | EP1 | EP2 | ||||
|---|---|---|---|---|---|---|
| (1) | (2) | (3) | (4) | (5) | (6) | |
| COR2 | 0.09 *** | 0.08 *** | 0.07 *** | 0.32 ** | 0.38 *** | 0.37 *** |
| (0.11) | (0.11) | (0.11) | (0.13) | (0.13) | (0.13) | |
| SE | 0.02 ** | 0.02 ** | 0.02 ** | 0.07 *** | 0.08 *** | 0.08 *** |
| (0.02) | (0.02) | (0.02) | (0.03) | (0.03) | (0.03) | |
| COR2*SE | 0.01 *** | 0.01 ** | 0.01 ** | 0.02 *** | 0.02 *** | 0.02 *** |
| (0.01) | (0.01) | (0.01) | (0.01) | (0.01) | (0.01) | |
| Y | 1.58 *** | 1.58 *** | 1.62 *** | 0.56 ** | 0.31 ** | 0.38 ** |
| (0.23) | (0.22) | (0.23) | (0.26) | (0.27) | (0.27) | |
| Y2 | −0.04 *** | −0.04 ** | −0.04 ** | −0.04 *** | −0.02 ** | 0.03 ** |
| (0.01) | (0.01) | (0.01) | (0.01) | (0.01) | (0.01) | |
| IS | 0.01 * | 0.01 * | 0.01 * | 0.01 *** | 0.01 ** | 0.01 *** |
| (0.01) | (0.01) | (0.01) | (0.01) | (0.01) | (0.01) | |
| PD | −0.49 *** | −0.38 *** | −0.33 ** | −0.81 *** | −0.64 *** | −0.69 *** |
| (0.14) | (0.13) | (0.13) | (0.17) | (0.17) | (0.17) | |
| OPEN | 0.01 *** | 0.01 ** | 0.01 ** | 0.01 ** | 0.01 ** | 0.01 ** |
| (0.01) | (0.01) | (0.01) | (0.01) | (0.01) | (0.01) | |
| EE | 0.71 *** | 0.72 *** | 0.71 *** | 0.85 | 0.74 *** | 0.76 *** |
| (0.05) | (0.05) | (0.05) | (0.01) | (0.07) | (0.07) | |
| URB | 0.02 *** | 0.02 *** | 0.02 *** | 0.01 ** | 0.01 * | 0.01 * |
| (0.01) | (0.01) | (0.01) | (0.01) | (0.01) | (0.01) | |
| 0.29 *** | 0.28 *** | 0.23 *** | 0.67 *** | 0.14 ** | 0.04 * | |
| (0.06) | (0.04) | (0.04) | (0.13) | (0.07) | (0.06) | |
| R2 | 0.84 | 0.88 | 0.85 | 0.87 | 0.87 | 0.83 |
| Weight Type | WD | WE | WM | WD | WE | WM |
| Explanatory Variables | Eastern | Central | Western | |||
|---|---|---|---|---|---|---|
| EP1 | EP2 | EP1 | EP2 | EP1 | EP2 | |
| (1) | (2) | (3) | (4) | (5) | (6) | |
| COR1 | 0.01 * | 0.59 *** | 0.02 * | 0.71 *** | 0.03 * | 0.68 *** |
| (0.14) | (0.16) | (0.15) | (0.16) | (0.17) | (0.18) | |
| SE | 0.01 ** | 0.14 *** | 0.05 ** | 0.21 *** | 0.04 ** | 0.13 *** |
| (0.03) | (0.03) | (0.04) | (0.04) | (0.03) | (0.03) | |
| COR1*SE | 0.01 ** | 0.04 *** | 0.02 ** | 0.06 *** | 0.02 ** | 0.05 *** |
| (0.01) | (0.01) | (0.01) | (0.01) | (0.01) | (0.01) | |
| Y | 1.08 ** | 0.36 *** | 0.32 ** | 2.44 *** | 1.81 *** | 0.44 ** |
| (0.54) | (0.67) | (0.44) | (0.59) | (0.42) | (0.46) | |
| Y2 | −0.01 ** | −0.02 ** | −0.04 * | −0.13 *** | −0.05 ** | −0.03 ** |
| (0.02) | (0.03) | (0.02) | (0.03) | (0.02) | (0.02) | |
| IS | 0.01 | 0.01 | 0.01 *** | 0.01 *** | 0.01 ** | 0.01 ** |
| (0.01) | (0.01) | (0.01) | (0.00) | (0.00) | (0.00) | |
| PD | −0.89 *** | −0.89 *** | −0.44 | −1.69 * | −0.61 * | −0.41 |
| (0.24) | (0.28) | (0.41) | (0.51) | (0.32) | (0.39) | |
| OPEN | 0.01 ** | 0.01 ** | 0.01 ** | 0.01 *** | 0.01 ** | 0.01 ** |
| (0.01) | (0.01) | (0.01) | (0.01) | (0.01) | (0.01) | |
| EE | 0.61 *** | 0.67 *** | 0.18 * | 0.36 *** | 0.71 *** | 0.88 *** |
| (0.09) | (0.12) | (0.10) | (0.12) | (0.11) | (0.14) | |
| URB | 0.02 *** | 0.01 | 0.02 *** | 0.01 | 0.01 | 0.01 |
| (0.01) | (0.01) | (0.01) | (0.01) | (0.01) | (0.01) | |
| 0.01 ** | 0.36 *** | 0.28 *** | 0.09 ** | 0.34 *** | 0.56 *** | |
| (0.08) | (0.12) | (0.08) | (0.12) | (0.08) | (0.15) | |
| R2 | 0.83 | 0.80 | 0.83 | 0.92 | 0.89 | 0.84 |
| Weight Type | WD | WD | WD | WD | WD | WD |
© 2019 by the authors. Licensee MDPI, Basel, Switzerland. This article is an open access article distributed under the terms and conditions of the Creative Commons Attribution (CC BY) license (http://creativecommons.org/licenses/by/4.0/).
Share and Cite
Wang, S.; Yuan, Y.; Wang, H. Corruption, Hidden Economy and Environmental Pollution: A Spatial Econometric Analysis Based on China’s Provincial Panel Data. Int. J. Environ. Res. Public Health 2019, 16, 2871. https://doi.org/10.3390/ijerph16162871
Wang S, Yuan Y, Wang H. Corruption, Hidden Economy and Environmental Pollution: A Spatial Econometric Analysis Based on China’s Provincial Panel Data. International Journal of Environmental Research and Public Health. 2019; 16(16):2871. https://doi.org/10.3390/ijerph16162871
Chicago/Turabian StyleWang, Shi, Yizhou Yuan, and Hua Wang. 2019. "Corruption, Hidden Economy and Environmental Pollution: A Spatial Econometric Analysis Based on China’s Provincial Panel Data" International Journal of Environmental Research and Public Health 16, no. 16: 2871. https://doi.org/10.3390/ijerph16162871
APA StyleWang, S., Yuan, Y., & Wang, H. (2019). Corruption, Hidden Economy and Environmental Pollution: A Spatial Econometric Analysis Based on China’s Provincial Panel Data. International Journal of Environmental Research and Public Health, 16(16), 2871. https://doi.org/10.3390/ijerph16162871