Partial Smoking Ban and Secondhand Smoke Exposure in Japan


Abstract
1. Introduction
2. Materials and Methods
2.1. Data Sources
2.2. Outcome Measures
2.3. Estimation Strategy
3. Results
3.1. Descriptive Statistics
3.2. Secondhand Smoke Exposure
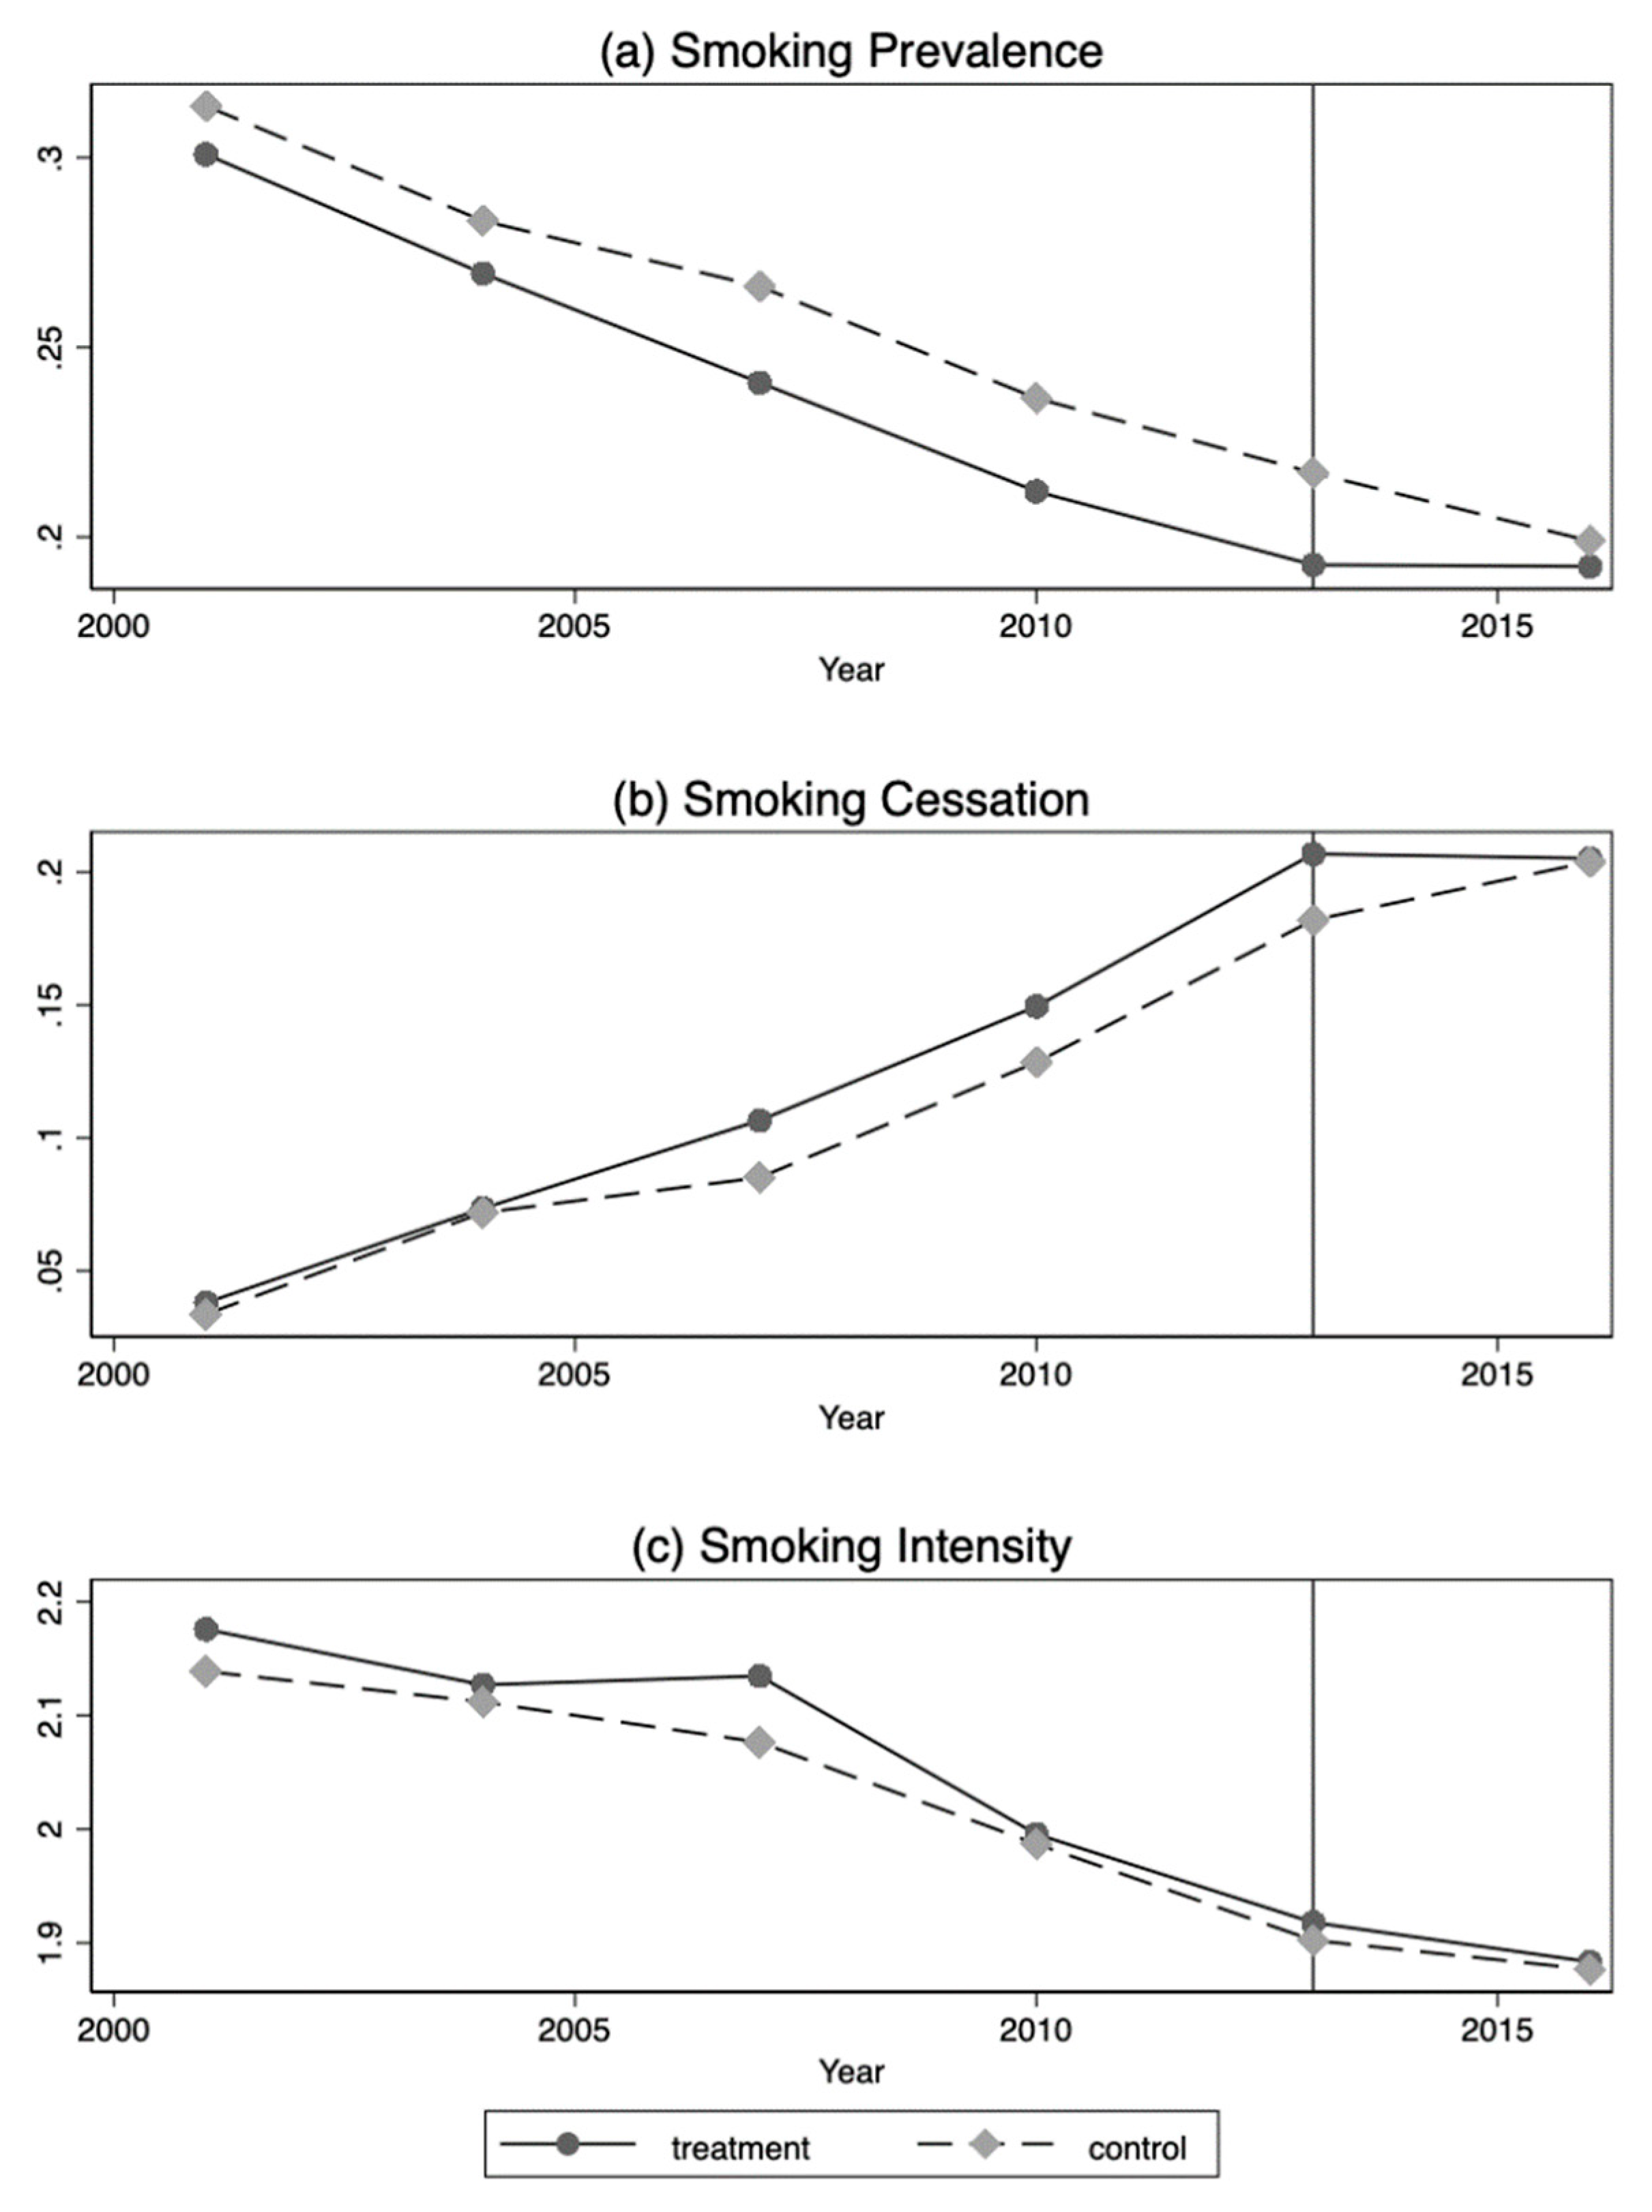
3.3. Smoking Behaviors
4. Discussion
5. Conclusions
Author Contributions
Funding
Acknowledgments
Conflicts of Interest
Appendix A

| Workplace | School | Restaurant | Game Hall | |
|---|---|---|---|---|
| (1) | (2) | (3) | (4) | |
| Treat × Post () | −0.094 * | −0.086 | 0.091 | −0.017 |
| SE | (0.052) | (0.058) | (0.062) | (0.059) |
| 95% CI | [−0.195, 0.007] | [−0.199, 0.027] | [−0.031, 0.212] | [−0.1333, 0.099] |
| Treat () | 0.005 | 0.021 | −0.103 * | 0.109 * |
| SE | (0.049) | (0.053) | (0.059) | (0.056) |
| 95% CI | [−0.091, 0.102] | [−0.082, 0.125] | [−0.218, 0.012] | [−0.001, 0.220] |
| Post () | 0.016 | −0.019 * | −0.025 * | 0.015 |
| SE | (0.010) | (0.011) | (0.013) | (0.012) |
| 95% CI | [−0.004, 0.035] | [−0.041, 0.003] | [−0.050, 0.005] | [−0.019, 0.039] |
| Adjusted R2 | 0.499 | 0.046 | 0.117 | 0.034 |
| F-statistics | 344.57 | 12.69 | 42.03 | 10.71 |
| n | 30,244 | 30,244 | 30,244 | 30,244 |
| Smoking Behaviors | Full | Pre-Treatment | Post-Treatment | |||||
|---|---|---|---|---|---|---|---|---|
| Treat | Control | Treat | Control | Treat | Control | |||
| n = 58,812 | n = 2,308,084 | n = 37,664 | n = 1,493,888 | n = 21,148 | n = 814,196 | |||
| Smoking Status (%) | ||||||||
| Nonsmoker | 73.18 | 71.53 | 71.73 | 70.06 | 75.76 | 74.22 | ||
| Daily smoker | 21.94 | 23.65 | 24.31 | 26.03 | 17.71 | 19.29 | ||
| Occasional Smoker | 1.55 | 1.62 | 1.56 | 1.66 | 1.53 | 1.54 | ||
| Quitter | 3.33 | 3.20 | 2.39 | 2.24 | 4.99 | 4.96 | ||
| n = 13,689 | n = 578,862 | n = 9658 | n = 410,680 | n = 4031 | n = 168,182 | |||
| Smoking Intensity (%) | ||||||||
| 1~10 | 25.57 | 25.85 | 22.99 | 23.53 | 31.75 | 31.53 | ||
| 10~20 | 49.70 | 51.13 | 49.65 | 50.99 | 49.84 | 51.49 | ||
| 20~30 | 18.28 | 17.18 | 19.64 | 18.74 | 15.03 | 13.38 | ||
| ≥31 | 6.44 | 5.83 | 7.72 | 6.74 | 3.37 | 3.60 | ||
References
- Öberg, M.; Jaakkola, M.S.; Woodward, A.; Peruga, A.; Prüss-Ustün, A. Worldwide burden of disease from exposure to second-hand smoke: A retrospective analysis of data from 192 countries. Lancet 2011, 377, 139–146. [Google Scholar] [CrossRef]
- Been, J.V.; Nurmatov, U.B.; Cox, B.; Nawrot, T.S.; Van Schayck, C.P.; Sheikh, A. Effect of smoke-free legislation on perinatal and child health: A systematic review and meta-analysis. Lancet 2014, 383, 1549–1560. [Google Scholar] [CrossRef]
- Frazer, K.; Callinan, J.E.; McHugh, J.; van Baarsel, S.; Clarke, A.; Doherty, K.; Kelleher, C. Legislative smoking bans for reducing harms from secondhand smoke exposure, smoking prevalence and tobacco consumption. Cochrane Database Syst. Rev. 2016, 2. [Google Scholar] [CrossRef] [PubMed]
- Kuehnle, D.; Wunder, C. The effects of smoking bans on self-assessed health: Evidence from Germany. Health Econ. 2017, 26, 321–337. [Google Scholar] [CrossRef] [PubMed]
- Kvasnicka, M.; Siedler, T.; Ziebarth, N.R. The health effects of smoking bans: Evidence from German hospitalization data. Health Econ. 2018, 27, 1738–1753. [Google Scholar] [CrossRef]
- Lee, J.T.; Agrawal, S.; Basu, S.; Glantz, S.A.; Millett, C. Association between smoke-free workplace and second-hand smoke exposure at home in India. Tob. Control 2014, 23, 308–312. [Google Scholar] [CrossRef] [PubMed]
- Mayne, S.L.; Jacobs, D.R., Jr.; Schreiner, P.J.; Widome, R.; Gordon-Larsen, P.; Kershaw, K.N. Associations of smoke-free policies in restaurants, bars, and workplaces with blood pressure changes in the CARDIA study. JAHA 2018, 7. [Google Scholar] [CrossRef]
- Carpenter, C.S. The effects of local workplace smoking laws on smoking restrictions and exposure to smoke at work. J. Hum. Resour. 2009, 44, 1023–1046. [Google Scholar] [CrossRef]
- Evans, W.N.; Farrelly, M.C.; Montgomery, E. Do workplace smoking bans reduce smoking? Am. Econ. Rev. 1999, 89, 728–747. [Google Scholar] [CrossRef]
- Anger, S.; Kvasnicka, M.; Siedler, T. One last puff? Public smoking bans and smoking behavior. J. Health Econ. 2011, 30, 591–601. [Google Scholar] [CrossRef]
- Farrelly, M.C.; Nonnemaker, J.M.; Chou, R.; Hyland, A.; Peterson, K.K.; Bauer, U.E. Changes in hospitality workers’ exposure to secondhand smoke following the implementation of New York’s smoke-free law. Tob. Control 2005, 14, 236–241. [Google Scholar] [CrossRef]
- Mulcahy, M.; Evans, D.S.; Hammond, S.K.; Repace, J.L.; Byrne, M. Secondhand smoke exposure and risk following the Irish smoking ban: An assessment of salivary cotinine concentrations in hotel workers and air nicotine levels in bars. Tob. Control 2005, 14, 384–388. [Google Scholar] [CrossRef] [PubMed]
- Valente, P.; Forastiere, F.; Bacosi, A.; Cattani, G.; Di Carlo, S.; Ferri, M.; Zuccaro, P. Exposure to fine and ultrafine particles from secondhand smoke in public places before and after the smoking ban, Italy 2005. Tob. Control. 2007, 16, 312–317. [Google Scholar] [CrossRef] [PubMed]
- Max, W.; Sung, H.Y.; Shi, Y. Who is exposed to secondhand smoke? Self-reported and serum cotinine measured exposure in the US, 1999–2006. Int. J. Environ. Res. Public Health 2009, 6, 1633–1648. [Google Scholar] [CrossRef] [PubMed]
- Schechter, J.C.; Fuemmeler, B.F.; Hoyo, C.; Murphy, S.K.; Zhang, J.J.; Kollins, S.H. Impact of smoking ban on passive smoke exposure in pregnant non-smokers in the Southeastern United States. Int. J. Environ. Res. Public Health 2018, 15, 83. [Google Scholar] [CrossRef] [PubMed]
- Adda, J.; Cornaglia, F. The effect of bans and taxes on passive smoking. Am. Econ. J. 2010, 2, 1–32. [Google Scholar] [CrossRef]
- Ho, S.Y.; Wang, M.P.; Lo, W.S.; Mak, K.K.; Lai, H.K.; Thomas, G.N.; Lam, T.H. Comprehensive smoke-free legislation and displacement of smoking into the homes of young children in Hong Kong. Tob. Control 2010, 19, 129–133. [Google Scholar] [CrossRef]
- Ueda, H.; Armada, F.; Kashiwabara, M.; Yoshimi, I. Street smoking bans in Japan: A hope for smoke-free cities? Health Policy 2011, 102, 49–55. [Google Scholar] [CrossRef]
- Yamada, K.; Mori, N.; Kashiwabara, M.; Yasuda, S.; Horie, R.; Yamato, H.; Armada, F. Industry speed bumps on local tobacco control in Japan? The case of Hyogo. J. Epidemiol. 2015, 25, 496–504. [Google Scholar] [CrossRef]
- Sato, Y.; Minatoguchi, S.; Nishigaki, K.; Hirata, K.I.; Masuyama, T.; Furukawa, Y.; Fujiwara, H. Results of a Prospective Study of Acute Coronary Syndrome Hospitalization After Enactment of a Smoking Ban in Public Places in Hyogo Prefecture—Comparison with Gifu, a Prefecture Without a Public Smoking Ban. Circ. J. 2016, 80, 2528–2532. [Google Scholar] [CrossRef]
- Osaki, T. Japan’s watered-down smoking ban clears Diet. The Japan Times. 18 July 2018. Available online: https://www.japantimes.co.jp/news/2018/07/18/national/crime-legal/japans-watered-smoking-ban-clears-diet/#.XRXE0y2B1Vo (accessed on 28 June 2019).
- Nanninga, S.; Lhachimi, S.K.; Bolte, G. Impact of public smoking bans on children’s exposure to tobacco smoke at home: A systematic review and meta-analysis. BMC Public Health 2018, 18. [Google Scholar] [CrossRef] [PubMed]
- Tabuchi, T.; Hoshino, T.; Nakayama, T. Are partial workplace smoking bans as effective as complete smoking bans? A national population-based study of smoke-free policy among Japanese employees. NICTOB 2016, 18, 1265–1273. [Google Scholar] [CrossRef] [PubMed]
- Tabuchi, T.; Colwell, B. Disparity and trends in secondhand smoke exposure among Japanese employees, particularly smokers vs. non-smokers. PLoS ONE 2016, 11. [Google Scholar] [CrossRef] [PubMed]
- Mons, U.; Nagelhout, G.E.; Guignard, R.; McNeill, A.; Van den Putte, B.; Willemsen, M.C.; Breitling, L.P. Comprehensive smoke-free policies attract more support from smokers in Europe than partial policies. Eur. J. Public Health 2012, 22, 10–16. [Google Scholar] [CrossRef] [PubMed]
- Martínez-Sánchez, J.M.; Fernández, E.; Fu, M.; Gallus, S.; Martínez, C.; Sureda, X.; La Vecchia, C.; Clancy, L. Smoking behavior, involuntary smoking, attutudes towards smoke-free legislations, and tobacco control activities in the European Union. PLoS ONE 2010, 5. [Google Scholar] [CrossRef] [PubMed]
- Tabuchi, T.; Nakamura, M.; Nakayama, T.; Miyashiro, I.; Mori, J.I.; Tsukuma, H. Tobacco price increase and smoking cessation in Japan, a developed country with affordable tobacco: A national population-based observational study. J. Epidemiol. 2016, 26, 14–21. [Google Scholar] [CrossRef]

| Passive Smoking (%) | Full | Pre-Treatment | Post-Treatment | |||||
|---|---|---|---|---|---|---|---|---|
| Treat | Control | Treat | Control | Treat | Control | |||
| n = 1003 | n = 29241 | n = 273 | n = 5064 | n = 730 | n = 24177 | |||
| Household | ||||||||
| Every day | 8.37 | 8.43 | 10.62 | 9.99 | 7.53 | 8.10 | ||
| Several times per week | 3.19 | 2.82 | 1.83 | 3.38 | 3.70 | 2.71 | ||
| Once per week | 0.80 | 1.88 | 0.73 | 2.29 | 0.82 | 1.80 | ||
| Once per month | 1.99 | 2.21 | 3.30 | 2.88 | 1.51 | 2.07 | ||
| No exposure | 85.64 | 84.65 | 83.52 | 81.46 | 86.44 | 85.32 | ||
| Frequency (day per month) | 3.04 | 3.05 | 3.52 | 3.62 | 2.86 | 2.93 | ||
| (4.45) | (8.56) | (9.37) | (9.21) | (8.26) | (8.41) | |||
| Workplace | ||||||||
| Every day | 4.89 | 6.56 | 4.76 | 8.85 | 4.93 | 6.08 | ||
| Several times per week | 5.88 | 6.24 | 8.42 | 7.01 | 4.93 | 6.08 | ||
| Once per week | 3.49 | 2.96 | 4.76 | 3.67 | 3.01 | 2.81 | ||
| Once per month | 3.79 | 3.52 | 5.86 | 3.79 | 3.01 | 3.46 | ||
| No exposure | 38.68 | 39.79 | 36.63 | 35.25 | 39.45 | 40.74 | ||
| Do not go there | 43.27 | 40.93 | 39.56 | 41.43 | 44.66 | 40.82 | ||
| Frequency (day per month) | 4.45 | 5.18 | 4.87 | 6.64 | 4.28 | 4.87 | ||
| (9.07) | (9.89) | (8.97) | (10.95) | (9.11) | (9.63) | |||
| School | ||||||||
| Every day | 0.00 | 0.13 | 0.00 | 0.14 | 0.00 | 0.13 | ||
| Several times per week | 0.40 | 0.26 | 0.73 | 0.22 | 0.27 | 0.27 | ||
| Once per week | 0.30 | 0.19 | 0.00 | 0.22 | 0.41 | 0.19 | ||
| Once per month | 0.60 | 0.32 | 0.37 | 0.36 | 0.68 | 0.32 | ||
| No exposure | 20.14 | 19.62 | 16.85 | 16.96 | 21.37 | 20.18 | ||
| Do not go there | 78.56 | 79.49 | 82.05 | 82.11 | 77.26 | 78.92 | ||
| Frequency (day per month) | 0.36 | 0.44 | 0.63 | 0.48 | 0.28 | 0.43 | ||
| (2.08) | (2.94) | (3.00) | (3.11) | (1.72) | (2.91) | |||
| Restaurant | ||||||||
| Every day | 0.70 | 0.53 | 0.37 | 0.63 | 0.82 | 0.51 | ||
| Several times per week | 2.69 | 2.66 | 2.56 | 3.32 | 2.74 | 2.52 | ||
| Once per week | 8.67 | 6.25 | 12.82 | 6.87 | 7.12 | 6.12 | ||
| Once per month | 23.13 | 19.27 | 27.84 | 20.06 | 21.37 | 19.10 | ||
| No exposure | 35.79 | 39.50 | 30.77 | 33.02 | 37.67 | 40.85 | ||
| Do not go there | 29.01 | 31.79 | 25.64 | 36.10 | 30.27 | 30.89 | ||
| Frequency (day per month) | 1.68 | 1.47 | 1.73 | 1.82 | 1.66 | 1.40 | ||
| (4.11) | (3.93) | (3.52) | (4.39) | (4.32) | (3.82) | |||
| Game hall | ||||||||
| Every day | 0.30 | 0.24 | 0.00 | 0.22 | 0.41 | 0.24 | ||
| Several times per week | 1.20 | 1.51 | 0.73 | 1.88 | 1.37 | 1.44 | ||
| Once per week | 1.99 | 2.51 | 2.20 | 2.59 | 1.92 | 2.49 | ||
| Once per month | 2.69 | 3.84 | 2.20 | 4.36 | 2.88 | 3.73 | ||
| No exposure | 16.15 | 15.62 | 15.38 | 15.56 | 16.44 | 15.63 | ||
| Do not go there | 77.67 | 76.28 | 79.49 | 75.39 | 76.99 | 76.46 | ||
| Frequency (day per month) | 1.68 | 1.85 | 1.07 | 2.01 | 1.89 | 1.81 | ||
| (4.79) | (4.68) | (2.98) | (4.79) | (5.25) | (4.65) | |||
| Controlled covariates | ||||||||
| Age | 56.51 | 58.14 | 52.82 | 57.25 | 57.88 | 58.33 | ||
| (18.13) | (17.99) | (16.08) | (17.65) | (18.66) | (18.05) | |||
| Household size | 2.88 | 2.91 | 3.09 | 3.03 | 2.80 | 2.88 | ||
| (1.33) | (1.40) | (1.35) | (1.43) | (1.32) | (1.39) | |||
| Gender (Male = 1) | 0.39 | 0.39 | 0.40 | 0.39 | 0.39 | 0.39 | ||
| (0.49) | (0.49) | (0.49) | (0.49) | (0.49) | (0.49) | |||
| Employment status (Employed = 1) | 0.63 | 0.68 | 0.65 | 0.69 | 0.62 | 0.67 | ||
| (0.48) | (0.47) | (0.48) | (0.46) | (0.49) | (0.49) | |||
| Occupation type (%) | ||||||||
| Technological | 10.47 | 10.92 | 13.19 | 10.21 | 9.45 | 11.07 | ||
| Management | 3.99 | 2.99 | 5.49 | 3.02 | 3.42 | 2.99 | ||
| Officer | 11.47 | 9.28 | 12.45 | 9.14 | 11.10 | 9.31 | ||
| Salesperson | 3.79 | 4.85 | 4.40 | 5.02 | 3.56 | 4.82 | ||
| Service | 5.28 | 7.96 | 5.13 | 8.18 | 5.34 | 7.92 | ||
| Security guard | 0.50 | 0.70 | 1.47 | 0.65 | 0.14 | 0.72 | ||
| Agriculture | 2.79 | 3.70 | 2.56 | 4.40 | 2.88 | 3.55 | ||
| Machine operation | 1.50 | 1.10 | 2.20 | 1.46 | 1.23 | 1.03 | ||
| Production process | 6.38 | 7.75 | 5.86 | 8.04 | 6.58 | 7.68 | ||
| housework | 28.22 | 22.72 | 28.57 | 25.20 | 28.08 | 22.21 | ||
| Others | 16.75 | 18.29 | 12.09 | 18.40 | 18.49 | 18.27 | ||
| Students | 8.87 | 9.73 | 6.59 | 6.28 | 9.73 | 10.45 | ||
| Household | Workplace | Restaurant | |
|---|---|---|---|
| Model 1 | (1) | (2) | (3) |
| Treat × Post () Standard Error (SE) | 0.156 | 1.472 * | 0.425 |
| (0.642) | (0.796) | (0.316) | |
| 95% CI | [−1.102, 1.413] | [−0.087, 3.032] | [−0.193, 1.044] |
| Treat () | −0.132 | −1.946 *** | −0.169 |
| SE | (0.568) | (0.660) | (0.252) |
| 95% CI | [−1.246, 0.982] | [−3.240, −0.653] | [−0.663, 0.326] |
| Post () | −0.580 *** | −1.655 *** | −0.412 *** |
| SE | (0.137) | (0.206) | (0.082) |
| 95% CI | [−0.848, −0.312] | [−2.060, −1.251] | [−0.572, −0.252] |
| Adjusted R2 | 0.045 | 0.093 | 0.031 |
| F-statistics | 83.23 | 123.57 | 30.52 |
| N | 30244 | 17843 | 20657 |
| Model 2 (with Prefecture dummies) | Household | Workplace | Restaurant |
| Treat × Post () | 0.159 | 1.517 * | 0.253 |
| SE | (0.643) | (0.798) | (0.316) |
| 95% CI | [−1.101, 1.419] | [−0.048, 3.081] | [−0.367, 0.874] |
| Treat () | −0.485 | −3.090 *** | 0.073 |
| SE | (0.641) | (0.802) | (0.303) |
| 95% CI | [−1.741, 0.772] | [−4.663, −1.518] | [−0.520, 0.667] |
| Post () | −0.586 *** | −1.705 *** | −0.239 *** |
| SE | (0.141) | (0.212) | (0.084) |
| 95% CI | [−0.862, −0.311] | [−2.120, −1.289] | [−0.404, −0.073] |
| Adjusted R2 | 0.047 | 0.096 | 0.042 |
| F-statistics | 25.29 | 36.93 | 12.60 |
| N | 30244 | 17843 | 20657 |
| Model 3 (with Prefecture dummies and a linear time trend) | Household | Workplace | Restaurant |
| Treat × Post () | 2.638 ** | 4.697 ** | 1.049 |
| SE | (1.292) | (1.898) | (0.904) |
| 95% CI | [0.108, 5.167] | [0.978, 8.417] | [−0.723, 2.821] |
| Treat () | 1.101 | − 2.340 | 0.212 |
| SE | (1.174) | (1.735) | (0.768) |
| 95% CI | [−1.199, 3.402] | [−5.742, 1.062] | [−1.293, 1.718] |
| Post () | 0.352 | −0.833 ** | 0.322 * |
| SE | (0.264) | (0.385) | (0.166) |
| 95% CI | [−0.165, 0.870] | [−1.588, −0.078] | [−0.002, 0.647] |
| Adjusted R2 | 0.049 | 0.098 | 0.044 |
| F-statistics | 15.32 | 21.92 | 7.91 |
| N | 30244 | 17843 | 20657 |
| Smoking Status | Smoking Intensity (Cigarettes/Day) | ||
|---|---|---|---|
| Smoking Prevalence | Smoking Cessation | ||
| (1) | (2) | (3) | |
| Treat × Post () | 0.010 | −0.014 | 0.002 |
| SE | (0.006) | (0.011) | (0.027) |
| 95% CI | [−0.002, 0.022] | [−0.036, 0.007] | [−0.050, 0.054] |
| Treat () | −3.239 ** | −4.235 ** | 1.549 |
| SE | (1.348) | (1.839) | (5.117) |
| 95% CI | [−5.881, −0.597] | [−7.840, −0.630] | [−8.481, 11.578] |
| Post () | 0.006 *** | 0.026 *** | −0.057 *** |
| SE | (0.001) | (0.002) | (0.004) |
| 95% CI | [0.004, 0.008] | [0.023, 0.029] | [−0.064, −0.049] |
| Adjusted R2 | 0.179 | 0.063 | 0.118 |
| F-statistics | 4836.45 | 333.28 | 718.12 |
| n | 2,366,896 | 672,879 | 592,551 |
© 2019 by the authors. Licensee MDPI, Basel, Switzerland. This article is an open access article distributed under the terms and conditions of the Creative Commons Attribution (CC BY) license (http://creativecommons.org/licenses/by/4.0/).
Share and Cite
Zeng, S.; Noguchi, H.; Shimokawa, S. Partial Smoking Ban and Secondhand Smoke Exposure in Japan. Int. J. Environ. Res. Public Health 2019, 16, 2804. https://doi.org/10.3390/ijerph16152804
Zeng S, Noguchi H, Shimokawa S. Partial Smoking Ban and Secondhand Smoke Exposure in Japan. International Journal of Environmental Research and Public Health. 2019; 16(15):2804. https://doi.org/10.3390/ijerph16152804
Chicago/Turabian StyleZeng, Sen, Haruko Noguchi, and Satoru Shimokawa. 2019. "Partial Smoking Ban and Secondhand Smoke Exposure in Japan" International Journal of Environmental Research and Public Health 16, no. 15: 2804. https://doi.org/10.3390/ijerph16152804
APA StyleZeng, S., Noguchi, H., & Shimokawa, S. (2019). Partial Smoking Ban and Secondhand Smoke Exposure in Japan. International Journal of Environmental Research and Public Health, 16(15), 2804. https://doi.org/10.3390/ijerph16152804