The Driving Forces of Point Source Wastewater Emission: Case Study of COD and NH4-N Discharges in Mainland China

 ,
,  ,
, 
Abstract
:1. Introduction
2. Methods
2.1. Logarithmic Mean Divisia Index (LMDI) Model
2.2. The Relative Contribution Rate of Each Factor
2.3. The Absolute Contribution Rate of Each Factor
2.4. Study Area and Data Source
3. Results and Discussion
3.1. Temporal and Spatial Trends of Water Resource Consumption and Pollution in Mainland China
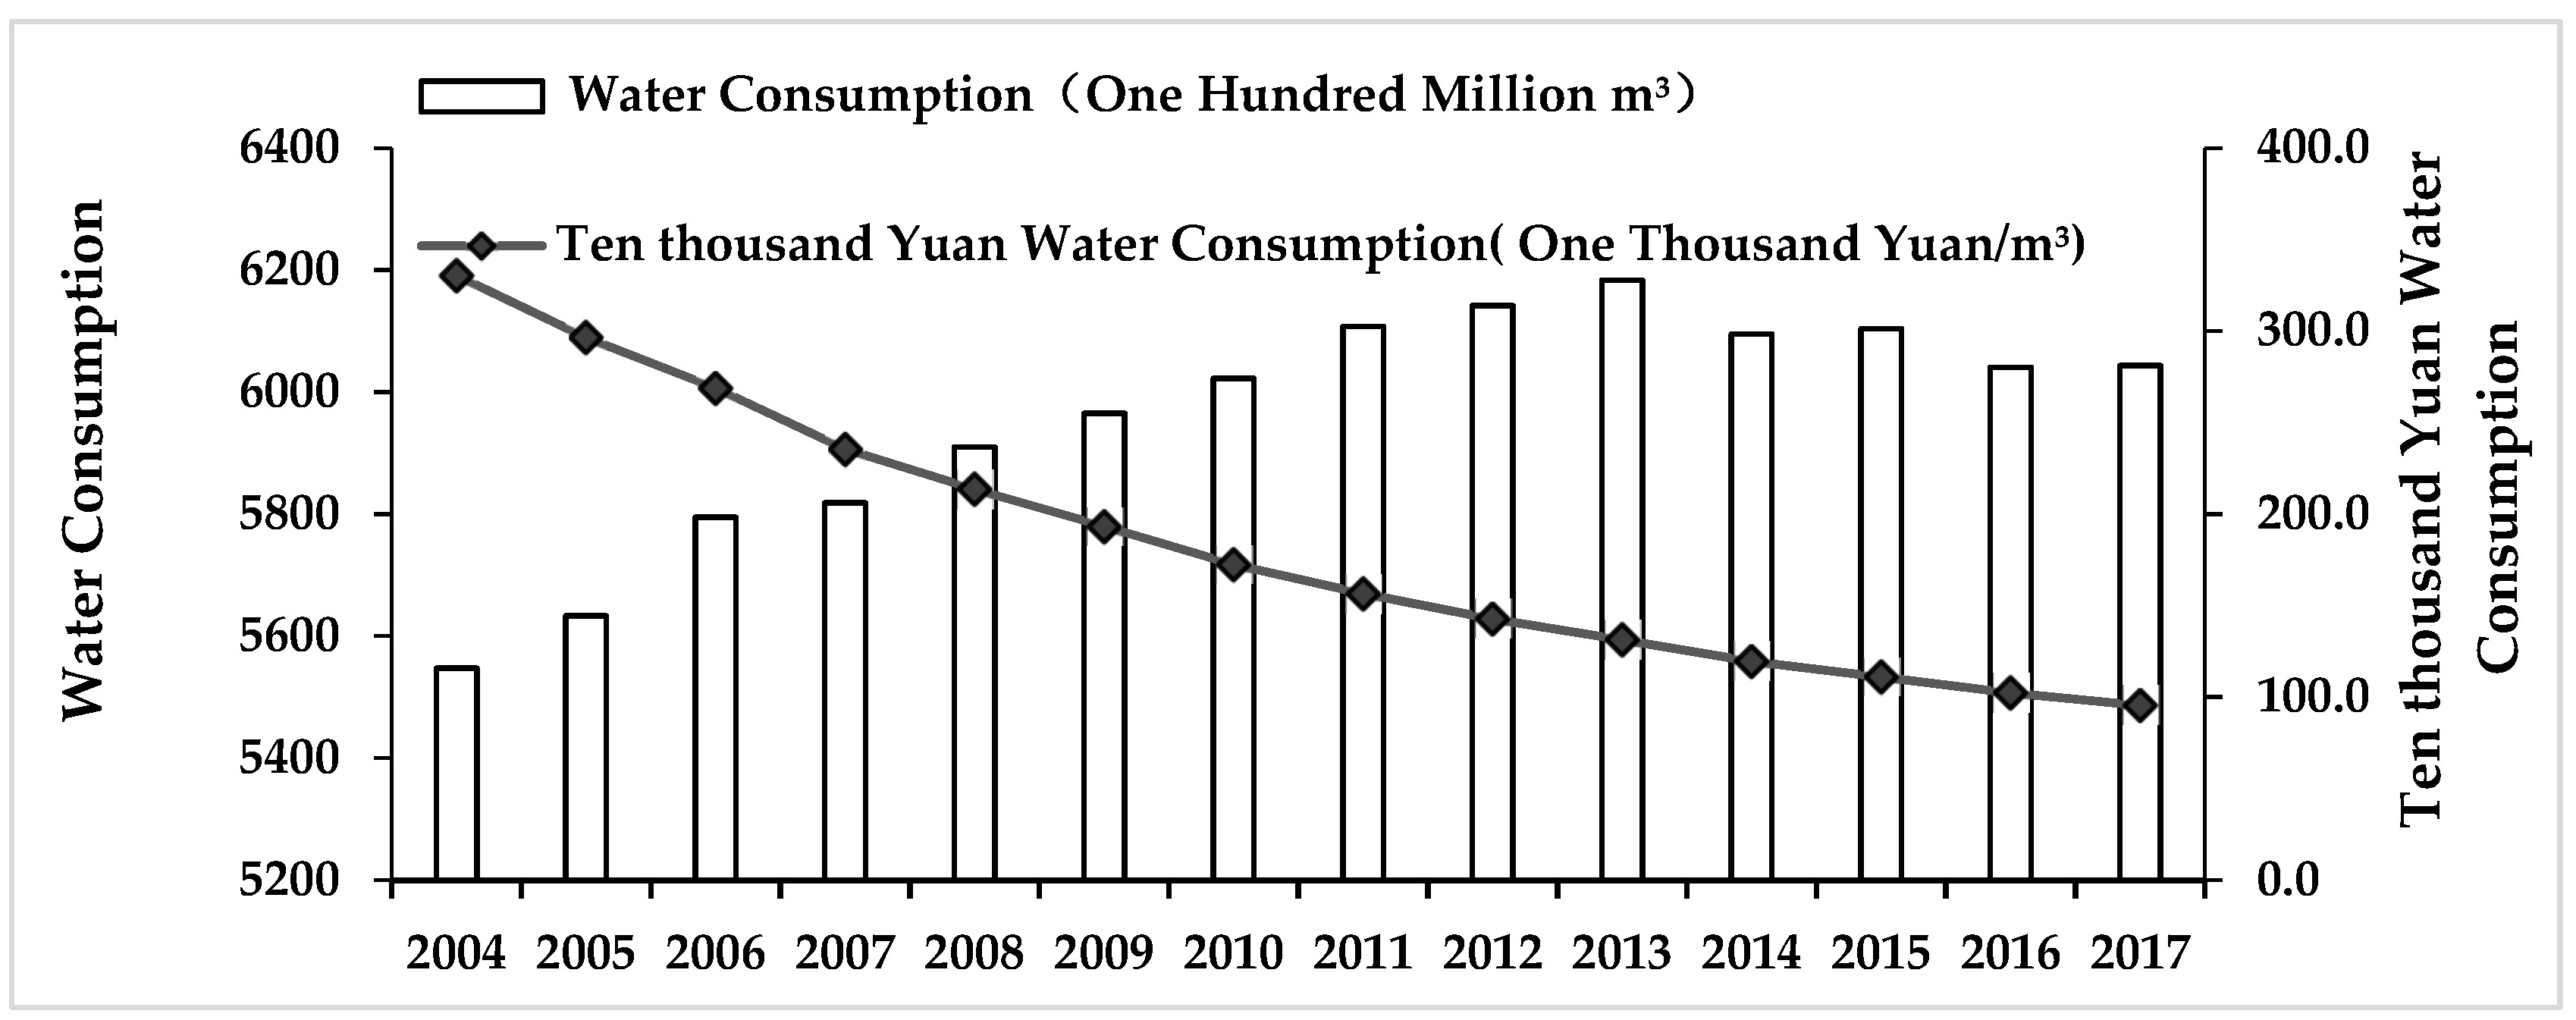
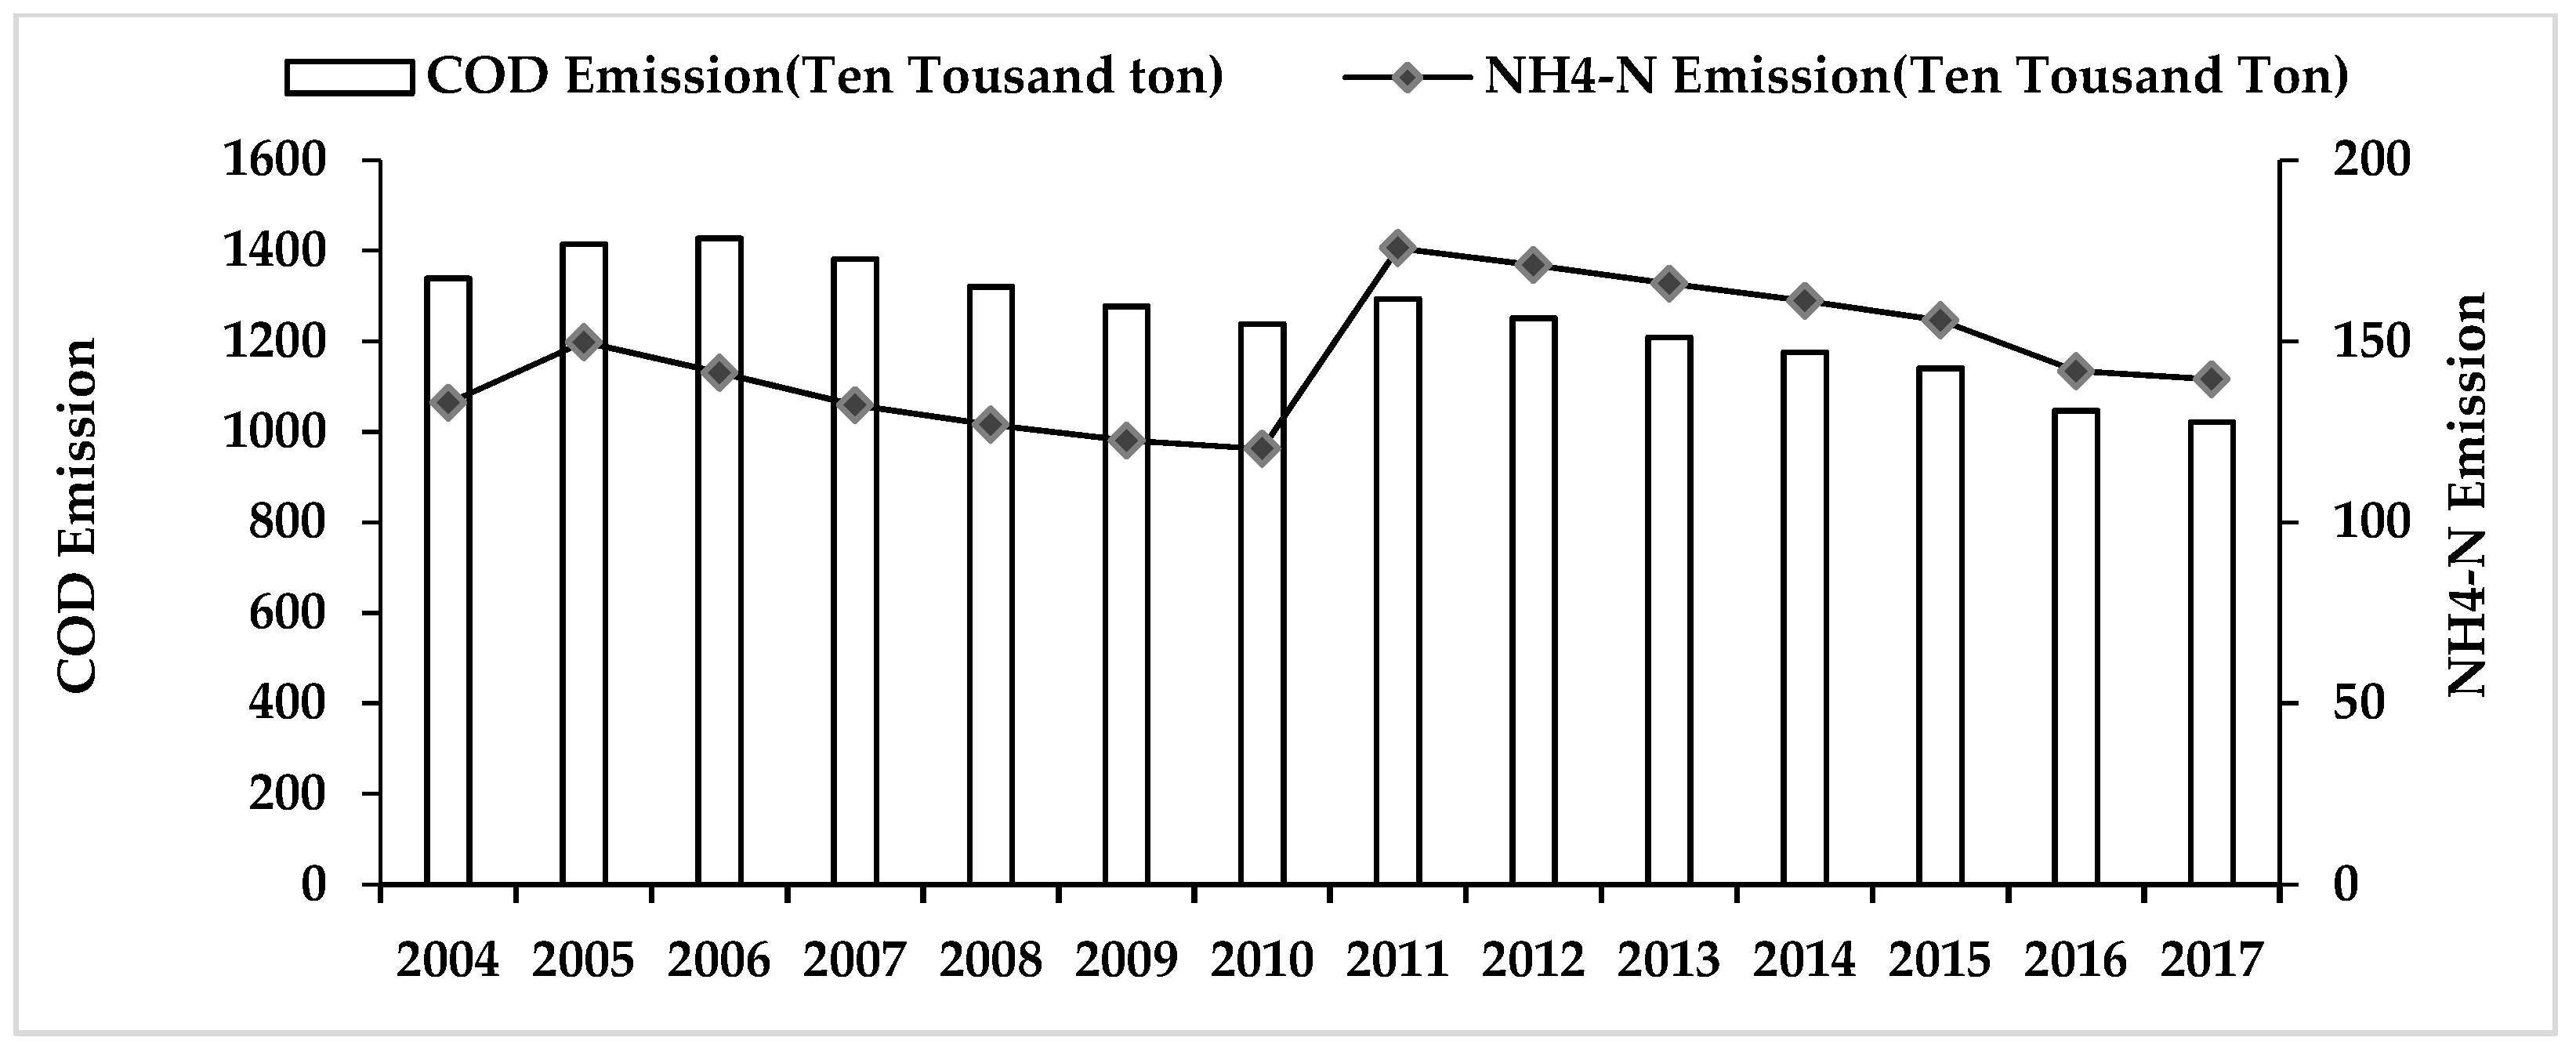
3.1.1. The Temporal Evolution of Water Resource Consumption and Pollution in Mainland China
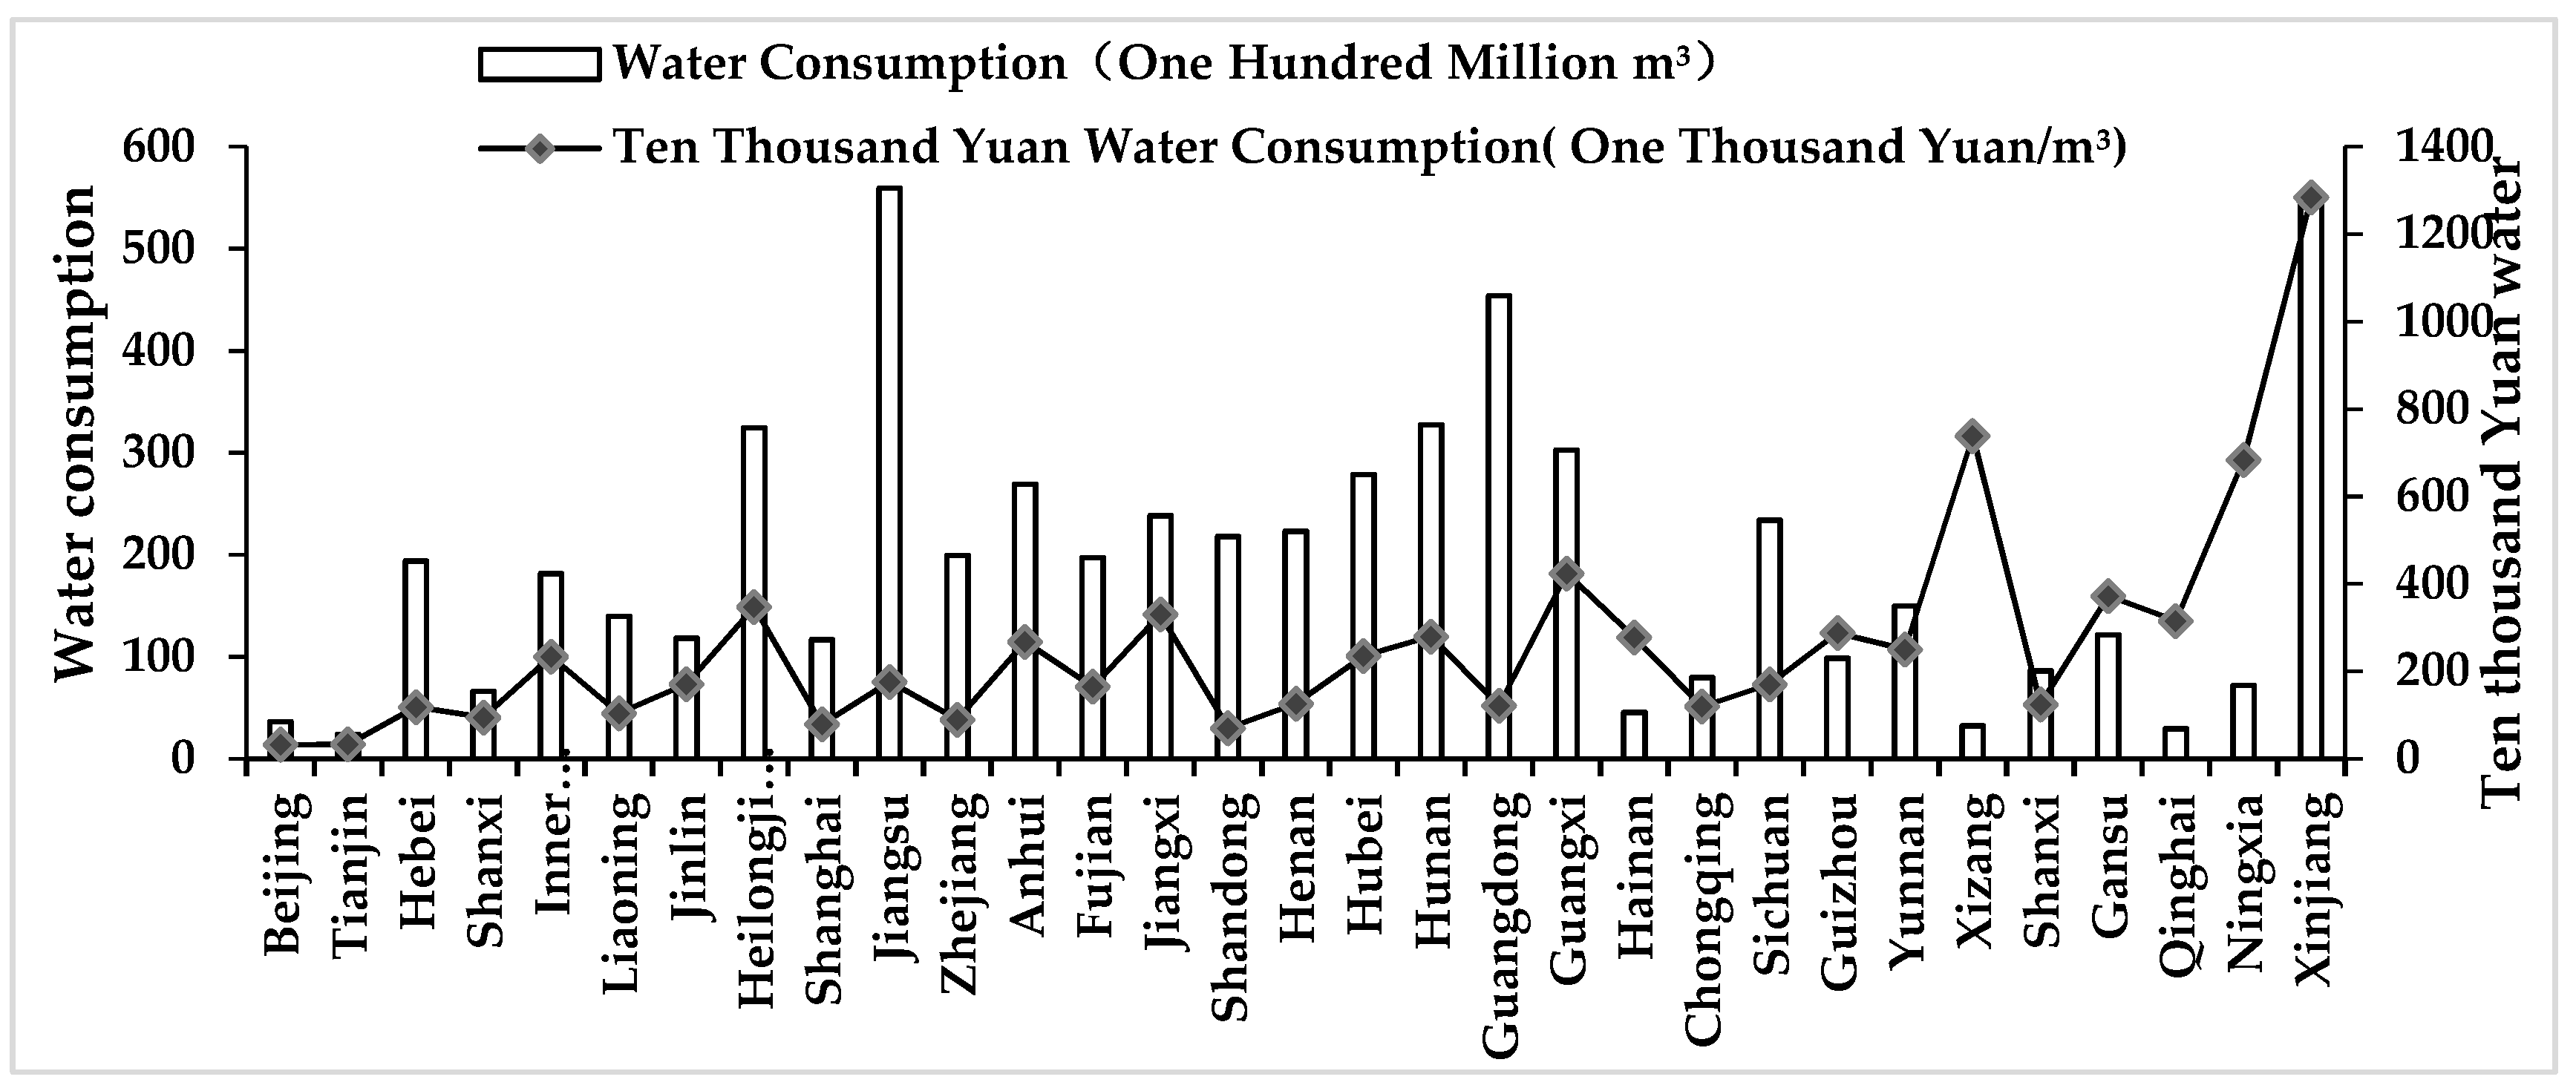
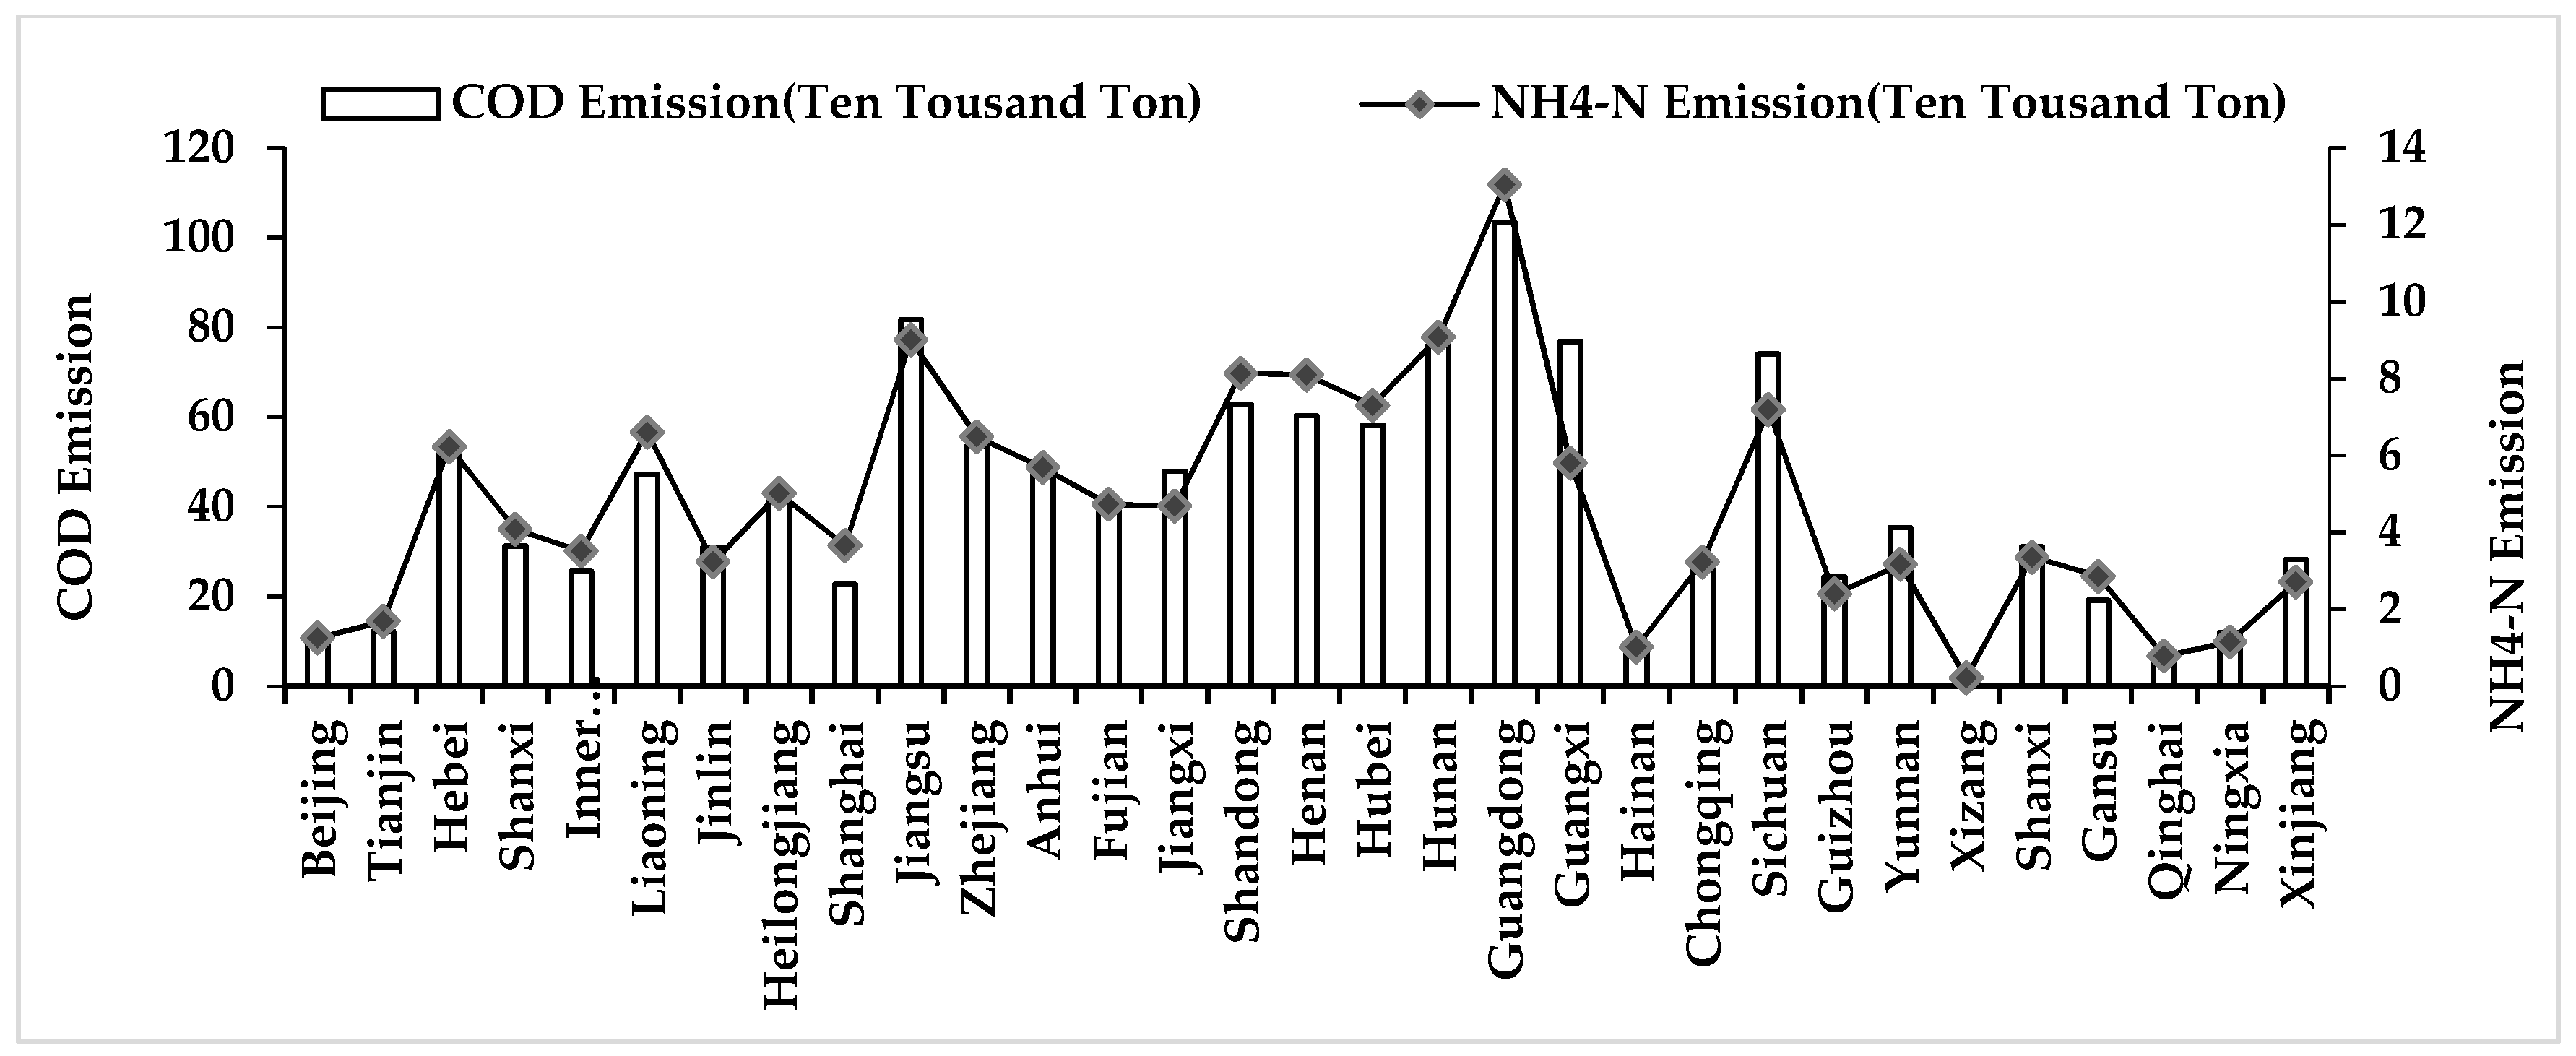
3.1.2. The Spatial Analysis of the Provincial Water Resource Consumption and Pollution in China
3.2. The Spatio-Temporal Analysis of Driving Factors of COD and NH4-N Emissions
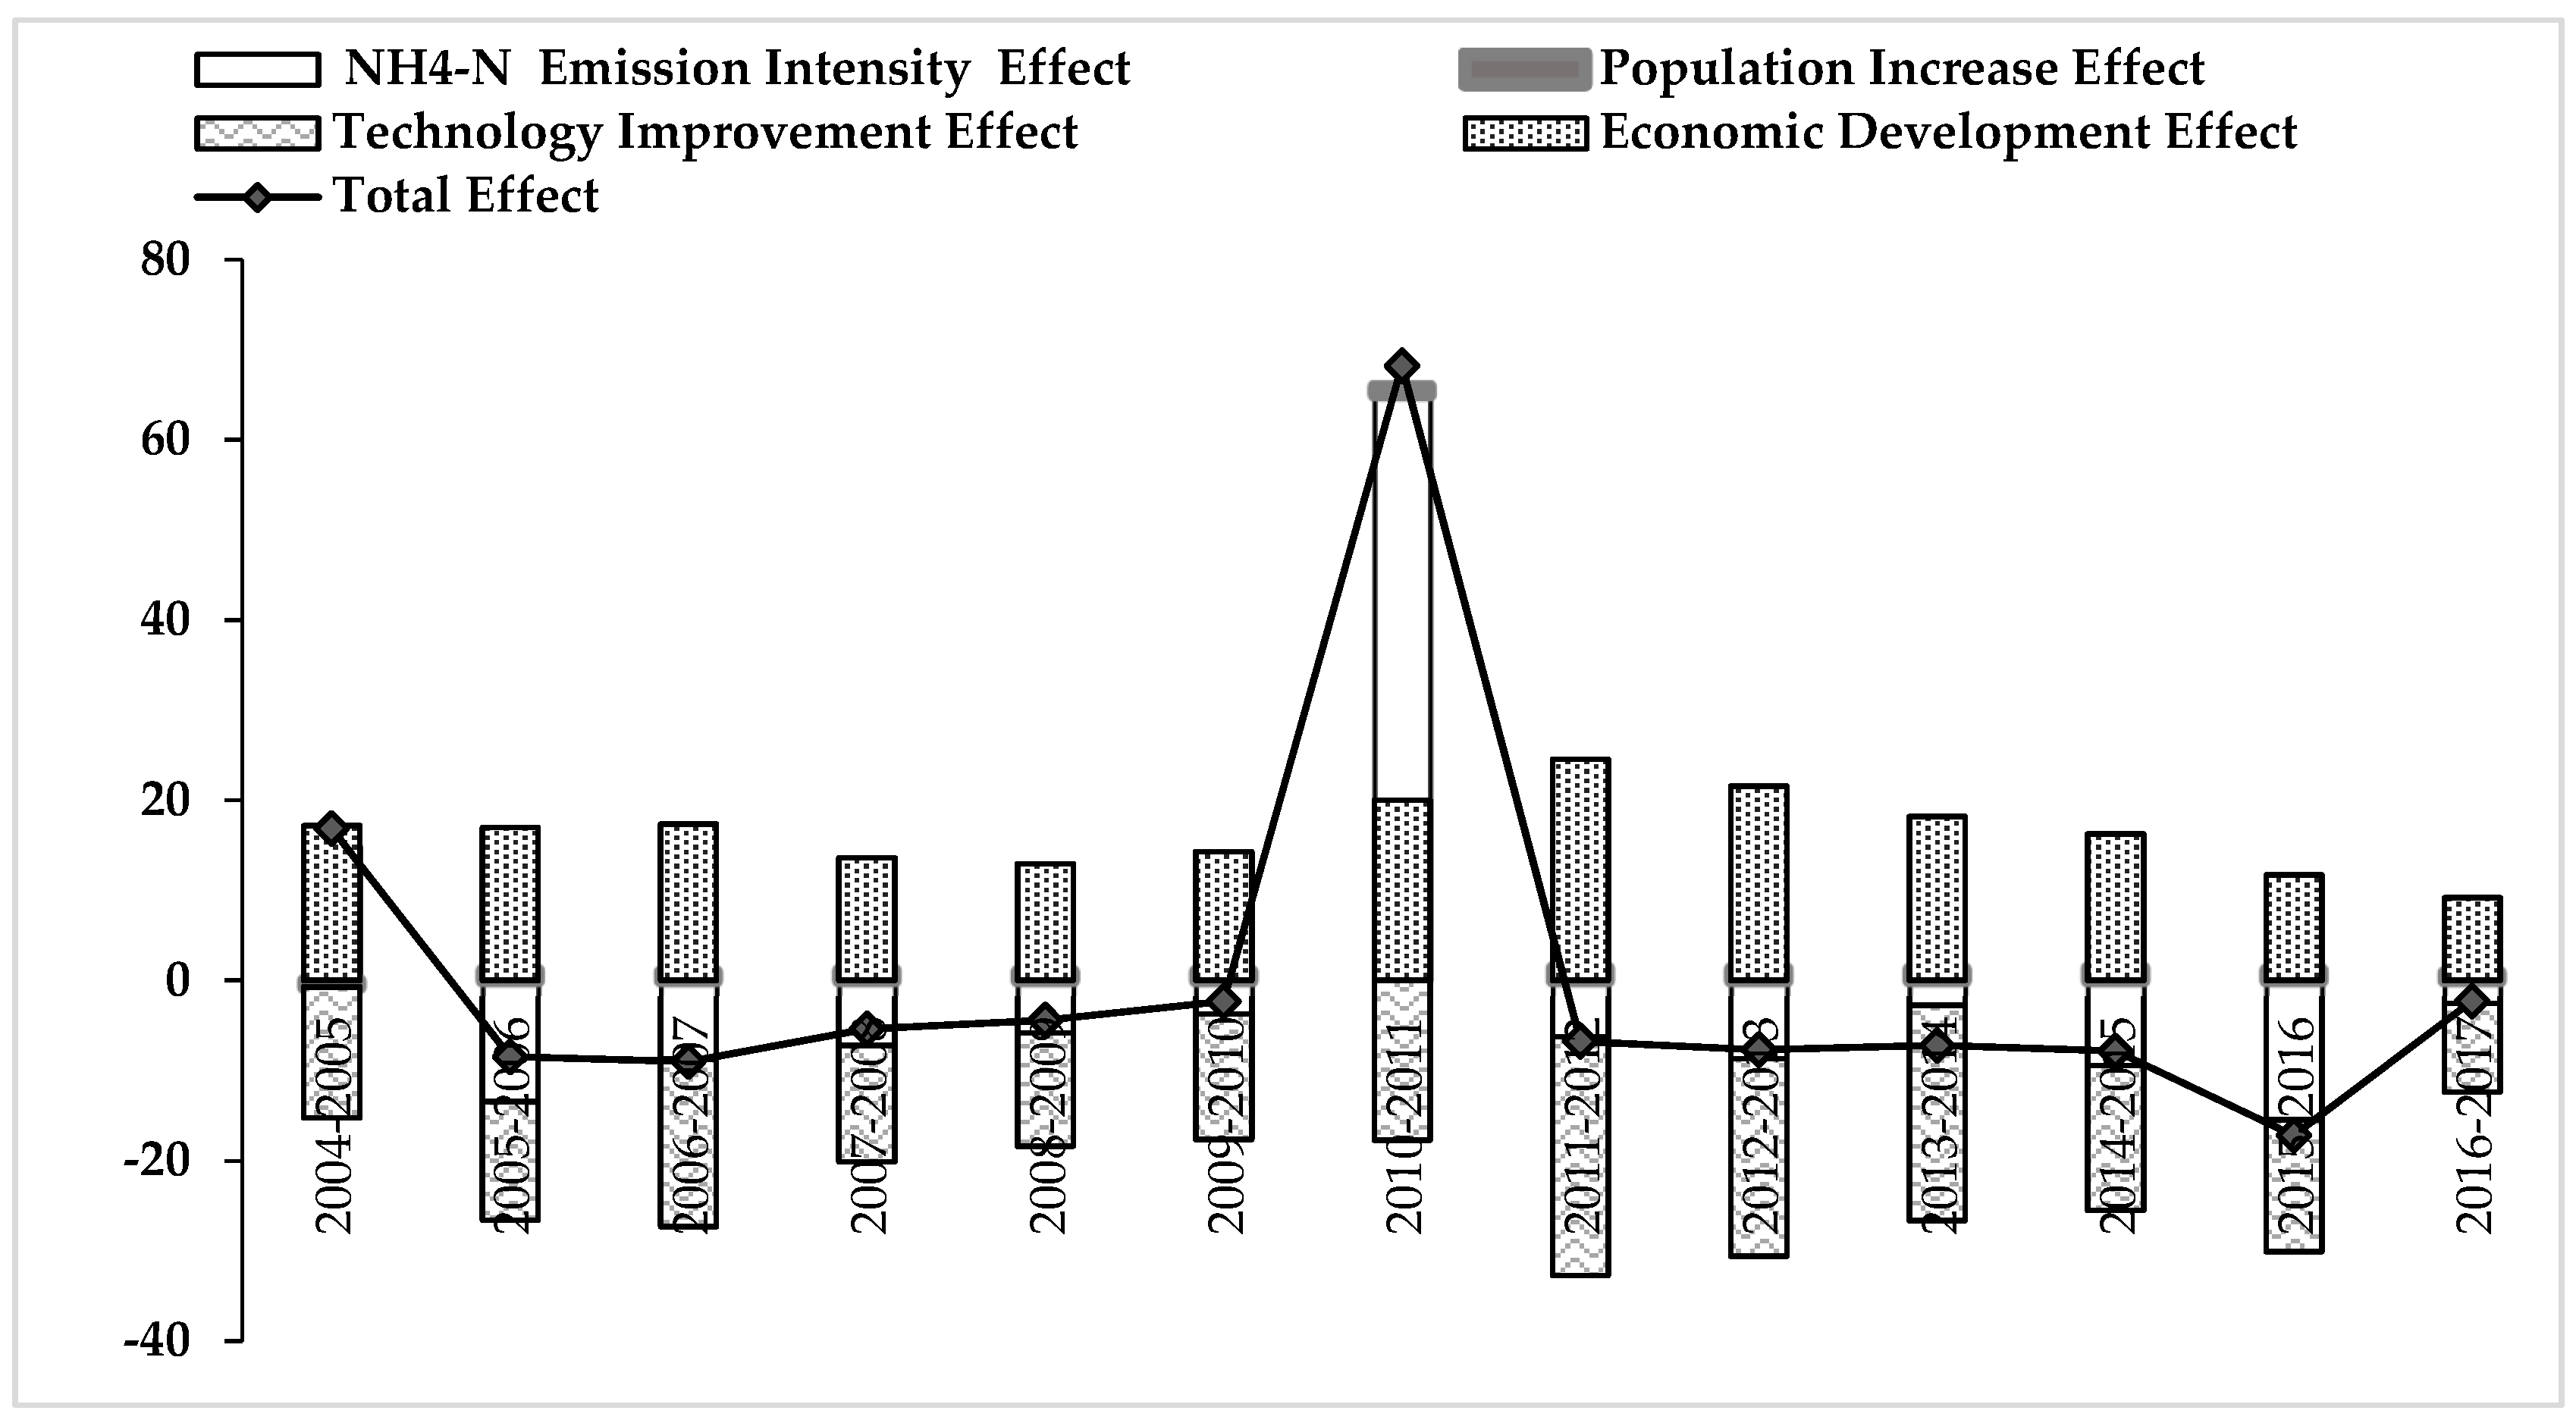
3.2.1. The Temporal Decomposition Analysis of COD and NH4-N Emissions
3.2.2. The Spatial Decomposition Analysis of COD and NH4-N Emissions in Different Provinces and Municipalities of China
3.2.3. The Spatial Decomposition Analysis of COD and NH4-N Emissions Effects in Eastern, Central and Western Regions of Mainland China
4. Conclusions and Recommendation
4.1. Conclusions
4.2. Recommendations
Author Contributions
Funding
Conflicts of Interest
Abbreviations
| COD | Chemical oxygen demand; |
| NH4-N | Ammonia nitrogen; |
| LMID | Logarithmic Mean Divisia Index. |
Nomenclature
| Symbol | Definition |
| It refers to the corresponding provinces or municipalities | |
| The total sum of provinces and municipalities | |
| It refers to the target year. | |
| It refers to the base year. | |
| It represents the total number amount of pollutant (COD or NH4-H) that emitted in year throughout the country. | |
| It represents the water resource consumption in the province | |
| It represents the gross regional product | |
| It represents the total population in the province | |
| It represents the pollutant emission intensity | |
| It depicts the wastewater technology improvement effect | |
| It denotes the impact of economic development | |
| It represents the population increase effect | |
| It represents the relative contribution rate of each factor | |
| It reflects the relative total sum of each factor’s effect. | |
| It represents the absolute contribution rate of each factor | |
| It reflects the absolute total sum of each factor’s effect. |
Appendix A

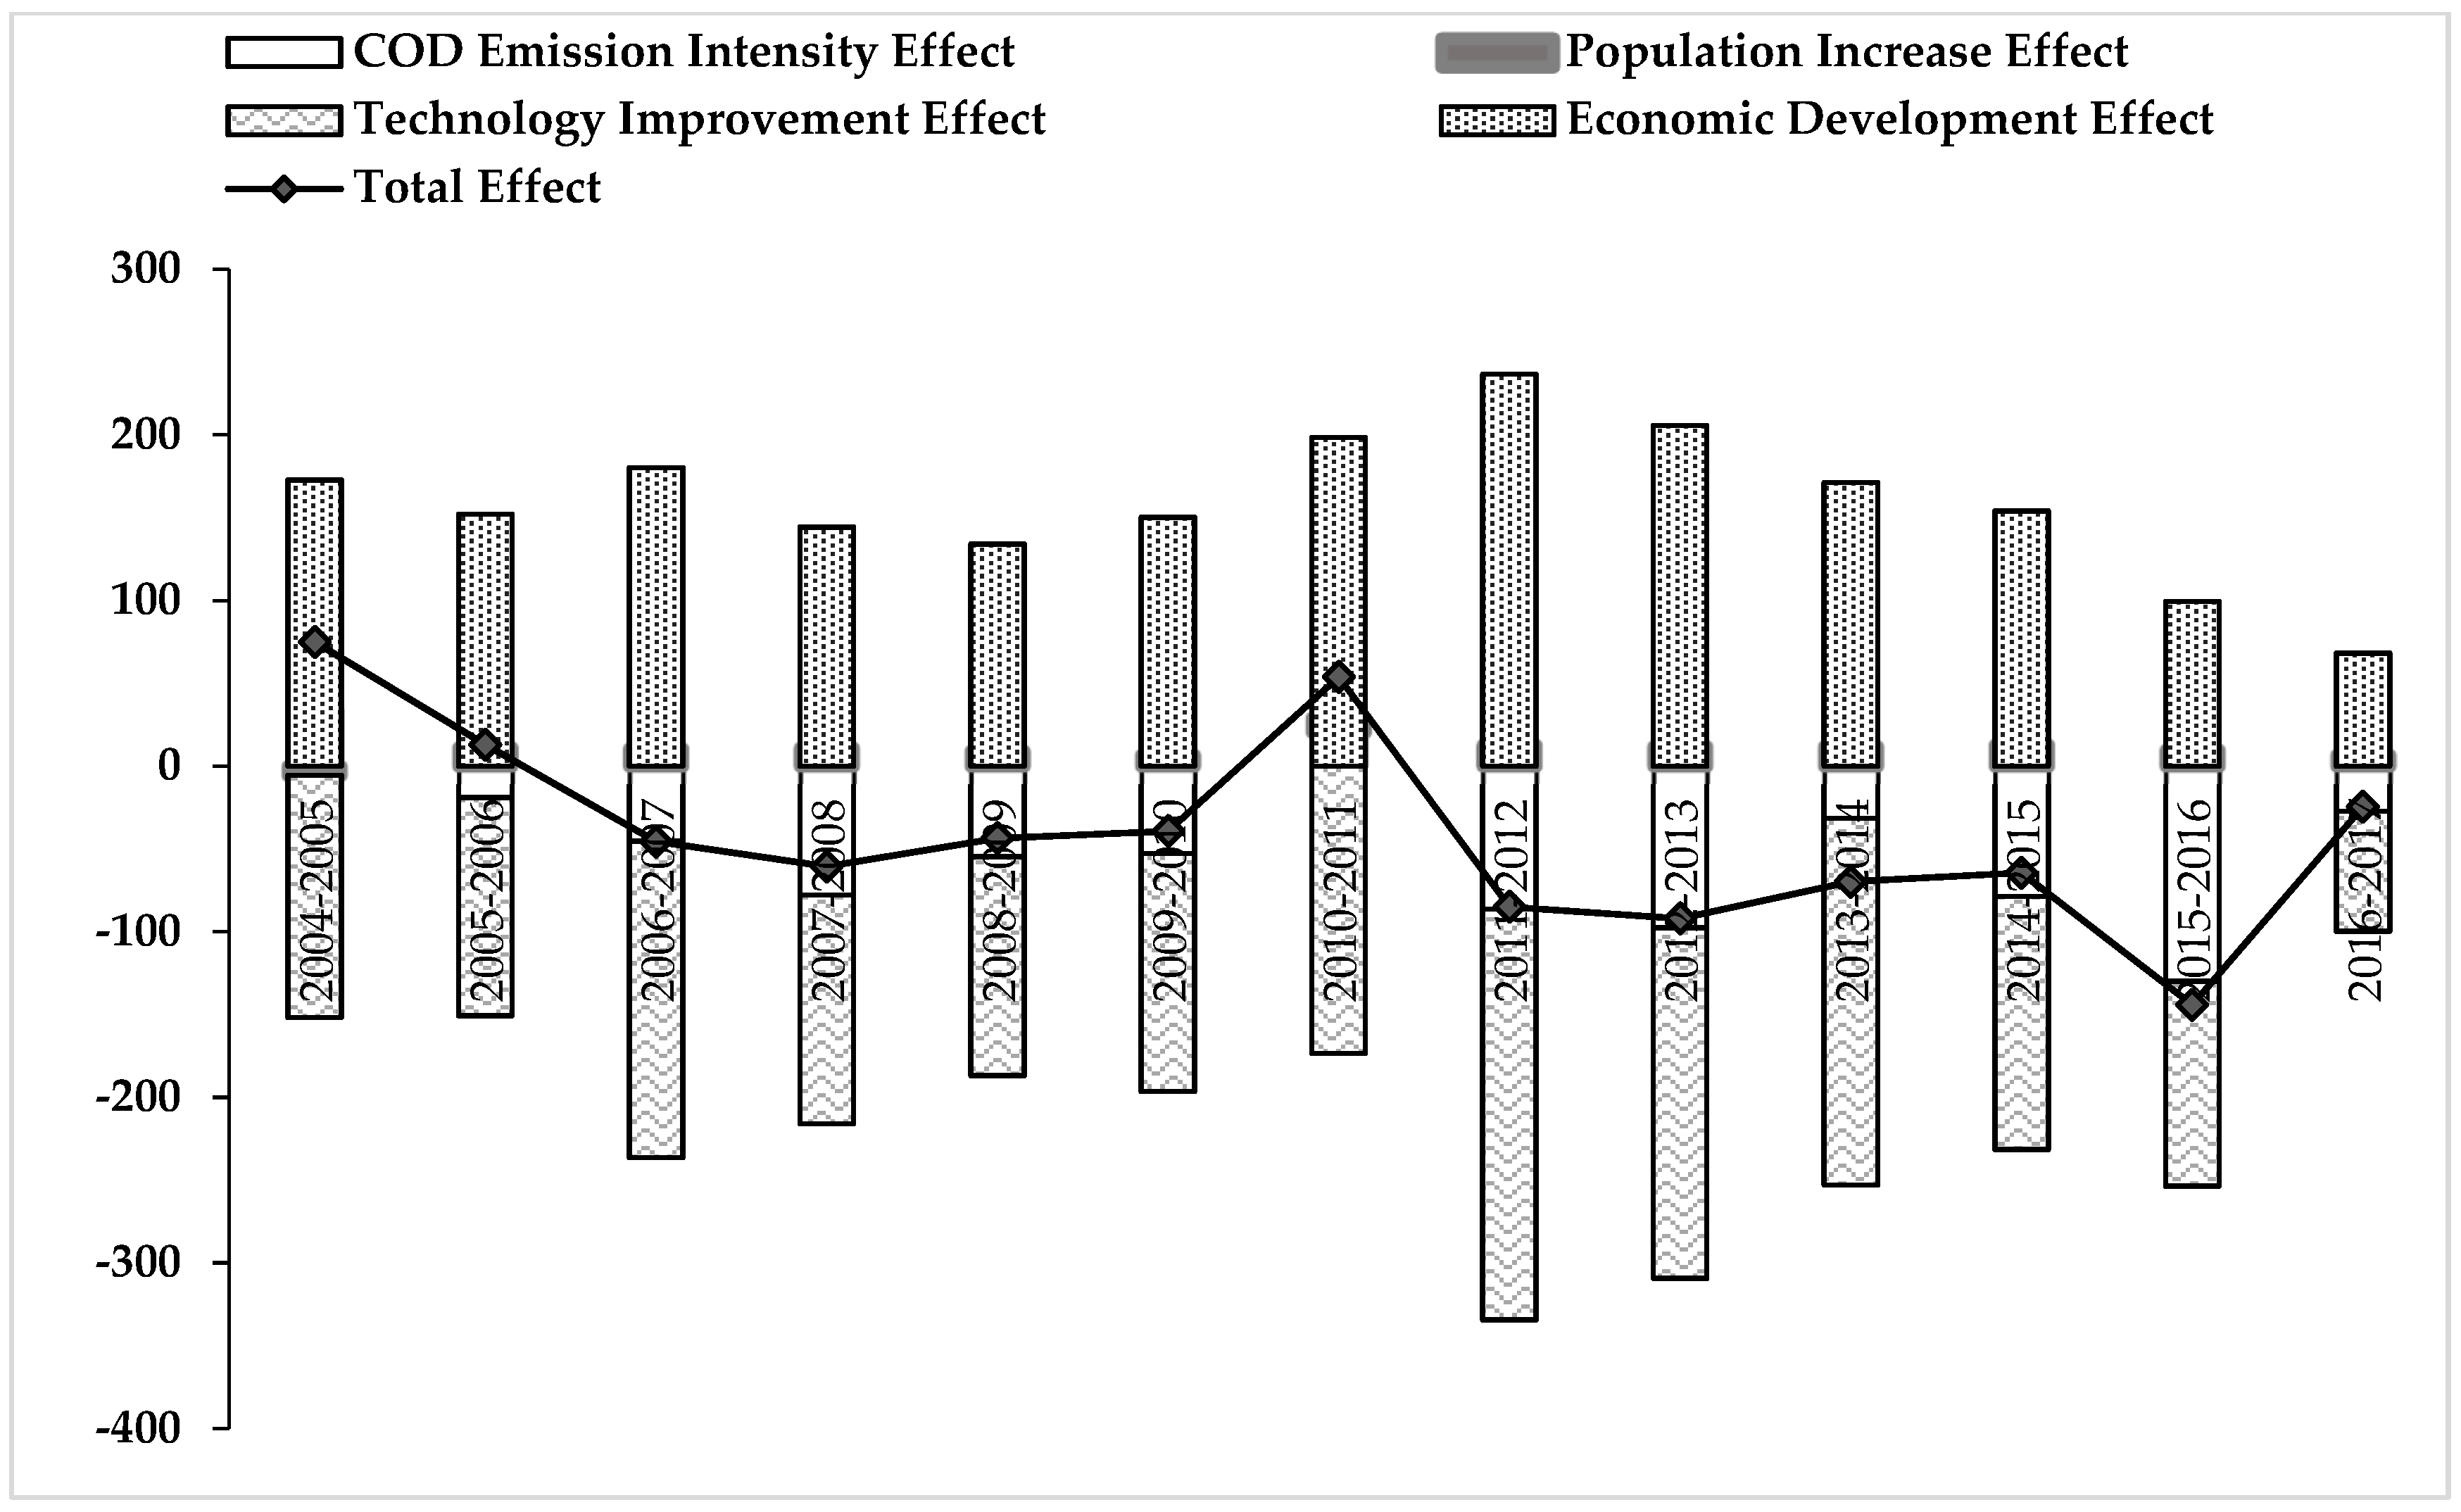
| Time Series | Total Effect | COD Emission Intensity Effect | Technology Improvement Effect | Economic Development Effect | Population Increase Effect |
|---|---|---|---|---|---|
| 2004–2005 | 54.05 | −146.38 | 172.82 | −5.46 | 75.02 |
| 2005–2006 | −18.83 | −131.86 | 152.28 | 11.30 | 12.90 |
| 2006–2007 | −45.22 | −191.22 | 180.25 | 10.69 | −45.50 |
| 2007–2008 | −77.82 | −138.06 | 144.27 | 11.01 | −60.60 |
| 2008–2009 | −54.63 | −132.15 | 134.06 | 9.23 | −43.50 |
| 2009–2010 | −52.73 | −143.78 | 150.39 | 6.82 | −39.30 |
| 2010–2011 | 20.50 | −173.50 | 198.23 | 8.57 | 53.79 |
| 2011–2012 | −86.22 | −248.07 | 236.64 | 12.67 | −84.98 |
| 2012–2013 | −97.64 | −211.64 | 205.48 | 11.86 | −91.94 |
| 2013–2014 | −31.40 | −221.57 | 171.41 | 11.82 | −69.73 |
| 2014–2015 | −78.55 | −152.96 | 154.07 | 13.01 | −64.43 |
| 2015–2016 | −129.92 | −123.62 | 99.51 | 9.82 | −144.21 |
| 2016–2017 | −27.27 | −72.40 | 68.21 | 6.90 | −24.56 |
| Sum effect | −625.68 | −2087.22 | 2067.61 | 118.24 | −527.04 |
| The relative contribution rate | --- | 118.72% | 396.03% | 392.31% | 22.44% |
| The absolute contribution rate | 1 | 12.77% | 42.61% | 42.21% | 2.41% |
| Time Series | Total Effect | NH4-N Emission Intensity Effect | Technology Improvement Effect | Economic Development Effect | Population Increase Effect |
|---|---|---|---|---|---|
| 2004–2005 | 14.92 | −14.55 | 17.17 | −0.69 | 16.86 |
| 2005–2006 | −13.42 | −13.14 | 16.96 | 1.14 | −8.46 |
| 2006–2007 | −8.69 | −18.62 | 17.34 | 0.99 | −8.98 |
| 2007–2008 | −7.16 | −12.94 | 13.60 | 1.15 | −5.36 |
| 2008–2009 | −5.80 | −12.57 | 12.95 | 1.03 | −4.39 |
| 2009–2010 | −3.67 | −13.93 | 14.26 | 1.04 | −2.30 |
| 2010–2011 | 65.00 | −17.68 | 19.99 | 0.92 | 68.22 |
| 2011–2012 | −6.21 | −26.49 | 24.55 | 1.40 | −6.75 |
| 2012–2013 | −8.64 | −21.92 | 21.58 | 1.30 | −7.67 |
| 2013–2014 | −2.70 | −23.93 | 18.18 | 1.28 | −7.18 |
| 2014–2015 | −9.39 | −16.10 | 16.24 | 1.42 | −7.82 |
| 2015–2016 | −15.43 | −14.65 | 11.72 | 1.18 | −17.18 |
| 2016–2017 | −2.53 | −9.85 | 9.20 | 0.91 | −2.27 |
| Sum effect | −3.73 | −216.35 | 213.74 | 13.06 | 6.71 |
| The relative contribution rate | --- | 55.61% | 3223.26% | 3184.36% | 194.51% |
| The absolute contribution rate | 1 | 0.84% | 48.41% | 47.83% | 2.92% |
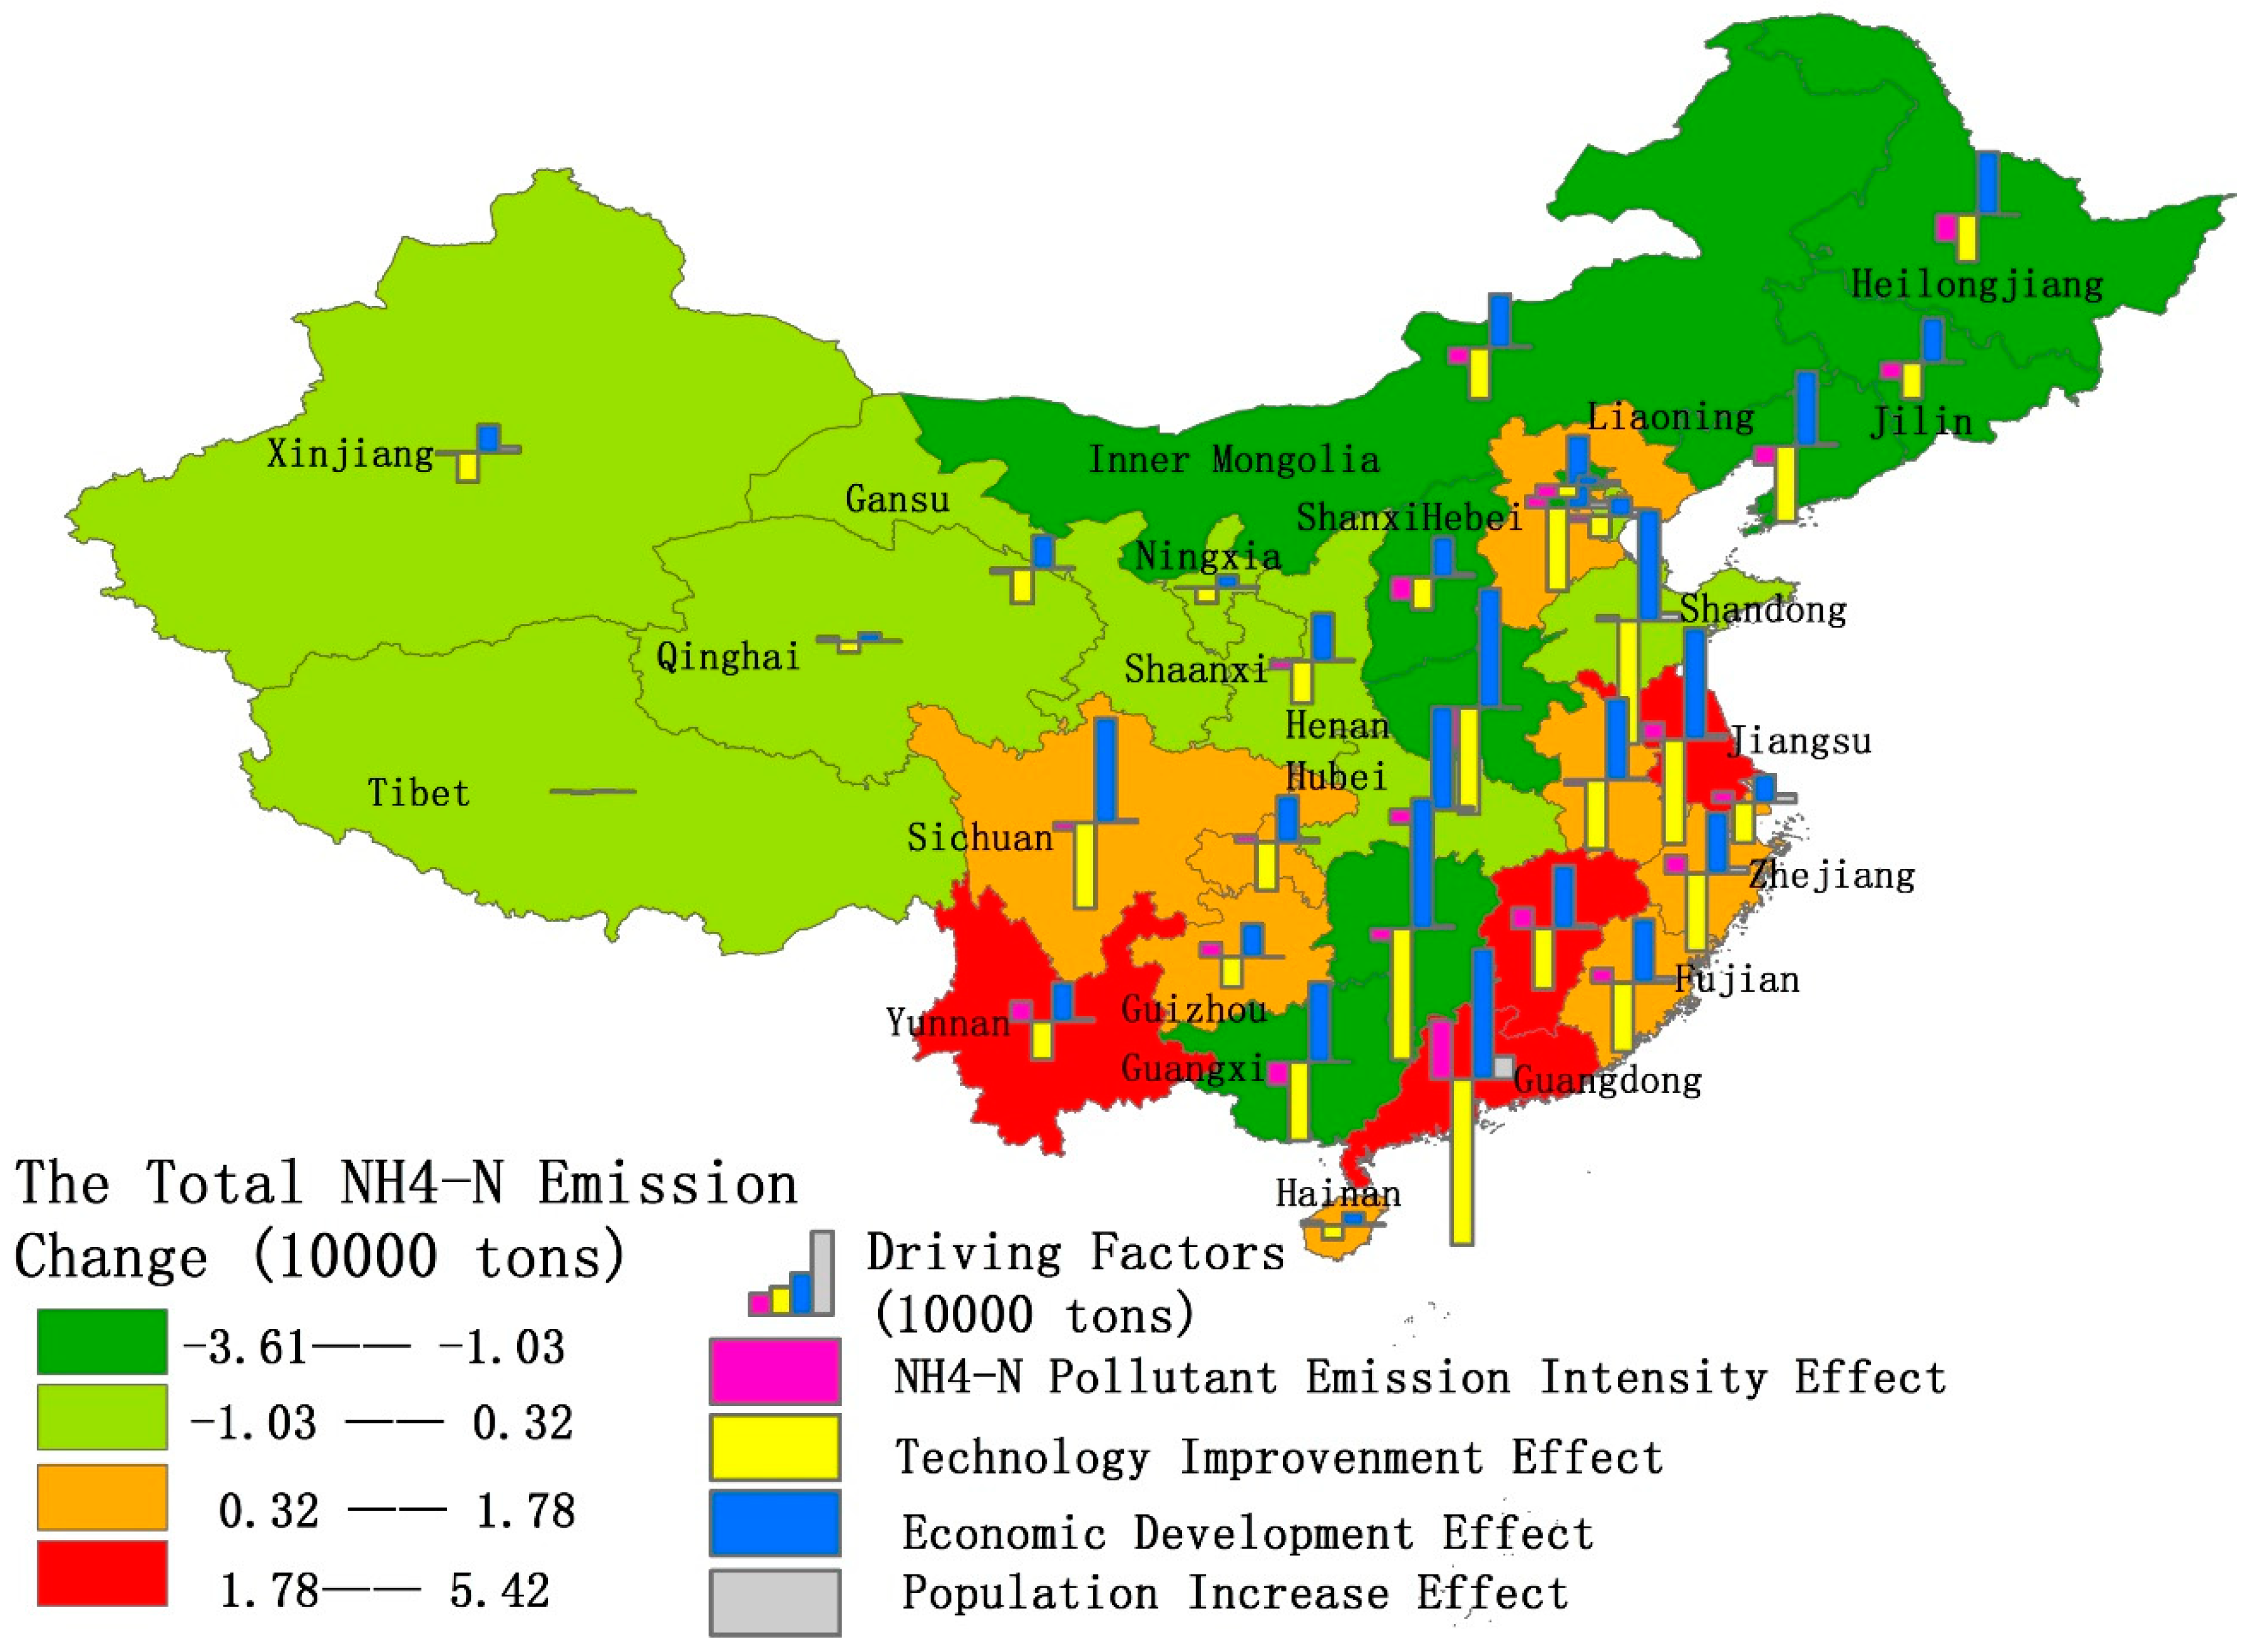
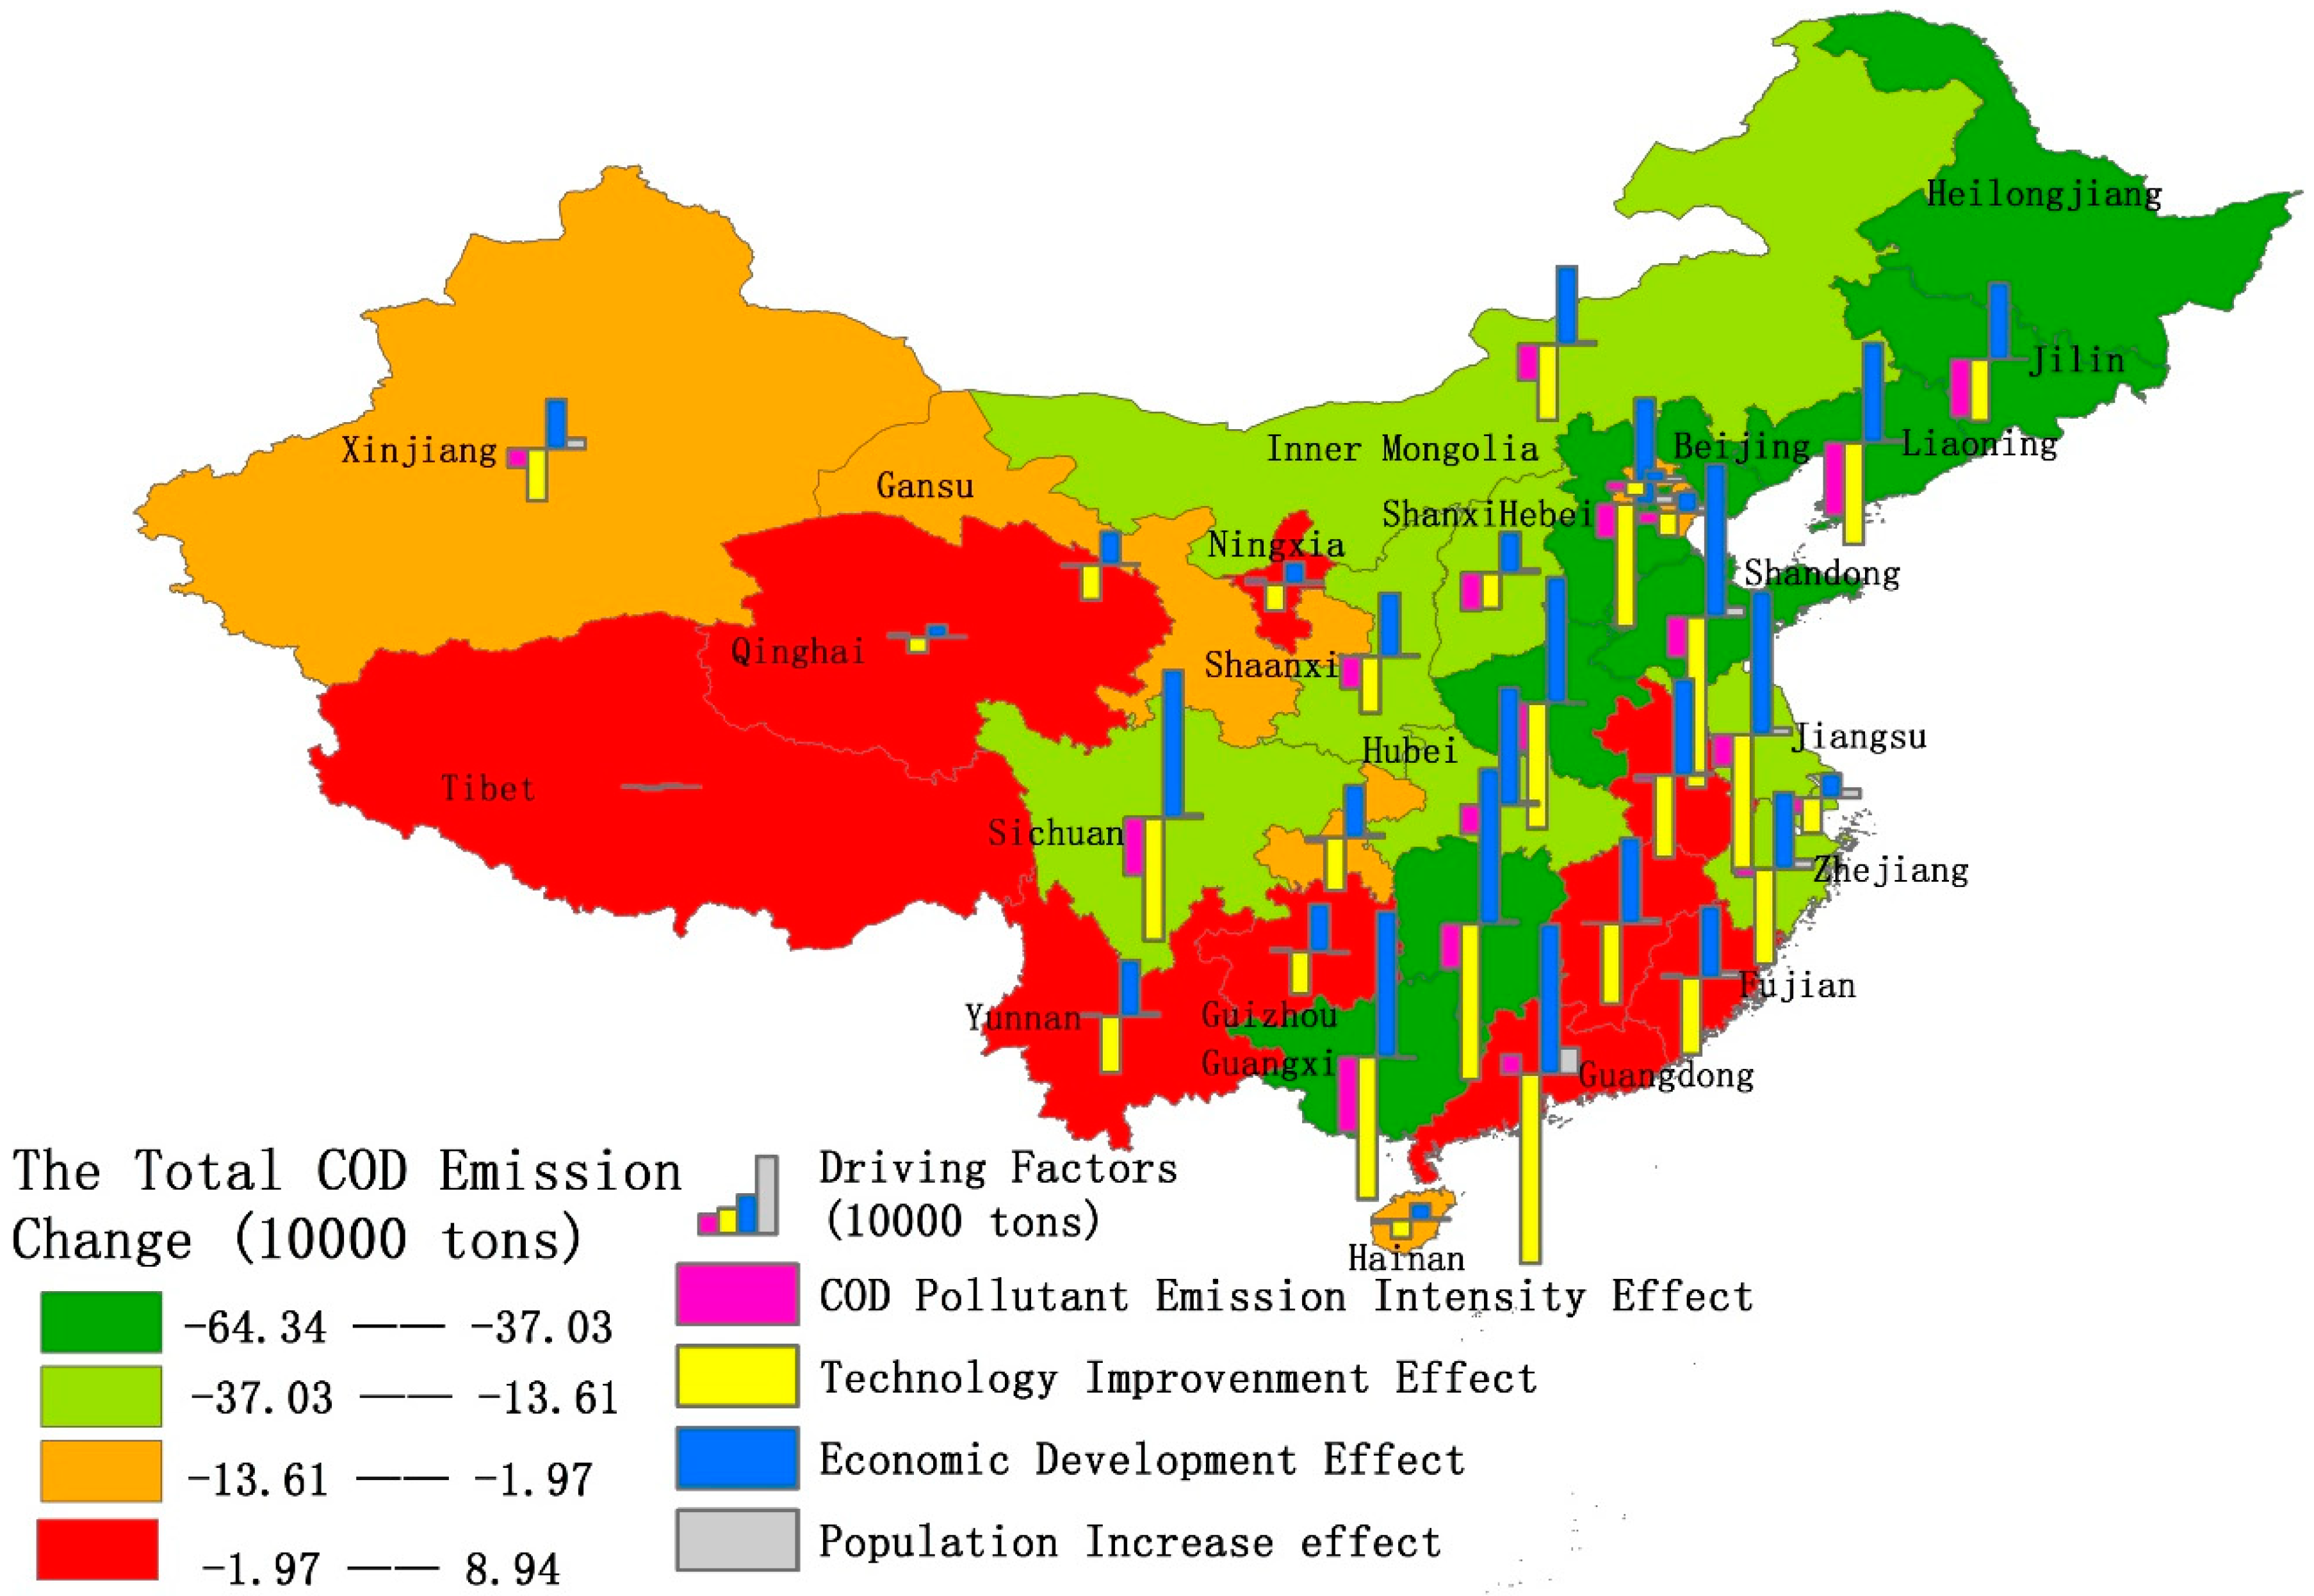
| Provinces and Municipalities | Total Effect | COD Emission Intensity Effect | Technology Improvement Effect | Economic Development Effect | Population Increase Effect |
|---|---|---|---|---|---|
| Beijing | −6.05 | −7.91 | −12.54 | 9.82 | 4.59 |
| Tianjin | −6.46 | −9.89 | −20.64 | 17.57 | 6.51 |
| Hebei | −37.43 | −29.94 | −107.12 | 91.66 | 7.98 |
| Shanxi | −23.64 | −32.15 | −30.77 | 35.68 | 3.59 |
| Inner Mongolia | −27.30 | −31.08 | −65.95 | 67.37 | 2.36 |
| Liaoning | −63.68 | −63.76 | −88.58 | 86.38 | 2.27 |
| Jinlin | −38.09 | −50.33 | −54.28 | 66.20 | 0.30 |
| Heilongjiang | −55.80 | −74.92 | −71.39 | 91.42 | −0.90 |
| Shanghai | −16.35 | −13.72 | −30.78 | 20.66 | 7.48 |
| Jiangsu | −15.65 | −27.27 | −119.30 | 124.89 | 6.02 |
| Zhejiang | −16.02 | −6.84 | −83.07 | 66.12 | 7.77 |
| Anhui | 8.67 | −4.88 | −71.61 | 83.28 | 1.88 |
| Fujian | 2.96 | 2.79 | −66.62 | 61.84 | 4.95 |
| Jiangxi | 8.94 | 0.43 | −69.85 | 74.20 | 4.16 |
| Shandong | −41.85 | −35.12 | −148.52 | 132.80 | 8.99 |
| Henan | −42.09 | −41.44 | −109.13 | 109.18 | −0.70 |
| Hubei | −13.61 | −24.36 | −94.85 | 102.61 | 2.99 |
| Hunan | −37.03 | −38.68 | −135.72 | 134.42 | 2.94 |
| Guangdong | 4.86 | 16.54 | −164.53 | 129.95 | 22.91 |
| Guangxi | −64.34 | −65.24 | −123.81 | 126.28 | −1.58 |
| Hainan | −2.52 | −2.55 | −15.63 | 14.15 | 1.51 |
| Chongqing | −1.97 | −4.07 | −46.27 | 45.34 | 3.02 |
| Sichuan | −24.97 | −49.83 | −106.42 | 128.26 | 3.03 |
| Guizhou | 5.15 | 2.84 | −37.12 | 41.12 | −1.68 |
| Yunnan | 4.73 | 2.02 | −49.03 | 48.55 | 3.19 |
| Xizang | 1.13 | 0.90 | −2.07 | 1.95 | 0.36 |
| Shanxi | −19.54 | −27.46 | −48.97 | 55.35 | 1.54 |
| Gansu | −3.30 | −1.77 | −30.90 | 28.52 | 0.85 |
| Qinghai | 1.67 | 3.26 | −13.12 | 10.64 | 0.88 |
| Ningxia | 2.31 | 4.67 | −23.34 | 18.60 | 2.37 |
| Xinjiang | −9.77 | −15.94 | −45.30 | 42.81 | 8.66 |
| Gross effect | −527.04 | −625.68 | −2087.22 | 2067.61 | 118.24 |
| Provinces and Municipalities | Total Effect | NH4-N Emission Intensity Effect | Technology Improvement Effect | Economic Development Effect | Population Increase Effect |
|---|---|---|---|---|---|
| Beijing | −6.05 | −7.91 | −12.54 | 9.82 | 4.59 |
| Tianjin | −6.46 | −9.89 | −20.64 | 17.57 | 6.51 |
| Hebei | −37.43 | −29.94 | −107.12 | 91.66 | 7.98 |
| Shanxi | −23.64 | −32.15 | −30.77 | 35.68 | 3.59 |
| Inner Mongolia | −27.30 | −31.08 | −65.95 | 67.37 | 2.36 |
| Liaoning | −63.68 | −63.76 | −88.58 | 86.38 | 2.27 |
| Jinlin | −38.09 | −50.33 | −54.28 | 66.20 | 0.30 |
| Heilongjiang | −55.80 | −74.92 | −71.39 | 91.42 | −0.90 |
| Shanghai | −16.35 | −13.72 | −30.78 | 20.66 | 7.48 |
| Jiangsu | −15.65 | −27.27 | −119.30 | 124.89 | 6.02 |
| Zhejiang | −16.02 | −6.84 | −83.07 | 66.12 | 7.77 |
| Anhui | 8.67 | −4.88 | −71.61 | 83.28 | 1.88 |
| Fujian | 2.96 | 2.79 | −66.62 | 61.84 | 4.95 |
| Jiangxi | 8.94 | 0.43 | −69.85 | 74.20 | 4.16 |
| Shandong | −41.85 | −35.12 | −148.52 | 132.80 | 8.99 |
| Henan | −42.09 | −41.44 | −109.13 | 109.18 | −0.70 |
| Hubei | −13.61 | −24.36 | −94.85 | 102.61 | 2.99 |
| Hunan | −37.03 | −38.68 | −135.72 | 134.42 | 2.94 |
| Guangdong | 4.86 | 16.54 | −164.53 | 129.95 | 22.91 |
| Guangxi | −64.34 | −65.24 | −123.81 | 126.28 | −1.58 |
| Hainan | −2.52 | −2.55 | −15.63 | 14.15 | 1.51 |
| Chongqing | −1.97 | −4.07 | −46.27 | 45.34 | 3.02 |
| Sichuan | −24.97 | −49.83 | −106.42 | 128.26 | 3.03 |
| Guizhou | 5.15 | 2.84 | −37.12 | 41.12 | −1.68 |
| Yunnan | 4.73 | 2.02 | −49.03 | 48.55 | 3.19 |
| Xizang | 1.13 | 0.90 | −2.07 | 1.95 | 0.36 |
| Shanxi | −19.54 | −27.46 | −48.97 | 55.35 | 1.54 |
| Gansu | −3.30 | −1.77 | −30.90 | 28.52 | 0.85 |
| Qinghai | 1.67 | 3.26 | −13.12 | 10.64 | 0.88 |
| Ningxia | 2.31 | 4.67 | −23.34 | 18.60 | 2.37 |
| Xinjiang | −9.77 | −15.94 | −45.30 | 42.81 | 8.66 |
| Gross effect | −527.04 | −625.68 | −2087.22 | 2067.61 | 118.24 |
References
- Smith, K.; Liu, S.; Hu, H.; Dong, X.; Wen, X. Water and energy recovery: The future of wastewater in China. Sci. Total Environ. 2018, 637–638, 1466–1470. [Google Scholar] [CrossRef] [PubMed]
- Li, W.; Sun, S. Air pollution driving factors analysis: Evidence from economically developed area in China. Environ. Prog. Sustain. Energy 2016, 1–9. [Google Scholar] [CrossRef]
- Kundzewicz, Z.W.; Mata, L.J.; Arnell, N.W.; Döll, P.; Jimenez, B.; Oki, T.; Şen, Z.; Shiklomanov, I. The implications of projected climate change for freshwater resources and their management. Hydrol. Sci. J. 2009, 53, 3–10. [Google Scholar] [CrossRef]
- Geng, Y.; Côté, R.; Tsuyoshi, F. A quantitative water resource planning and management model for an industrial park level. Reg. Environ. Chang. 2007, 7, 123–135. [Google Scholar] [CrossRef]
- National Bureau of Statistics of China. China Water Resources Bulletin (2011–2016); China Water & Power Press: Beijing, China, 2018.
- Science, E. Common Linkage Analysis of Chemical Oxygen Demand and Ammonia Nitrogen Emission in Industrial Sectors. Environ. Sci. Technol. 2015, 39, 214–240. [Google Scholar] [CrossRef]
- Ministry of Environmental Protection of the People’s Republic of China. Annual Statistic Report on Environment in China; China Environmental Science Press: Beijing, China, 2015.
- Long, S.; Zhao, L.; Liu, H.; Li, J.; Zhou, X.; Liu, Y.; Qiao, Z. A Monte Carlo-based integrated model to optimize the cost and pollution reduction in wastewater treatment processes in a typical comprehensive industrial park in China. Sci. Total Environ. 2019, 647, 1–10. [Google Scholar] [CrossRef]
- Englert, D.; Zubrod, J.P.; Schulz, R.; Bundschuh, M. Effects of municipal wastewater on aquatic ecosystem structure and function in the receiving stream. Sci. Total Environ. 2013, 454–455, 401–410. [Google Scholar] [CrossRef]
- Ali, I.; Basheer, A.A.; Mbianda, X.Y.; Burakov, A.; Galunin, E.; Burakova, I.; Mkrtchyan, E.; Tkachev, A.; Grachev, V. Graphene based adsorbents for remediation of noxious pollutants from wastewater. Environ. Int. 2019, 127, 160–180. [Google Scholar] [CrossRef]
- Hasan, H.A.; Rozaimah, S.; Abdullah, S.; Kamarudin, S.K.; Kofli, N.T. Kinetic evaluation of simultaneous COD, ammonia and manganese removal from drinking water using a biological aerated filter system. Sep. Purif. Technol. 2014, 130, 56–64. [Google Scholar] [CrossRef]
- Hu, Y.; Cheng, H. Water pollution during China ’ s industrial transition. Environ. Dev. 2013, 8, 57–73. [Google Scholar] [CrossRef]
- Gao, X.; Shen, J.; He, W.; Sun, F.; Zhang, Z.; Zhang, X. Multilevel Governments ’ Decision-Making Process and Its Influencing Factors in Watershed Ecological Compensation. Sustainability 2019, 11, 1990. [Google Scholar] [CrossRef]
- An, M.; He, W.; Degefu, D.M.; Liao, Z.; Zhang, Z. Spatial Patterns of Urban Wastewater Discharge and Treatment Plants Efficiency in China. Int. J. Environ. Res. Public Health 2018, 15, 1892. [Google Scholar] [CrossRef] [PubMed]
- Yuan, L.; He, W.; Liao, Z.; Degefu, D.M.; An, M. Allocating Water in the Mekong River Basin during the Dry Season. Water 2019, 11, 400. [Google Scholar] [CrossRef]
- Lei, H.J.; Li, C.J.; Xia, X.F.; Xi, B.D. Decomposing the Influencing Factors of China’s Industrial Wastewater Discharges Using LMDI I Method. Adv. Mater. Res. 2012, 518–523, 2089–2098. [Google Scholar] [CrossRef]
- Motevalli, A.; Amir, S.; Hashemi, H.; Berndtsson, R.; Pradhan, B.; Gholami, V. Inverse method using boosted regression tree and k-nearest neighbor to quantify effects of point and non-point source nitrate pollution in groundwater. J. Clean. Prod. 2019, 228, 1248–1263. [Google Scholar] [CrossRef]
- Yu, H.; Shen, Z.-Y. Uncertainty of non-point source pollution. Water Resour. Prot. 2008, 24, 1–5. [Google Scholar]
- Chen, K.; Liu, X.; Ding, L.; Huang, G.; Li, Z. Spatial characteristics and driving factors of provincial wastewater discharge in China. Int. J. Environ. Res. Public Health 2016, 13, 1221. [Google Scholar] [CrossRef]
- Inman, A.; Winter, M.; Wheeler, R.; Vrain, E.; Lovett, A.; Collins, A.; Jones, I.; Johnes, P.; Cleasby, W. An exploration of individual, social and material factors in fl uencing water pollution mitigation behaviours within the farming community. Land Use Policy 2018, 70, 16–26. [Google Scholar] [CrossRef]
- Hettige, H.; Mani, M.; Wheeler, D. Industrial pollution in economic development: The environmental Kuznets curve revisited. J. Dev. Econ. 2000, 62, 445–476. [Google Scholar] [CrossRef]
- Shen, J. A simultaneous estimation of Environmental Kuznets Curve: Evidence from China. China Econ. Rev. 2006, 17, 383–394. [Google Scholar] [CrossRef]
- Gu, A.; Zhang, Y.; Pan, B. Relationship between Industrial Water Use and Economic Growth in China: Insights from an Environmental Kuznets Curve. Water 2017, 9, 556. [Google Scholar] [CrossRef]
- Chen, G.; Li, H.; Liang, T. The Relationship between Industrial Waste Discharge and Economic Growth in Shanxi, China. Resour. Sci. 2013, 35, 1184–1193. [Google Scholar]
- Man, Y.; Hu, Y.; Ren, J. Forecasting COD load in municipal sewage based on ARMA and VAR algorithms. Resour. Conserv. Recycl. 2019, 144, 56–64. [Google Scholar] [CrossRef]
- Tang, Z.; Fu, Z.; Zhou, Y. Identify Important Coefficients in China’ s Sectors of Discharge Amount of Industrial Wastewater. China Polul. Resour. Environ. 2008, 18, 123–127. [Google Scholar]
- Shao, C.; Guan, Y.; Wan, Z.; Guo, C.; Chu, C.; Ju, M. Performance and decomposition analyses of carbon emissions from industrial energy consumption in Tianjin, China. J. Clean. Prod. 2014, 64, 590–601. [Google Scholar] [CrossRef]
- Ang, B.W.; Crescent, R. Decomposition of industrial energy consumption: The energy coefficient approach. Energy Econ. 1996, 18, 129–143. [Google Scholar] [CrossRef]
- Hamilton, C.; Turton, H. Determinants of emissions growth in OECD countries. Energy Policy 2002, 30, 63–71. [Google Scholar] [CrossRef]
- Huvaz, O. Examining the sectoral energy use in Turkish economy (1980–2000) with the help of decomposition analysis. Energy Convers. Manag. 2006, 47, 732–745. [Google Scholar] [CrossRef]
- Ang, B.W. Decomposition analysis for policymaking in energy: Which is the preferred method? Energy Policy 2004, 32, 1131–1139. [Google Scholar] [CrossRef]
- Ang, B.W.; Choi, K.-H. Decomposition of Aggregate Energy and Gas Emission Intensities for Industry: A Refined Divisia Index Method. Energy J. 1997, 18, 59–73. [Google Scholar] [CrossRef]
- Kuai, P.; Shu, K.-D.; Cheng, R.-H. Driving force for the variation of pollution discharge in the Chinese industrial department: An empirical study based on pollution data during the 12th five-year plan period. China Environ. Sci. 2018, 38, 2392–2400. [Google Scholar] [CrossRef]
- Geng, Y.; Wang, M.; Sarkis, J.; Xue, B.; Zhang, L.; Fujita, T.; Yu, X.; Ren, W.; Zhang, L.; Dong, H. Spatial-temporal patterns and driving factors for industrial wastewater emission in China. J. Clean. Prod. 2014, 76, 116–124. [Google Scholar] [CrossRef]
- Lei, H.; Xia, X.; Li, C.; Xi, B. Decomposition Analysis of Wastewater Pollutant Discharges in Industrial Sectors of China (2001–2009) Using the LMDI I Method. Int. J. Environ. Res. Public Health 2012, 9, 2226–2240. [Google Scholar] [CrossRef] [PubMed]
- Qi, M.; Chen, K.; Ding, L.; Liao, Q.-P. Spatial-temporal patterns and driving factors for household waste water discharge in China. Geogr. Geoinf. Sci. 2016, 32, 106–112. [Google Scholar]
- Xia, X.; Lei, H.; Li, C.; Xi, B. Decomposition analyses for COD discharges in China’s industrial sub-sectors: Which is the superior method? Adv. Mater. Res. 2012, 518–523, 168–177. [Google Scholar] [CrossRef]
- Guo, M.; Wang, J.N.; Bi, J. Decomposition analysis of water consumption-related chemical oxygen demand emission in Chinese industrial sectors. Water Policy 2014, 16, 805–823. [Google Scholar] [CrossRef]
- Zhang, Z.; He, W.; An, M.; Degefu, D.M.; Yuan, L.; Shen, J.; Liao, Z.; Wu, X. Water Security Assessment of China’s One Belt and One Road Region. Water 2019, 11, 607. [Google Scholar] [CrossRef]
- Kaya, Y. Impact of Carbon Dioxide Emission Control on GNP Growth: Interpretation of Proposed Scenarios; Response Strategies Working Group: Paris, France, 1990; Available online: http://refhub.elsevier.com/S0301-4215(19)302 28-9/sref28 (accessed on 17 July 2019).
- Mahony, T.O. Decomposition of Ireland’s carbon emissions from 1990 to 2010: An extended Kaya identity. Energy Policy 2013, 59, 573–581. [Google Scholar] [CrossRef]
- Zhao, C.; Chen, B. Driving Force Analysis of the Agricultural Water Footprint in China Based on the LMDI Method. Environ. Sci. Technol. 2014, 48, 12723–12731. [Google Scholar] [CrossRef]
- Ang, B.W. The LMDI approach to decomposition analysis: A practical guide. Energy Policy 2005, 33, 867–871. [Google Scholar] [CrossRef]
- National Bureau of Statistics of China. China Statistics Yearbook (2004–2017); China Statistica Press: Beijing, China, 2017.
- National Bureau of Statistics of China; Ministry of Environmental Protection of China. China Statistic Yearbook on Environment (2004–2017); China Statistica Press: Beijing, China, 2017.
- National Bureau of Statistics of China. China Water Resources Bulletin (2004–2017); China Water & Power Press: Beijing, China, 2017.
- Zhang, W.; Lin, X.; Su, X. Transport and fate modeling of nitrobenzene in groundwater after the Songhua River pollution accident. J. Environ. Manag. 2010, 91, 2378–2384. [Google Scholar] [CrossRef] [PubMed]
- Xie, H.; Shen, M.; Wei, C. Assessing the abatement potential and cost of Chinese industrial water pollutants. Water Policy 2017, 19, 936–956. [Google Scholar] [CrossRef]
- Zhang, P.; Han, J.; Du, W.-C. Environmental Investment and Industrial COD Discharge: Evidence from LMDI Decomposition. China Polul. Resour. Environ. 2013, 23, 119–125. [Google Scholar]
- Levidow, L.; Lindgaard-jørgensen, P.; Nilsson, Å.; Alongi, S. Process eco-innovation: Assessing meso-level eco-ef fi ciency in industrial water-service systems. J. Clean. Prod. 2016, 110, 54–65. [Google Scholar] [CrossRef]
- Yong, G. Eco-indicators: Improve China’s sustainability targets. Nature 2011, 477, 162. [Google Scholar] [CrossRef] [PubMed]
- Sylaios, G.; Gikas, G. Sustainable Solutions to Wastewater Management: Maximizing the Impact of Territorial Co-operation. Environ. Process 2016, 3, 1–2. [Google Scholar] [CrossRef]
- Science, R. Driving effect of spatial-temporal difference in water resource consumption in the Yangtze River Economic Zone. Resour. Sci. 2018, 40, 2247–2259. [Google Scholar] [CrossRef]
- Park, T.; Lee, J.; Lee, M.; Park, C.; Lee, C.; Moon, S.; Chung, J.; Cui, R.; An, Y.; Yeom, D.; et al. Development of water quality criteria of ammonia for protecting aquatic life in freshwater using species sensitivity distribution method. Sci. Total Environ. 2018, 634, 934–940. [Google Scholar] [CrossRef] [PubMed]
- Zhou, Y.; Ma, M.; Gao, P.; Xu, Q.; Bi, J.; Naren, T. Managing water resources from the energy - water nexus perspective under a changing climate: A case study of Jiangsu province, China. Energy Policy 2020, 126, 380–390. [Google Scholar] [CrossRef]
- Liang, W.; Yang, M. Urbanization, economic growth and environmental pollution: Evidence from China. Sustain. Comput. Inform. Syst. 2019, 21, 1–9. [Google Scholar] [CrossRef]
- Xiao Zhouyan Effect of Population Spatial Agglomeration on Production and Domestic Pollution in China. China Polulation, Resour. Environ. 2015, 25, 128–134.
- Liu, B.; Yu, Q.; Bi, J.; Zhang, B.; Ge, J.; Bu, M. A study on the short-term and long-term corporate responses to the GreenWatch Program: Evidence from Jiangsu, China. J. Clean. Prod. 2012, 24, 132–140. [Google Scholar] [CrossRef]
- Yu, S.; Lu, H. Relationship between urbanisation and pollutant emissions in transboundary river basins under the strategy of the Belt and Road Initiative. Chemosphere 2018, 203, 11–20. [Google Scholar] [CrossRef] [PubMed]


| Provinces | Municipalities |
|---|---|
| Hebei, Shanxi, Inner Mongolia, Liaoning, Jilin, Heilongjiang, Jiangsu, Zhejiang, Anhui, Fujian, Jiangxi, Shandong, Henan, Hubei, Hunan, Guangdong, Guangxi, Hainan, Sichuan, Guizhou, Yunnan, Xizang, Shanxi, Gansu, Qinghai, Ningxia, Xinjiang | Beijing Tianjin Shanghai Chongqing |
| Region | Total Effect | COD Emission Intensity Effect | Technology Improvement Effect | Economic Development Effect | Population Increase Effect |
|---|---|---|---|---|---|
| Eastern region | −15.794 | −15.212 | −77.411 | 69.926 | 6.904 |
| Central region | −33.209 | −40.834 | −86.224 | 92.500 | 1.350 |
| Western region | −6.531 | −10.587 | −42.590 | 44.410 | 2.236 |
| Region | Total Effect | NH4-N Emission Intensity Effect | Technology Improvement Effect | Economic Development Effect | Population Increase Effect |
|---|---|---|---|---|---|
| Eastern Region | 0.847 | 0.936 | −8.424 | 7.564 | 0.771 |
| Central Region | −1.078 | −1.999 | −8.693 | 9.434 | 0.180 |
| Western Region | 0.457 | 0.080 | −4.157 | 4.319 | 0.215 |
© 2019 by the authors. Licensee MDPI, Basel, Switzerland. This article is an open access article distributed under the terms and conditions of the Creative Commons Attribution (CC BY) license (http://creativecommons.org/licenses/by/4.0/).
Share and Cite
Zhang, Z.; He, W.; Shen, J.; An, M.; Gao, X.; Degefu, D.M.; Yuan, L.; Kong, Y.; Zhang, C.; Huang, J. The Driving Forces of Point Source Wastewater Emission: Case Study of COD and NH4-N Discharges in Mainland China. Int. J. Environ. Res. Public Health 2019, 16, 2556. https://doi.org/10.3390/ijerph16142556
Zhang Z, He W, Shen J, An M, Gao X, Degefu DM, Yuan L, Kong Y, Zhang C, Huang J. The Driving Forces of Point Source Wastewater Emission: Case Study of COD and NH4-N Discharges in Mainland China. International Journal of Environmental Research and Public Health. 2019; 16(14):2556. https://doi.org/10.3390/ijerph16142556
Chicago/Turabian StyleZhang, Zhaofang, Weijun He, Juqin Shen, Min An, Xin Gao, Dagmawi Mulugeta Degefu, Liang Yuan, Yang Kong, Chengcai Zhang, and Jin Huang. 2019. "The Driving Forces of Point Source Wastewater Emission: Case Study of COD and NH4-N Discharges in Mainland China" International Journal of Environmental Research and Public Health 16, no. 14: 2556. https://doi.org/10.3390/ijerph16142556
APA StyleZhang, Z., He, W., Shen, J., An, M., Gao, X., Degefu, D. M., Yuan, L., Kong, Y., Zhang, C., & Huang, J. (2019). The Driving Forces of Point Source Wastewater Emission: Case Study of COD and NH4-N Discharges in Mainland China. International Journal of Environmental Research and Public Health, 16(14), 2556. https://doi.org/10.3390/ijerph16142556