Secular Trends in Lipid Profiles in Korean Adults Based on the 2005–2015 KNHANES


Abstract
:1. Introduction
2. Materials and Methods
2.1. Study Subjects
2.2. Anthropometric and Laboratory Measurements
2.3. Lipid Profiles, and Related Variables
2.4. Statistical Analysis
3. Results
3.1. Characteristics of Sample
3.2. Lipid Profiles
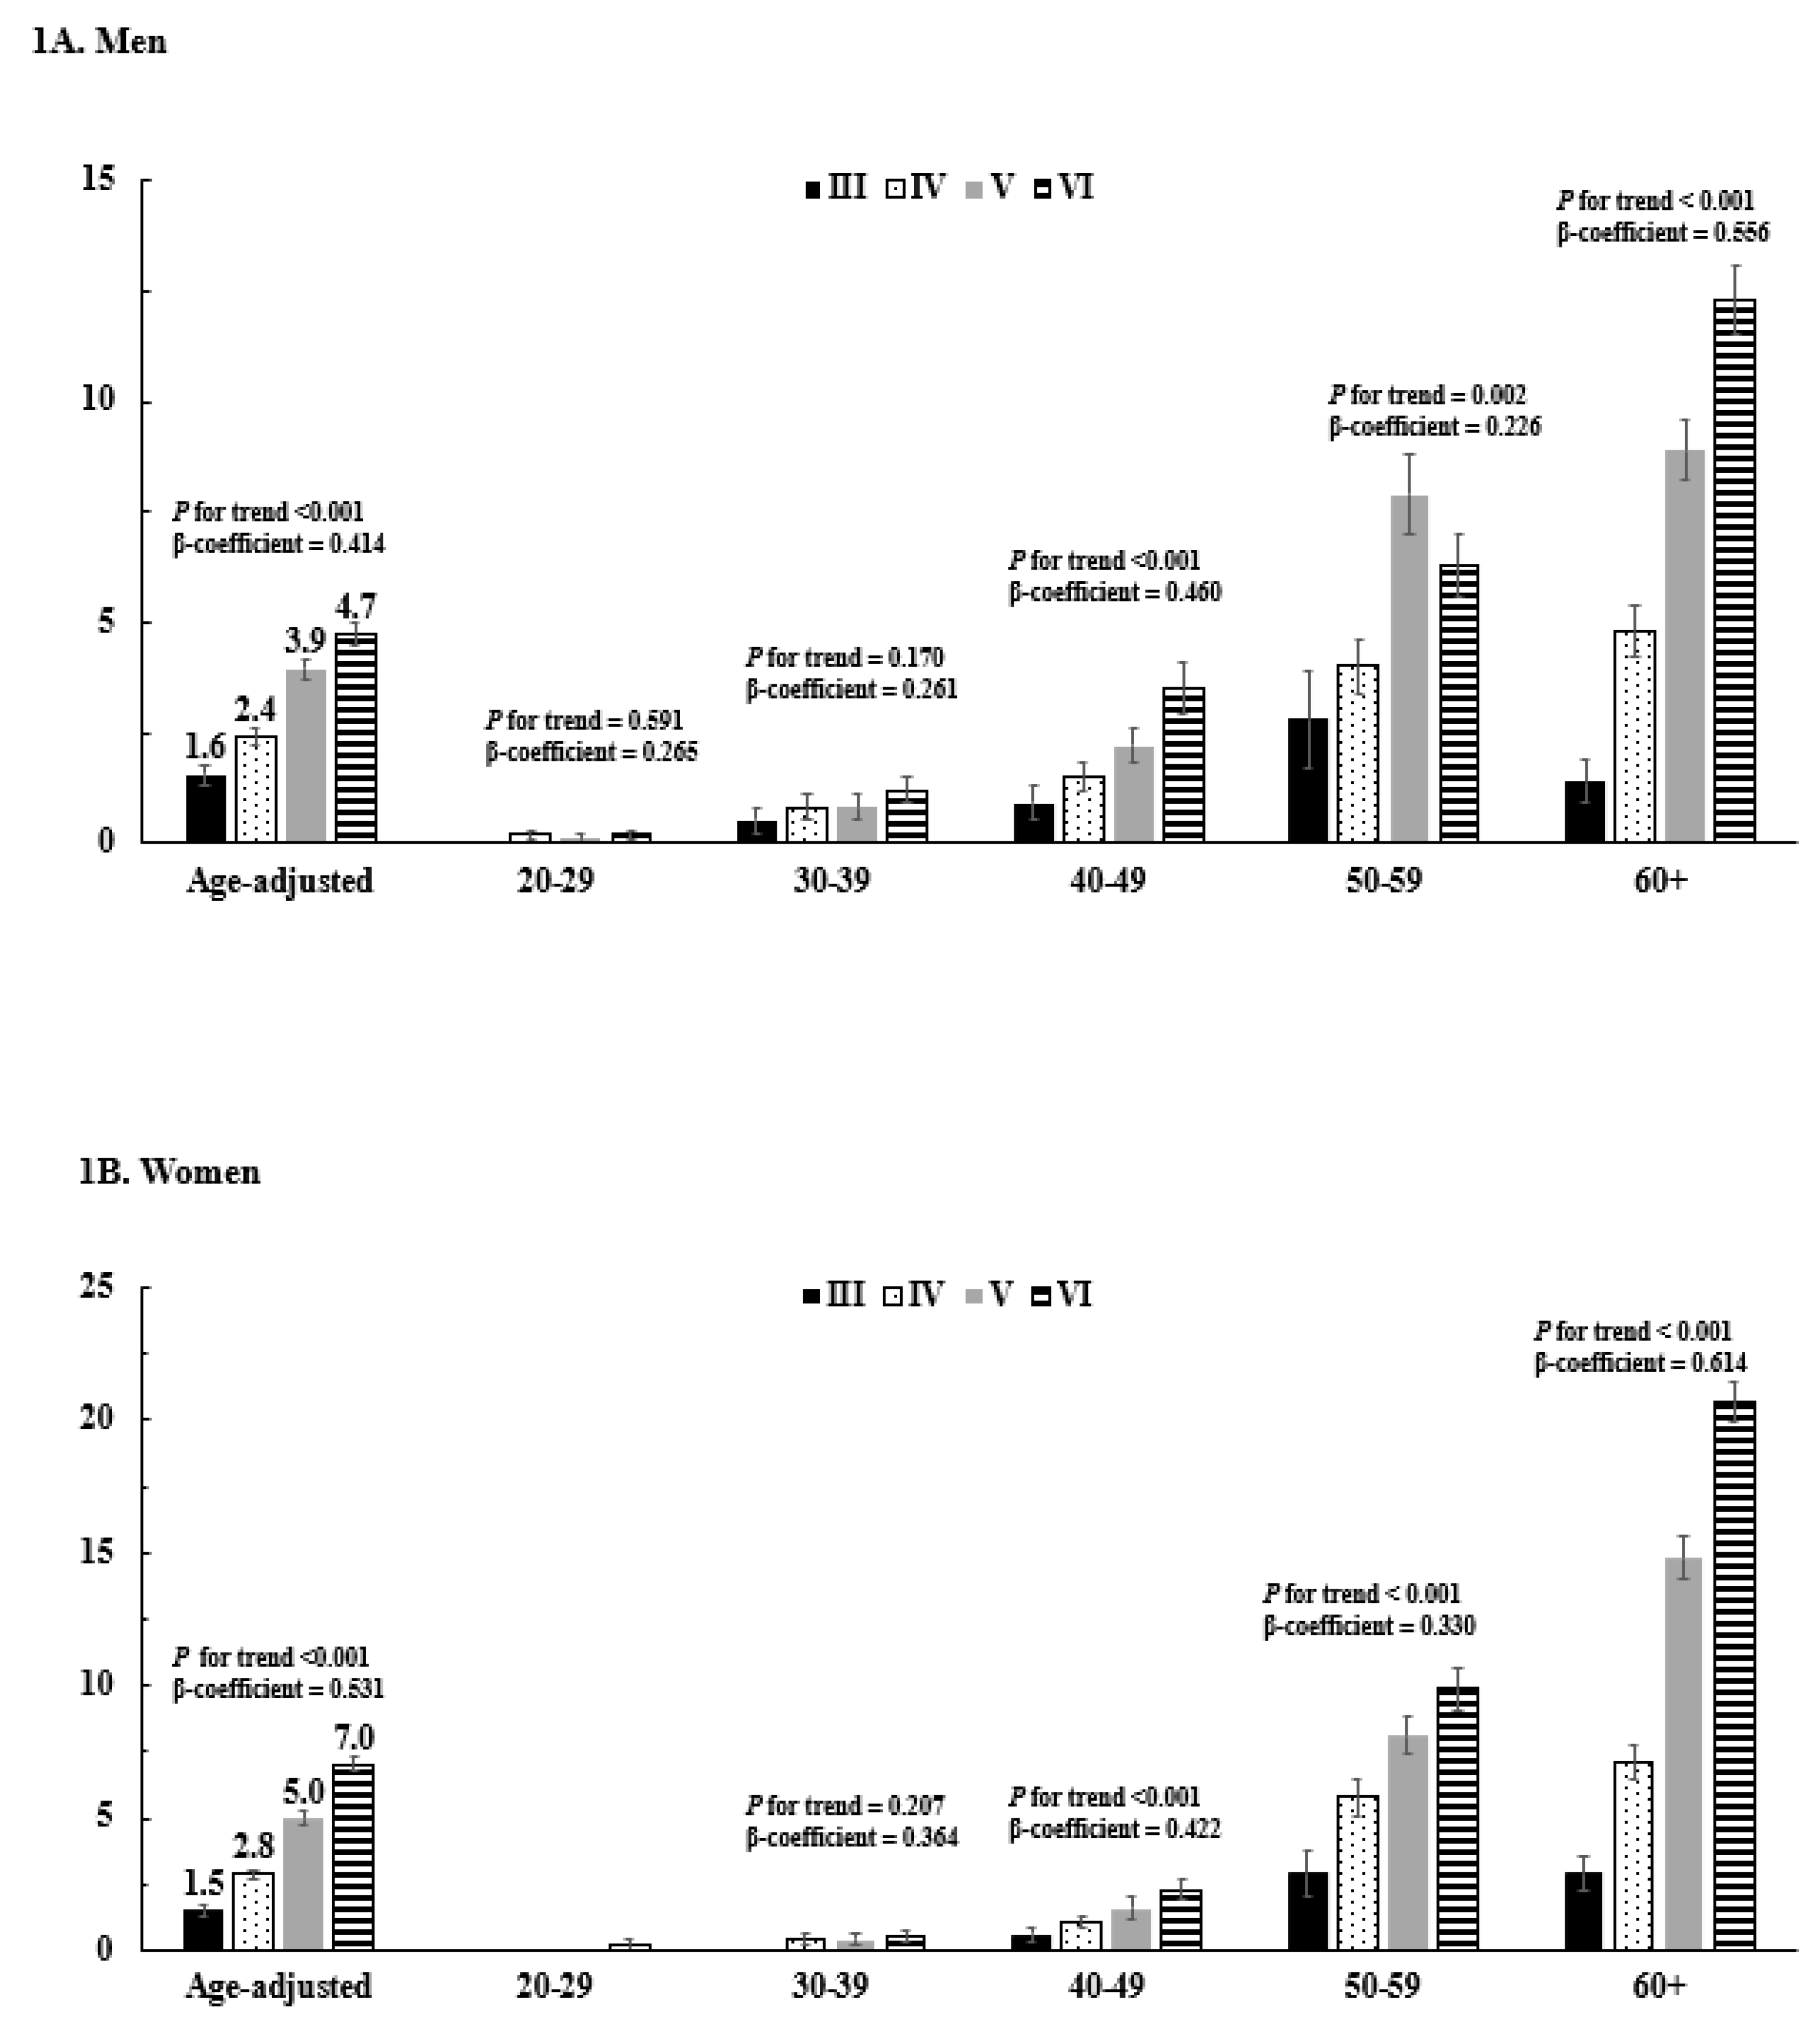
3.3. Lipid-lowering Medications
3.4. Lipid Profile According to Treatment of Lipid Lowering Drug
4. Discussion
5. Conclusions
Author Contributions
Funding
Acknowledgments
Conflicts of Interest
References
- Benjamin, E.J.; Blaha, M.J.; Chiuve, S.E.; Cushman, M.; Das, S.R.; Deo, R.; de Ferranti, S.D.; Floyd, J.; Fornage, M.; Gillespie, C.; et al. Heart disease and stroke statistics-2017 update: A report from the American heart association. Circulation 2017, 135, e146–e603. [Google Scholar] [CrossRef] [PubMed]
- World Health Organization. Cardiovascular Disease (cvds). Available online: http://www.who.int/mediacentre/factsheets/fs317/en/ (accessed on 25 October 2017).
- World Health Organization. Global Action Plan for the Prevention and Control of Noncommunicable Diseases 2013–2020; World Health Organization: Geneva, Switzerland, 2013. [Google Scholar]
- Zabetakis, I.; Lordan, R.; Tsoupras, A. The Impact of Nutrition and Statins on Cardiovascular Diseases; Academic Press: Cambridge, MA, USA, 2019. [Google Scholar]
- Hong, K.N.; Fuster, V.; Rosenson, R.S.; Rosendorff, C.; Bhatt, D.L. How low to go with glucose, cholesterol, and blood pressure in primary prevention of cvd. J. Am. Coll. Cardiol. 2017, 70, 2171–2185. [Google Scholar] [CrossRef] [PubMed]
- Navar-Boggan, A.M.; Peterson, E.D.; D’Agostino, R.B., Sr.; Neely, B.; Sniderman, A.D.; Pencina, M.J. Hyperlipidemia in early adulthood increases long-term risk of coronary heart disease. Circulation 2015, 131, 451–458. [Google Scholar] [CrossRef] [PubMed]
- US Department of Health and Human Services. Healthy People 2020 Topics and Objectives: Heart Disease and Stroke. Available online: https://www.healthypeople.gov/2020/topics-objectives/topic/heart-disease-and-stroke/objectives. (accessed on 25 October 2017).
- Carroll, M.D.; Fryar, C.D.; Kit, B.K. Total and High-Density Lipoprotein Cholesterol in Adults: United States, 2011–2014; NCHS Data Brief: Hyattsville, MD, USA, 2015; pp. 1–8.
- Wilkins, E.W.L.; Wickramasinghe, K.; Bhatnagar, P.; Leal, J.; Luengo-Fernandez, R.; Burns, R.; Rayner, M.; Townsend, N. European Cardiovascular Disease Statistics 2017; European Heart Network: Brussels, Belgium, 2017. [Google Scholar]
- Hata, J.; Ninomiya, T.; Hirakawa, Y.; Nagata, M.; Mukai, N.; Gotoh, S.; Fukuhara, M.; Ikeda, F.; Shikata, K.; Yoshida, D.; et al. Secular trends in cardiovascular disease and its risk factors in Japanese: Half-century data from the hisayama study (1961–2009). Circulation 2013, 128, 1198–1205. [Google Scholar] [CrossRef] [PubMed]
- Bayram, F.; Kocer, D.; Gundogan, K.; Kaya, A.; Demir, O.; Coskun, R.; Sabuncu, T.; Karaman, A.; Cesur, M.; Rizzo, M.; et al. Prevalence of dyslipidemia and associated risk factors in Turkish adults. J. Clin. Lipidol. 2014, 8, 206–216. [Google Scholar] [CrossRef] [PubMed]
- Yang, W.; Xiao, J.; Yang, Z.; Ji, L.; Jia, W.; Weng, J.; Lu, J.; Shan, Z.; Liu, J.; Tian, H.; et al. Serum lipids and lipoproteins in Chinese men and women. Circulation 2012, 125, 2212–2221. [Google Scholar] [CrossRef] [PubMed]
- Nam, G.E.; Han, K.; Park, Y.G.; Choi, Y.S.; Kim, S.M.; Ju, S.Y.; Ko, B.J.; Kim, Y.H.; Kim, E.H.; Cho, K.H.; et al. Trends in lipid profiles among south Korean adults: 2005, 2008 and 2010 Korea national health and nutrition examination survey. J. Public Health 2015, 37, 286–294. [Google Scholar] [CrossRef]
- Kweon, S.; Kim, Y.; Jang, M.J.; Kim, Y.; Kim, K.; Choi, S.; Chun, C.; Khang, Y.H.; Oh, K. Data resource profile: The Korea national health and nutrition examination survey (knhanes). Int. J. Epidemiol. 2014, 43, 69–77. [Google Scholar] [CrossRef]
- Kim, Y. The Korea national health and nutrition examination survey (knhanes): Current status and challenges. Epidemiol. Health 2014, 36, e2014002. [Google Scholar] [CrossRef]
- Expert Panel on Detection, Evaluation. Executive summary of the third report of the national cholesterol education program (ncep) expert panel on detection, evaluation, and treatment of high blood cholesterol in adults (adult treatment panel iii). Jama 2001, 285, 2486–2497. [Google Scholar]
- Blaha, M.J.; Blumenthal, R.S.; Brinton, E.A.; Jacobson, T.A. The importance of non–hdl cholesterol reporting in lipid management. J. Clin. Lipidol. 2008, 2, 267–273. [Google Scholar] [CrossRef] [PubMed]
- Boekholdt, S.M.; Arsenault, B.J.; Mora, S.; Pedersen, T.R.; LaRosa, J.C.; Nestel, P.J.; Simes, R.J.; Durrington, P.; Hitman, G.A.; Welch, K.M.; et al. Association of ldl cholesterol, non-hdl cholesterol, and apolipoprotein b levels with risk of cardiovascular events among patients treated with statins: A meta-analysis. Jama 2012, 307, 1302–1309. [Google Scholar] [CrossRef] [PubMed]
- Shepherd, J.; Cobbe, S.M.; Ford, I.; Isles, C.G.; Lorimer, A.R.; MacFarlane, P.W.; McKillop, J.H.; Packard, C.J. Prevention of coronary heart disease with pravastatin in men with hypercholesterolemia. West of Scotland coronary prevention study group. New Engl. J. Med. 1995, 333, 1301–1307. [Google Scholar] [CrossRef] [PubMed]
- Ahn, E.; Shin, D.W.; Yang, H.K.; Yun, J.M.; Chun, S.H.; Suh, B.; Lee, H.; Son, K.Y.; Cho, B. Treatment gap in the national health-screening program in Korea: Claim-based follow-up of statin use for sustained hypercholesterolemia. J. Korean Med. Sci. 2015, 30, 1266–1272. [Google Scholar] [CrossRef] [PubMed]
- Dehmer, S.P.; Maciosek, M.V.; LaFrance, A.B.; Flottemesch, T.J. Health benefits and cost-effectiveness of asymptomatic screening for hypertension and high cholesterol and aspirin counseling for primary prevention. Ann. Fam. Med. 2017, 15, 23–36. [Google Scholar] [CrossRef] [PubMed]
- Grundy, S.; Becker, D.; Clark, L.; Cooper, R.; Denke, M.; Howard, J.; Hunninghake, D.; Illingworth, D.; Luepker, R.; McBride, P. Detection, evaluation, and treatment of high blood cholesterol in adults (adult treatment panel iii). Circulation 2002, 106, 3143. [Google Scholar]
- Helfand, M.; Carson, S.U.S. Preventive services task force evidence syntheses, formerly systematic evidence reviews. In Screening for Lipid Disorders in Adults: Selective Update of 2001 us Preventive Services Task Force Review; Agency for Healthcare Research and Quality: Rockville, MD, USA, 2008. [Google Scholar]
- Smith, S.C., Jr.; Grundy, S.M. 2013 acc/aha guideline recommends fixed-dose strategies instead of targeted goals to lower blood cholesterol. J. Am. Coll. Cardiol. 2014, 64, 601–612. [Google Scholar] [CrossRef]
- Yokoyama, S. Trend of hdl increase among Japanese people continues in national health and nutrition survey. J. Atheroscler. Thromb. 2018, 25, 554–556. [Google Scholar] [CrossRef]
- Pedram, P.; Aref-Eshghi, E.; Mariathas, H.H.; Hurley, O.; Godwin, M.; Duke, P.; Mahdavian, M.; Asghari, S. Six-year time-trend analysis of dyslipidemia among adults in newfoundland and labrador: Findings from the laboratory information system between 2009 and 2014. Lipids Health Dis. 2018, 17, 99. [Google Scholar] [CrossRef]
- Kim, S.M.; Han, J.H.; Park, H.S. Prevalence of low hdl-cholesterol levels and associated factors among koreans. Circ. J. Off. J. Jpn. Circ. Soc. 2006, 70, 820–826. [Google Scholar] [CrossRef]
- Roth, G.A.; Johnson, C.; Abajobir, A.; Abd-Allah, F.; Abera, S.F.; Abyu, G.; Ahmed, M.; Aksut, B.; Alam, T.; Alam, K.; et al. Global, regional, and national burden of cardiovascular diseases for 10 causes, 1990 to 2015. J. Am. Coll. Cardiol. 2017, 70, 1–25. [Google Scholar] [CrossRef] [PubMed]
- Shin, H.Y.; Kang, H.T. Recent trends in the prevalence of underweight, overweight, and obesity in Korean adults: The Korean national health and nutrition examination survey from 1998 to 2014. J. Epidemiol. 2017, 27, 413–419. [Google Scholar] [CrossRef] [PubMed]
- Verschuren, W.M.; Jacobs, D.R.; Bloemberg, B.P.; Kromhout, D.; Menotti, A.; Aravanis, C.; Blackburn, H.; Buzina, R.; Dontas, A.S.; Fidanza, F.; et al. Serum total cholesterol and long-term coronary heart disease mortality in different cultures. Twenty-five-year follow-up of the seven countries study. Jama 1995, 274, 131–136. [Google Scholar] [CrossRef] [PubMed]
- Luepker, R.V.; Johnson, S.B.; Breslow, L.; Chobanian, A.V.; Davis, C.E.; Duling, B.R.; Oparil, S. Physical activity and cardiovascular health. Nih consensus development panel on physical activity and cardiovascular health. Jama 1996, 276, 241–246. [Google Scholar]
- Juonala, M.; Magnussen, C.G.; Berenson, G.S.; Venn, A.; Burns, T.L.; Sabin, M.A.; Srinivasan, S.R.; Daniels, S.R.; Davis, P.H.; Chen, W.; et al. Childhood adiposity, adult adiposity, and cardiovascular risk factors. New Engl. J. Med. 2011, 365, 1876–1885. [Google Scholar] [CrossRef] [PubMed]
- Cho, I.Y.; Park, H.Y.; Lee, K.; Bae, W.K.; Jung, S.Y.; Ju, H.J.; Song, J.K.; Han, J.S. Association between the awareness of dyslipidemia and health behavior for control of lipid levels among Korean adults with dyslipidemia. Korean J. Fam. Med. 2017, 38, 64–74. [Google Scholar] [CrossRef] [PubMed]
- Scandinavian Simvastatin Survival Study Group. Randomised trial of cholesterol lowering in 4444 patients with coronary heart disease: The scandinavian simvastatin survival study (4s). Lancet 1994, 344, 1383–1389. [Google Scholar]
- Pekkanen, J.; Linn, S.; Heiss, G.; Suchindran, C.M.; Leon, A.; Rifkind, B.M.; Tyroler, H.A. Ten-year mortality from cardiovascular disease in relation to cholesterol level among men with and without preexisting cardiovascular disease. New Engl. J. Med. 1990, 322, 1700–1707. [Google Scholar] [CrossRef] [PubMed]
- Tsoupras, A.; Lordan, R.; Zabetakis, I. Inflammation, not cholesterol, is a cause of chronic disease. Nutrients 2018, 10, 604. [Google Scholar] [CrossRef] [PubMed]
- Martin, S.S.; Blaha, M.J.; Elshazly, M.B.; Brinton, E.A.; Toth, P.P.; McEvoy, J.W.; Joshi, P.H.; Kulkarni, K.R.; Mize, P.D.; Kwiterovich, P.O.; et al. Friedewald-estimated versus directly measured low-density lipoprotein cholesterol and treatment implications. J. Am. Coll. Cardiol. 2013, 62, 732–739. [Google Scholar] [CrossRef] [PubMed]
- Moriyama, K.; Takahashi, E. Non-hdl cholesterol is a more superior predictor of small-dense ldl cholesterol than ldl cholesterol in Japanese subjects with tg levels 400 mg/dl. J. Atheroscler. Thromb. 2016, 23, 1126–1137. [Google Scholar] [CrossRef] [PubMed]
- Arsenault, B.J.; Rana, J.S.; Stroes, E.S.; Despres, J.P.; Shah, P.K.; Kastelein, J.J.; Wareham, N.J.; Boekholdt, S.M.; Khaw, K.T. Beyond low-density lipoprotein cholesterol: Respective contributions of non-high-density lipoprotein cholesterol levels, triglycerides, and the total cholesterol/high-density lipoprotein cholesterol ratio to coronary heart disease risk in apparently healthy men and women. J. Am. Coll. Cardiol. 2009, 55, 35–41. [Google Scholar] [PubMed]
- Drexel, H. Statins, fibrates, nicotinic acid, cholesterol absorption inhibitors, anion-exchange resins, omega-3 fatty acids: Which drugs for which patients? Fundam. Clin. Pharmacol. 2009, 23, 687–692. [Google Scholar] [CrossRef] [PubMed]
- Doonan, R.; Hafiane, A.; Lai, C.; Veinot, J.; Genest, J.; Daskalopoulou, S. Cholesterol efflux capacity, carotid atherosclerosis, and cerebrovascular symptomatology. Arterioscler. Thromb. Vasc. Biol. 2014, 34, 921–926. [Google Scholar] [CrossRef] [PubMed]
- Khera, A.V.; Demler, O.V.; Adelman, S.J.; Collins, H.L.; Glynn, R.J.; Ridker, P.M.; Rader, D.J.; Mora, S. Cholesterol efflux capacity, high-density lipoprotein particle number, and incident cardiovascular events: An analysis from the Jupiter trial (justification for the use of statins in prevention: An intervention trial evaluating rosuvastatin). Circulation 2017, 135, 2494–2504. [Google Scholar] [CrossRef] [PubMed]

| Age Group | III (2005) | IV (2007–2009) | V (2010–2012) | VI (2013–2015) |
|---|---|---|---|---|
| Total, unweighted N | 24752 | 16359 | 17243 | 15536 |
| Age (years, mean ± SE) | 43.6 ± 0.4 | 44.8 ± 0.3 | 45.7 ± 0.2 | 46.6 ± 0.2 |
| Men, unweighted N (%) | 11501 (46.5) | 6905 (42.2) | 7249 (42.1) | 6560 (42.2) |
| Age (years, mean ± SE) | 42.8 ± 0.4 | 43.8 ± 0.4 | 44.7 ± 0.3 | 45.5 ± 0.3 |
| 20–29 years (%) | 21.7 (1.5) | 20.2 (0.9) | 19.0 (0.8) | 18.7 (0.7) |
| 30–39 years (%) | 25.0 (1.4) | 23.3 (0.9) | 21.6 (0.7) | 20.0 (0.7) |
| 40–49 years (%) | 23.8 (1.1) | 23.4 (0.8) | 23.0 (0.7) | 21.6 (0.6) |
| 50–59 years (%) | 14.7 (0.9) | 16.7 (0.6) | 18.8 (0.6) | 20.2 (0.6) |
| ≥60 years (%) | 14.9 (0.8) | 16.3 (0.6) | 17.5 (0.6) | 19.6 (0.6) |
| Women, unweighted N (%) | 13251 (53.5) | 9454 (57.8) | 9994 (57.9) | 8976 (57.8) |
| Age (years, mean ± SE) | 42.8 ± 0.4 | 43.8 ± 0.3 | 44.7 ± 0.3 | 45.5 ± 0.3 |
| 20–29 years (%) | 20.5 (1.4) | 18.4 (0.7) | 17.0 (0.6) | 15.9 (0.6) |
| 30–39 years (%) | 23.1 (1.1) | 21.7 (0.7) | 20.4 (0.6) | 18.8 (0.6) |
| 40–49 years (%) | 22.3 (1.0) | 22.1 (0.7) | 21.6 (0.6) | 21.1 (0.6) |
| 50–59 years (%) | 14.3 (0.7) | 16.3 (0.5) | 18.6 (0.5) | 20.0 (0.5) |
| ≥60 years (%) | 19.9 (0.9) | 21.4 (0.7) | 22.6 (0.6) | 24.2 (0.6) |
| With Lipid-lowering Medication | ||||||||
| Men | Women | |||||||
| KNHANES Phase | III | IV | V | VI | III | IV | V | VI |
| N (%) | 110 (1.0) | 175 (2.5) | 380 (5.2) | 437 (6.7) | 177 (1.3) | 349 (3.7) | 686 (6.9) | 889 (9.9) |
| Age (years) *,† | 52.4 ± 1.9 | 55.5 ± 1.0 | 57.7 ± 0.7 | 58.8 ± 0.7 | 59.9 ± 1.2 | 60.7 ± 0.7 | 62.6 ± 0.5 | 63.5 ± 0.4 |
| BMI (kg/m²) *,† | 25.9 ± 0.4 | 25.8 ± 0.3 | 25.4 ± 0.2 | 25.0 ± 0.2 | 25.1 ± 0.3 | 25.8 ± 0.3 | 25.6 ± 0.2 | 24.9 ± 0.1 |
| WC (cm) *,† | 91.4 ± 2.7 | 90.1 ± 0.7 | 89.3 ± 0.6 | 88.1 ± 0.5 | 85.6 ± 0.8 | 86.7 ± 0.7 | 85.8 ± 0.6 | 83.8 ± 0.4 |
| SBP (mmHg) *,† | 131.8 ± 2.5 | 128.4 ± 1.6 | 124.9 ± 0.9 | 123.0 ± 0.7 | 124.9 ± 3.0 | 127.7 ± 1.0 | 128.5 ± 0.8 | 125.7 ± 0.7 |
| DBP (mmHg) *,† | 84.5 ± 1.5 | 83.3 ± 0.9 | 79.5 ± 0.6 | 77.0 ± 0.5 | 76.5 ± 1.7 | 79.6 ± 0.6 | 75.8 ± 0.5 | 74.5 ± 0.4 |
| FPG (mg/dL) † | 107.2 ± 3.4 | 112.2 ± 2.7 | 115.0 ± 2.1 | 111.9 ± 1.4 | 111.3 ± 5.2 | 109.6 ± 2.0 | 110.0 ± 1.8 | 107.9 ± 1.1 |
| Monthly household income *,† | 2650 ± 318 | 3647 ± 825 | 4737 ± 709 | 3851 ± 181 | 1814 ± 178 | 3732 ± 104.4 | 3520 ± 425 | 3005 ± 141 |
| Occupation (%) | ||||||||
| Office worker *,† | 35.7 ± 10.3 | 32.0 ± 4.3 | 20.5 ± 2.7 | 24.7 ± 2.5 | 2.4 ± 0.2 | 4.5 ± 2.0 | 3.7 ± 1.0 | 6.6 ± 1.0 |
| Manual worker *,† | 45.0 ± 7.6 | 32.3 ± 4.1 | 46.2 ± 3.4 | 42.3 ± 2.8 | 27.2 ± 4.4 | 25.1 ± 3.0 | 26.5 ± 2.2 | 29.7 ± 1.8 |
| Other† | 19.3 ± 7.4 | 35.7 ± 4.1 | 33.3 ± 3.1 | 33.0 ± 2.7 | 70.4 ± 4.4 | 70.4 ± 3.2 | 70.0 ± 2.2 | 63.7 ± 1.9 |
| Education duration (%) | ||||||||
| <6 years† | 21.4 ± 6.3 | 13.9 ± 2.7 | 22.0 ± 2.8 | 18.7 ± 2.1 | 63.0 ± 6.7 | 57.0 ± 3.5 | 60.1 ± 2.5 | 51.8 ± 2.1 |
| 6–8 years *,† | 11.2 ± 4.6 | 20.6 ± 4.0 | 19.6 ± 2.6 | 14.9 ± 2.0 | 10.4 ± 4.7 | 15.8 ± 2.7 | 14.2 ± 1.7 | 15.0 ± 1.5 |
| 9–11 years † | 48.4 ± 8.9 | 27.5 ± 3.9 | 32.9 ± 3.3 | 34.5 ± 2.9 | 17.0 ± 3.2 | 18.4 ± 2.5 | 20.1 ± 2.1 | 22.4 ± 1.6 |
| ≥12 years † | 18.9 ± 7.8 | 37.9 ± 5.2 | 25.4 ± 2.8 | 31.9 ± 2.8 | 9.6 ± 4.2 | 8.8 ± 2.5 | 5.7 ± 1.1 | 10.9 ± 1.3 |
| Without lipid-lowering medication | ||||||||
| Men | Women | |||||||
| KNHANES Phase | III | IV | V | VI | III | IV | V | VI |
| N (%) | 11391 (99.0) | 6730 (97.5) | 6869 (94.8) | 6123 (93.3) | 13074 (96.3) | 9105 (93.1) | 9308 (93.1) | 8087 (90.1) |
| Age (years) *,† | 42.7 ± 0.4 | 43.5 ± 0.3 | 44.2 ± 0.3 | 44.9 ± 0.3 | 44.3 ± 0.4 | 45.4 ± 0.3 | 45.9 ± 0.3 | 46.3 ± 0.3 |
| BMI (kg/m²) * | 23.9 ± 0.1 | 24.0 ± 0.1 | 24.1 ± 0.1 | 24.3 ± 0.0 | 23.3 ± 0.1 | 23.2 ± 0.0 | 23.2 ± 0.1 | 23.1 ± 0.0 |
| WC (cm) *,† | 83.6 ± 0.3 | 84.2 ± 0.2 | 84.0 ± 0.2 | 84.7 ± 0.1 | 77.9 ± 0.3 | 78.3 ± 0.2 | 77.6 ± 0.2 | 77.4 ± 0.2 |
| SBP (mmHg) | 121.0 ± 0.4 | 119.0 ± 0.3 | 120.6 ± 0.3 | 119.1 ± 0.2 | 114.7 ± 0.5 | 113.4 ± 0.3 | 115.4 ± 0.3 | 113.4 ± 0.3 |
| DBP (mmHg) *,† | 80.2 ± 0.4 | 79.5 ± 0.2 | 79.4 ± 0.2 | 77.8 ± 0.2 | 74.1 ± 0.3 | 73.5 ± 0.2 | 73.7 ± 0.1 | 72.4 ± 0.2 |
| FPG (mg/dL) *,† | 95.2 ± 0.5 | 97.1 ± 0.4 | 97.9 ± 0.3 | 100.4 ± 0.3 | 92.1 ± 0.5 | 94.1 ± 0.3 | 94.1 ± 0.3 | 95.9 ± 0.3 |
| Monthly household income *,† | 2442 ± 58 | 3108 ± 86 | 4703 ± 186 | 3961 ± 66 | 2374 ± 64 | 2914 ± 74 | 4404 ± 136 | 3769 ± 62 |
| Occupation (%) | ||||||||
| Office worker *,† | 24.5 ± 1.3 | 28.1 ± 0.8 | 29.5 ± 0.8 | 31.4 ± 0.9 | 15.1 ± 1.0 | 17.3 ± 0.6 | 19.9 ± 0.6 | 22.9 ± 0.6 |
| Manual worker * | 52.1 ± 1.5 | 48.5 ± 0.9 | 50.0 ± 0.9 | 45.3 ± 0.9 | 30.6 ± 1.2 | 28.7 ± 0.7 | 32.8 ± 0.7 | 29.2 ± 0.7 |
| Other † | 23.4 ± 1.2 | 23.4 ± 0.8 | 20.4 ± 0.7 | 23.4 ± 0.7 | 54.4 ± 1.3 | 53.9 ± 0.8 | 47.3 ± 0.7 | 47.9 ± 0.7 |
| Education duration (%) | ||||||||
| <6 years *,† | 11.8 ± 0.7 | 13.2 ± 0.6 | 11.6 ± 0.5 | 11.0 ± 0.5 | 26.0 ± 1.2 | 25.9 ± 0.8 | 23.6 ± 0.7 | 19.5 ± 0.7 |
| 6–8 years *,† | 9.8 ± 0.7 | 10.3 ± 0.5 | 10.0 ± 0.5 | 8.4 ± 0.4 | 11.0 ± 0.7 | 10.4 ± 0.4 | 9.8 ± 0.4 | 9.1 ± 0.4 |
| 9–11 years *,† | 43.3 ± 1.5 | 41.4 ± 1.0 | 41.2 ± 0.8 | 40.2 ± 0.9 | 38.1 ± 1.2 | 37.7 ± 0.8 | 35.8 ± 0.7 | 35.6 ± 0.7 |
| ≥12 years † | 35.1 ± 1.5 | 35.1 ± 1.0 | 37.2 ± 0.9 | 40.4 ± 0.9 | 24.9 ± 1.4 | 26.0 ± 0.8 | 30.7 ± 0.8 | 35.8 ± 0.8 |
| KNHANES Phase | Men | Women | ||||||
|---|---|---|---|---|---|---|---|---|
| III | IV | V | VI | III | IV | V | VI | |
| TC (mg/dL) | ||||||||
| Age-adjusted **‡ | 183.4 ± 0.9 | 185.5 ± 0.6 | 187.5 ± 0.6 | 187.7 ± 0.5 | 184.3 ± 0.7 | 187.7 ± 0.5 | 188.7 ± 0.5 | 187.9 ± 0.5 |
| 20–29 years ‡ | 173.3 ± 2.3 | 171.8 ± 1.4 | 174.6 ± 1.6 | 174.4 ± 1.2 | 165.4 ± 1.7 | 170.2 ± 1.2 | 170.5 ± 1.1 | 173.7 ± 1.0 |
| 30–39 years **‡ | 183.3 ± 1.7 | 188.0 ± 1.0 | 192.7 ± 1.1 | 193.6 ± 1.3 | 172.8 ± 1.4 | 175.7 ± 0.8 | 179.8 ± 1.0 | 180.1 ± 0.8 |
| 40–49 years ‡ | 191.7 ± 1.8 | 194.8 ± 1.2 | 194.1 ± 1.1 | 197.1 ± 1.1 | 183.3 ± 1.4 | 185.4 ± 0.8 | 189.0 ± 1.0 | 189.1 ± 0.9 |
| 50–59 years | 187.3 ± 1.8 | 189.6 ± 1.3 | 193.2 ± 1.3 | 191.2 ± 1.1 | 200.4 ± 2.0 | 203.6 ± 1.3 | 205.1 ± 1.1 | 202.2 ± 0.9 |
| 60+ years ‡ | 183.1 ± 1.8 | 183.5 ± 1.1 | 182.9 ± 0.9 | 181.8 ± 0.9 | 200.2 ± 1.5 | 203.6 ± 1.1 | 198.9 ± 0.8 | 195.4 ± 0.9 |
| HDL-C (mg/dL) | ||||||||
| Age-adjusted **‡ | 42.4 ± 0.3 | 45.5 ± 0.2 | 46.9 ± 0.2 | 47.6 ± 0.2 | 47.3 ± 0.3 | 50.7 ± 0.2 | 52.7 ± 0.2 | 54.8 ± 0.2 |
| 20–29 years ‡ | 44.5 ± 0.7 | 47.5 ± 0.4 | 48.7 ± 0.5 | 50.2 ± 0.4 | 49.7 ± 0.6 | 55.0 ± 0.4 | 56.2 ± 0.5 | 58.5 ± 0.4 |
| 30–39 years ‡ | 41.7 ± 0.4 | 44.7 ± 0.3 | 46.9 ± 0.4 | 47.4 ± 0.4 | 48.5 ± 0.5 | 51.7 ± 0.3 | 54.7 ± 0.4 | 56.6 ± 0.4 |
| 40–49 years ‡ | 42.0 ± 0.5 | 45.6 ± 0.4 | 46.0 ± 0.3 | 46.9 ± 0.4 | 47.3 ± 0.5 | 50.5 ± 0.3 | 52.4 ± 0.3 | 55.2 ± 0.3 |
| 50–59 years ‡ | 40.8 ± 0.6 | 45.1 ± 0.3 | 46.4 ± 0.4 | 46.7 ± 0.3 | 46.7 ± 0.6 | 49.9 ± 0.3 | 51.8 ± 0.3 | 53.8 ± 0.3 |
| 60+ years ‡ | 43.1 ± 0.6 | 44.6 ± 0.3 | 46.5 ± 0.3 | 46.7 ± 0.3 | 44.5 ± 0.4 | 46.5 ± 0.3 | 48.5 ± 0.3 | 50.0 ± 0.3 |
| TG (mg/dL) | ||||||||
| Age-adjusted **‡ | 155.7 ± 3.6 | 152.9 ± 1.7 | 154.4 ± 2.0 | 163.5 ± 2.0 | 113.4 ± 1.5 | 113.6 ± 1.1 | 111.6 ± 1.2 | 109.3 ± 1.0 |
| 20–29 years | 113.6 ± 5.5 | 120.3 ± 2.9 | 117.0 ± 4.3 | 120.5 ± 3.8 | 85.1 ± 2.6 | 84.1 ± 2.2 | 81.8 ± 1.8 | 81.4 ± 2.0 |
| 30–39 years | 158.6 ± 8.2 | 156.3 ± 3.4 | 156.3 ± 4.0 | 176.2 ± 5.2 | 93.2 ± 2.3 | 94.1 ± 1.8 | 94.7 ± 2.2 | 94.7 ± 2.2 |
| 40–49 years | 183.9 ± 8.6 | 177.4 ± 4.3 | 176.1 ± 4.9 | 150.2 ± 1.1 | 111.1 ± 3.4 | 109.7 ± 1.8 | 112.1 ± 4.1 | 106.2 ± 1.9 |
| 50–59 years | 183.7 ± 9.2 | 166.8 ± 4.3 | 182.1 ± 5.2 | 179.1 ± 4.8 | 135.1 ± 5.5 | 131.7 ± 2.6 | 128.8 ± 2.4 | 129.0 ± 2.6 |
| 60+ years ‡ | 140.6 ± 5.0 | 143.9 ± 2.7 | 142.2 ± 2.5 | 146.7 ± 2.9 | 143.5 ± 3.6 | 148.7 ± 2.4 | 140.4 ± 1.8 | 136.0 ± 1.8 |
| Non-HDL-C (mg/dL) | ||||||||
| Age-adjusted ‡ | 141.1 ± 0.8 | 140.0 ± 0.6 | 140.6 ± 0.6 | 140.0 ± 0.5 | 137.0 ± 0.7 | 136.9 ± 0.5 | 136.0 ± 0.4 | 133.1 ± 0.4 |
| 20–29 years | 128.9 ± 2.2 | 124.3 ± 1.4 | 125.9 ± 1.6 | 124.3 ± 1.3 | 115.7 ± 1.5 | 115.2 ± 1.1 | 114.3 ± 1.0 | 115.2 ± 1.0 |
| 30–39 years | 141.6 ± 1.6 | 143.3 ± 1.0 | 145.8 ± 1.2 | 146.1 ± 1.3 | 124.3 ± 1.2 | 124.0 ± 0.8 | 125.2 ± 0.9 | 123.5 ± 0.8 |
| 40–49 years | 149.7 ± 1.7 | 149.2 ± 1.2 | 148.1 ± 1.1 | 150.2 ± 1.1 | 135.9 ± 1.2 | 134.8 ± 0.8 | 136.6 ± 1.0 | 133.9 ± 0.9 |
| 50–59 years ‡ | 146.5 ± 1.8 | 144.5 ± 1.3 | 146.8 ± 1.3 | 144.5 ± 1.2 | 153.6 ± 1.9 | 153.8 ± 1.2 | 153.3 ± 1.0 | 148.4 ± 0.9 |
| 60+ years **‡ | 140.0 ± 1.8 | 139.0 ± 1.1 | 136.4 ± 0.8 | 135.2 ± 0.9 | 155.7 ± 1.5 | 157.1 ± 1.1 | 150.4 ± 0.8 | 145.4 ± 0.9 |
| KNHANES Phase | III | IV | V | VI | P value | β-coefficient | P for Trend |
|---|---|---|---|---|---|---|---|
| Men | |||||||
| With use of lipid-lowering medication | |||||||
| TC (mg/dL) | 195.7 ± 3.0 | 185.7 ± 0.1 | 183.2 ± 0.1 | 174.6 ± 0.1 | <0.001 | −6.260 | <0.001 |
| TG (mg/dL) | 240.4 ± 18.5 | 209.5 ± 0.6 | 220.6 ± 0.8 | 213.0 ± 1.0 | <0.001 | −2.173 | 0.558 |
| HDL-C (mg/dL) | 38.2 ± 0.6 | 43.6 ± 0.0 | 44.0 ± 0.0 | 45.4 ± 0.0 | <0.001 | 1.431 | <0.001 |
| Non-HDL-C (mg/dL) | 157.5 ± 3.1 | 142.1 ± 0.1 | 139.2 ± 0.1 | 129.1 ± 0.1 | <0.001 | −7.691 | <0.001 |
| Without use of lipid-lowering medication | |||||||
| TC (mg/dL) | 183.6 ± 0.9 | 185.8 ± 0.6 | 188.2 ± 0.6 | 188.9 ± 0.5 | <0.001 | 1.735 | <0.001 |
| TG (mg/dL) | 155.0 ± 3.6 | 152.3 ± 1.6 | 153.2 ± 2.1 | 162.8 ± 2.1 | 0.004 | 3.446 | 0.004 |
| HDL-C (mg/dL) | 42.4 ± 0.3 | 45.5 ± 0.2 | 46.9 ± 0.2 | 47.6 ± 0.2 | <0.001 | 1.451 | <0.001 |
| Non-HDL-C (mg/dL) | 141.2 ± 0.8 | 140.3 ± 0.6 | 141.3 ± 0.6 | 141.3 ± 0.5 | ns | 0.282 | ns |
| Women | |||||||
| With use of lipid-lowering medication | |||||||
| TC (mg/dL) | 195.2 ± 2.4 | 184.9 ± 0.0 | 175.4 ± 0.0 | 172.0 ± 0.0 | <0.001 | −6.331 | <0.001 |
| TG (mg/dL) | 172.6 ± 7.7 | 153.2 ± 0.0 | 139.3 ± 0.1 | 136.0 ± 0.1 | <0.001 | −8.775 | <0.001 |
| HDL-C (mg/dL) | 46.1 ± 1.2 | 50.9 ± 0.0 | 51.8 ± 0.0 | 54.7 ± 0.0 | <0.001 | 2.224 | <0.001 |
| Non-HDL-C (mg/dL) | 149.1 ± 1.8 | 133.9 ± 0.0 | 123.6 ± 0.0 | 117.4 ± 0.0 | <0.001 | −8.555 | <0.001 |
| Without use of lipid-lowering medication | |||||||
| TC (mg/dL) | 184.4 ± 0.7 | 188.1 ± 0.5 | 190.0 ± 0.5 | 190.1 0.5 | <0.001 | 1.593 | <0.001 |
| TG (mg/dL) | 112.9 ± 1.5 | 113.1 ± 1.1 | 111.4 ± 1.1 | 109.2 1.0 | ns | −1.520 | 0.010 |
| HDL-C (mg/dL) | 47.3 ± 0.2 | 50.7 ± 0.2 | 52.7 ± 0.2 | 54.8 0.2 | <0.001 | 2.300 | <0.001 |
| Non-HDL-C (mg/dL) | 137.1 ± 0.7 | 137.4 ± 0.5 | 137.3 ± 0.4 | 135.3 0.4 | 0.012 | −0.708 | 0.006 |
© 2019 by the authors. Licensee MDPI, Basel, Switzerland. This article is an open access article distributed under the terms and conditions of the Creative Commons Attribution (CC BY) license (http://creativecommons.org/licenses/by/4.0/).
Share and Cite
Kwon, Y.-J.; Lee, J.-W.; Kang, H.-T. Secular Trends in Lipid Profiles in Korean Adults Based on the 2005–2015 KNHANES. Int. J. Environ. Res. Public Health 2019, 16, 2555. https://doi.org/10.3390/ijerph16142555
Kwon Y-J, Lee J-W, Kang H-T. Secular Trends in Lipid Profiles in Korean Adults Based on the 2005–2015 KNHANES. International Journal of Environmental Research and Public Health. 2019; 16(14):2555. https://doi.org/10.3390/ijerph16142555
Chicago/Turabian StyleKwon, Yu-Jin, Jae-Woo Lee, and Hee-Taik Kang. 2019. "Secular Trends in Lipid Profiles in Korean Adults Based on the 2005–2015 KNHANES" International Journal of Environmental Research and Public Health 16, no. 14: 2555. https://doi.org/10.3390/ijerph16142555
APA StyleKwon, Y.-J., Lee, J.-W., & Kang, H.-T. (2019). Secular Trends in Lipid Profiles in Korean Adults Based on the 2005–2015 KNHANES. International Journal of Environmental Research and Public Health, 16(14), 2555. https://doi.org/10.3390/ijerph16142555