Article

Urbanization Impacts the Physicochemical Characteristics and Abundance of Fecal Markers and Bacterial Pathogens in Surface Water

1
Department of Biological Sciences, Xi’an Jiaotong-Liverpool University, Suzhou 215123, China
2
School of Biological Sciences, University of Canterbury, Christchurch 8140, New Zealand
3
Nanjing Institute of Geography and Limnology, Chinese Academy of Sciences, Nanjing 210008, China
4
Futurepolis LLC, Suzhou 215021, China
5
Institute of Integrative Biology, University of Liverpool, Liverpool L69 3BX, UK
6
Department of Health and Environmental Sciences, Xi’an Jiaotong-Liverpool University, Suzhou 215123, China
7
Microbiology Research Group, Institute of Integrative Biology, University of Liverpool, Liverpool L69 7ZB, UK
*
Author to whom correspondence should be addressed.
Int. J. Environ. Res. Public Health 2019, 16(10), 1739; https://doi.org/10.3390/ijerph16101739
Submission received: 2 April 2019 / Revised: 29 April 2019 / Accepted: 10 May 2019 / Published: 16 May 2019
(This article belongs to the Special Issue Surface Water Quality for Environment and Health)

Abstract

:
Urbanization is increasing worldwide and is happening at a rapid rate in China in line with economic development. Urbanization can lead to major changes in freshwater environments through multiple chemical and microbial contaminants. We assessed the impact of urbanization on physicochemical characteristics and microbial loading in canals in Suzhou, a city that has experienced rapid urbanization in recent decades. Nine sampling locations covering three urban intensity classes (high, medium and low) in Suzhou were selected for field studies and three locations in Huangshan (natural reserve) were included as pristine control locations. Water samples were collected for physicochemical, microbiological and molecular analyses. Compared to medium and low urbanization sites, there were statistically significant higher levels of nutrients and total and thermotolerant coliforms (or fecal coliforms) in highly urbanized locations. The effect of urbanization was also apparent in the abundances of human-associated fecal markers and bacterial pathogens in water samples from highly urbanized locations. These results correlated well with land use types and anthropogenic activities at the sampling sites. The overall results indicate that urbanization negatively impacts water quality, providing high levels of nutrients and a microbial load that includes fecal markers and pathogens.

1. Introduction

Urbanization is occurring globally and increasing at an extremely rapid rate in most developing countries, particularly in Asia and Africa [1]. Currently, approximately 55% of the world’s population lives in urban areas, which is projected to increase to 68% by 2050 [1]. The increase in urbanization is expected to be especially apparent in three countries—India, China and Nigeria, which will together account for 35% of the total increase in urban global population. In China, at the end of 2017, 58.5% of the population lived in urban areas [2] and it has been estimated that by 2030, the middle-class population resident in the cities could be up to one billion, corresponding to 70% of China’s projected total population [3]. Although rapid urbanization has created wealth and improved social conditions and human well-being [4], it has also created many problems, such as pressure on resource scarcity and environmental pollution [5,6]. Overcoming the negative environmental impacts of rapid urbanization is becoming one of the major themes of environmental studies in China, particularly water pollution [7].
Freshwater ecosystems are affected by both non-point and point source pollution, which leads to eutrophication, excessive algal growth, and chemical and microbial contaminations [8]. The decline in water quality has been a major problem in China in the past few decades despite significant progress having been made to protect surface water quality [9]. Notable pollutants in China include industrial effluent, domestic sewage and agricultural run-off [10]. Urbanization has been reported to affect the water quality of city rivers with excess nutrients, endocrine disrupting chemicals, heavy metals, antibiotics and steroid hormones [11], particularly in developed regions and large cities with increased human activity [12]. Urbanization density has the potential for predicting water quality [13] and urbanization has been positively related to multiple nutrients (total nitrogen and total phosphorus) and indicator bacteria (thermotolerant coliforms) [14]. In Beijing—the capital of China—landscape characteristics are significantly correlated with water quality in watersheds with high urban intensification [15], and rapid urbanization with intense land use, land cover change and population growth have a great impact on physicochemical variables [16]. Combined, these pressures threaten the safety of drinking water supplies and sustainability in the region [17].
Monitoring of urban waters is required to address the issue of sewage-associated pathogens and to implement remedial actions. Traditionally, culture-based methods such as fecal indicator bacteria (FIB) enumeration were commonly used for monitoring of fecal pollution to address the associated human health risk [18]. However, FIB enumeration to monitor the microbial quality of environmental waters has several limitations. For instance, these bacteria may persist and multiply outside of the host gastrointestinal tract, leading to difficulty in predicting recent fecal contamination in surface waters [19], and the correlation between FIB and pathogen presence is poor [20]. The main limitation with FIB is that it cannot identify the origin or source of fecal contamination [21], which is mandatory to depict the human health risk and implement remedial actions [22]. Therefore, microbial source tracking (MST) techniques have been developed to identify the origin of fecal sources [23]. Lakes, rivers, and canals situated in high population density urban areas provide sites for recreational activities and may pose a significant public health risk due to microbial pathogens found in these waters [24]. Evaluating the occurrence of bacterial pathogens in water bodies, particularly in high urbanization areas, is therefore vital to understand the environmental impact of urbanization [25].
The aim of this study was to assess the physicochemical and microbiological parameters (fecal markers and pathogens) in the Suzhou canals across a gradient of urban intensification. Suzhou is the second largest city in the South-Eastern region of Jiangsu Province of China, and it is a prime example of urbanization with its recent expansion of Suzhou Industrial Park (SIP), Suzhou New District (SND) and Taihu New Town. Established in 514 BC on the network of canals in the Yangtze floodplain, Suzhou has over 2500 years of history with its notable canals which attracts a large number of tourists due to its high cultural and rich historical significance [26,27]. Land use pattern and multiple data analyses were carried out to determine the relationships between physicochemical characteristics, culture-dependent microbiological parameters, an abundance of fecal markers and bacterial pathogens, land use patterns, and urbanization. As far as we are aware, this is the first detailed study to assess the impact of urbanization in this region using canals as a model system. These results will be useful for evaluating the effect of urbanization on the environment and public health, and for future urban development and pollution management. We hypothesized that urban intensification is positively related to eutrophication and microbial contaminations in urban surface water bodies, and this poses potential health risks to local residents.

2. Materials and Methods

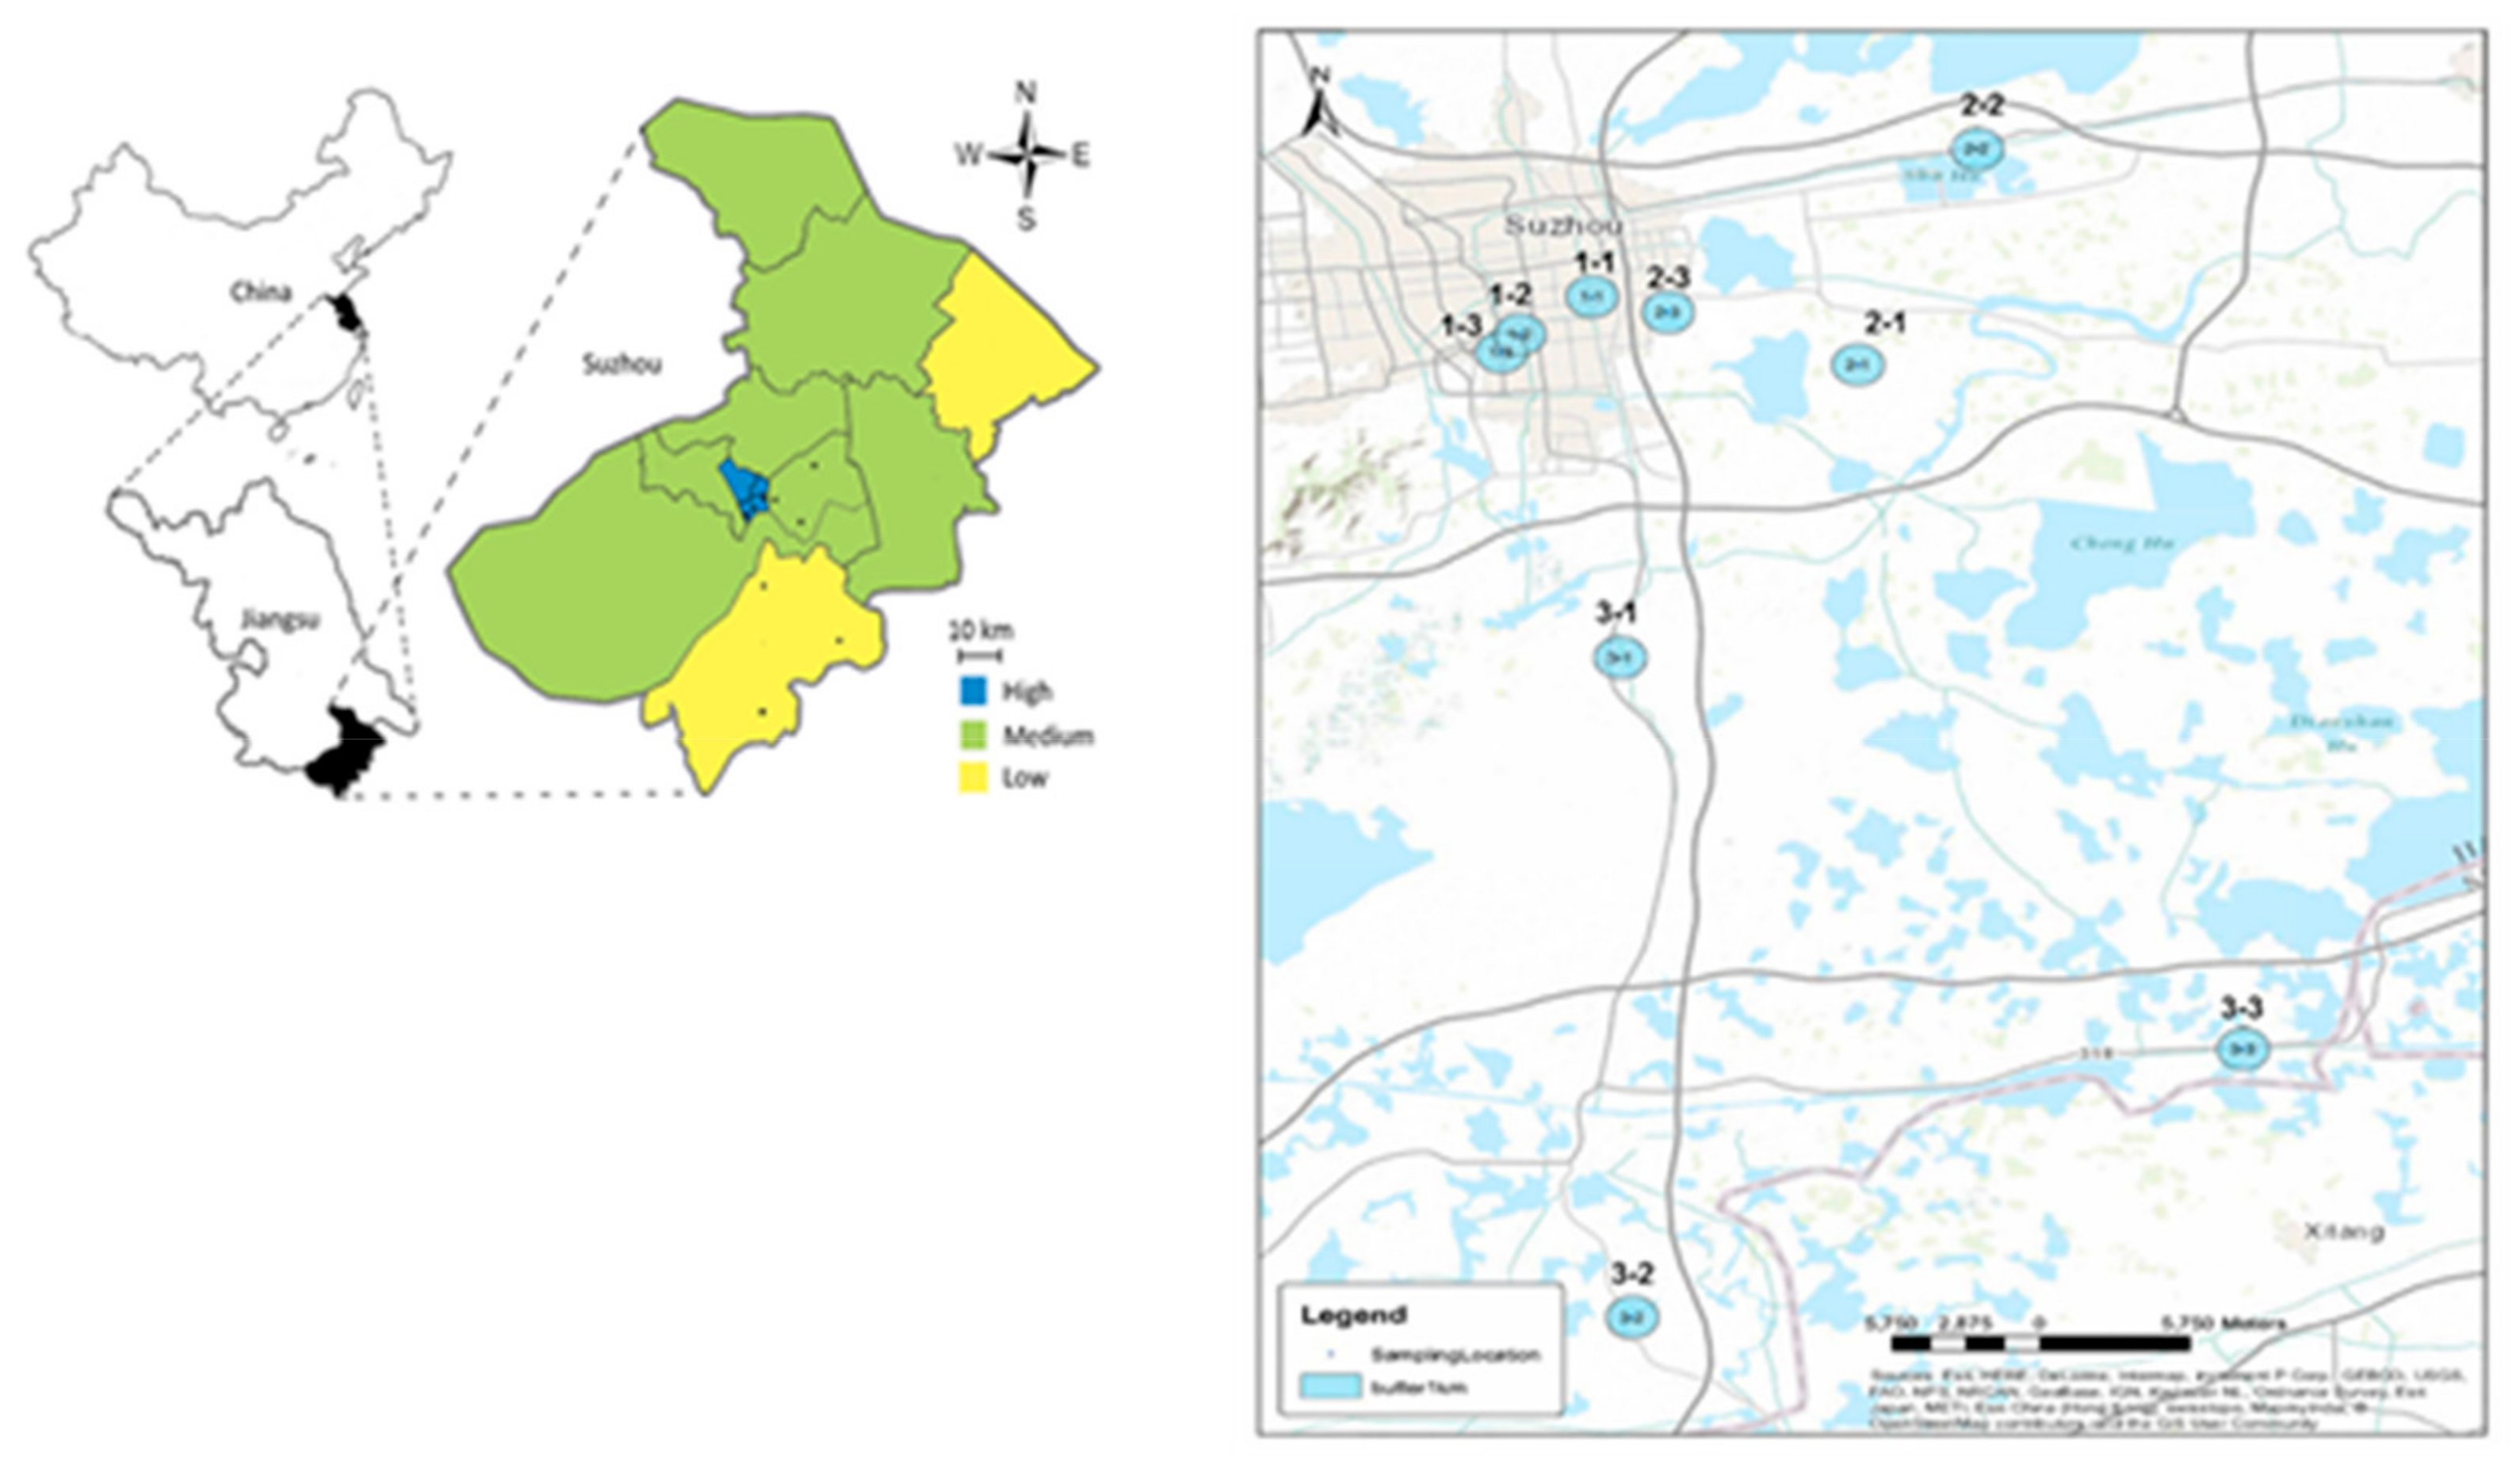
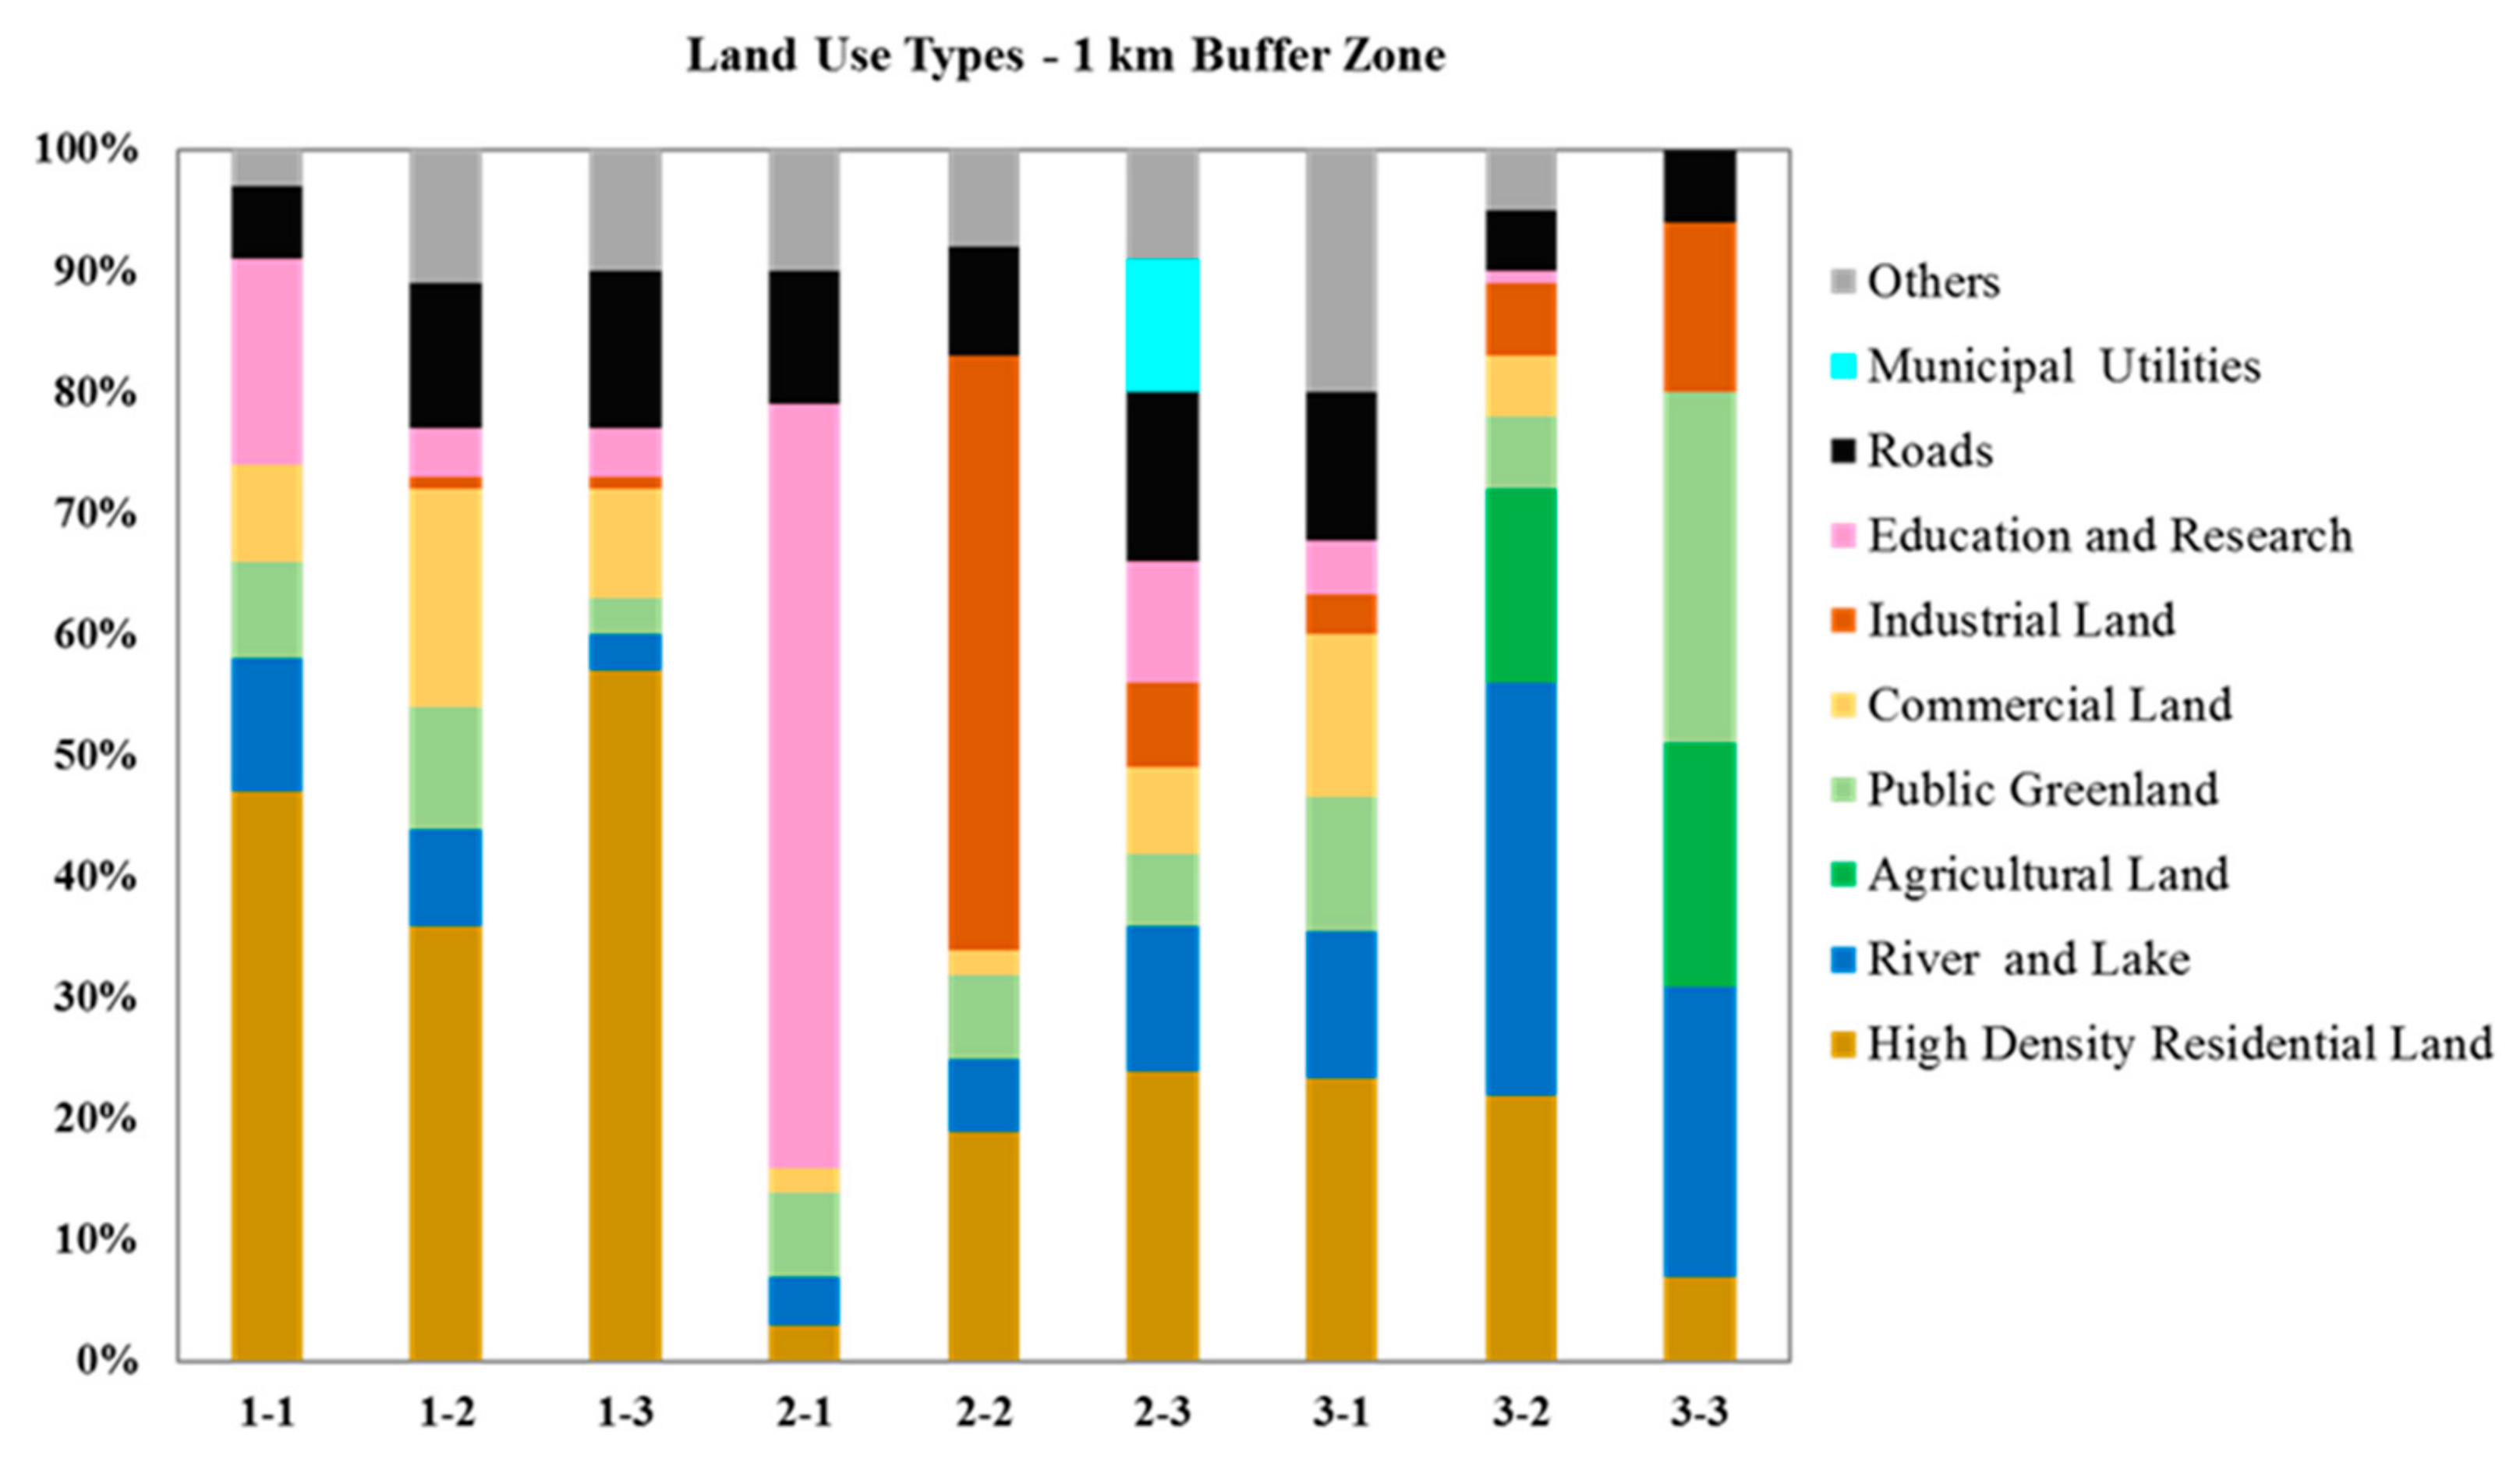
2.1. Study Locations

All sampling was conducted in or around the outskirts of Suzhou, and nine locations with three urban intensities (High, Medium and Low; Figure 1) were selected for the study. The urban intensity classification was based on population density/km2 for each category: >8000, 1700–2100 and 800–1100 persons/km2, respectively. Field sampling was carried out on four occasions in the winter and summer of 2016. In summer 2016, three sampling locations in the Huangshan area were selected as controls for this project. Huangshan is a natural reserve in a mountain region (approximately 500 km west of Suzhou), where population density, urban intensification and human activity are low compared to Suzhou, and the waterways in Huangshan area are protected by the local government. Both Huangshan and Suzhou have a subtropical monsoon climate (annual average temperature and rainfall ranges from 13 to 20 °C, and 800 to 1600 mm, respectively) with similar weather conditions further supporting their selection as appropriate control sites. Climatic data, including temperature and precipitation in Suzhou for 2015 and 2016 (Figure S1), were gathered from annual reports published by the local government [28,29] to explore the relationship with other water quality parameters observed in this study. The details of the sampling locations, including the geographic coordinates and land use patterns, are provided in Table S1.
Land use maps were prepared using ArcGIS 10.2 (Environmental Systems Research Institute, Inc. (ESRI), Redlands, CA, USA). On the basis of the Open Street Map of Suzhou city, two layers of buffer zones were created with radii of 500 m and 1000 m respectively around all sample points. By referencing the official land use maps of Gusu District, Suzhou Industrial Park District and Wujiang District of Suzhou as well as Google maps covering the sample areas, detailed land use types were digitized within these buffer zones in accordance with the national Code for classification of urban land use and planning standards of development land (GB50137-200), and the land use composition within the areas of buffer zones calculated (Figure 2). The specific explanation of each land use classification is provided in Table S2.

2.2. Field Sampling

Five liters of water were collected from each sampling location in sterile polypropylene containers. Parameters including water temperature and conductivity were measured in the field using a thermometer and an EC/TDS/TEMP WATERPROOF COMBO METER (COM-100) (HM Digital Inc. Culver City, CA, USA), respectively. The samples were transported to the laboratory for nutrients, microbiological and molecular analyses and processed within 8 h of sample collection. Samples which were used for nutrients and microbiological analyses were kept on ice until they were brought to the laboratory. Sampling was carried out at four time points in Suzhou, covering winter and summer to assess the impact of urbanization and seasonal variation on these parameters. In summer 2016, additional sampling was conducted in the Huangshan area to provide a control dataset. For each season, field sampling was conducted twice to ensure the veracity of water quality characteristics, and the samples were collected 6 weeks apart in a season. Water samples (500 mL for each) were filtered through 0.22 μm polycarbonate membrane filters (Millipore, UK) in triplicate to collect microorganisms for DNA extraction, and the filters were stored at −20 °C prior to extraction.

2.3. Physicochemical Analyses

Water temperature (WT), pH, conductivity (EC), total nitrogen (TN), total phosphorous (TP), nitrate nitrogen (NO3-N), nitrite nitrogen (NO2-N), ammonium nitrogen (NH4-N), phosphate (PO4-P), total organic carbon (TOC) and chlorophyll a were measured.
pH was measured using a Eutech pH 700 instrument (Thermo Fisher Scientific Inc., Waltham, MA, USA). TN and TP were measured by peroxodisulphate oxidation and spectrophotometric methods. NO3-N, NO2-N, NH4-N, and PO4-P were determined using a continuous flow analyzer (Skalar SA 1000, Breda, The Netherlands) [30]. TOC was measured with a Shimadzu analyzer (model 5000; Tokyo, Japan) by high-temperature oxidation. Chlorophyll a was measured as in suspended algae biomass in water samples based on the procedures of water and wastewater analysis used by the American Public Health Association [31].

2.4. Microbiological Analyses

2.4.1. Culture-Dependent Methods

A total viable count (TVC) was carried out using plate count agar (PCA) [32]. Serial dilutions were made for collected water samples and 50 μL samples were plated on PCA plates in triplicate and incubated at 30 °C for 48 h. The colonies were counted to determine the average number of colony forming units (CFU) per mL.
Total coliforms (TC) in water samples were determined by the pour plate method [33]. For this, 100 or 200 μL samples of serial dilutions were plated on HarlequinTM E. coli/coliform medium (LabM, Heywood, UK) plates in triplicate. Plates were incubated at 37 °C for 24 h and the number of Escherichia coli (E. coli) (blue-green colonies) and coliforms (rose-pink colonies) were counted to determine the average number of total colony forming units (CFU) per mL.
Thermotolerant coliform counts (TTC) in water samples were carried out by membrane filtration and pour plate methods. Serial dilutions were made and 2 mL samples filtered through 0.22 μm isoporeTM membrane filters (Merck Millipore Ltd. Tullagreen, Carrigtwohill Co. Cork, Ireland), which were then placed on mFC agar medium (containing 1% rosalic acid) (Difco, Sparks, MD, USA) plates in triplicate. The mFC (membrane fecal coliform) agar medium was formulated by Geldreich et al. to enumerate thermotolerant coliforms/fecal coliforms by membrane filter technique without prior enrichment [34]. Plates were incubated at 44.5 °C for 24 h and the colonies that exhibited blue shades were counted to determine the number of TTC colony forming units (cfu) per mL.

2.4.2. Culture-Independent Methods (qPCR)

Genomic DNA was extracted from membrane filters using the PowerSoil DNA isolation kit (Mo Bio, Carlsbad, CA, USA) according to the manufacturer’s instructions and the filters were cut into pieces and placed into the PowerBead tubes aseptically. The extracted DNA was quantified using NanoDrop ND 2000C spectrophotometer (Thermo Scientific, Marietta, OH, USA), verified by gel electrophoresis and stored at −20 °C until further processing.
Quantitative polymerase chain reaction (qPCR) assays were performed to assess the total, human and avian associated fecal sources. All qPCR reactions were run in triplicate with a final reaction volume of 20 μL. The sequences of the primers and probes along with concentrations are presented in Table S3. The accuracy and efficiency of the standard curves were determined by including a positive control of 103 copies of plasmid standard as unknown in each assay [35]. A seven-point 10-fold serial diluted plasmid DNA with the target sequence was used to generate a standard curve (with a range of 101 to 107 copies/reaction) in each qPCR assay.
Two TaqMan based assays (BacUni and HF183 Taqman) were selected for detection of total and human-associated Bacteroidales, and one SYBR-Green-based assay (GFD) was selected for detection of avian associated fecal markers [36,37,38]. These markers were validated previously for the Taihu watershed region by our research group [39]. Six qPCR assays targeting Enterococcus, Arcobacter butzleri, Shigella sp., Campylobacter jejuni, Salmonella spp. and Shiga toxin producing E. coli (STEC) were selected for this study and all these assays were based on TaqMan chemistry.
TaqMan based qPCR assays (20 μL of master mix) contained 10 μL of Premix Ex TaqTM (Probe qPCR) (Takara Bio Inc.), 0.4 μL of ROX Reference Dye II (Takara Bio Inc.), 2μL of template DNA, 6 μL nuclease-free water and 2 μL of primers and probe set with the final concentrations as shown in Table S3. SYBR Green assays (20 μL of master mix) contained 10 μL of SYBR Green PCR master mix (Thermofisher Technologies, Foster City, CA, USA), 7.0 μL nuclease-free water, 2 μL of template DNA and 1 μL of primer mixture with a final concentration as shown in Table S3.
Plasmid DNA standards were constructed for all the qPCR assays targeting fecal markers and genes of pathogenic bacteria as described previously [39]. For quantification of fecal markers, the target genes were PCR-amplified from respective fecal DNA extracts (human and avian fecal samples) using the primers designed previously (Table S3). For pathogenic bacteria, the target genes were PCR-amplified from respective genomic DNA of target organisms (Salmonella ATCC 14028, Arcobacter butzleri ATCC 49616, Campylobacter jejuni sub sp. jejuni ATCC 29428, Escherichia coli ATCC 35150, Shigella sonnei ATCC 9290 and Enterococcus ATCC 29212) using the primers previously reported (Table S3). The purity and concentration of plasmid DNA were quantified using a NanoDrop ND 2000C UV spectrophotometer, and the gene copy number were calculated as described previously by Oster et al. [35].
In total, 36 water samples collected during four seasons (winter and summer 2015 and 2016) from nine sampling locations of Suzhou canals with three different urban gradients (and three water samples collected from Huangshan as control or pristine area during summer 2016) were investigated to assess the impact of urbanization on the detection frequency and abundance of fecal markers and bacterial pathogens.

2.5. Statistical Analyses

Two-way analyses of variance (ANOVA) were performed to study the variations of all physicochemical and microbiological parameters accordingly to seasons (winter and summer) and urban intensifications (high, medium and low) by using the software IBM SPSS Statistics 20 [40].
All the qPCR assays with R2 values of above 0.95 and efficiencies between 85 and 110% were considered as acceptable for detection and quantification of target markers in environmental samples. The details of the amplification efficiency, the linear range of quantification (R2), the limit of detection (LOD), the limit of quantification (LOQ) and final assessment of qPCR results for each fecal marker and pathogen assays are provided in Table S4. The qPCR results for each assay of fecal markers and pathogens were processed based on LOD in Table S4 as described in previous studies [35,41]. For statistical analysis, the abundance of MST markers and genes of pathogenic bacteria were log transformed and non-detects (NDs) were substituted with 1/2 limit of detection (LOD) as described previously [42].

3. Results

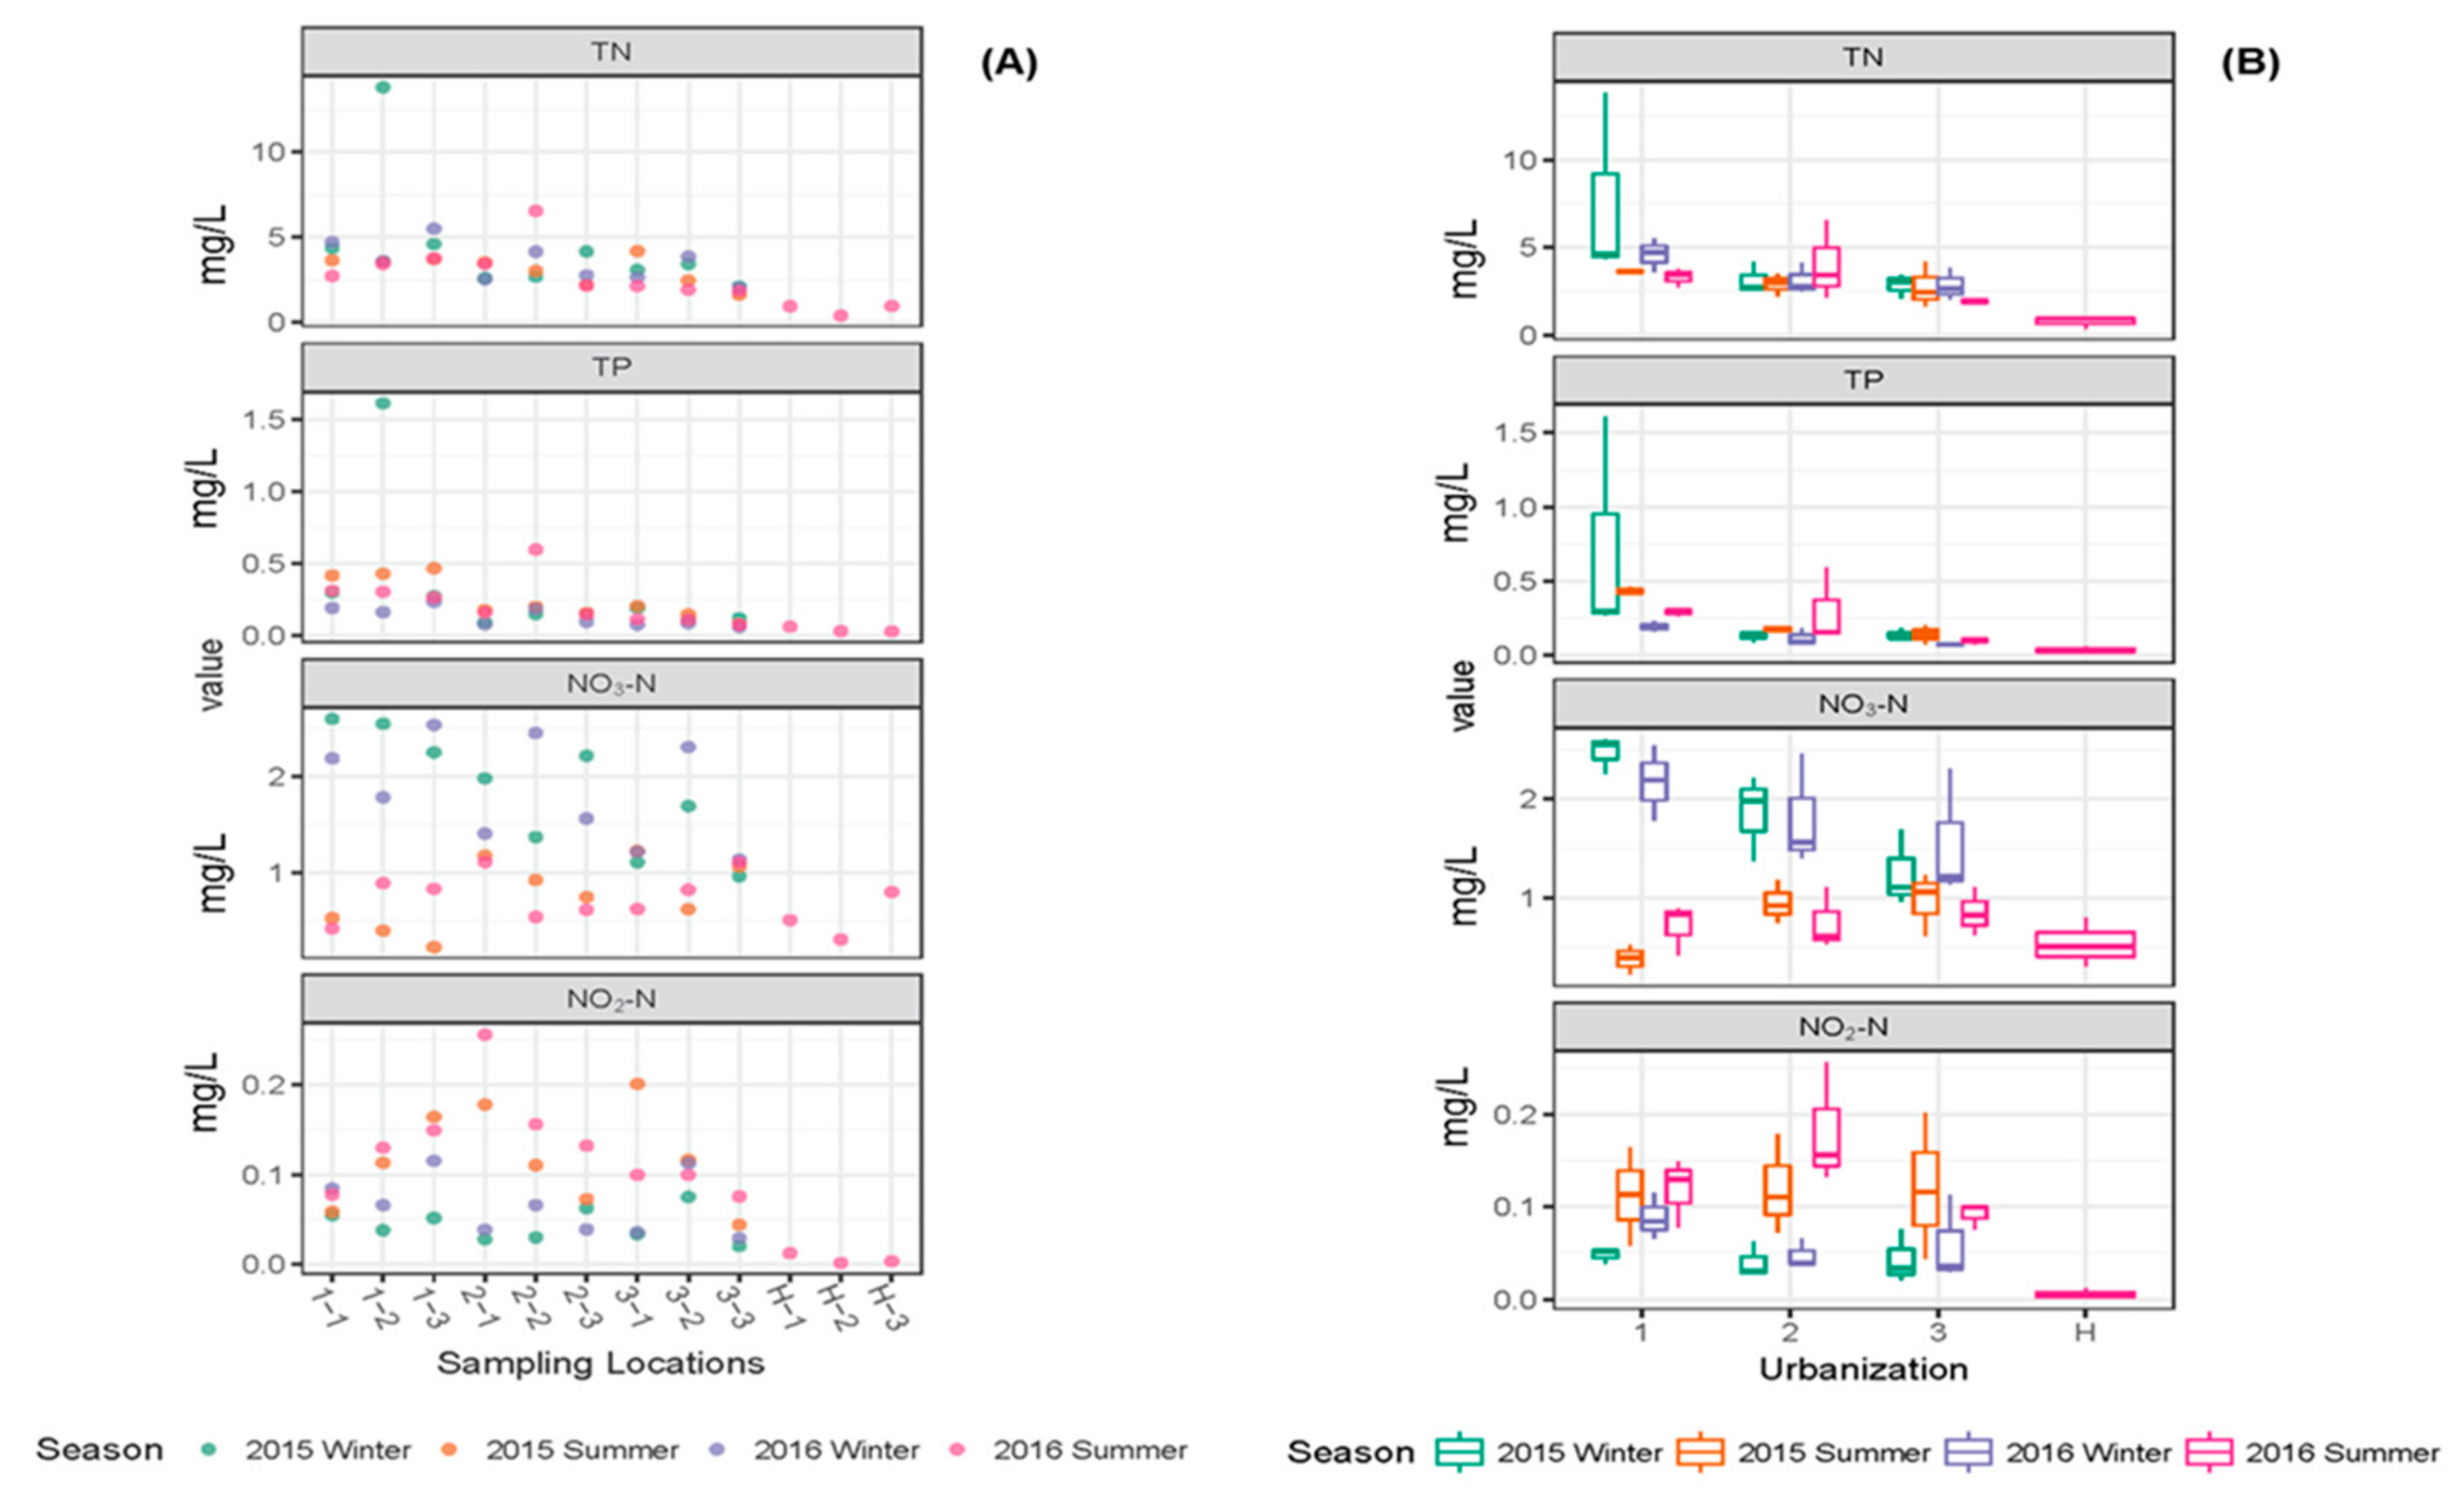
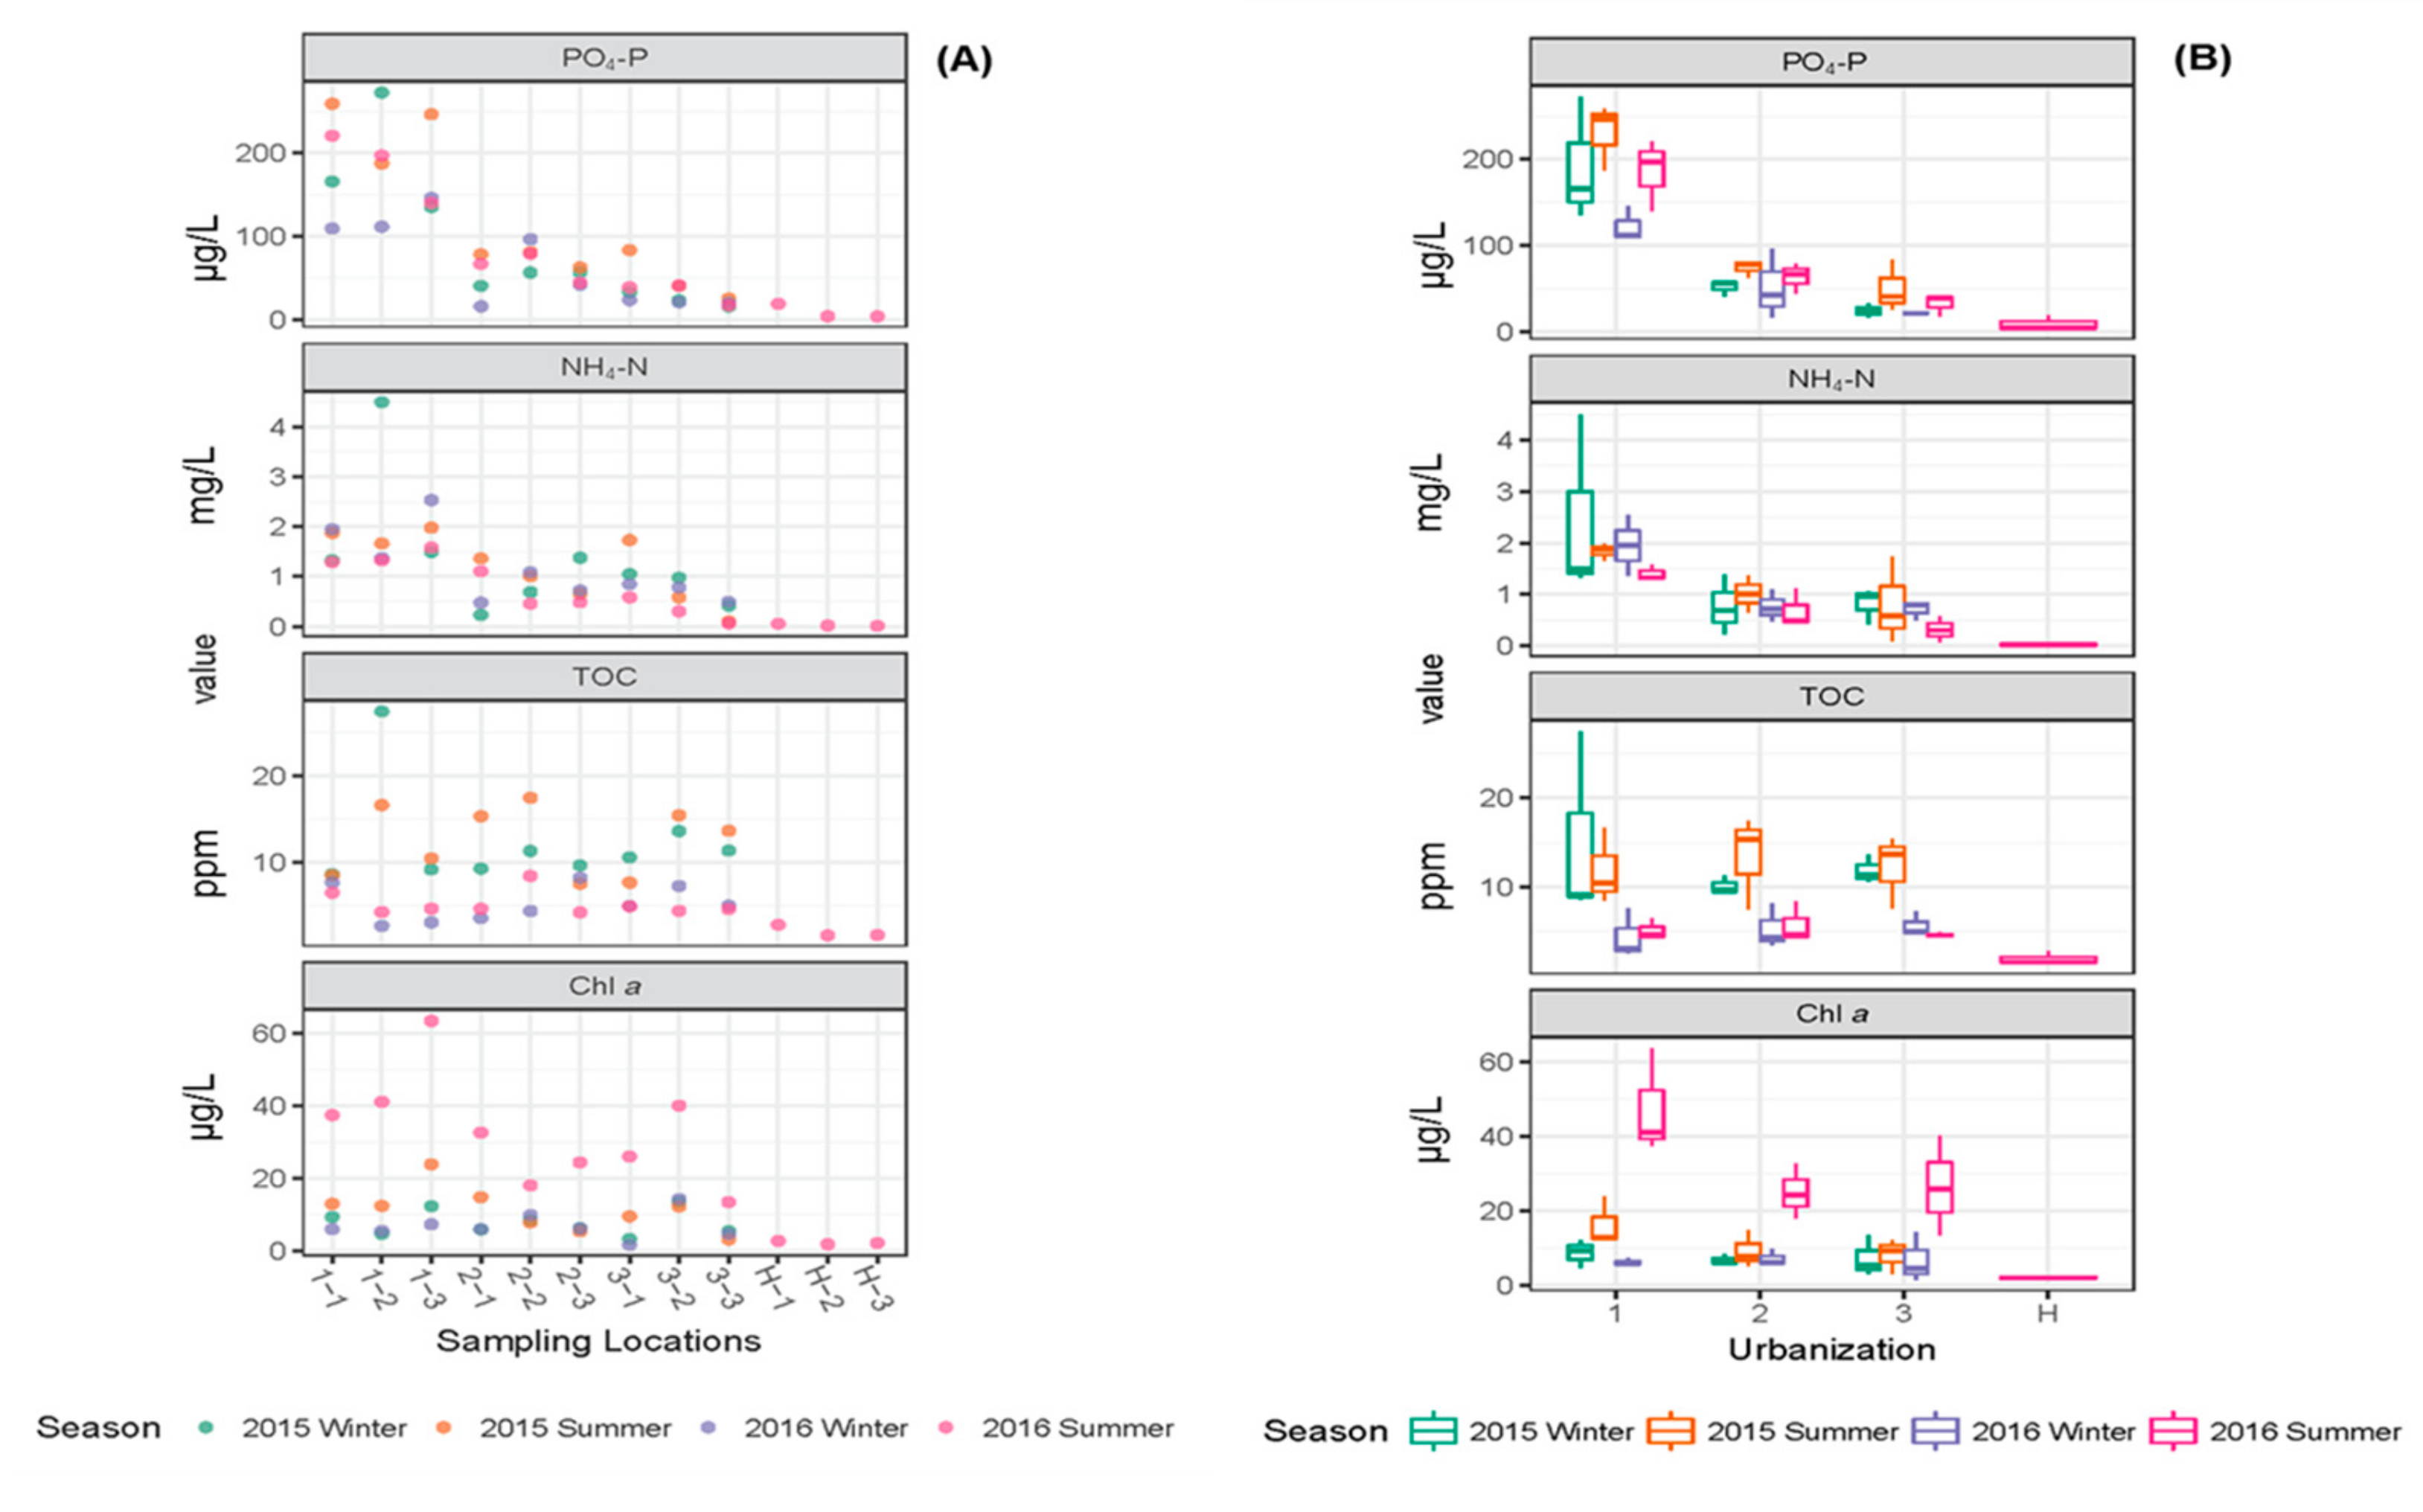
3.1. Variation in Physicochemical Parameters

Water temperature (WT) was higher in summer than in winter (Table 1). The WTs were higher in locations with medium urbanization as compared to high and low. The pH values of the sampling locations ranged from 7–8 (with few exceptions—pH values were 8.71 and 8.16 for samples collected at 3-3 and H-2 collected in summer 2016, respectively) (Table 1). The pH values recorded during field sampling showed significantly lower level among the sampling locations with high (7.1–7.9) urban intensification than medium (7.4–7.9) and low (7.3–8) urban intensification, however, no significant differences between seasons were observed (Table S5). Conductivity values were significantly higher in winter than in summer. The conductivity values were significantly higher in high (393–832 μS/cm) and medium (389–615 μS/cm) than low (186–573 μS/cm) urbanization locations and these values were extremely high as compared to values recorded in samples collected from the natural reserve mountain in Huangshan (45.6–146 µS/cm) (Table 1).
Changes in the nutrients such as TN, TP, NO3-N, NO2-N, PO4-P and NH4-N at different locations and during different seasons are shown in Figure 3 and Figure 4.
The key water quality parameters TN, TP, NH4-N, PO4-P and TOC were extremely high in the second location (1-2) in high urbanization region during winter 2015 (Table 1, Figure 3 and Figure 4). The statistical analysis (Two-way ANOVA) showed that significant variation between locations (urbanization) was observed for the parameters TN, TP, NH4-N and PO4-P (Table S5); among the three urban intensifications (high, medium and low) in Suzhou, the variation in the nutrient values were observed mainly between high vs. medium and high vs. low, and no significant variations in the parameters (except for PO4-P) were observed between medium vs. low (Table S6). In addition to the variation between the sampling locations, TN and PO4-P values showed significant variation between seasons as well. No interaction between season and urbanization was observed based on two-way ANOVA (Table S5). However, the parameters NO3-N, NO2-N and chlorophyll a showed significant variation with respect to season and not the degree of urbanization (Table S5). Chlorophyll a, as an indicator of algal growth in water bodies, was extremely high in location 2-2 in summer 2016 (750 µg/L, omitted from Table and Figure to avoid the influence of this value to the whole dataset). The parameter TOC did not show significant variation either between sampling locations or across seasons (Table S5). As shown in Table 1 and Figure 3 and Figure 4, the nutrient values observed in samples from Huangshan were extremely low as compared to Suzhou canals, indicating good water quality in the absence of any influence from urbanization and other anthropogenic activities.

3.2. Variation in Microbiological Parameters

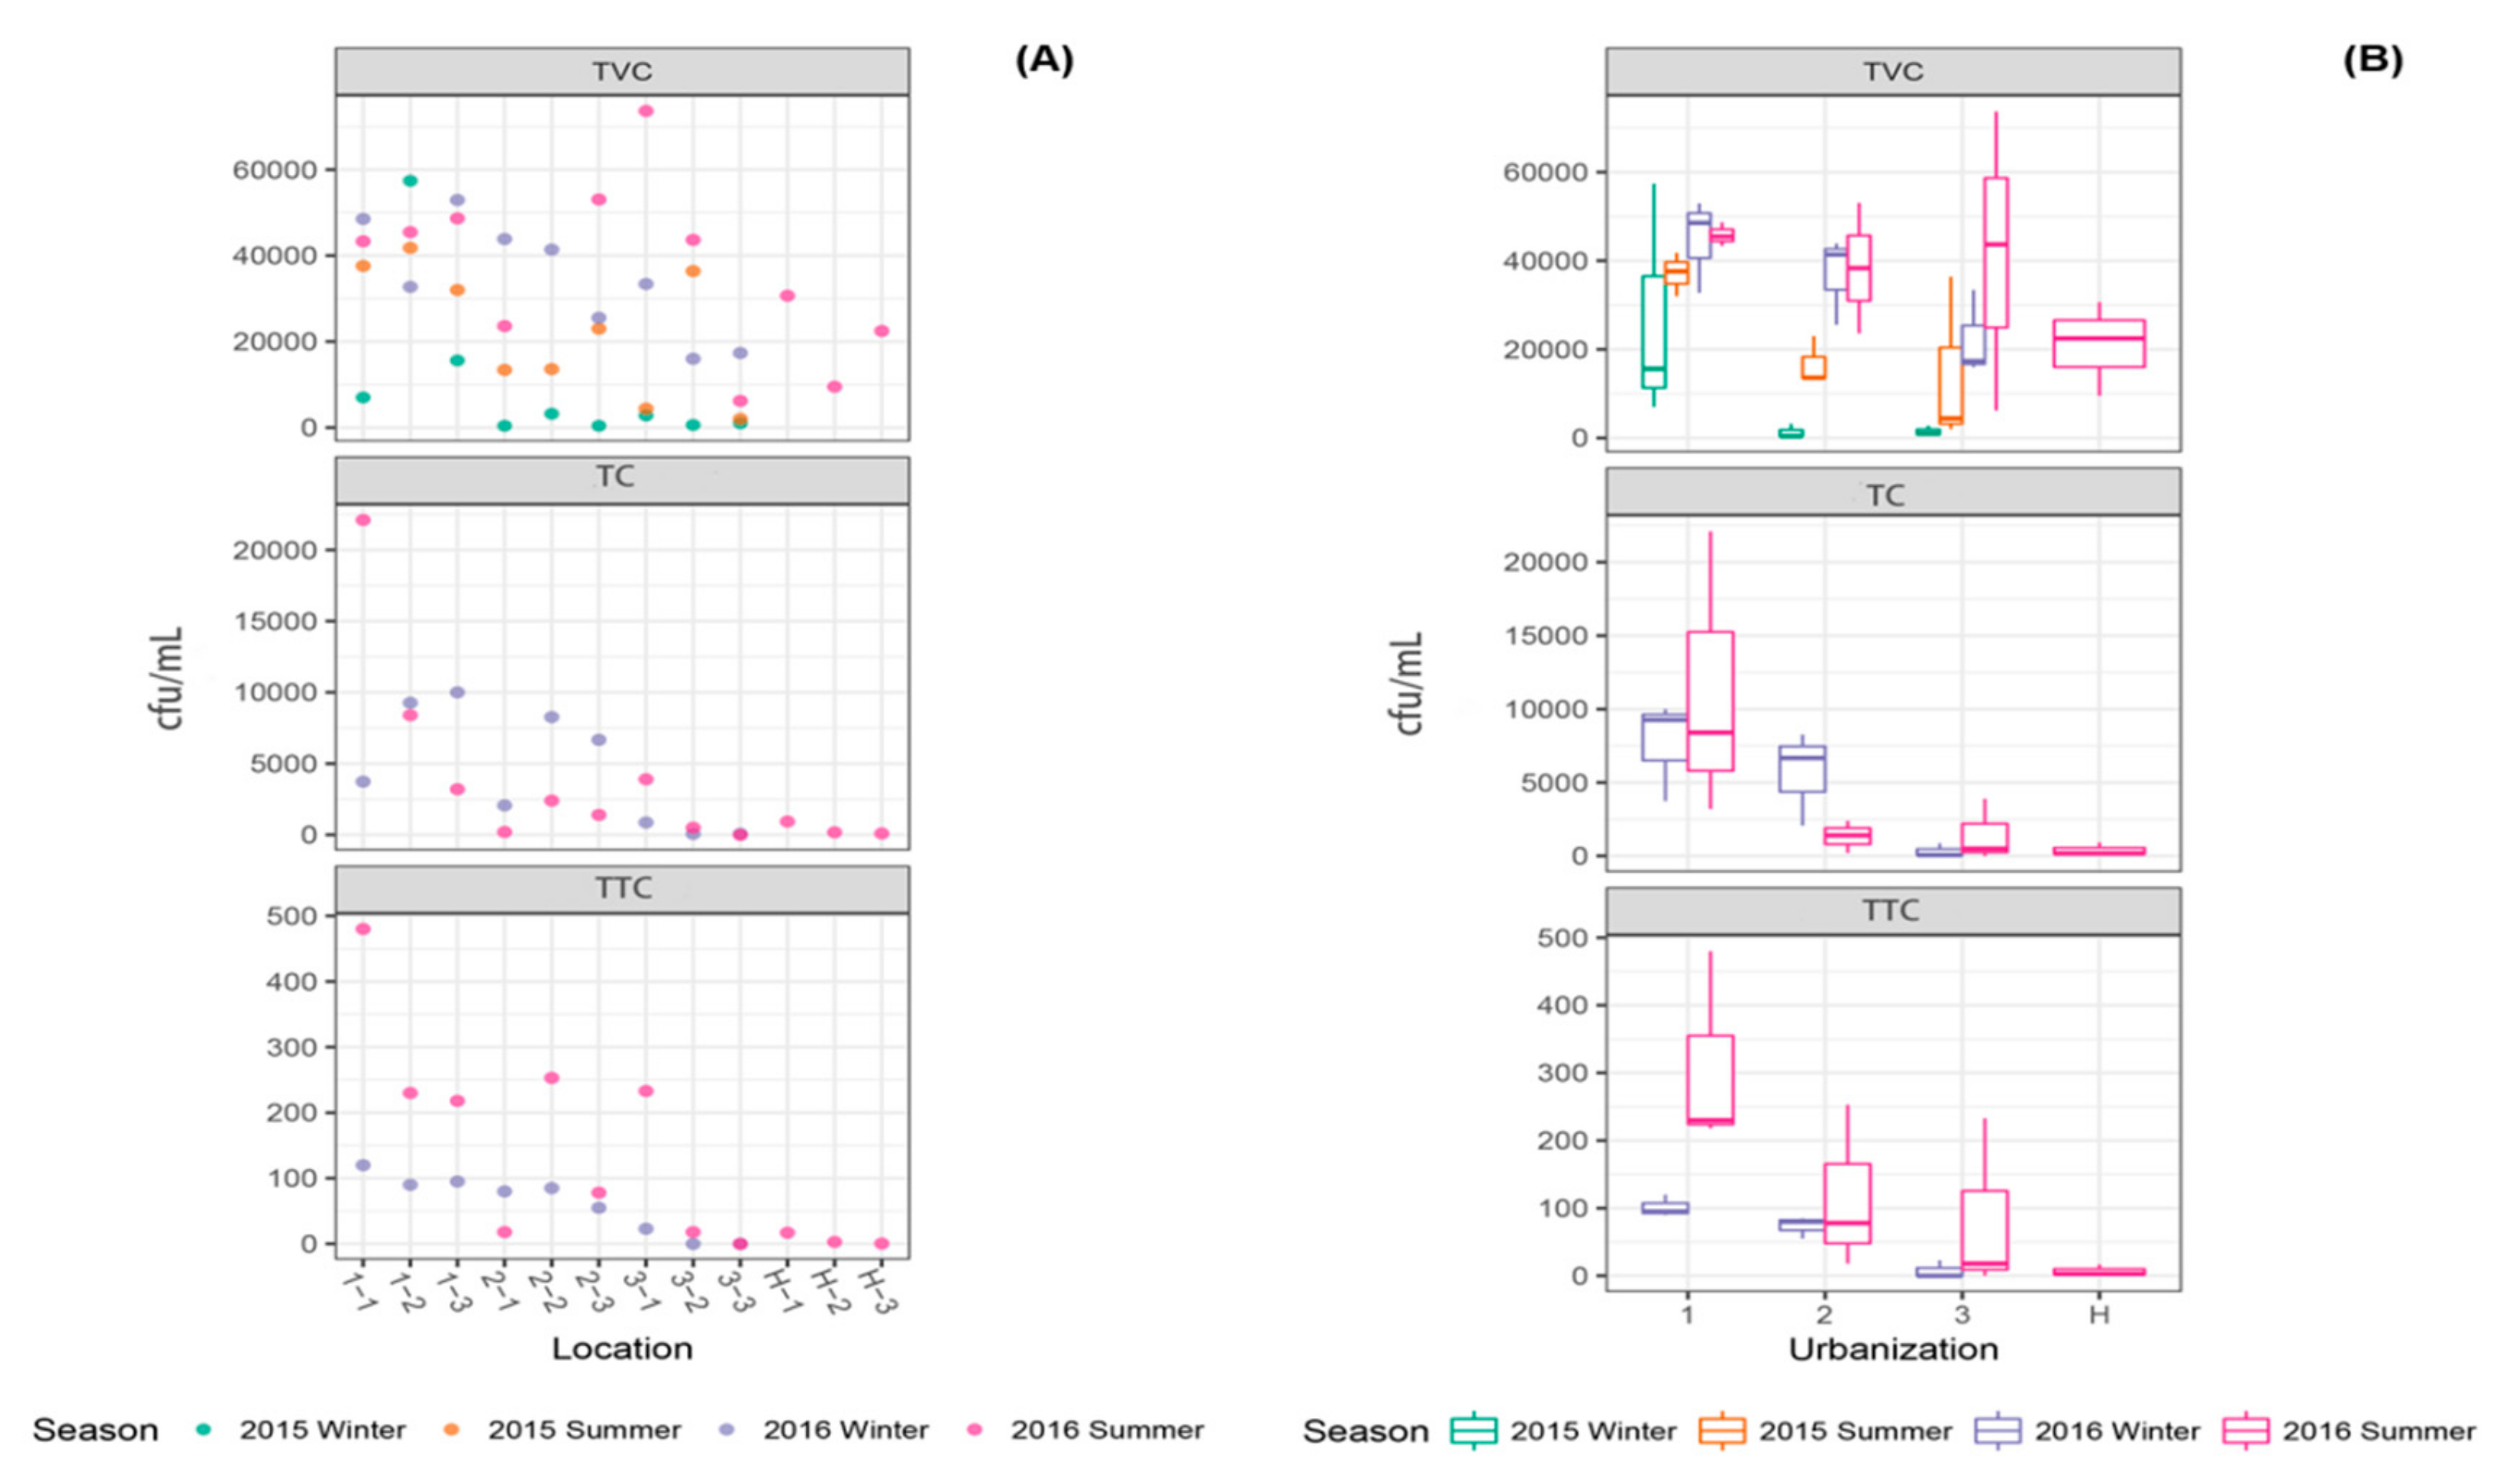
3.2.1. Culture-Dependent Microbiological Parameters

As one of the culture-dependent microbiological parameters, TVC was measured to quantitatively assess the microbial load in water samples collected from sampling locations in Suzhou and Huangshan (Figure 5). TVC showed significant variation with respect to urbanization (Table S5), and high TVC values were observed in locations with high (7–57.4 × 10³ cfu/mL) urbanization, as compared to locations with low (0.6–73.7 × 10³ cfu/mL) urbanization and Huangshan (9.5–30.7 × 10³ cfu/mL) (Table S6).
TC showed significant variation with respect to sampling locations in Suzhou (Table S5) and the TC numbers were higher (3.2–22.1 × 10³ cfu/mL) in locations in highly urbanized regions compared to low urbanized regions (0–3.9 × 10³ cfu/mL) (Table S6). Extremely low levels (0.1–0.9 × 10³ cfu/mL) of TC counts were observed in water samples collected from Huangshan (Table 1, Figure 5).
The TTC count showed significant variation with respect to both urbanization and season (Table S5). Higher TTC counts (90–480 × 103 cfu/mL) were observed in locations with high urbanization as compared to locations with low (0–233 × 103 cfu/mL) urbanization (Table S6). In water samples collected from Huangshan, extremely low TTC counts (0.5–17 × 103 cfu/mL) were observed (Table 1, Figure 5). The TTC count results mirrored the TC counts well, and either TC or TTC may be used to assess the microbiological quality of canal water. Both median and 95th percentile values of the microbiological parameters particularly TC and TTC measured at different urban gradients support the above results; TC and TTC had high median and 95th percentile values in the water samples collected from high urbanization locations as compared to medium and low urbanization locations in Suzhou and Huangshan (Table S7).

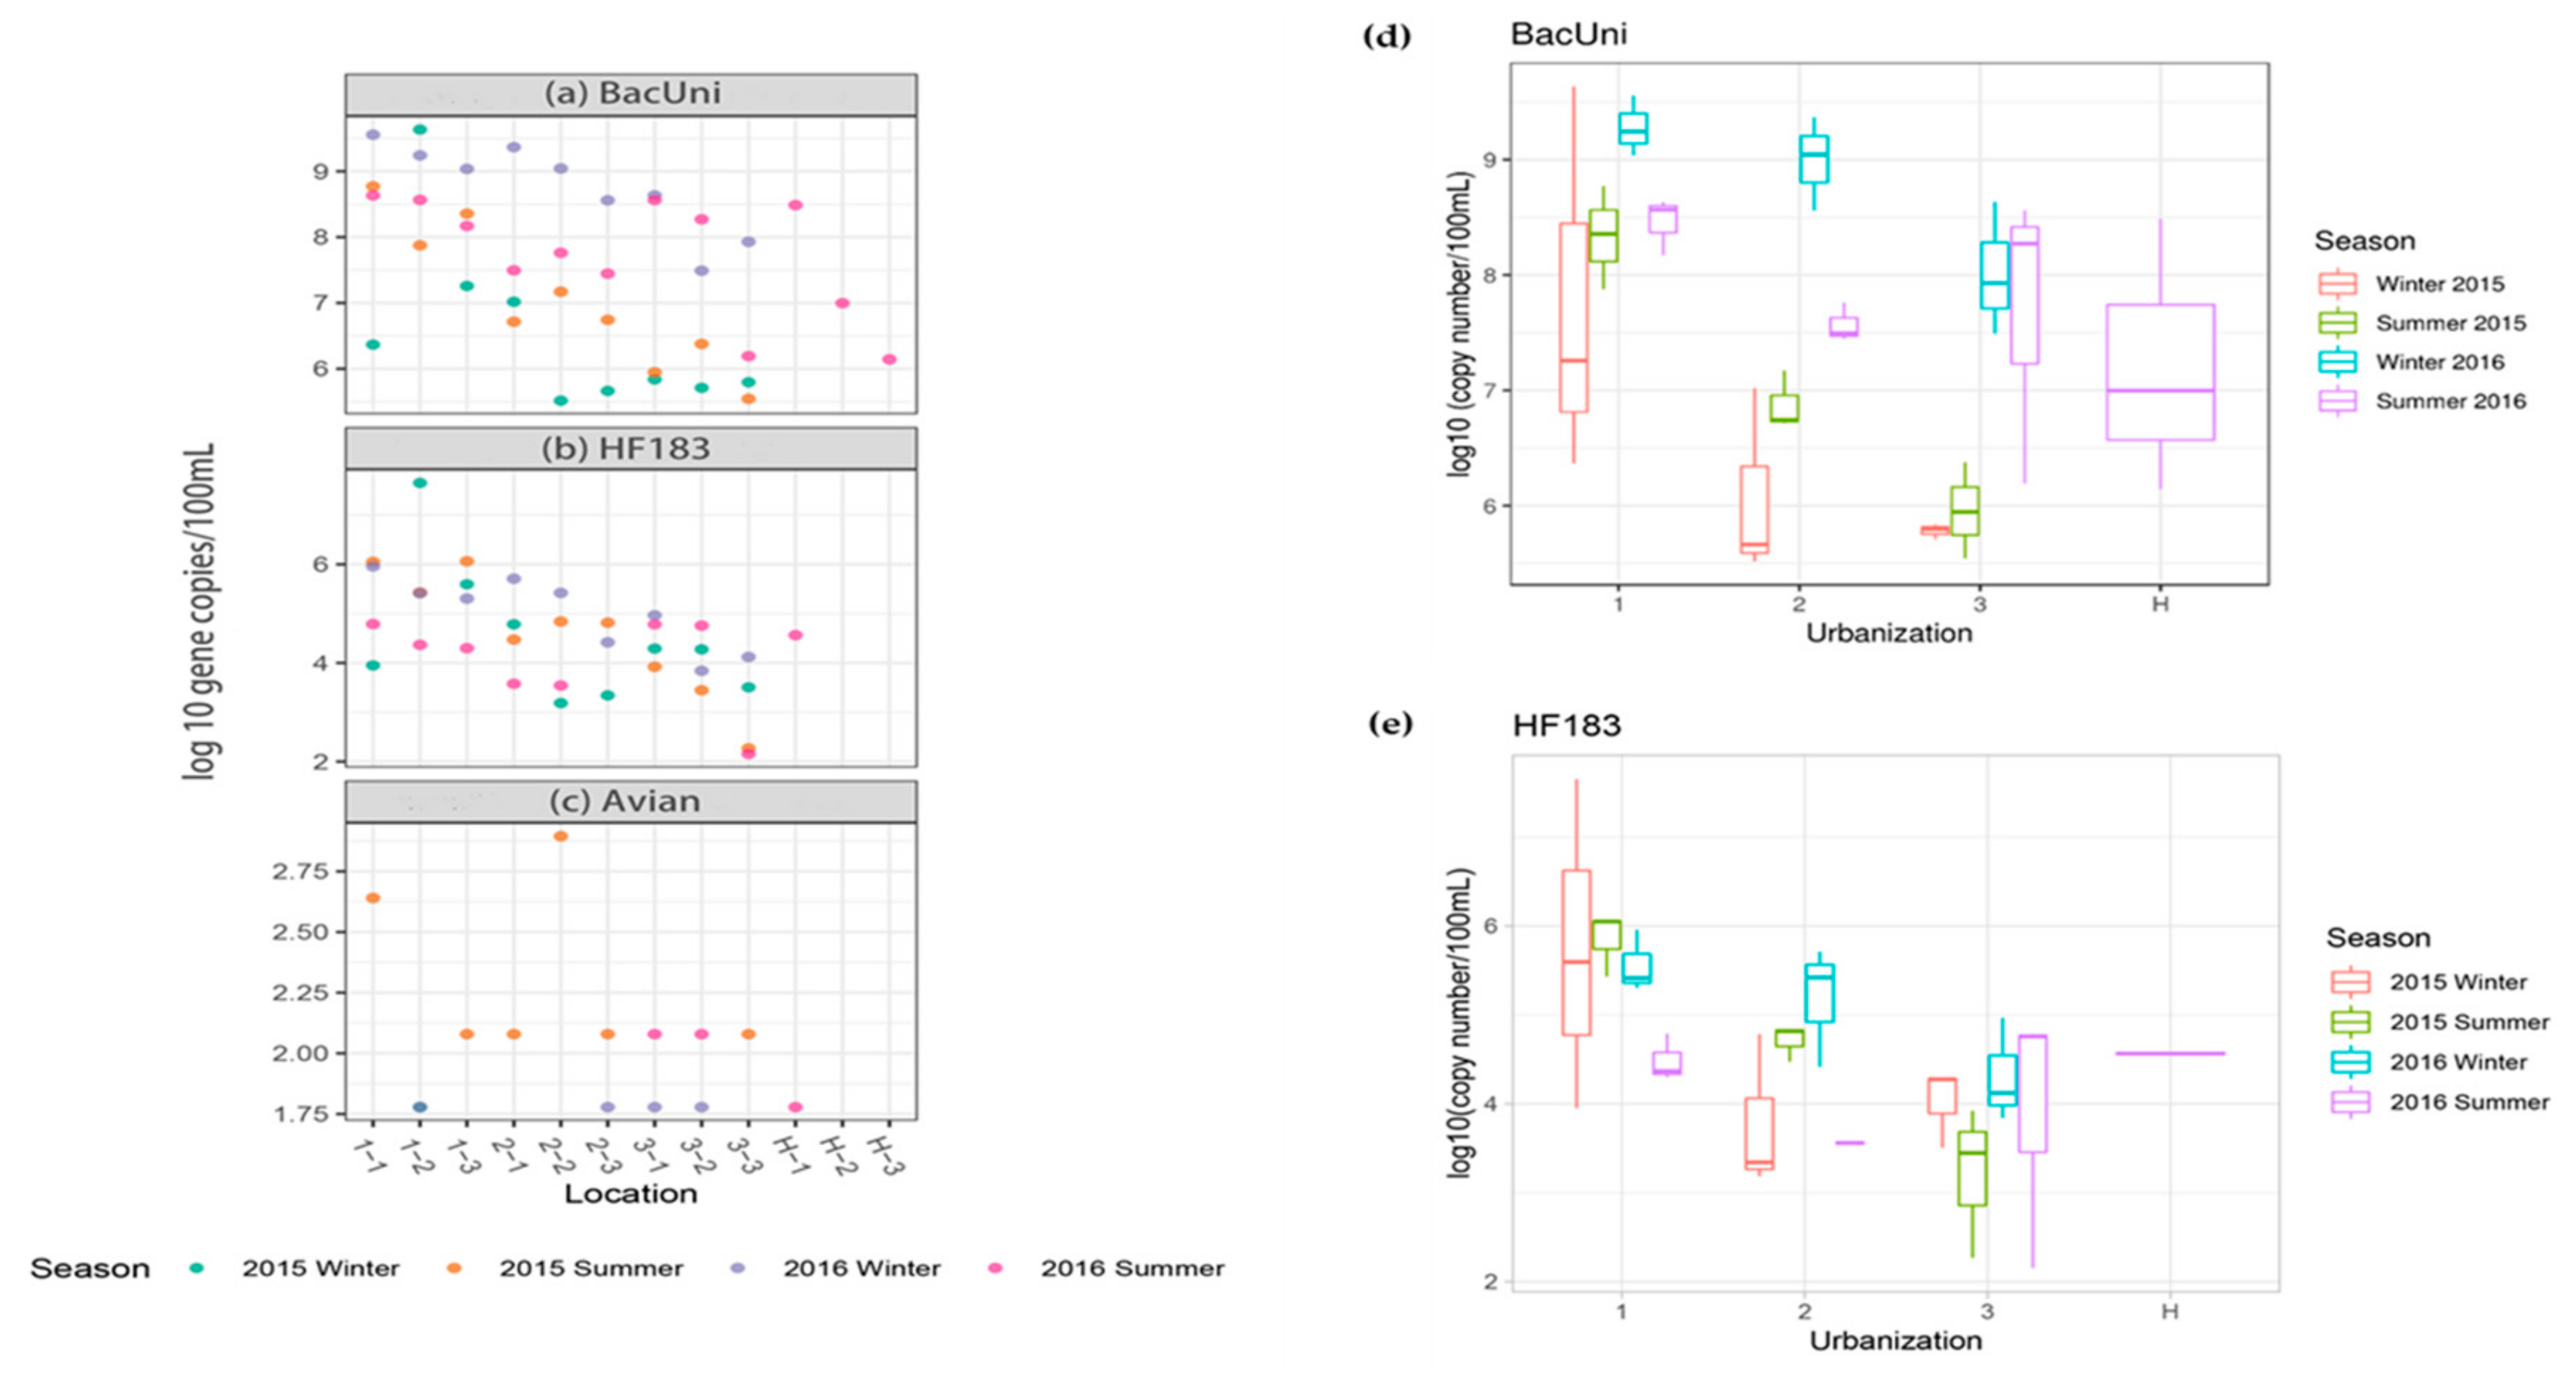
3.2.2. Detection and Quantification of Fecal Markers

The total Bacteroidales marker was detected in all the water samples (100%), and in general, higher levels were observed in water samples collected from locations with high (6.37 to 9.63-log10 gene copies/100 mL) urbanization than medium (5.52 to 9.37-log10 gene copies/100 mL) and low (5.54 to 8.63-log10 gene copies/100 mL) urbanization (Figure 6a). A significantly higher level of total Bacteroidales marker was observed among the locations with high urbanization (p = 0.008) than medium and low (Figure 6d, Tables S5 and S6). For water samples collected from Huangshan, low levels of total Bacteroidales were observed (6.14 to 7.00-log10 gene copies/100 mL) except at location H-1, where the numbers were 8.49-log10 gene copies/100 mL.
Human-associated Bacteroidales markers were frequently detected in most of the samples tested (36 out of 39 water samples, 92%), and the concentrations ranged from 2.15 to 7.65-log10 gene copies/100 mL (Figure 6b). Similar to total Bacteroidales, significantly (p = 0.002) higher levels of human-associated Bacteroidales were observed in water samples collected from locations with high urbanization (3.95 to 7.65-log10 gene copies/100 mL) than medium (3.19 to 5.71-log10 gene copies/100 mL) and low (2.15 to 4.97-log10 gene copies/100 mL) urbanization (Figure 6e, Tables S5 and S6). For water samples collected from Huangshan, human-associated Bacteroidales was only detected in location H-1 (4.57-log10 gene copies/100 mL) but not at H-2 and H-3 locations. The results of the abundance of human-associated Bacteroidales showed the same pattern as the total Bacteroidales marker numbers, the only obvious difference is that the concentrations of total Bacteroidales were usually 102–103 fold higher than the concentrations of human-associated Bacteroidales.
Avian fecal marker (GFD) was only detected in 14 out of 39 water samples (36%), however, they were at the quantifiable range in two water samples only (2.64 to 2.89-log10 gene copies/100 mL) (Figure 6c).

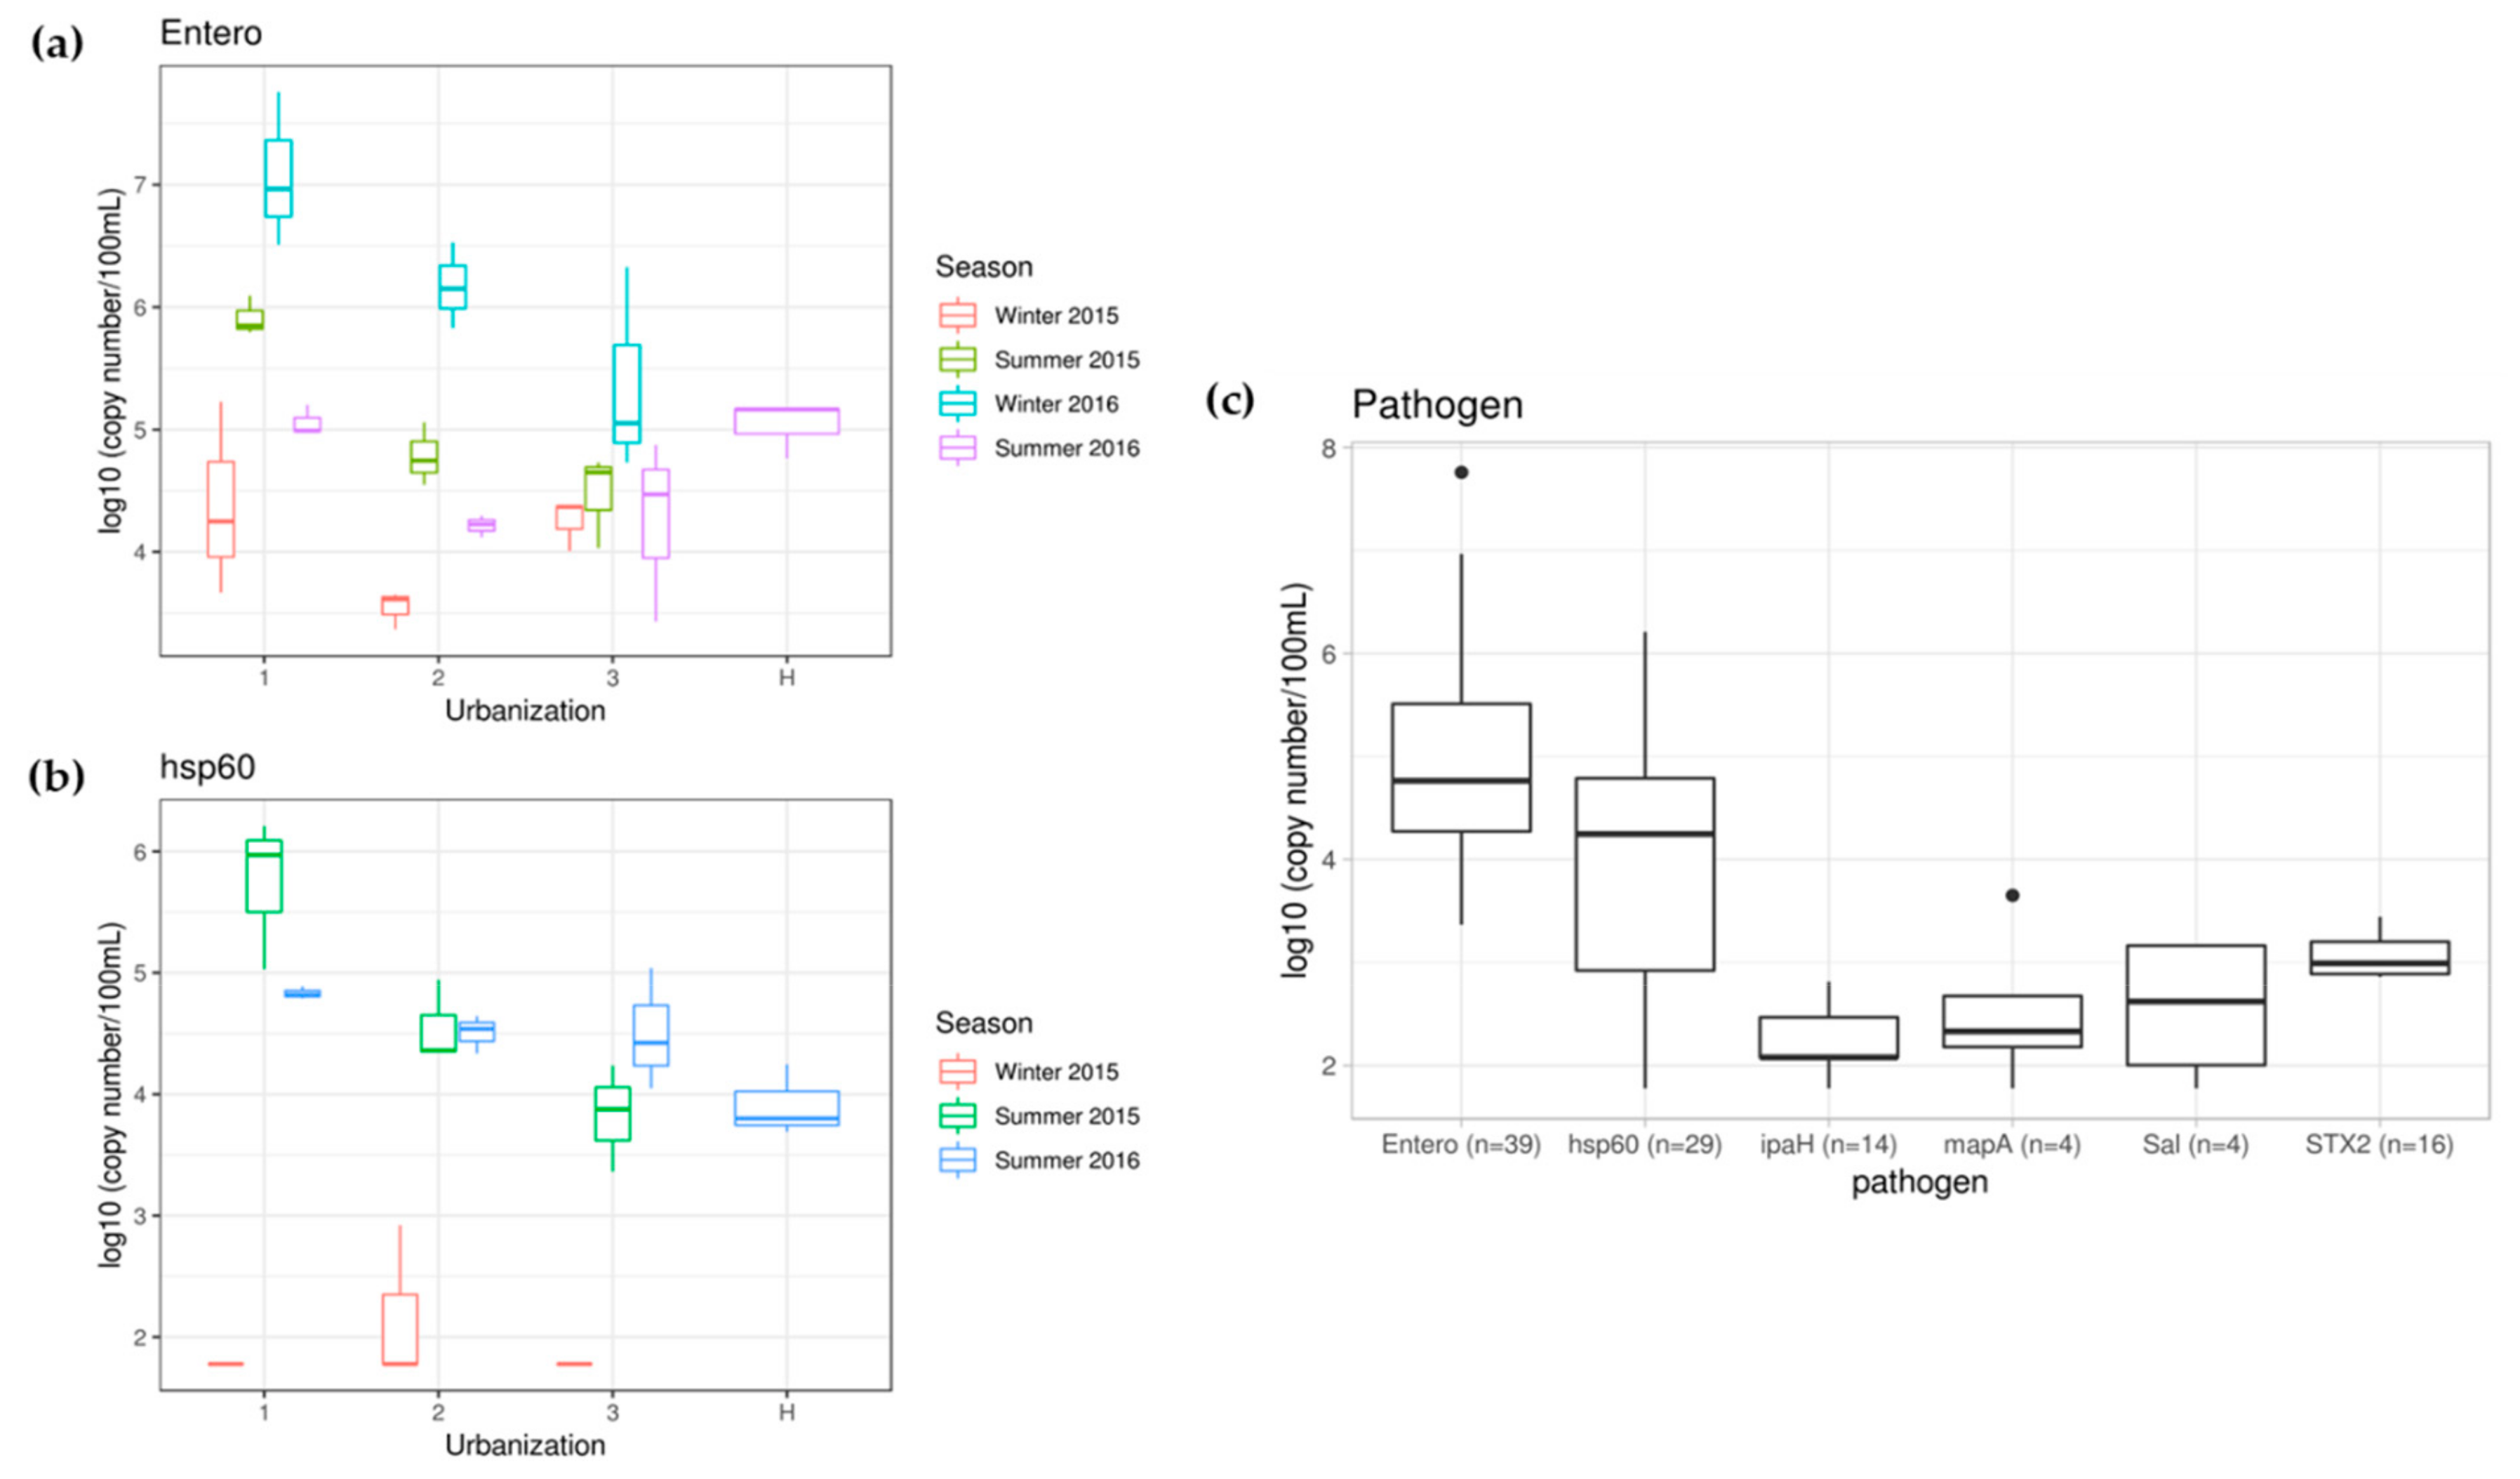
3.2.3. Frequency of Detection and Abundance of Genes of Bacterial Pathogens

The most frequently detected genes of bacterial pathogens were ENT1A (100%; Enterococcus), followed by hsp60 (74%; Arcobacter butzleri), STX2 (41%; STEC), ipaH (36%; Shigella sp.) mapA, (10%; Campylobacter jejuni) and Salmonella spp. (10%) (Table 2). Considering the limit of quantification (LOQ) as the selection criteria, a gene specific to Enterococcus was detected in all the water samples (100%), and the concentrations ranged from 3.37 to 7.76-log10 gene copies/100 mL (Table S8A and Figure 7a). Significantly (p = 0.034) higher levels of Enterococcus specific genes were observed in water samples collected from locations with high urbanization (Table S5). The Enterococcus qPCR data followed the trend of TC, TTC, total and human-associated Bacteroidales data. The qPCR targeted to Arcobacter butzleri showed significantly higher (p = 0.000) levels of the hsp60 gene in summer than in winter, and also significantly (p = 0.005) higher levels were observed in water samples collected from locations with high urbanization than low urbanization. All the water samples collected in summer were quantified (3.36 to 6.21-log10 gene copies/100 mL), but only one sample (2-3) was quantified (2.92-log10 gene copies/100 mL) in winter 2015 (though seven more samples were detected but not quantifiable) and none of the samples collected from winter 2016 were at detectable levels (Table S8B and Figure 7b). The highest concentration (6.21-log10 gene copies/100 mL) was observed at location 1-3 in summer 2015. Although the genes of other pathogens (Shigella sp., Campylobacter jejuni, Salmonella spp. and Shiga toxin producing E. coli) were detected in few samples (10%–41%), they were quantifiable only in fewer samples (2.31 to 3.65-log10 gene copies/100 mL) and most of these samples were collected from high urbanization locations (Table S8C–F, Figure 7c). In general, a high level of pathogens was observed mainly in locations with high urbanization than medium and low (Table S6).

4. Discussion

Urbanization can cause major changes to freshwater systems, such as increasing chemical and microbial contaminations and eutrophication [43]. In the present study, the impact of urban intensification on the physicochemical and microbiological characteristics of surface water was studied using canals as model systems. Earlier studies have shown that artificial water systems such as canals are sensitive to anthropogenic inputs from human and industrial activities [44]. Therefore, canals represent a strong model system to study the impact of urbanization on general water quality and the data presented here provide further support for this position.
Since the field sampling was carried out at different time points on the same day (morning, noon or afternoon), the variation of the water temperature with respect to sampling locations in Suzhou observed could be due to the sampling time. The pH values varied significantly between sampling locations but not with seasons. pH is important for aquatic life as it determines the solubility and bioavailability of chemicals including nutrients and heavy metals [45], and most of the pH values were within an acceptable range (6.5–8.5) as determined by the Chinese Ministry of Environment Protection (MEP) [46]. The variation in the pH between sampling locations could be due to differences in the nutrient levels and input from the surroundings (land use) but the values obtained here are consistent with the results reported by Yu et al. (2012) for surface water quality of the Grand Canals. EC values were extremely high in high urbanization locations, most likely reflecting the amount of dissolved salts, total dissolved solids and inorganic compounds present in the water samples [47]. EC is one of the important parameters to assess the water quality and it is an indirect indicator of water pollution particularly wastewater or sewage discharge [48]. The presence of wastewater or domestic sewage can raise the EC in surface water due to the presence of phosphate, nitrate, chloride and other ions [48,49], which is another likely driver of high conductivity observed in urbanized locations.
The surface water quality in China is classified into six grades [46]: Grade I-III are applicable to the water from sources or protected areas for centralized sources for drinking and such grades could be considered as good quality; Grade IV and V are applicable to water bodies for industrial and agricultural use, and such grades could be considered as moderately polluted; Grade V+ means seriously polluted. TN concentrations were high in almost every location in Suzhou (highest in high and medium urbanized locations) as compared to the MEP standards (Grade V+: TN > 2 mg/L), which indicates that these locations were seriously polluted with multiple sources. TN concentrations were low and within the limit in control locations in Huangshan (0.29–1.17 mg/L). TP and ammonium concentrations were beyond the standards (Grade V+: TP > 0.4 mg/L, ammonium nitrogen > 2 mg/L) especially in all the locations with high urbanization (0.13–2.10 mg/L of TP and 1.01–7.84 of NH4-N). Nutrients such as TN, TP, NH4-N and PO4-P varied significantly with sampling locations and, with the exception of TP, across seasons (Table 1). Elevated levels of nutrients were consistently observed in high urbanization areas. Although some of the nutrients come from natural processes, wastewater discharge, leakage of domestic sewage, agricultural runoff (fertilizers) and industrial wastes typically cause nutrient increases in water bodies, leading to eutrophication and excessive algal growth in lakes and reservoirs [50]. High concentrations of multiple nutrients observed in high urbanization locations were correlated with the land use types. The dominant land use type in the high urbanization locations was high-density residential land (36%–57%) followed by commercial land (8%–18%). The highest nutrient enrichment on most occasions was found at location 1-2, which is a closed canal system with reduced water flow and is bordered by a high-density residential area. In medium urbanized locations (2-1 to 2-3), the dominant land use types were research and education institutions as well as associated residential areas (0%–63%), industrial land (0%–49%) and high-density residential land (3%–24%). In contrast, the land use types in low urbanization locations were rivers and lakes (11%–34%), agricultural land (0%–20%), public green land (6%–29%) and high-density residential land (7%–21%) followed by industrial land (3%–14%). The main source of nutrients observed in low urbanized locations (3-1 to 3-3) could be agricultural runoff followed by domestic wastewater and industrial wastes. A high number of transportation activities by ferries were also a feature at two of the low urbanization locations (3-1 and 3-3) which could have increased water turbidity by resuspension and thus incorporation of ionic sediment material.
The surface water quality of the Grand Canal has been found to harbor high concentrations of nitrogen, phosphorus and various metals [20]. It was also reported that water quality deterioration in the water system of Shanghai was primarily due to the presence of nutrients such as ammonia nitrogen, and low dissolved oxygen levels [51]. With continued urbanization, wastewater and pollutants from household consumption have had a major influence on emission loads in Shanghai [52]. Meanwhile, altered land use and land cover (LULC) generally has been associated with impacts on the flow and water quality at multiple spatial scales [53,54]. The relationship between land use and lake/river water quality or impact on urban water quality has been the subject of other studies in China [51,55], and generally reflects the results found in the present study with decreasing water quality with increasing urbanization.
Overall, Chl a concentrations did not vary between sampling locations but were higher in summer correlating with increased temperature. The Chl a concentration was extremely high in location 2-2 in summer 2016, which is correlated with high algal growth observed in this location during sample collection. High algal growth is caused by eutrophication of water bodies and the extremely high concentrations of TN and TP (6.54 mg/L, 0.59 mg/L, respectively) recorded at location 2-2 in summer 2016 indicated serious eutrophication.
Since high-density residential land was the dominant land use pattern in locations with high urbanization, higher population density coupled with human activities and domestic wastewater/sewage undoubtedly contributed to high TVC, TC and TTC values in high urbanization locations. All these culture-dependent microbiological assays (TVC, TC and TTC) essentially showed similar results in this study. Total coliform (TC) numbers were measured to assess the sanitary quality of the water. As the coliform group of bacteria largely originate from the digestive tracts of warm-blooded animals, their presence in water samples indicates bacteria of fecal origin although coliform themselves do not typically cause serious illnesses or diseases [47]. Thermotolerant coliform (TTC) or fecal coliform is a group of anaerobic facultative bacteria whose presence in high numbers indicates fecal contamination and increased health risk [56], however, their presence is not always an absolute indicator of fecal contamination or the presence of harmful bacteria in water samples [57] (Figure 5). Glinska-Lewczuk et al. [58] observed an increase in nutrient concentration and indicator bacteria (heterotrophic plate count and thermotolerant coliforms) associated with urbanized sections of a lowland river in Poland. Santiaogo-Rodriguez et al. (2016) reported that fecal indicator bacteria positively correlated with urbanization and rainfall events in a tropical watershed in Puerto Rico [59].
Fecal pollution of surface waters is a serious issue for aquatic ecosystems and human health. Fecal material enters into the freshwater ecosystem from several sources such as effluents from wastewater treatment plants, septic leaks, urban and storm runoff water [60]. Total Bacteroidales and human-associated Bacteroidales increased with increasing urbanization. Total Bacteroidales (BacUni) were obviously richer (102–103 fold) than human-associated Bacteroidales (HF183) in water samples, although avian associated markers did not show any trend, and were found in low densities. These findings indicate that canals in high urbanization areas are affected by fecal pollution and human sewage. This could be due to the discharge of sewer and septic waste in the water bodies directly or indirectly [61]. Runoff after rainfall could also lead to fecal source entry into watersheds [62]. However, the higher precipitation in summer than in winter in Suzhou was not associated with either BacUni or HF183, which indicated that their presence and abundance were not affected by rainfall. Similar trends of water impairment due to urbanization have been reported elsewhere for an urbanized tropical watershed [63]. It was also confirmed by Molina et al. (2014) that high levels of human contamination were detected in urban runoff [64]. Since almost no poultry or other related animal activities were observed near the sampling locations, the avian host-associated marker was only quantifiable in some samples and at very low concentrations. Huangshan represented a good control area as the waterways are protected by the local government and the area has considerably lower human population density. Low levels of fecal markers were observed in water samples collected from there, except in location H-1 which is close to a village at the foot of the mountain where some small-scale farming activities (e.g., poultry) were observed during sampling, which caused some fecal contamination at location H-1.
Higher levels of Enterococcus spp. were observed in water samples collected from locations with high urbanization in Suzhou. Many species of Enterococcus are prevalent in the gastrointestinal tract of mammals, making them widely used as bacterial indicators for fecal pollution in water. Although Enterococcus spp. usually do not pose any health risks to humans, their presence in water could suggest the possible presence of enteric pathogens [65]. Therefore, Enterococcus spp. values were related to the results of fecal markers, especially human-specific fecal markers, and exhibited similar distributions to TC and TTC. The optimal growth temperature range for Arcobacter butzleri is from 26 to 30 °C [66], which matches with the summer temperature observed in Suzhou canals (27–33 °C) (Table 2 and Figure S1) therefore this bacterium was detected in the samples collected during summer but was only detectable in few samples collected in winter. The genus Arcobacter was reported to be associated with human illness and fecal contamination, and human fecal sources were likely to be a key contributor to Arcobacter contamination [67]. Some species of this genus are considered as emerging food pathogens [68] and among these species, A. butzleri was an underestimated enteropathogen [69]. Shigella sp. is one of the major food-borne pathogens that caused human shigellosis worldwide [70]; Shiga toxin producing E. coli (STEC) are associated with the production of Shiga toxin, and STEC play an important role as pathogens in humans [71]; Campylobacter jejuni is a clinically important bacterial species [72]; Salmonella spp., a leading cause of morbidity and mortality due to food and waterborne diseases in many countries, causes gastroenteritis, typhoid and diarrheal illnesses for human beings [70]. However, all these four pathogens were only quantified in several samples at very low levels as compared to Enterococcus spp. and Arcobacter butzleri and these pathogens were detected in high levels in locations with high urbanization in Suzhou.

5. Conclusions

In this study, significantly higher levels of multiple nutrient parameters (TN, TP, NH4-N and PO4-P), microbial load (TVC, TC and TTC), fecal markers (total Bacteroidales and human-associated Bacteroidales) and bacterial pathogens (Enterococcus spp. and Arcobacter butzleri) were observed in water samples collected from locations with high urban intensification as compared to medium and low urbanization in Suzhou canals and control locations of Huangshan. Land use types of locations with high urban intensification were mainly high-density residential lands. Therefore, domestic wastewater or sewage was the main pollutant entering into city canals, causing serious eutrophication and microbial contaminations in those locations. The results obtained in this study conclude that urbanization impacts the water quality with high levels of nutrients and microbial load including fecal markers and pathogens in Suzhou canals, which have significance for public health. Microbial community analysis by next-generation sequencing (NGS) will be carried out for water samples to collect comprehensive microbiological data.

Supplementary Materials

The following are available online at https://www.mdpi.com/1660-4601/16/10/1739/s1, Figure S1: The average air temperature and precipitation in Suzhou for each month during 2015 (A) and 2016 (B), Table S1: Description of sampling locations in Suzhou and Huangshan along with geographic coordinates and corresponding land use types, Table S2: The specific explanation of each land use classification in land use type analysis, Table S3: qPCR primers and probes used in this study for quantification of fecal markers and bacterial pathogens. Table S4: The limit of detection (LOD), limit of quantification (LOQ) and final assessment of qPCR results for each fecal marker and pathogen assays, Table S5: Two-way ANOVA of physicochemical and microbiological parameters and abundance of fecal markers and pathogenic bacteria for water samples, Table S6: Urbanization variation of physicochemical and microbiological parameters and abundance of fecal markers and pathogenic bacteria for water samples, Table S7: The median and 95th percentile data of TVC, TC and TTC for each urbanization gradient (High, Medium, Low) in Suzhou and Huangshan, Table S8A–F: Concentration of pathogenic bacterial genes (Enterococcus spp., Arcobacter butzleri, Shigella, Campylobacter jejuni, Salmonella spp. and STEC) in water samples collected from Suzhou canals and streams in Huangshan.

Author Contributions

R.S., J.D.T., A.J.M., J.W. and Y.Z. conceived and designed the experiments; R.S., T.Y. and K.K.V. carried out the field sampling; J.W. contributed to nutrient analyses; T.Y. carried out the microbiological and statistical analyses and quantification of fecal markers by qPCR and K.K.V. contributed to the quantification of genes of bacterial pathogens; J.L. prepared the land use pattern maps for all the sampling locations along with the descriptions; Z.Z. identified the sampling locations based on the population density data and prepared map of the sampling locations; T.Y. prepared the paper with the direction of his supervisors R.S., A.J.M. and Y.Z.; All the authors contributed to the revision of the paper.

Funding

The authors would like to acknowledge the Natural Science Foundation of the Jiangsu Higher Education Institutions of China (Jiangsu University Natural Science Programme, Grant No. 13KJB180022), Natural Science Foundation of Jiangsu Province (Jiangsu Science and Technology Programme; Grant No. BK20141211) and Xi’an Jiaotong-Liverpool University (XJTLU; RDF 2010-02-05) for funding support. Financial support to Tianma Yuan and Kiran Kumar Vadde was provided through Postgraduate Research Scholarship (PGRS-13-03-09 and PGRS-12-01-08, respectively) awarded by XJTLU. Yixin Zhang would like to acknowledge XJTLU (Grant number RDF-15-01-50), and Natural Science Foundation of Jiangsu Province (Grant number BK20171238) for funding support.

Acknowledgments

Thanks to Ying Chang, Department of Urban Planning and Design, XJTLU for obtaining population density data for Suzhou to identify the sampling locations in different urban gradients. Thanks to Felicia Lim and Jing Zhang for their support with the field sampling for pilot experiments. Thanks to Jialin Ma, Xiangyu Wu and Hongyong Xiang for their support and suggestions with Rplot and statistical analyses.

Conflicts of Interest

The authors declare no conflict of interest.

References

  1. United Nations. World Urbanization Prospects: The 2018 Revision; Department of Economic and Social Affairs, United Nations: New York, NY, USA, 2018. [Google Scholar]
  2. National Bureau of Statistics of China (NBSC). National Statistics Yearbook 2018; China Statistics Press: Beijing, China, 2018; [In Chinese].
  3. UN-HABITAT. World Cities Report 2016—Urbanization and Development: Emerging Futures; United Nations Human Settlements Programme, UN-HABITAT: Nairobi, Kenya, 2016. [Google Scholar]
  4. De Sherbinin, A.; Schiller, A.; Pulsipher, A. The vulnerability of global cities to climate hazards. Environ. Urban. 2007, 19, 39–64. [Google Scholar] [CrossRef] [Green Version]
  5. Shao, M.; Tang, X.; Zhang, Y.; Li, W. City clusters in China: Air and surface water pollution. Front. Ecol. 2006, 4, 353–361. [Google Scholar] [CrossRef]
  6. Zhu, Y.-G.; Ioannidis, J.P.A.; Li, H.; Jones, K.C.; Martin, F.L. Understanding and Harnessing the Health Effects of Rapid Urbanization in China. Environ. Sci. Technol. 2011, 45, 5099–5104. [Google Scholar] [CrossRef] [PubMed] [Green Version]
  7. Chen, Y.; Zhang, Z.; Du, S.; Shi, P.; Tao, F.; Doyle, M. Water quality changes in the world’s first special economic zone, Shenzhen, China. Water Resour. Res. 2011, 47. [Google Scholar] [CrossRef]
  8. Zhang, W.; Li, H.; Li, Y. Spatio-temporal dynamics of nitrogen and phosphorus input budgets in a global hotspot of anthropogenic inputs. Sci. Total Environ. 2019, 656, 1108–1120. [Google Scholar] [CrossRef]
  9. Jiang, Y. China’s water security: Current status, emerging challenges and future prospects. Environ. Sci. Policy 2015, 54, 106–125. [Google Scholar] [CrossRef]
  10. Zhu, Y.; Price, O.R.; Kilgallon, J.; Qi, Y.; Tao, S.; Jones, K.C.; Sweetman, A.J. Drivers of contaminant levels in surface water of China during 2000–2030: Relative importance for illustrative home and personal care product chemicals. Environ. Int. 2018, 115, 161–169. [Google Scholar] [CrossRef]
  11. Prasad, M.B.; Maddox, M.C.; Sood, A.; Kaushal, S.; Murtugudde, R. Nutrients, chlorophyll and biotic metrics in the Rappahannock River estuary: Implications of urbanisation in the Chesapeake Bay watershed, USA. Mar. Freshw. Res. 2014, 65, 475–485. [Google Scholar] [CrossRef]
  12. Goel, P.; Saxena, A.; Singh, D.S.; Verma, D. Impact of Rapid Urbanization on Water Quality Index in Groundwater Fed Gomati River, Lucknow, India. Curr. Sci. 2018, 114, 650–654. [Google Scholar] [CrossRef]
  13. Yu, D.; Shi, P.; Liu, Y.; Xun, B. Detecting land use-water quality relationships from the viewpoint of ecological restoration in an urban area. Ecol. Eng. 2013, 53, 205–216. [Google Scholar] [CrossRef]
  14. Carle, M.V.; Halpin, P.N.; Stow, C.A. Patterns of watershed urbanization and impacts on water quality. JAWRA J. Am. Water Resour. Assoc. 2005, 41, 693–708. [Google Scholar] [CrossRef]
  15. Shen, Z.; Hou, X.; Li, W.; Aini, G. Relating landscape characteristics to non-point source pollution in a typical urbanized watershed in the municipality of Beijing. Landsc. Urban Plan. 2014, 123, 96–107. [Google Scholar] [CrossRef]
  16. Chen, X.; Zhou, W.; Pickett, S.T.A.; Li, W.; Han, L.; Lin, Y.-P. Spatial-Temporal Variations of Water Quality and Its Relationship to Land Use and Land Cover in Beijing, China. Int. J. Environ. Public Health 2016, 13, 449. [Google Scholar] [CrossRef]
  17. Zhang, L.; Gao, S.; Wei, B.; Li, Y.; Li, H.; Wang, L.; Ye, B. Effects of Urbanization on Rural Drinking Water Quality in Beijing, China. Sustainability 2017, 9, 461. [Google Scholar] [CrossRef]
  18. Griffith, J.F.; Cao, Y.; McGee, C.D.; Weisberg, S.B. Evaluation of rapid methods and novel indicators for assessing microbiological beach water quality. Water Res. 2009, 43, 4900–4907. [Google Scholar] [CrossRef]
  19. Jamieson, R.; Joy, D.M.; Lee, H.; Kostaschuk, R.; Gordon, R. Transport and deposition of sediment-associated Escherichia coli in natural streams. Water Res. 2005, 39, 2665–2675. [Google Scholar] [CrossRef]
  20. Ahmed, W.; Sritharan, T.; Palmer, A.; Sidhu, J.P.S.; Toze, S. Evaluation of Bovine Feces-Associated Microbial Source Tracking Markers and Their Correlations with Fecal Indicators and Zoonotic Pathogens in a Brisbane, Australia, Reservoir. Appl. Environ. Microbiol. 2013, 79, 2682–2691. [Google Scholar] [CrossRef] [Green Version]
  21. Field, K.G.; Samadpour, M. Fecal source tracking, the indicator paradigm, and managing water quality. Water Res. 2007, 41, 3517–3538. [Google Scholar] [CrossRef]
  22. Domingo, J.W.S.; Bambic, D.G.; Edge, T.A.; Wuertz, S. Quo vadis source tracking? Towards a strategic framework for environmental monitoring of fecal pollution. Water Res. 2007, 41, 3539–3552. [Google Scholar] [CrossRef]
  23. Haramoto, E.; Osada, R. Assessment and application of host-specific Bacteroidales genetic markers for microbial source tracking of river water in Japan. PLoS ONE 2018, 13, e0207727. [Google Scholar] [CrossRef]
  24. Hlavsa, M.C.; Roberts, V.A.; Kahler, A.M.; Hilborn, E.D.; Mecher, T.R.; Beach, M.J.; Wade, T.J.; Yoder, J.S. Outbreaks of Illness Associated with Recreational Water—United States, 2011–2012. Morb. Mortal. Wkly. 2015, 64, 668–672. [Google Scholar]
  25. Medeiros, J.; Araújo, L.; Da Silva, V.; Diniz, C.; Cesar, D.; Del’Duca, A.; Coelho, C. Characterization of the microbial community in a lotic environment to assess the effect of pollution on nitrifying and potentially pathogenic bacteria. Braz. J. Boil. 2014, 74, 612–622. [Google Scholar] [CrossRef] [Green Version]
  26. Mao, F.; Liu, Z.; Zhou, W.; Huang, J.; Li, Q. The research and application of spatial information technology in cultural heritage conservation—Case study on Grand Canal of China. Int. Arch. Photogramm. Remote Sens. Spat. Inf. Sci. 2008, 38, 999–1006. [Google Scholar]
  27. Wang, L.; Shen, J.; Chung, C.K.L. City profile: Suzhou—A Chinese city under transformation. Cities 2015, 44, 60–72. [Google Scholar] [CrossRef]
  28. Suzhou Statistics Bureau. Suzhou Statistical Yearbook 2016; China Statistics Press: Beijing, China, 2016; [In Chinese].
  29. Suzhou Statistics Bureau. Suzhou Statistical Yearbook 2017; China Statistics Press: Beijing, China, 2017; [In Chinese].
  30. Wang, J.; Soininen, J.; Zhang, Y.; Wang, B.; Yang, X.; Shen, J. Contrasting patterns in elevational diversity between microorganisms and macroorganisms. J. Biogeogr. 2011, 38, 595–603. [Google Scholar] [CrossRef]
  31. American Public Health Association (APHA). Standard Methods for the Examination of Water and Wastewater, 21st ed.; American Public Health Association: Washington, DC, USA, 2005. [Google Scholar]
  32. Reasoner, D.J.; Geldreich, E.E. A new medium for the enumeration and subculture of bacteria from potable water. Appl. Environ. Microbiol. 1985, 49, 1–7. [Google Scholar]
  33. Lange, B.; Strathmann, M.; Osmer, R. Performance validation of chromogenic coliform agar for the enumeration of Escherichia coli and coliform bacteria. Lett. Appl. Microbiol. 2013, 57, 547–553. [Google Scholar] [CrossRef] [Green Version]
  34. Geldreich, E.E.; Clark, H.F.; Huff, C.B.; Best, L.C. Fecal-coliform-organism medium for the membrane filter technique. J. Am. Water Works Assoc. 1965, 57, 208–214. [Google Scholar] [CrossRef]
  35. Oster, R.J.; Wijesinghe, R.U.; Haack, S.K.; Fogarty, L.R.; Tucker, T.R.; Riley, S.C. Bacterial Pathogen Gene Abundance and Relation to Recreational Water Quality at Seven Great Lakes Beaches. Environ. Sci. Technol. 2014, 48, 14148–14157. [Google Scholar] [CrossRef]
  36. Green, H.C.; Dick, L.K.; Gilpin, B.; Samadpour, M.; Field, K.G. Genetic markers for rapid PCR-based identification of gull, Canada goose, duck, and chicken fecal contamination in water. Appl. Environ. Microbiol. 2012, 78, 503–510. [Google Scholar] [CrossRef]
  37. Green, H.C.; Haugland, R.A.; Varma, M.; Millen, H.T.; Borchardt, M.A.; Field, K.G.; Walters, W.A.; Knight, R.; Sivaganesan, M.; Kelty, C.A.; et al. Improved HF183 Quantitative Real-Time PCR Assay for Characterization of Human Fecal Pollution in Ambient Surface Water Samples. Appl. Environ. Microbiol. 2014, 80, 3086–3094. [Google Scholar] [CrossRef] [Green Version]
  38. Kildare, B.J.; Leutenegger, C.M.; McSwain, B.S.; Bambic, D.G.; Rajal, V.B.; Wuertz, S. 16S rRNA-based assays for quantitative detection of universal, human-, cow-, and dog-specific fecal Bacteroidales: A Bayesian approach. Water Res. 2007, 41, 3701–3715. [Google Scholar] [CrossRef]
  39. Vadde, K.K.; McCarthy, A.J.; Rong, R.; Sekar, R. Quantification of Microbial Source Tracking and Pathogenic Bacterial Markers in Water and Sediments of Tiaoxi River (Taihu Watershed). Front. Microbiol. 2019, 10, 10. [Google Scholar] [CrossRef]
  40. Fujikoshi, Y. Two-way ANOVA models with unbalanced data. Discret. Math. 1993, 116, 315–334. [Google Scholar] [CrossRef] [Green Version]
  41. Ahmed, W.; Harwood, V.; Nguyen, K.; Young, S.; Hamilton, K.; Toze, S. Utility of Helicobacter spp. associated GFD markers for detecting avian fecal pollution in natural waters of two continents. Water Res. 2016, 88, 613–622. [Google Scholar] [CrossRef]
  42. Cao, Y.; Raith, M.R.; Smith, P.D.; Griffith, J.F.; Weisberg, S.B.; Schriewer, A.; Sheldon, A.; Crompton, C.; Amenu, G.G.; Gregory, J.; et al. Regional Assessment of Human Fecal Contamination in Southern California Coastal Drainages. Int. J. Environ. Public Health 2017, 14, 874. [Google Scholar] [CrossRef]
  43. Paul, M.J.; Meyer, J.L. Streams in the urban landscape. Annu. Rev. Ecol. Syst. 2001, 32, 333–365. [Google Scholar] [CrossRef]
  44. Wang, X.; Han, J.; Xu, L.; Zhang, Q. Spatial and seasonal variations of the contamination within water body of the Grand Canal, China. Environ. Pollut. 2010, 158, 1513–1520. [Google Scholar]
  45. United States Geological Survey (USGS). pH and Water. Available online: https://water.usgs.gov/edu/ph.html (accessed on 8 August 2018).
  46. Ministry of Environmental Protection of People’s Republic of China (MEP). Environmental Quality Standards for Surface Water: GB 3838–2002; MEP: Beijing, China, 2002; [In Chinese].
  47. Farrell-Poe, K. Water Quality & Monitoring; College of Agriculture and Life Sciences, University of Arizona: Tucson, AZ, USA, 2005. [Google Scholar]
  48. De Sousa, D.N.; Mozeto, A.A.; Carneiro, R.L.; Fadini, P.S. Electrical conductivity and emerging contaminant as markers of surface freshwater contamination by wastewater. Sci. Total Environ. 2014, 484, 19–26. [Google Scholar] [CrossRef]
  49. United States Environmental Protection Agency (US EPA). Monitoring and Assessing Water Quality - Volunteer Monitoring. Available online: http://water.epa.gov/type/rsl/monitoring/vms511.cfm (accessed on 17 January 2017).
  50. Minnesota Pollution Control Agency (MPCA). Nutrients: Phosphorus, Nitrogen Impact on Water Quality. Water Quality/Impaired Waters #3.22. May 2008. Available online: https://www.pca.state.mn.us/sites/default/files/wq-iw3-22.pdf (accessed on 17 January 2017).
  51. Li, H.; Wang, C.; Huang, X.; Hug, A. Spatial Assessment of Water Quality with Urbanization in 2007–2015, Shanghai, China. Remote Sens. 2018, 10, 1024. [Google Scholar] [CrossRef]
  52. Liu, C.; Huang, T.; Chen, L.; Tao, H. Recent Trends in Wastewater Flow and Pollutant Load Resulting from Urbanization in Shanghai. Environ. Res. 2014, 86, 433–444. [Google Scholar] [CrossRef]
  53. Zhou, T.; Wu, J.; Peng, S. Assessing the effects of landscape pattern on river water quality at multiple scales: A case study of the Dongjiang River watershed, China. Ecol. Indic. 2012, 23, 166–175. [Google Scholar] [CrossRef]
  54. Eduful, M.; Shively, D. Perceptions of urban land use and degradation of water bodies in Kumasi, Ghana. Habitat Int. 2015, 50, 206–213. [Google Scholar] [CrossRef]
  55. Sun, N.; Yearsley, J.; Baptiste, M.; Cao, Q.; Lettenmaier, D.P.; Nijssen, B. A spatially distributed model for assessment of the effects of changing land use and climate on urban stream quality. Hydrol. Process. 2016, 30, 4779–4798. [Google Scholar] [CrossRef]
  56. Haller, L.; Amedegnato, E.; Poté, J.; Wildi, W. Influence of Freshwater Sediment Characteristics on Persistence of Fecal Indicator Bacteria. Water Air Soil Pollut. 2009, 203, 217–227. [Google Scholar] [CrossRef]
  57. Doyle, M.P.; Erickson, M.C. Closing the Door on the Fecal Coliform Assay. Microbe 2006, 1, 162–163. [Google Scholar] [CrossRef] [Green Version]
  58. Glińska-Lewczuk, K.; Gołaś, I.; Koc, J.; Gotkowska-Płachta, A.; Harnisz, M.; Rochwerger, A. The impact of urban areas on the water quality gradient along a lowland river. Environ. Monit. Assess. 2016, 188, 624. [Google Scholar] [CrossRef] [PubMed] [Green Version]
  59. Santiago-Rodriguez, T.M.; Toranzos, G.A.; Arce-Nazario, J.A. Assessing the microbial quality of a tropical watershed with an urbanization gradient using traditional and alternate fecal indicators. J. Water Health 2016, 14, 796–807. [Google Scholar] [CrossRef]
  60. Kapoor, V.; Pitkänen, T.; Ryu, H.; Elk, M.; Wendell, D.; Santo Domingo, J.W. Distribution of human-specific bacteroidales and fecal indicator bacteria in an urban watershed impacted by sewage pollution, determined using RNA-and DNA-based quantitative PCR assays. Appl. Environ. Microbiol. 2015, 81, 91–99. [Google Scholar] [CrossRef]
  61. Ohad, S.; Vaizel-Ohayon, D.; Rom, M.; Guttman, J.; Berger, D.; Kravitz, V.; Pilo, S.; Huberman, Z.; Kashi, Y.; Rorman, E. Microbial Source Tracking in Adjacent Karst Springs. Appl. Environ. Microbiol. 2015, 81, 5037–5047. [Google Scholar] [CrossRef] [PubMed] [Green Version]
  62. Kim, J.Y.; Lee, H.; Lee, J.E.; Chung, M.-S.; Ko, G.P. Identification of Human and Animal Fecal Contamination after Rainfall in the Han River, Korea. Microbes Environ. 2013, 28, 187–194. [Google Scholar] [CrossRef] [PubMed] [Green Version]
  63. Kirs, M.; Kisand, V.; Wong, M.; Caffaro-Filho, R.A.; Moravcik, P.; Harwood, V.J.; Yoneyama, B.; Fujioka, R.S. Multiple lines of evidence to identify sewage as the cause of water quality impairment in an urbanized tropical watershed. Water Res. 2017, 116, 23–33. [Google Scholar] [CrossRef] [PubMed]
  64. Molina, M.; Hunter, S.; Cyterski, M.; Peed, L.A.; Kelty, C.A.; Sivaganesan, M.; Mooney, T.; Prieto, L.; Shanks, O.C. Factors affecting the presence of human-associated and fecal indicator real-time quantitative PCR genetic markers in urban-impacted recreational beaches. Water Res. 2014, 64, 196–208. [Google Scholar] [CrossRef]
  65. Zimmer-Faust, A.G.; Thulsiraj, V.; Marambio-Jones, C.; Cao, Y.; Griffith, J.F.; Holden, P.A.; Jay, J.A. Effect of freshwater sediment characteristics on the persistence of fecal indicator bacteria and genetic markers within a Southern California watershed. Water Res. 2017, 119, 1–11. [Google Scholar] [CrossRef] [PubMed]
  66. Fernandez, H.; Villanueva, M.P.; Mansilla, I.; Gonzalez, M.; Latif, F. Arcobacter butzleri and A. cryaerophilus in human, animals and food sources, in southern Chile. Braz. J. Microbiol. 2015, 46, 145–147. [Google Scholar] [CrossRef] [PubMed] [Green Version]
  67. Lee, C.; Agidi, S.; Marion, J.W.; Lee, J. Arcobacter in Lake Erie Beach Waters: An Emerging Gastrointestinal Pathogen Linked with Human-Associated Fecal Contamination. Appl. Environ. Microbiol. 2012, 78, 5511–5519. [Google Scholar] [CrossRef] [PubMed]
  68. Hausdorf, L.; Neumann, M.; Bergmann, I.; Sobiella, K.; Mundt, K.; Fröhling, A.; Schlüter, O.; Klocke, M. Occurrence and genetic diversity of Arcobacter spp. in a spinach-processing plant and evaluation of two Arcobacter-specific quantitative PCR assays. Syst. Appl. Microbiol. 2013, 36, 235–243. [Google Scholar] [CrossRef]
  69. Prouzet-Mauléon, V.; Labadi, L.; Bouges, N.; Ménard, A.; Mégraud, F. Arcobacter butzleri: Underestimated Enteropathogen. Emerg. Infect. Dis. 2006, 12, 307–309. [Google Scholar] [CrossRef]
  70. Ma, K.; Deng, Y.; Bai, Y.; Xu, D.; Chen, E.; Wu, H.; Li, B.; Gao, L. Rapid and simultaneous detection of Salmonella, Shigella, and Staphylococcus aureus in fresh pork using a multiplex real-time PCR assay based on immunomagnetic separation. Food Control 2014, 42, 87–93. [Google Scholar] [CrossRef]
  71. Beutin, L.; Krüger, U.; Krause, G.; Miko, A.; Martin, A.; Strauch, E. Evaluation of Major Types of Shiga Toxin 2e-Producing Escherichia coli Bacteria Present in Food, Pigs, and the Environment as Potential Pathogens for Humans. Appl. Environ. Microbiol. 2008, 74, 4806–4816. [Google Scholar] [CrossRef]
  72. Swift, C.; Best, E.L.; Powell, E.J.; Grant, K.A.; Frost, J.A. Applicability of a rapid duplex real-time PCR assay for speciation of Campylobacter jejuni and Campylobacter colidirectly from culture plates. FEMS Microbiol. Lett. 2003, 229, 237–241. [Google Scholar]
Figure 1. Sampling locations in Suzhou representing high, medium and low urban gradients (three each) selected for this study. Sampling locations are identified as 1-1, 1-2, 1-3 for high, 2-1, 2-2, 2-3 for medium and 3-1, 3-2 and 3-3 for low urban intensifications.
Ijerph 16 01739 g001
Figure 2. Land use types in high (1-1 to 1-3), medium (2-1 to 2-3) and low (3-1 to 3-3) urbanization locations. The land use type reported is for 1 km buffer zone.
Ijerph 16 01739 g002
Figure 3. The variation in total nitrogen (TN), total phosphorus (TP), nitrate-N (NO3-N) and nitrite-N (NO2-N) values observed in different sampling locations and seasons. The individual values for each parameter (A) and boxplots (B) with median value (line within each box), quartile interval (box), the minimum and maximum value (whiskers) are shown.
Ijerph 16 01739 g003
Figure 4. The variation in phosphate (PO4-P), ammonia-N (NH4-N), total organic carbon (TOC) and chlorophyll a (Chl a) values observed in different sampling locations and seasons. The individual values for each parameters (A) and boxplots (B) with median (line within each box), quartile interval (box), minimum and maximum value (whiskers) are shown.
Ijerph 16 01739 g004
Figure 5. The variation in the total viable count (TVC), total coliform (TC) and thermotolerant coliform (TTC) values observed in different sampling locations and seasons. The individual values for each parameters (A) and boxplots (B) with median value (line within each box), quartile interval (box), minimum and maximum value (whiskers) are shown.
Ijerph 16 01739 g005
Figure 6. Concentration of total Bacteroidales (a), human-associated Bacteroidales (b), and avian associated markers (c) in water samples collected from different locations in Suzhou and Huangshan. Comparison of fecal marker concentrations in Suzhou canals across different urban intensifications and Huangshan. (d) Total Bacteroidales and (e) human-associated Bacteroidales. The left panel shows individual values for each parameters (a–c) and the right panel shows boxplots (d and e) with median value (line within each box), quartile interval (box), minimum and maximum value (whiskers).
Ijerph 16 01739 g006
Figure 7. The abundance of Enterococcus spp. (a), Arcobacter butzleri (b) and comparison of six pathogens (c) in water samples collected from Suzhou canals and streams in Huangshan.
Ijerph 16 01739 g007
Table 1. Physicochemical and microbiological characteristics of water samples collected from nine sampling locations across three urban intensifications in winter and summer 2015 and 2016. Samples from the control locations (Huangshan) were collected in Summer 2016. The results of the statistical analysis (two-way analysis of variance (ANOVA)) is also shown in this table.
ParametersWinter 2015 and 2016
Range (Min-Max)
Summer 2015 and 2016
Range (Min-Max)
Control Location (Huangshan)p Values
HighMediumLowHighMediumLowUrbanizationSeason
Water temp. °C6–115.1–9.85.9–1028–34.126–33.428.8–34.424.3–28.20.001 **<0.001 ***
pH7.1–7.97.51–7.97.58–7.97.3–7.77.39–7.867.3–8.717.12–8.160.006 **0.178
Conductivity (µS/cm)422–832474–615395–573393–534389–544186–56345.6–1460.013 *<0.001 ***
TN (mg/L)2.85–16.52.14–4.481.57–4.212.11–4.671.92–10.580.96–4.630.29–1.170.001 **0.038 *
TP (mg/L)0.13–2.100.07–0.210.04–0.260.23–0.530.12–1.040.06–0.210.02–0.06<0.0010.102
NO3-N (mg/L)1.01–3.421.13–2.560.83–2.830.17–1.010.05–1.250.24–1.960.21–0.920.816<0.001 ***
NO2-N (mg/L)0.01–0.140.02–0.080.01–0.120.05–0.200.06–0.350.03–0.270.00–0.020.422<0.001 ***
PO4-P (μg/L)48–49714.37–121.5111.71–46.4592.78–31530.44–11716.11–88.93.44–28.93<0.001 ***0.002 **
NH4-N (mg/L)1.01–7.840.18–1.440.41–1.470.52–2.400.23–1.480.03–2.050.01–0.10<0.001 ***0.148
TOC (mg/L)1.99–42.33.17–13.233.55–13.83.72–20.83.75–233.67–15.61.31–3.350.9360.745
Chlorophyll a (µg/L)2.33–21.41.37–15.411.47-–6.563.39–68.862.7–50.1771.95–54.420.95–3.170.329<0.001 ***
Total viable count
(× 103 cfu/mL)
7–57.40.4–43.90.6–33.432–48.713.4–53.12–73.79.5–30.70.040 *0.055
Total coliform count
(× 103 cfu/mL)
3.733–102.067–8.2670.067–0.8673.2–22.10.2–2.40–3.90.098–0.9330.006 **0.696
Thermotolerant
coliform count (cfu/mL)
90–12055–850–23218–48018–2530–2330.5–170.036 *0.032 *
* Statistically significant difference at p < 0.05; ** Statistically significant difference at p < 0.01; *** Statistically significant difference at p < 0.001.
Table 2. Detection frequencies of pathogenic bacterial genes in water samples collected from Suzhou canals and streams in Huangshan.
Sample TypeNo. of Samples Tested (n)No. of Positive Samples a
Enterococcus spp.Arcobacter butzleri (hsp60)Shigella
(ipaH)
Campylobacter
(mapA)
Salmonella spp.STEC
(stx2)
Suzhou
Winter 201599 (100%)8 (89%)2 (22%)1 (11%)01 (11%)
Summer 201599 (100%)9 (100%)3 (33%)01 (11%)0
Winter 201699 (100%)02 (22%)3 (33%)2 (22%)7 (78%)
Summer 201699 (100%)9 (100%)6 (67%)01 (11%)6 (67%)
Huangshan
Summer 201633 (100%)3 (100%)1 (33%)002 (67%)
Total3939 (100%)29 (74%)14 (36%) 4 (10%)4 (10%)16 (41%)
a Considering DNQ’s (detected, not quantifiable) as positive samples.

