A Cross Sectional Examination of the Relation Between Depression and Frequency of Leisure Time Physical Exercise among the Elderly in Jinan, China


Abstract
1. Introduction
2. Materials and Methods
2.1. Study Population
2.2. Investigation and Measurements
2.3. Definitions of Hypertension, Previously Diagnosed Type 2 Diabetes Mellitus (PDM) and Depression
2.4. Statistical Analysis
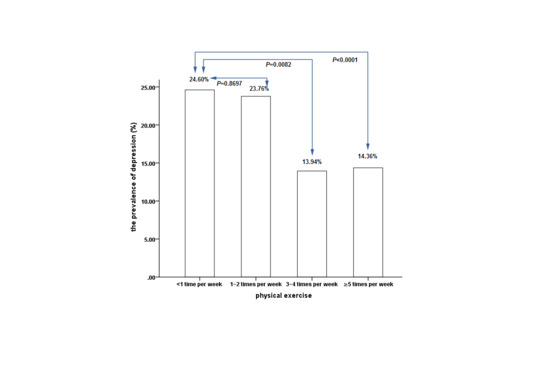
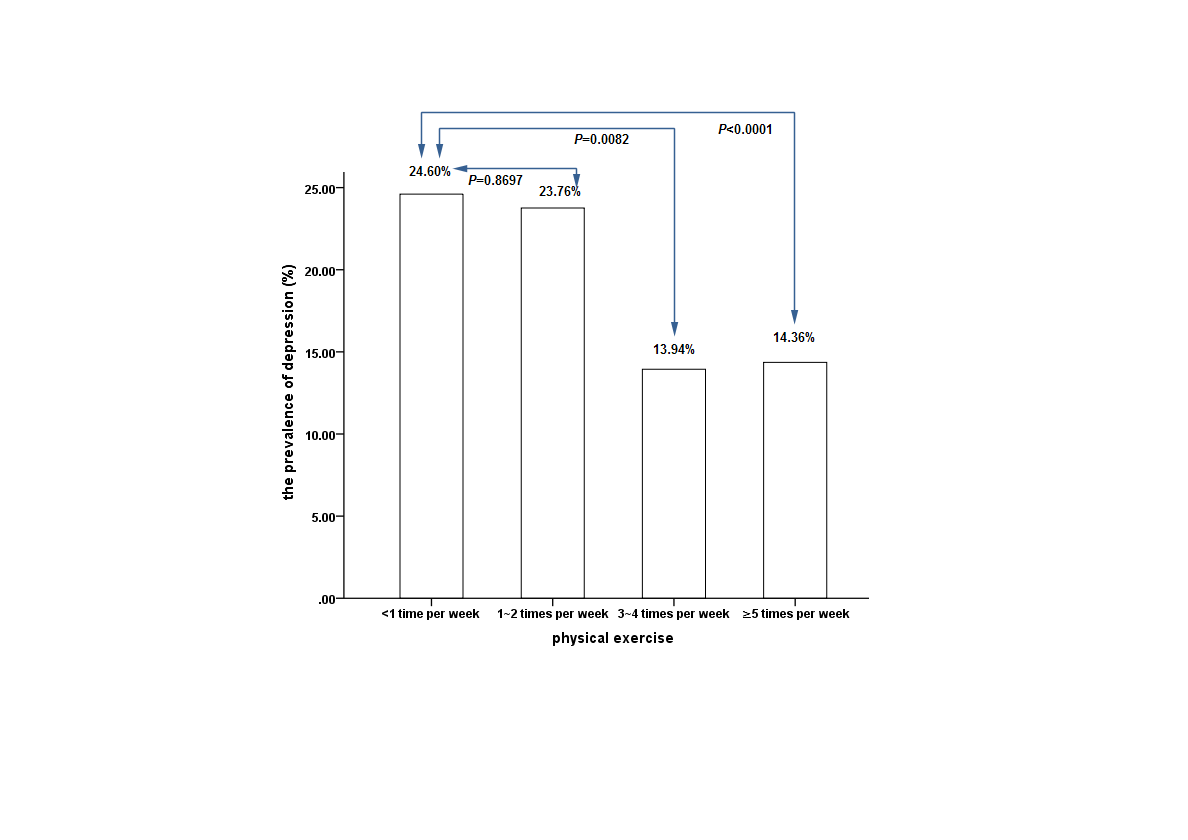
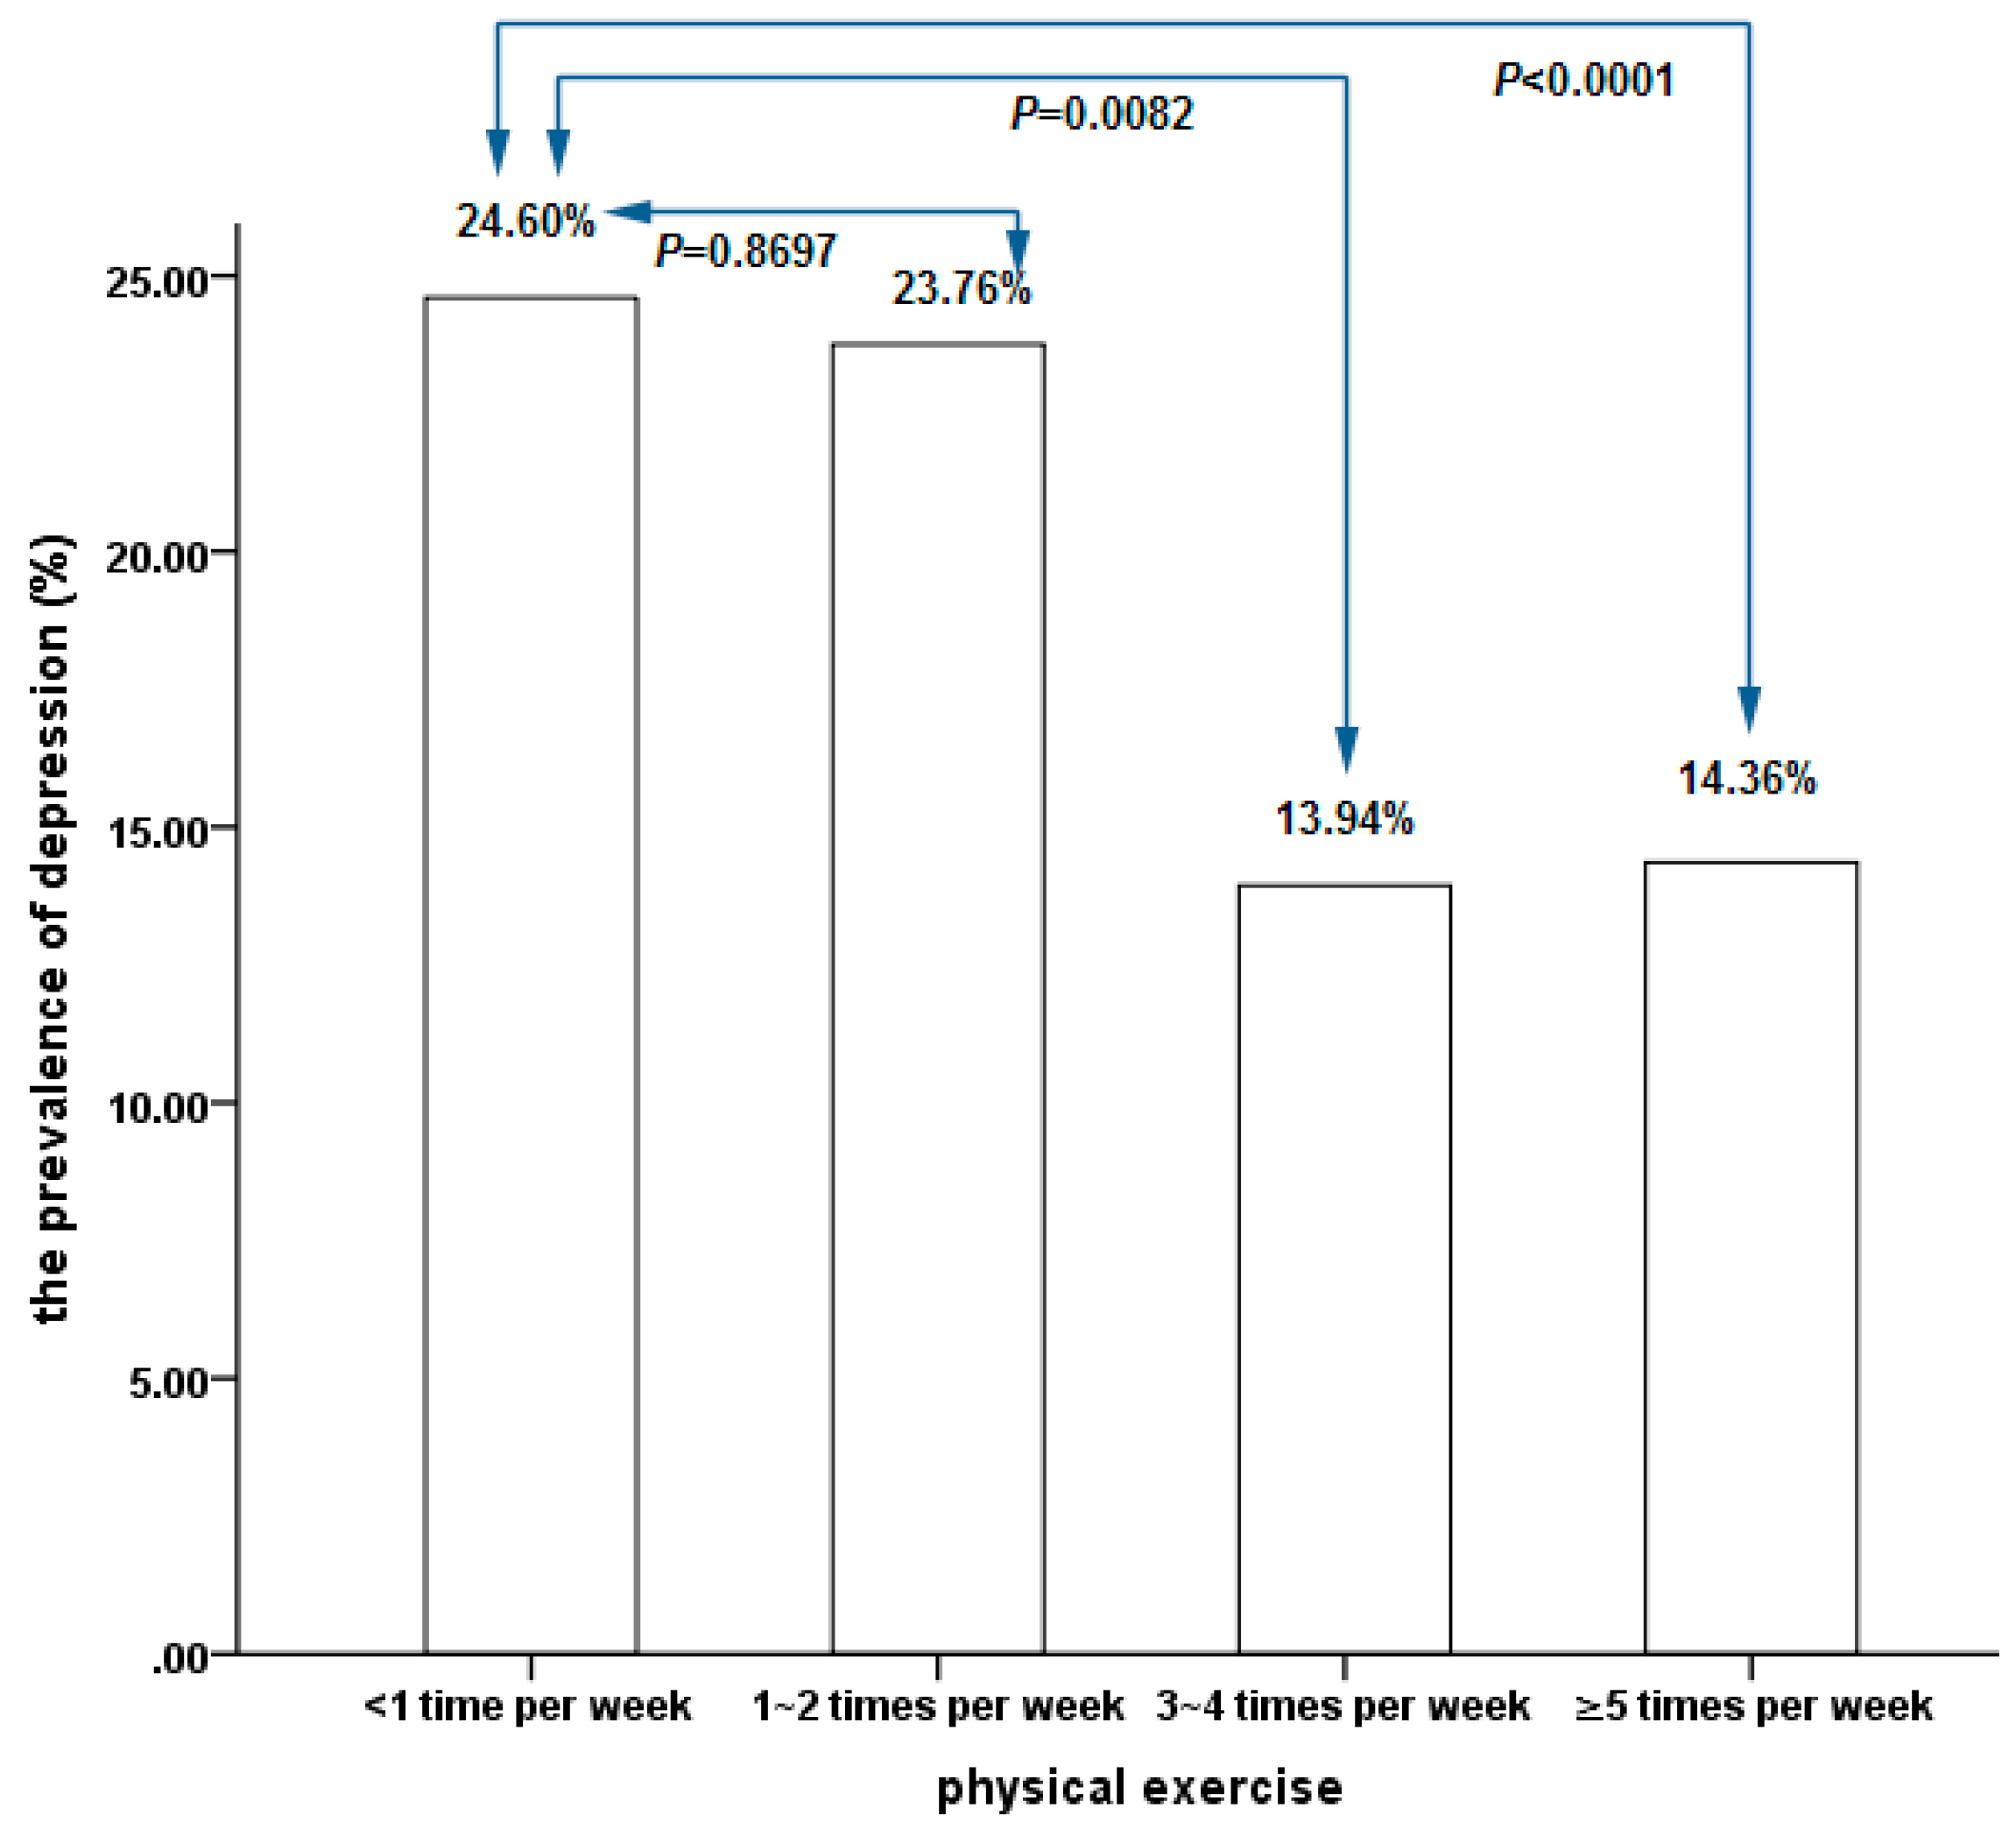
3. Results
4. Discussion
5. Conclusions
Author Contributions
Acknowledgments
Conflicts of Interest
References
- Serafini, G.; Pompili, M.; Borgwardt, S.; Houenou, J.; Geoffroy, P.A.; Jardri, R.; Girardi, P.; Amore, M. Brain changes in early-onset bipolar and unipolar depressive disorders: A systematic review in children and adolescents. Eur. Child Adolesc. Psychiatry 2014, 23, 1023–1041. [Google Scholar] [CrossRef] [PubMed]
- Meng, L.; Chen, D.; Yang, Y.; Zheng, Y.; Hui, R. Depression increases the risk of hypertension incidence: A meta-analysis of prospective cohort studies. J. Hypertens. 2012, 30, 842–851. [Google Scholar] [CrossRef] [PubMed]
- Vancampfort, D.; Correll, C.U.; Galling, B.; Probst, M.; De Hert, M.; Ward, P.B.; Rosenbaum, S.; Gaughran, F.; Lally, J.; Stubbs, B. Diabetes mellitus in people with schizophrenia, bipolar disorder and major depressive disorder: A systematic review and large scale meta-analysis. World Psychiatry 2016, 15, 166–174. [Google Scholar] [CrossRef] [PubMed]
- Almeida, O.P.; Hankey, G.J.; Yeap, B.B.; Golledge, J.; Flicker, L. Depression as a modifiable factor to decrease the risk of dementia. Transl. Psychiatry 2017, 7, e1117. [Google Scholar]
- Brunner, E.J.; Shipley, M.J.; Britton, A.R.; Stansfeld, S.A.; Heuschmann, P.U.; Rudd, A.G.; Wolfe, C.D.; Singh-Manoux, A.; Kivimaki, M. Depressive disorder, coronary heart disease, and stroke: Dose-response and reverse causation effects in the Whitehall II cohort study. Eur. J. Prev. Cardiol. 2014, 21, 340–346. [Google Scholar] [CrossRef] [PubMed]
- Pan, A.; Sun, Q.; Okereke, O.I.; Rexrode, K.M.; Hu, F.B. Depression and risk of stroke morbidity and mortality: A meta-analysis and systematic review. JAMA 2011, 306, 1241–1249. [Google Scholar] [CrossRef] [PubMed]
- Vos, T.; Allen, C.; Arora, M.; Barber, R.M.; Bhutta, Z.A.; Brown, A.; Carter, A.; Casey, D.C.; Charlson, F.J.; Chen, A.Z.; et al. Global, regional, and national incidence, prevalence, and years lived with disability for 310 diseases and injuries, 1990–2015: A systematic analysis for the Global Burden of Disease Study 2015. Lancet 2016, 388, 1545–1602. [Google Scholar] [CrossRef]
- Kalyani, R.R.; Ji, N.; Carnethon, M.; Bertoni, A.G.; Selvin, E.; Gregg, E.W.; Sims, M.; Golden, S.H. Diabetes, depressive symptoms, and functional disability in African Americans: The Jackson Heart Study. J. Diabetes Complicat. 2017, 17, 1–9. [Google Scholar] [CrossRef] [PubMed]
- Lunghi, C.; Zongo, A.; Moisan, J.; Grégoire, J.P.; Guénette, L. Factors associated with antidiabetic medication non-adherence in patients with incident comorbid depression. J. Diabetes Complicat. 2017, 31, 1200–1206. [Google Scholar] [CrossRef] [PubMed]
- Sin, N.L.; Kumar, A.D.; Gehi, A.K.; Whooley, M.A. Direction of Association Between Depressive Symptoms and Lifestyle Behaviors in Patients with Coronary Heart Disease: The Heart and Soul Study. Ann. Behav. Med. 2016, 50, 523–532. [Google Scholar] [CrossRef] [PubMed]
- Kaseva, K.; Rosenström, T.; Hintsa, T.; Pulkki-Råback, L.; Tammelin, T.; Lipsanen, J.; Yang, X.; Hintsanen, M.; Hakulinen, C.; Pahkala, K.; et al. Trajectories of Physical Activity Predict the Onset of Depressive Symptoms but Not Their Progression: A Prospective Cohort Study. J. Sports Med. 2016, 2016, 8947375. [Google Scholar] [CrossRef] [PubMed]
- Anagnostopoulos, A.; Ledergerber, B.; Jaccard, R.; Shaw, S.A.; Stoeckle, M.; Bernasconi, E.; Barth, J.; Calmy, A.; Berney, A.; Jenewein, J.; et al. Swiss HIV Cohort Study. Frequency of and Risk Factors for Depression among Participants in the Swiss HIV Cohort Study (SHCS). PLoS ONE 2015, 10, e0140943. [Google Scholar] [CrossRef] [PubMed]
- Yu, C.Q.; Chen, Y.P.; Lv, J.; Guo, Y.; Sherliker, P.; Bian, Z.; Zhou, H.Y.; Tan, Y.L.; Chen, J.S.; Chen, Z.M.; et al. Major depressive disorder in relation with coronary heart disease and stroke in Chinese adults aged 30-79 years. Beijing Da Xue Xue Bao 2016, 48, 465–471. [Google Scholar] [PubMed]
- Teychenne, M.; Ball, K.; Salmon, J. Physical activity and likelihood of depression in adults: A review. Prev. Med. 2008, 46, 397–411. [Google Scholar] [CrossRef] [PubMed]
- Ranjbar, E.; Memari, A.H.; Hafizi, S.; Shayestehfar, M.; Mirfazeli, F.S.; Eshghi, M.A. Depression and Exercise: A Clinical Review and Management Guideline. Asian J. Sports Med. 2015, 6, e24055. [Google Scholar] [CrossRef]
- Lok, N.; Lok, S.; Canbaz, M. The effect of physical activity on depressive symptoms and quality of life among elderly nursing home residents: Randomized controlled trial. Arch. Gerontol. Geriatr. 2017, 70, 92–98. [Google Scholar] [CrossRef] [PubMed]
- Ledochowski, L.; Stark, R.; Ruedl, G.; Kopp, M. Physical activity as therapeutic intervention for depression. Nervenarzt 2017, 88, 765–778. [Google Scholar] [CrossRef] [PubMed]
- Hallgren, M.; Nakitanda, O.A.; Ekblom, Ö.; Herring, M.P.; Owen, N.; Dunstan, D.; Helgadottir, B.; Forsell, Y. Habitual physical activity levels predict treatment outcomes in depressed adults: A prospective cohort study. Prev. Med. 2016, 88, 53–58. [Google Scholar] [CrossRef] [PubMed]
- Cooper-Patrick, L.; Ford, D.E.; Mead, L.A.; Chang, P.P.; Klag, M.J. Exercise and depression in midlife: A prospective study. Am. J. Public Health 1997, 87, 670–673. [Google Scholar] [CrossRef] [PubMed]
- Kritz-Silverstein, D.; Barrett-Connor, E.; Corbeau, C. Cross-sectional and prospective study of exercise and depressed mood in the elderly: The Rancho Bernardo study. Am. J. Epidemiol. 2001, 153, 596–603. [Google Scholar] [CrossRef] [PubMed]
- Memari, A.H.; Ghanouni, P.; Shayestehfar, M.; Ziaee, V.; Moshayedi, P. Effects of visual search vs. auditory tasks on postural control in children with autism spectrum disorder. Gait Posture 2014, 39, 229–234. [Google Scholar] [CrossRef] [PubMed]
- Memari, A.H.; Ghaheri, B.; Ziaee, V.; Kordi, R.; Hafizi, S.; Moshayedi, P. Physical activity in children and adolescents with autism assessed by triaxial accelerometry. Pediatr. Obes. 2013, 8, 150–158. [Google Scholar] [CrossRef] [PubMed]
- Memari, A.H.; Ziaee, V.; Beygi, S.; Moshayedi, P.; Mirfazeli, F.S. Overuse of psychotropic medications among children and adolescents with autism spectrum disorders: Perspective from a developing country. Res. Dev. Disabil. 2012, 33, 563–569. [Google Scholar] [CrossRef] [PubMed]
- Zung, W.W. A self-rating depression scale. Arch. Gen. Psychiatry 1965, 12, 63–70. [Google Scholar] [CrossRef] [PubMed]
- Wang, X.D.; Jiang, C.Q.; Ma, H. Rating Scales for Mental Health; Chinese Mental Health Journal Press: Beijing, China, 1999; Volume 12, pp. 253–256. [Google Scholar]
- Bridle, C.; Spanjers, K.; Patel, S.; Atherton, N.M.; Lamb, S.E. Effect of exercise on depression severity in older people: Systematic review and meta-analysis of randomised controlled trials. Br. J. Psychiatry 2012, 201, 180–185. [Google Scholar] [CrossRef] [PubMed]
- Schuch, F.B.; Vancampfort, D.; Richards, J.; Rosenbaum, S.; Ward, P.B.; Stubbs, B. Exercise as a treatment for depression: A meta-analysis adjusting for publication bias. J. Psychiatr. Res. 2016, 77, 42–51. [Google Scholar] [CrossRef] [PubMed]
- Schuch, F.B.; Vancampfort, D.; Rosenbaum, S.; Richards, J.; Ward, P.B.; Veronese, N.; Solmi, M.; Cadore, E.L.; Stubbs, B. Exercise for depression in older adults: A meta-analysis of randomized controlled trials adjusting for publication bias. Rev. Bras. Psiquiatr. 2016, 38, 247–254. [Google Scholar] [CrossRef] [PubMed]
- Mammen, G.; Faulkner, G. Physical activity and the prevention of depression: A systematic review of prospective studies. Am. J. Prev. Med. 2013, 45, 649–657. [Google Scholar] [CrossRef] [PubMed]
- Schutzer, K.A.; Graves, B.S. Barriers and motivations to exercise in older adults. Prev. Med. 2004, 39, 1056–1061. [Google Scholar] [CrossRef] [PubMed]
- Aoyagi, Y.; Shephard, R.J. Habitual physical activity and health in the elderly: The Nakanojo Study. Geriatr. Gerontol. Int. 2010, 10, S236–S243. [Google Scholar] [CrossRef] [PubMed]
- Thomas, E.E.; De Vito, G.; Macaluso, A. Speed training with body weight unloading improves walking energy cost and maximal speed in 75- to 85-yearold healthy women. J. Appl. Physiol. 2007, 103, 1598–1603. [Google Scholar] [CrossRef] [PubMed]
- Nemoto, K.; Gen-no, H.; Masuki, S.; Okazaki, K.; Nose, H. Effects of high-intensity interval walking training on physical fitness and blood pressure in middle-aged and older people. Mayo Clin. Proc. 2007, 82, 803–811. [Google Scholar] [CrossRef] [PubMed]
- Buman, M.P.; Hekler, E.B.; Haskell, W.L.; Pruitt, L.; Conway, T.L.; Cain, K.L.; Sallis, J.F.; Saelens, B.E.; Frank, L.D.; King, A.C. Objective light-intensity physical activity associations with rated health in older adults. Am. J. Epidemiol. 2010, 172, 1155–1165. [Google Scholar] [CrossRef] [PubMed]
- Chang, Y.C.; Lu, M.C.; Hu, I.H.; Wu, W.I.; Hu, S.C. Effects of different amounts of exercise on preventing depressive symptoms in community-dwelling older adults: A prospective cohort study in Taiwan. BMJ. Open 2017, 7, e014256. [Google Scholar] [CrossRef] [PubMed]
- Chen, R.; Copeland, J.R.; Wei, L. A meta-analysis of epidemiological studies in depression of older people in the People’s Republic of China. Int. J. Geriatr. Psychiatry 1999, 14, 821–830. [Google Scholar] [CrossRef]
- Guo, J.; Liu, C.; Wang, X.; Qu, Z.; Zhang, W.; Zhang, X. Relationships between depression, pain and sleep quality with doctor visits among community-based adults in north-west China. Public Health 2017, 147, 30–38. [Google Scholar] [CrossRef] [PubMed]
- Li, Y.; Chen, C.; Tu, H.; Cao, W.; Fan, S.; Ma, Y.; Xu, Y.; Hua, Q. Prevalence and risk factors for depression in older people in Xi’an China: A community-based study. Int. J. Geriatr. Psychiatry 2012, 27, 31–39. [Google Scholar]
- Cao, W.; Guo, C.; Ping, W.; Tan, Z.; Guo, Y.; Zheng, J. A Community-Based Study of Quality of Life and Depression among Older Adults. Int. J. Environ. Res. Public Health 2016, 13, 693. [Google Scholar] [CrossRef] [PubMed]
- Li, N.; Pang, L.; Chen, G.; Song, X.; Zhang, J.; Zheng, X. Risk factors for depression in older adults in Beijing. Can. J. Psychiatry 2011, 56, 466–473. [Google Scholar] [CrossRef] [PubMed]
- Kleinberg, A.; Aluoja, A.; Vasar, V. Point prevalence of major depression in Estonia. Results from the 2006 Estonian Health Survey. Eur. Psychiatry 2010, 25, 485–490. [Google Scholar] [CrossRef] [PubMed]
- Kolchakova, P.Y.; Akabaliev, V.H. A study of the effect of age on depressivity in Bulgarian urban population. Folia. Med. 2003, 45, 11–15. [Google Scholar]
- Silva, M.T.; Galvao, T.F.; Martins, S.S.; Pereira, M.G. Prevalence of depression morbidity among Brazilian adults: A systematic review and meta-analysis. Rev. Bras. Psiquiatr. 2014, 36, 262–270. [Google Scholar] [CrossRef] [PubMed]
- Jung, S.J.; Woo, H.T.; Cho, S.; Park, K.; Jeong, S.; Lee, Y.J.; Kang, D.; Shin, A. Association between body size, weight change and depression: Systemic review and meta-analysis. Br. J. Psychiatry 2017, 211, 14–21. [Google Scholar] [CrossRef] [PubMed]
- Qian, J.; Li, N.; Ren, X. Obesity and depressive symptoms among Chinese people aged 45 and over. Sci. Rep. 2017, 7, 45637. [Google Scholar] [CrossRef] [PubMed]
- Aluoja, A.; Leinsalu, M.; Shlik, J.; Vasar, V.; Luuk, K. Symptoms of depression in the Estonian population: Prevalence, sociodemographic correlates and social adjustment. J. Affect. Disord. 2004, 78, 27–35. [Google Scholar] [CrossRef]
- Maatouk, I.; Herzog, W.; Böhlen, F.; Quinzler, R.; Löwe, B.; Saum, KU.; Brenner, H.; Wild, B. Association of hypertension with depression and generalized anxiety symptoms in a large population-based sample of older adults. J. Hypertens. 2016, 34, 1711–1720. [Google Scholar] [CrossRef] [PubMed]
- Hsu, Y.M.; Su, L.T.; Chang, H.M.; Sung, F.C.; Lyu, S.Y.; Chen, P.C. Diabetes mellitus and risk of subsequent depression: A longitudinal study. Int. J. Nurs. Stud. 2012, 49, 437–444. [Google Scholar] [CrossRef] [PubMed]
- Luger, T.M.; Suls, J.; Vander Weg, M.W. How robust is the association between smoking and depression in adults? A meta-analysis using linear mixed-effects models. Addict. Behav. 2014, 39, 1418–1429. [Google Scholar] [CrossRef] [PubMed]
- Graham, K.; Massak, A.; Demers, A.; Rehm, J. Does the association between alcohol consumption and depression depend on how they are measured? Alcohol Clin. Exp. Res. 2007, 31, 78–88. [Google Scholar] [CrossRef] [PubMed]
- Zhou, X.; Bi, B.; Zheng, L.; Li, Z.; Yang, H.; Song, H.; Sun, Y. The prevalence and risk factors for depression symptoms in a rural Chinese sample population. PLoS ONE 2014, 9, e99692. [Google Scholar] [CrossRef] [PubMed]
- McMartin, S.E.; Jacka, F.N.; Colman, I. The association between fruit and vegetable consumption and mental health disorders: Evidence from five waves of a national survey of Canadians. Prev. Med. 2013, 56, 225–230. [Google Scholar] [CrossRef] [PubMed]
- Meyer, B.J.; Kolanu, N.; Griffiths, D.A.; Grounds, B.; Howe, P.R.; Kreis, I.A. Food groups and fatty acids associated with self-reported depression: An analysis from the Australian National Nutrition and Health Surveys. Nutrition 2013, 29, 1042–1047. [Google Scholar] [CrossRef] [PubMed]
- Roh, H.W.; Hong, C.H.; Lee, Y.; Oh, B.H.; Lee, K.S.; Chang, K.J.; Kang, D.R.; Kim, J.; Lee, S.; Back, J.H.; et al. Participation in Physical, Social, and Religious Activity and Risk of Depression in the Elderly: A Community-Based Three-Year Longitudinal Study in Korea. PLoS ONE 2015, 10, e0132838. [Google Scholar] [CrossRef] [PubMed]
- Bouwman, V.; Adriaanse, M.C.; Van’t Riet, E.; Snoek, F.J.; Dekker, J.M.; Nijpels, G. Depression, anxiety and glucose metabolism in the general Dutch population: The new Hoorn study. PLoS ONE 2010, 5, e9971. [Google Scholar] [CrossRef] [PubMed]
- Nouwen, A.; Nefs, G.; Caramlau, I.; Connock, M.; Winkley, K.; Lloyd, C.E.; Peyrot, M.; Pouwer, F.; European Depression in Diabetes Research Consortium. Prevalence of depression in individuals with impaired glucose metabolism or undiagnosed diabetes: A systematic review and meta-analysis of the European Depression in Diabetes (EDID) Research Consortium. Diabetes Care 2011, 34, 752–762. [Google Scholar] [CrossRef] [PubMed]
- Sun, J.C.; Xu, M.; Lu, J.L.; Bi, Y.F.; Mu, Y.M.; Zhao, J.J.; Liu, C.; Chen, L.L.; Shi, L.X.; Li, Q.; et al. Associations of depression with impaired glucose regulation, newly diagnosed diabetes and previously diagnosed diabetes in Chinese adults. Diabet. Med. 2015, 32, 935–943. [Google Scholar] [CrossRef] [PubMed]
- De, G.M.; Anderson, R.; Freedland, K.E.; Clouse, R.E.; Lustman, P.J. Association of depression and diabetes complications: A meta-analysis. Psychosom. Med. 2001, 63, 619–630. [Google Scholar]
- Schildkraut, J.J. Neuropharmacology of the affective disorders. Annu. Rev. Pharmacol. 1973, 13, 427–454. [Google Scholar] [CrossRef] [PubMed]
- Schildkraut, J.J. The catecholamine hypothesis of affective disorders: A review of supporting evidence. 1965. J. Neuropsychiatry Clin. Neurosci. 1995, 7, 524–533. [Google Scholar] [PubMed]
- Vawter, M.P.; Freed, W.J.; Kleinman, J.E. Neuropathology of bipolar disorder. Biol. Psychiatry 2000, 48, 486–504. [Google Scholar] [CrossRef]
- Sinaei, M.; Kargarfard, M. The evaluation of BMI and serum beta-endorphin levels: The study of acute exercise intervention. J. Sports Med. Phys. Fit. 2015, 55, 488–494. [Google Scholar]
- Daniele, T.M.D.C.; de Bruin, P.F.C.; Rios, E.R.V.; de Bruin, V.M.S. Effects of exercise on depressive behavior and striatal levels of norepinephrine, serotonin and their metabolites in sleep-deprived mice. Behav. Brain Res. 2017, 332, 16–22. [Google Scholar] [CrossRef] [PubMed]
- Post, R.M.; Kotin, J.; Goodwin, F.K.; Gordon, E.K. Psychomotor activity and cerebrospinal fluid amine metabolites in affective illness. Am. J. Psychiatry 1973, 130, 67–72. [Google Scholar] [CrossRef] [PubMed]
- Taylor, W.D.; McQuoid, D.R.; Payne, M.E.; Zannas, A.S.; MacFall, J.R.; Steffens, D.C. Hippocampus atrophy and the longitudinal course of late-life depression. Am. J. Geriatr. Psychiatry 2014, 22, 1504–1512. [Google Scholar] [CrossRef] [PubMed]
- Shad, M.U.; Muddasani, S.; Rao, U. Gray matter differences between healthy and depressed adolescents: A voxel-based morphometry study. J. Child Adolesc. Psychopharmacol. 2012, 22, 190–197. [Google Scholar] [CrossRef] [PubMed]
- Charlton, R.A.; Lamar, M.; Zhang, A.; Yang, S.; Ajilore, O.; Kumar, A. White-matter tract integrity in late-life depression: Associations with severity and cognition. Psychol. Med. 2014, 44, 1427–1437. [Google Scholar] [CrossRef] [PubMed]
- Erickson, K.I.; Leckie, R.L.; Weinstein, A.M. Physical activity, fitness, and gray matter volume. Neurobiol. Aging 2014, 35, S20–S28. [Google Scholar] [CrossRef] [PubMed]
- Gow, A.J.; Bastin, M.E.; Muñoz Maniega, S.; Valdés Hernández, M.C.; Morris, Z.; Murray, C.; Royle, N.A.; Starr, J.M.; Deary, I.J.; Wardlaw, J.M. Neuroprotective lifestyles and the aging brain: Activity, atrophy, and white matter integrity. Neurology 2012, 79, 1802–1808. [Google Scholar] [CrossRef] [PubMed]
- Chen, L.M.; Zhang, A.P.; Wang, F.F.; Tan, C.X.; Gao, Y.; Huang, C.X.; Zhang, Y.; Jiang, L.; Zhou, C.N.; Chao, F.L.; et al. Running exercise protects the capillaries in white matter in a rat model of depression. J. Comp. Neurol. 2016, 524, 3577–3586. [Google Scholar] [CrossRef] [PubMed]


| Characteristic | Males (n = 504) | Females (n = 1100) | Total (n = 1604) | p |
|---|---|---|---|---|
| Age (years) | 64.44 ± 9.21 | 63.37 ± 9.67 | 63.71 ± 9.54 | 0.0372 * |
| BMI (kg/m2) | 25.34 ± 3.35 | 25.67 ± 8.95 | 25.56 ± 7.65 | 0.2865 |
| TG (mg/dL) | 1.45 ± 1.01 | 1.50 ± 0.92 | 1.49 ± 0.95 | 0.3408 |
| TC (mg/dL) | 4.93 ± 0.85 | 5.39 ± 1.04 | 5.25 ± 1.01 | <0.0001 ** |
| In marriage, n (%) | 465 (92.26) | 830 (75.45) | 1295 (80.74) | <0.0001 ** |
| Smoking, n (%) | 197 (39.09) | 37 (3.36) | 234 (14.59) | <0.0001 ** |
| Alcohol drinking, n (%) | 163 (32.34) | 26 (2.36) | 189 (11.78) | <0.0001 ** |
| Hypertension, n (%) | 345 (68.45) | 663 (60.27) | 1008 (62.84) | 0.0016 ** |
| PDM, n (%) | 77 (15.28) | 123 (11.18) | 200 (12.47) | 0.0212 * |
| Regular exercise, n (%) | 0.3924 | |||
| <1 time per week | 66 (13.10) | 186 (16.91) | 252 (15.71) | |
| 1–2 times per week | 39 (7.74) | 62 (5.64) | 101 (6.30) | |
| 3–4 times per week | 53 (10.52) | 112 (10.18) | 165 (10.29) | |
| ≥5 times per week | 346 (68.64) | 740 (67.27) | 1086 (67.70) | |
| Soy food intake, n (%) | 0.0122 * | |||
| ≥1 times per day | 95 (18.85) | 172 (15.64) | 267 (16.65) | |
| 3–6 times per week | 166 (32.94) | 346 (31.45) | 512 (31.92) | |
| 1–2 times per week | 203 (40.28) | 443 (40.27) | 646 (40.27) | |
| Not eating | 40 (7.93) | 139 (12.64) | 179 (11.16) | |
| Milk food intake, n (%) | 0.2299 | |||
| ≥1 times per day | 173 (34.33) | 431 (39.18) | 604 (37.66) | |
| 3–6 times per week | 71 (14.09) | 124 (11.27) | 195 (12.16) | |
| 1–2 times per week | 77 (15.28) | 158 (14.36) | 235 (14.65) | |
| Not drinking | 183 (36.30) | 387 (35.19) | 570 (35.53) | |
| Vegetable and fruit intake, n (%) | 0.5127 | |||
| ≤1 times per day | 41 (8.13) | 76 (6.91) | 117 (7.29) | |
| 2–3 times per day | 402 (79.76) | 886 (80.55) | 1288 (80.30) | |
| 4–5 times per day | 47 (9.33) | 113 (10.27) | 160 (9.98) | |
| ≥5 times per day | 14 (2.78) | 25 (2.27) | 39 (2.43) | |
| Meat intake, n (%) | <0.0001 ** | |||
| ≥200 g per day | 34 (6.75) | 29 (2.64) | 63 (3.93) | |
| 50–200 g per day | 189 (37.50) | 318 (28.91) | 507 (31.61) | |
| 150– <350 g per week | 173 (34.33) | 358 (32.55) | 531 (33.10) | |
| <150 g per week | 108 (21.43) | 395 (35.91) | 503 (31.36) | |
| Depression, n (%) | 0.2073 | |||
| No depression | 438 (86.90) | 901 (81.91) | 1339 (83.48) | |
| Minor depression | 54 (10.71) | 132 (15.09) | 220 (13.72) | |
| Medium depression | 11(2.18) | 30 (2.73) | 41 (2.56) | |
| Major depression | 1 (0.21) | 3 (0.27) | 4 (0.24) |
| Characteristic | Depression (n = 265) | No depression (n = 1339) | p |
|---|---|---|---|
| Age(years) | 64.66 ± 10.17 | 63.52 ± 9.40 | 0.0768 |
| BMI (kg/m2) | 25.22 ± 3.64 | 25.63 ± 8.21 | 0.1938 |
| TG (mg/dL) | 1.57 ± 1.07 | 1.47 ± 0.92 | 0.1470 |
| TC (mg/dL) | 5.27 ± 1.23 | 5.24 ± 0.95 | 0.7448 |
| Female, n (%) | 199 (75.09) | 901 (67.29) | 0.0124 * |
| In marriage, n (%) | 196 (73.96) | 1099 (82.08) | 0.0022 ** |
| Smoking, n (%) | 40 (15.09) | 194 (14.49) | 0.8347 |
| Alcohol drinking, n (%) | 32 (12.08) | 157 (11.73) | 0.8716 |
| Hypertension, n (%) | 176 (66.42) | 832 (62.14) | 0.1878 |
| PDM, n (%) | 44 (16.60) | 156 (11.65) | 0.0257 * |
| Regular exercise, n (%) | 0.0001 ** | ||
| <1 time per week | 62 (23.40) | 190 (14.19) | |
| 1–2 times per week | 24 (9.06) | 77 (5.75) | |
| 3–4 times per week | 23 (8.68) | 142 (10.60) | |
| ≥5 times per week | 156 (58.87) | 930 (69.45) | |
| Soy food intake, n (%) | 0.3066 | ||
| ≥1 times per day | 27 (10.19) | 240 (17.92) | |
| times per week | 102 (38.49) | 410 (30.62) | |
| 1–2 times per week | 106 (40.00) | 540 (40.33) | |
| Not eating | 30 (11.32) | 149 (11.13) | |
| Milk food intake, n (%) | 0.2992 | ||
| ≥1 times per day | 91 (34.34) | 513 (38.31) | |
| 3–6 times per week | 33 (12.45) | 162 (12.10) | |
| 1–2 times per week | 43 (16.23) | 192 (14.34) | |
| Not drinking | 98 (36.98) | 472 (35.25) | |
| Vegetable and fruit intake, n (%) | 0.2724 | ||
| ≤1 times per day | 27 (10.19) | 90 (6.72) | |
| 2–3 times per day | 205 (77.36) | 1083 (80.88) | |
| 4–5 times per day | 26 (9.81) | 134 (10.01) | |
| ≥5 times per day | 7 (2.64) | 32 (2.39) | |
| Meat intake, n (%) | 0.6838 | ||
| ≥200g per day | 9 (3.40) | 54 (4.03) | |
| 50–200 g per day | 85 (32.08) | 422 (31.52) | |
| 150– <350 g per week | 94 (35.47) | 437 (32.64) | |
| <150 g per week | 77 (29.06) | 426 (31.81) |
| Variables | Model1 | Model2 | Model3 | Model4 |
|---|---|---|---|---|
| Regular exercise | ||||
| <1 time per week | ref | ref | ref | ref |
| 1–2 times per week | 0.996 (0.585, 1.697) | 1.044 (0.612, 1.783) | 1.125 (0.656, 1.928) | 1.137 (0.661, 1.953) |
| 3–4 times per week | 0.495 (0.293, 0.835) | 0.505 (0.299, 0.854) | 0.531 (0.313, 0.900) | 0.516 (0.304, 0.875) |
| ≥5 times per week | 0.509 (0.366, 0.709) | 0.519 (0.372, 0.724) | 0.541 (0.387, 0.756) | 0.548 (0.392, 0.768) |
| Gender | ||||
| male | ref | ref | ref | |
| female | 1.447 (1.069, 1.957) | 1.381 (1.013, 1.883) | 1.382 (1.011, 1.888) | |
| Marital status | ||||
| Married | ref | ref | ||
| Not married | 1.426 (1.038, 1.959) | 1.411 (1.024, 1.945) | ||
| PDM | ||||
| no | ref | ref | ||
| yes | 1.478 (1.020, 2.142) | 1.511 (1.040, 2.197) | ||
| Soy food intake, n (%) | ||||
| ≥1 times per day | ref | |||
| 3–6 times per week | 2.187 (1.383, 3.459) | |||
| 1–2 times per week | 1.689 (1.072, 2.661) | |||
| Not eating | 1.570 (0.889, 2.772) |
© 2018 by the authors. Licensee MDPI, Basel, Switzerland. This article is an open access article distributed under the terms and conditions of the Creative Commons Attribution (CC BY) license (http://creativecommons.org/licenses/by/4.0/).
Share and Cite
Wang, S.; Ma, W.; Wang, S.-M.; Yi, X. A Cross Sectional Examination of the Relation Between Depression and Frequency of Leisure Time Physical Exercise among the Elderly in Jinan, China. Int. J. Environ. Res. Public Health 2018, 15, 2041. https://doi.org/10.3390/ijerph15092041
Wang S, Ma W, Wang S-M, Yi X. A Cross Sectional Examination of the Relation Between Depression and Frequency of Leisure Time Physical Exercise among the Elderly in Jinan, China. International Journal of Environmental Research and Public Health. 2018; 15(9):2041. https://doi.org/10.3390/ijerph15092041
Chicago/Turabian StyleWang, Shukang, Wei Ma, Shu-Mei Wang, and Xiangren Yi. 2018. "A Cross Sectional Examination of the Relation Between Depression and Frequency of Leisure Time Physical Exercise among the Elderly in Jinan, China" International Journal of Environmental Research and Public Health 15, no. 9: 2041. https://doi.org/10.3390/ijerph15092041
APA StyleWang, S., Ma, W., Wang, S.-M., & Yi, X. (2018). A Cross Sectional Examination of the Relation Between Depression and Frequency of Leisure Time Physical Exercise among the Elderly in Jinan, China. International Journal of Environmental Research and Public Health, 15(9), 2041. https://doi.org/10.3390/ijerph15092041