Dialysis Membranes Influence Perfluorochemical Concentrations and Liver Function in Patients on Hemodialysis

 ,
, 

Abstract
:
1. Introduction
2. Materials and Methods
2.1. Ethics Statement
2.2. Inclusion and Exclusion Criteria
2.3. Data Collection
2.4. Measurement of PFOA and PFOS
2.5. Statistical Analysis
3. Results
4. Discussion
5. Conclusions
Author Contributions
Funding
Conflicts of Interest
References
- Jensen, A.A.; Leffers, H. Emerging endocrine disrupters: Perfluoroalkylated substances. Int. J. Androl. 2008, 31, 161–169. [Google Scholar] [CrossRef] [PubMed]
- Maggi, F.; Bramucci, M.; Cecchini, C.; Coman, M.M.; Cresci, A.; Cristalli, G.; Lupidi, G.; Papa, F.; Quassinti, L.; Sagratini, G.; et al. Composition and biological activity of essential oil of Achillea ligustica All. (Asteraceae) naturalized in central Italy: Ideal candidate for anti-cariogenic formulations. Fitoterapia 2009, 80, 313–319. [Google Scholar] [CrossRef] [PubMed]
- Kemper, R.A.; Nabb, D.L. In vitro studies in microsomes from rat and human liver, kidney, and intestine suggest that perfluorooctanoic acid is not a substrate for microsomal UDP-glucuronosyltransferases. Drug Chem. Toxicol. 2005, 28, 281–287. [Google Scholar] [CrossRef] [PubMed]
- Johansson, N.; Fredriksson, A.; Eriksson, P. Neonatal exposure to perfluorooctane sulfonate (PFOS) and perfluorooctanoic acid (PFOA) causes neurobehavioural defects in adult mice. Neurotoxicology 2008, 29, 160–169. [Google Scholar] [CrossRef] [PubMed]
- Apelberg, B.J.; Witter, F.R.; Herbstman, J.B.; Calafat, A.M.; Halden, R.U.; Needham, L.L.; Goldman, L.R. Cord serum concentrations of perfluorooctane sulfonate (PFOS) and perfluorooctanoate (PFOA) in relation to weight and size at birth. Environ. Health Perspect. 2007, 115, 1670–1676. [Google Scholar] [CrossRef] [PubMed]
- Joensen, U.N.; Bossi, R.; Leffers, H.; Jensen, A.A.; Skakkebaek, N.E.; Jorgensen, N. Do perfluoroalkyl compounds impair human semen quality? Environ. Health Perspect. 2009, 117, 923–927. [Google Scholar] [CrossRef] [PubMed]
- Lin, C.Y.; Chen, P.C.; Lin, Y.C.; Lin, L.Y. Association among serum perfluoroalkyl chemicals, glucose homeostasis, and metabolic syndrome in adolescents and adults. Diabetes Care 2009, 32, 702–707. [Google Scholar] [CrossRef] [PubMed]
- Dallaire, R.; Dewailly, E.; Pereg, D.; Dery, S.; Ayotte, P. Thyroid function and plasma concentrations of polyhalogenated compounds in Inuit adults. Environ. Health Perspect. 2009, 117, 1380–1386. [Google Scholar] [CrossRef] [PubMed]
- Lin, C.Y.; Lin, L.Y.; Wen, T.W.; Lien, G.W.; Chien, K.L.; Hsu, S.H.; Liao, C.C.; Sung, F.C.; Chen, P.C.; Su, T.C. Association between levels of serum perfluorooctane sulfate and carotid artery intima-media thickness in adolescents and young adults. Int. J. Cardiol. 2013, 168, 3309–3316. [Google Scholar] [CrossRef] [PubMed]
- Lin, C.Y.; Lin, L.Y.; Chiang, C.K.; Wang, W.J.; Su, Y.N.; Hung, K.Y.; Chen, P.C. Investigation of the associations between low-dose serum perfluorinated chemicals and liver enzymes in US adults. Am. J. Gastroenterol. 2010, 105, 1354–1363. [Google Scholar] [CrossRef] [PubMed]
- Lin, A.Y.; Panchangam, S.C.; Lo, C.C. The impact of semiconductor, electronics and optoelectronic industries on downstream perfluorinated chemical contamination in Taiwanese rivers. Environ. Pollut. 2009, 157, 1365–1372. [Google Scholar] [CrossRef] [PubMed]
- Butenhoff, J.L.; Kennedy, G.L., Jr.; Hinderliter, P.M.; Lieder, P.H.; Jung, R.; Hansen, K.J.; Gorman, G.S.; Noker, P.E.; Thomford, P.J. Pharmacokinetics of perfluorooctanoate in cynomolgus monkeys. Toxicol. Sci. 2004, 82, 394–406. [Google Scholar] [CrossRef] [PubMed]
- Olsen, G.W.; Burris, J.M.; Ehresman, D.J.; Froehlich, J.W.; Seacat, A.M.; Butenhoff, J.L.; Zobel, L.R. Half-life of serum elimination of perfluorooctanesulfonate, perfluorohexanesulfonate, and perfluorooctanoate in retired fluorochemical production workers. Environ. Health Perspect. 2007, 115, 1298–1305. [Google Scholar] [CrossRef] [PubMed]
- Shankar, A.; Xiao, J.; Ducatman, A. Perfluoroalkyl chemicals and chronic kidney disease in US adults. Am. J. Epidemiol. 2011, 174, 893–900. [Google Scholar] [CrossRef] [PubMed]
- Liu, W.S.; Lai, Y.T.; Chan, H.L.; Li, S.Y.; Lin, C.C.; Liu, C.K.; Tsou, H.H.; Liu, T.Y. Associations between perfluorinated chemicals and serum biochemical markers and performance status in uremic patients under hemodialysis. PLoS ONE 2018, 13, e0200271. [Google Scholar] [CrossRef] [PubMed]
- Sarnak, M.J.; Levey, A.S.; Schoolwerth, A.C.; Coresh, J.; Culleton, B.; Hamm, L.L.; McCullough, P.A.; Kasiske, B.L.; Kelepouris, E.; Klag, M.J.; et al. Kidney disease as a risk factor for development of cardiovascular disease: A statement from the American Heart Association Councils on Kidney in Cardiovascular Disease, High Blood Pressure Research, Clinical Cardiology, and Epidemiology and Prevention. Circulation 2003, 108, 2154–2169. [Google Scholar] [CrossRef] [PubMed]
- Liu, W.S.; Wu, Y.L.; Li, S.Y.; Yang, W.C.; Chen, T.W.; Lin, C.C. The waveform fluctuation and the clinical factors of the initial and sustained erythropoietic response to continuous erythropoietin receptor activator in hemodialysis patients. Sci. World J. 2012, 2012, 157437. [Google Scholar] [CrossRef] [PubMed]
- Ronco, C.; Clark, W.R. Haemodialysis membranes. Nat. Rev. Nephrol. 2018, 14, 394–410. [Google Scholar] [CrossRef] [PubMed]
- Zhang, D.L.; Liu, J.; Cui, W.Y.; Ji, D.Y.; Zhang, Y.; Liu, W.H.; Kuragano, T.; Kuno, T.; Takahashi, Y.; Yamamoto, C.; et al. Differences in bio-incompatibility among four biocompatible dialyzer membranes using in maintenance hemodialysis patients Comparison of the effects of cellulose triacetate and polysulfone membrane on GPIIb/IIIa and platelet activation. Ren. Fail. 2011, 33, 682–691. [Google Scholar] [CrossRef] [PubMed]
- Takemoto, Y.; Nakatani, T.; Sugimura, K.; Yoshimura, R.; Tsuchida, K. Endotoxin adsorption of various dialysis membranes: In vitro study. Artif. Organs 2003, 27, 1134–1137. [Google Scholar] [CrossRef] [PubMed]
- Modesto, A.P.; Usvyat, L.; Calice-Silva, V.; Spigolon, D.N.; Figueiredo, A.E.; de Moraes, T.P.; Olandoski, M.; Shimakura, S.E.; Barreti, P.; Kotanko, P.; et al. Impact of the Karnofsky Performance Status on Survival and its Dynamics During the Terminal Year of Peritoneal Dialysis Patients. Perit. Dial. Int. 2018, 38, 24–29. [Google Scholar] [CrossRef] [PubMed]
- Matsumoto, Y.; Mukai, M.; Arihara, K.; Saito, T.; Kumagai, H. Ethylene-vinyl alcohol copolymer dialyzer membrane reduces protein oxidation in hemodialysis patients. Ren. Fail. 2011, 33, 382–387. [Google Scholar] [CrossRef] [PubMed]
- Mansilla Francisco, J.J.; Diez De los Rios Cuenca, F.; Cabrera Azana, S.; Cortes Torres, J.; Macias Lopez, M.J.; Gonzalez Castillo, J.A.; Ferreras Duarte, J.L. Impact of incident comorbidity on functional loss in elderly chronic kidney disease patients undergoing hemodialysis. CANNT J. 2012, 22, 25–29. [Google Scholar] [PubMed]
- Holzer, J.; Midasch, O.; Rauchfuss, K.; Kraft, M.; Reupert, R.; Angerer, J.; Kleeschulte, P.; Marschall, N.; Wilhelm, M. Biomonitoring of perfluorinated compounds in children and adults exposed to perfluorooctanoate-contaminated drinking water. Environ. Health Perspect. 2008, 116, 651–657. [Google Scholar] [CrossRef] [PubMed]
- Meng, D.; Guo, M.; Qian, Y.; Han, G. Occurrence and dietary exposure assessment of PFOS and PFOA in cultured Trachinotus ovatus in China. J. Environ. Sci. Health B 2017, 1–9. [Google Scholar] [CrossRef] [PubMed]
- Hsu, J.Y.; Hsu, J.F.; Ho, H.H.; Chiang, C.F.; Liao, P.C. Background levels of persistent organic pollutants in humans from Taiwan: Perfluorooctane sulfonate and perfluorooctanoic acid. Chemosphere 2013, 93, 532–537. [Google Scholar] [CrossRef] [PubMed]
- Bao, J.; Lee, Y.L.; Chen, P.C.; Jin, Y.H.; Dong, G.H. Perfluoroalkyl acids in blood serum samples from children in Taiwan. Environ. Sci. Pollut. Res. Int. 2014, 21, 7650–7655. [Google Scholar] [CrossRef] [PubMed]
- Hsu, T.W.; Liu, J.S.; Hung, S.C.; Kuo, K.L.; Chang, Y.K.; Chen, Y.C.; Hsu, C.C.; Tarng, D.C. Renoprotective effect of renin-angiotensin-aldosterone system blockade in patients with predialysis advanced chronic kidney disease, hypertension, and anemia. JAMA Intern. Med. 2014, 174, 347–354. [Google Scholar] [CrossRef] [PubMed]
- Lin, C.Y.; Wen, L.L.; Lin, L.Y.; Wen, T.W.; Lien, G.W.; Chen, C.Y.; Hsu, S.H.; Chien, K.L.; Sung, F.C.; Chen, P.C.; et al. Associations between levels of serum perfluorinated chemicals and adiponectin in a young hypertension cohort in Taiwan. Environ. Sci. Technol. 2011, 45, 10691–10698. [Google Scholar] [CrossRef] [PubMed]
- Filgo, A.J.; Quist, E.M.; Hoenerhoff, M.J.; Brix, A.E.; Kissling, G.E.; Fenton, S.E. Perfluorooctanoic Acid (PFOA)-induced Liver Lesions in Two Strains of Mice Following Developmental Exposures: PPARalpha Is Not Required. Toxicol. Pathol. 2015, 43, 558–568. [Google Scholar] [CrossRef] [PubMed]
- Lai, Y.C.; Wang, C.Y.; Moi, S.H.; Wu, C.H.; Yang, C.H.; Chen, J.B. Factors Associated with Functional Performance among Patients on Hemodialysis in Taiwan. Blood Purif. 2018, 46, 12–18. [Google Scholar] [CrossRef] [PubMed]
- Naruse, S.; Horikawa, Y.; Tanaka, C.; Hirakawa, K.; Nishikawa, H.; Watari, H. Measurements of in vivo energy metabolism in experimental cerebral ischaemia using 31P-NMR for the evaluation of protective effects of perfluorochemicals and glycerol. Neurol. Res. 1984, 6, 169–175. [Google Scholar] [CrossRef] [PubMed]
- Fabrega, F.; Kumar, V.; Schuhmacher, M.; Domingo, J.L.; Nadal, M. PBPK modeling for PFOS and PFOA: Validation with human experimental data. Toxicol Lett. 2014. [Google Scholar] [CrossRef] [PubMed]
- Wang, Z.; Nicholls, S.J.; Rodriguez, E.R.; Kummu, O.; Horkko, S.; Barnard, J.; Reynolds, W.F.; Topol, E.J.; DiDonato, J.A.; Hazen, S.L.; et al. Protein carbamylation links inflammation, smoking, uremia and atherogenesis Why do we need a statin trial in hemodialysis patients? Nat. Med. 2007, 13, 1176–1184. [Google Scholar] [CrossRef] [PubMed]
- Fellstrom, B.C.; Holdaas, H.; Jardine, A.G. Why do we need a statin trial in hemodialysis patients? Kidney Int. Suppl. 2003, S204–S206. [Google Scholar] [CrossRef] [PubMed]


| All (N = 98) | PS (58) | Others (40) | PS vs. Others | ||||
|---|---|---|---|---|---|---|---|
| ng/mL | Mean | ±SD | Mean | ±SD | Mean | ±SD | p |
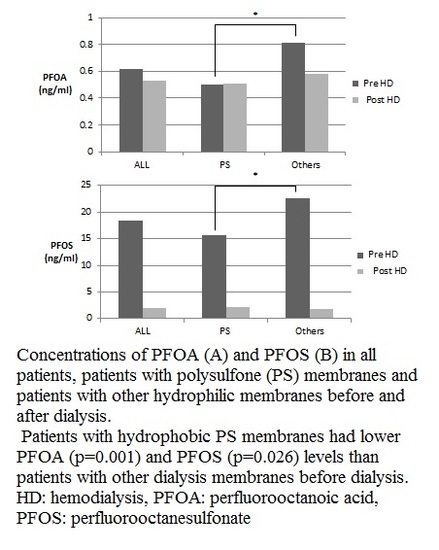
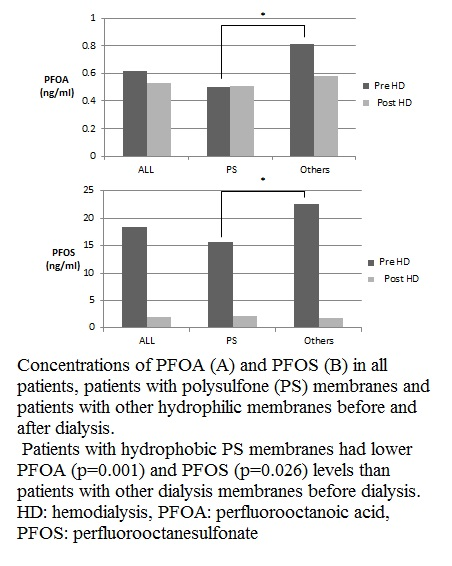
| * PFOA Pre-HD | 0.62 | 0.27 | 0.50 | 0.24 | 0.81 | 0.45 | <0.001 |
| Post-HD | 0.54 | 0.29 | 0.51 | 0.29 | 0.58 | 0.47 | 0.372 |
| paired t-test (p) | 0.707 | 0.828 | 0.753 | ||||
| * PFOS Pre-HD | 18.60 | 48.92 | 15.77 | 42.64 | 22.70 | 46.86 | 0.026 |
| + Post-HD | 1.97 | 0.91 | 2.08 | 1.22 | 1.74 | 0.69 | 0.055 |
| * paired t-test (p) | 0.001 | 0.017 | 0.017 | ||||
| All (N = 98) | AK: PS (N = 58) | AK: others (N = 40) | ||||
|---|---|---|---|---|---|---|
| Age | β | p | β | p | β | p |
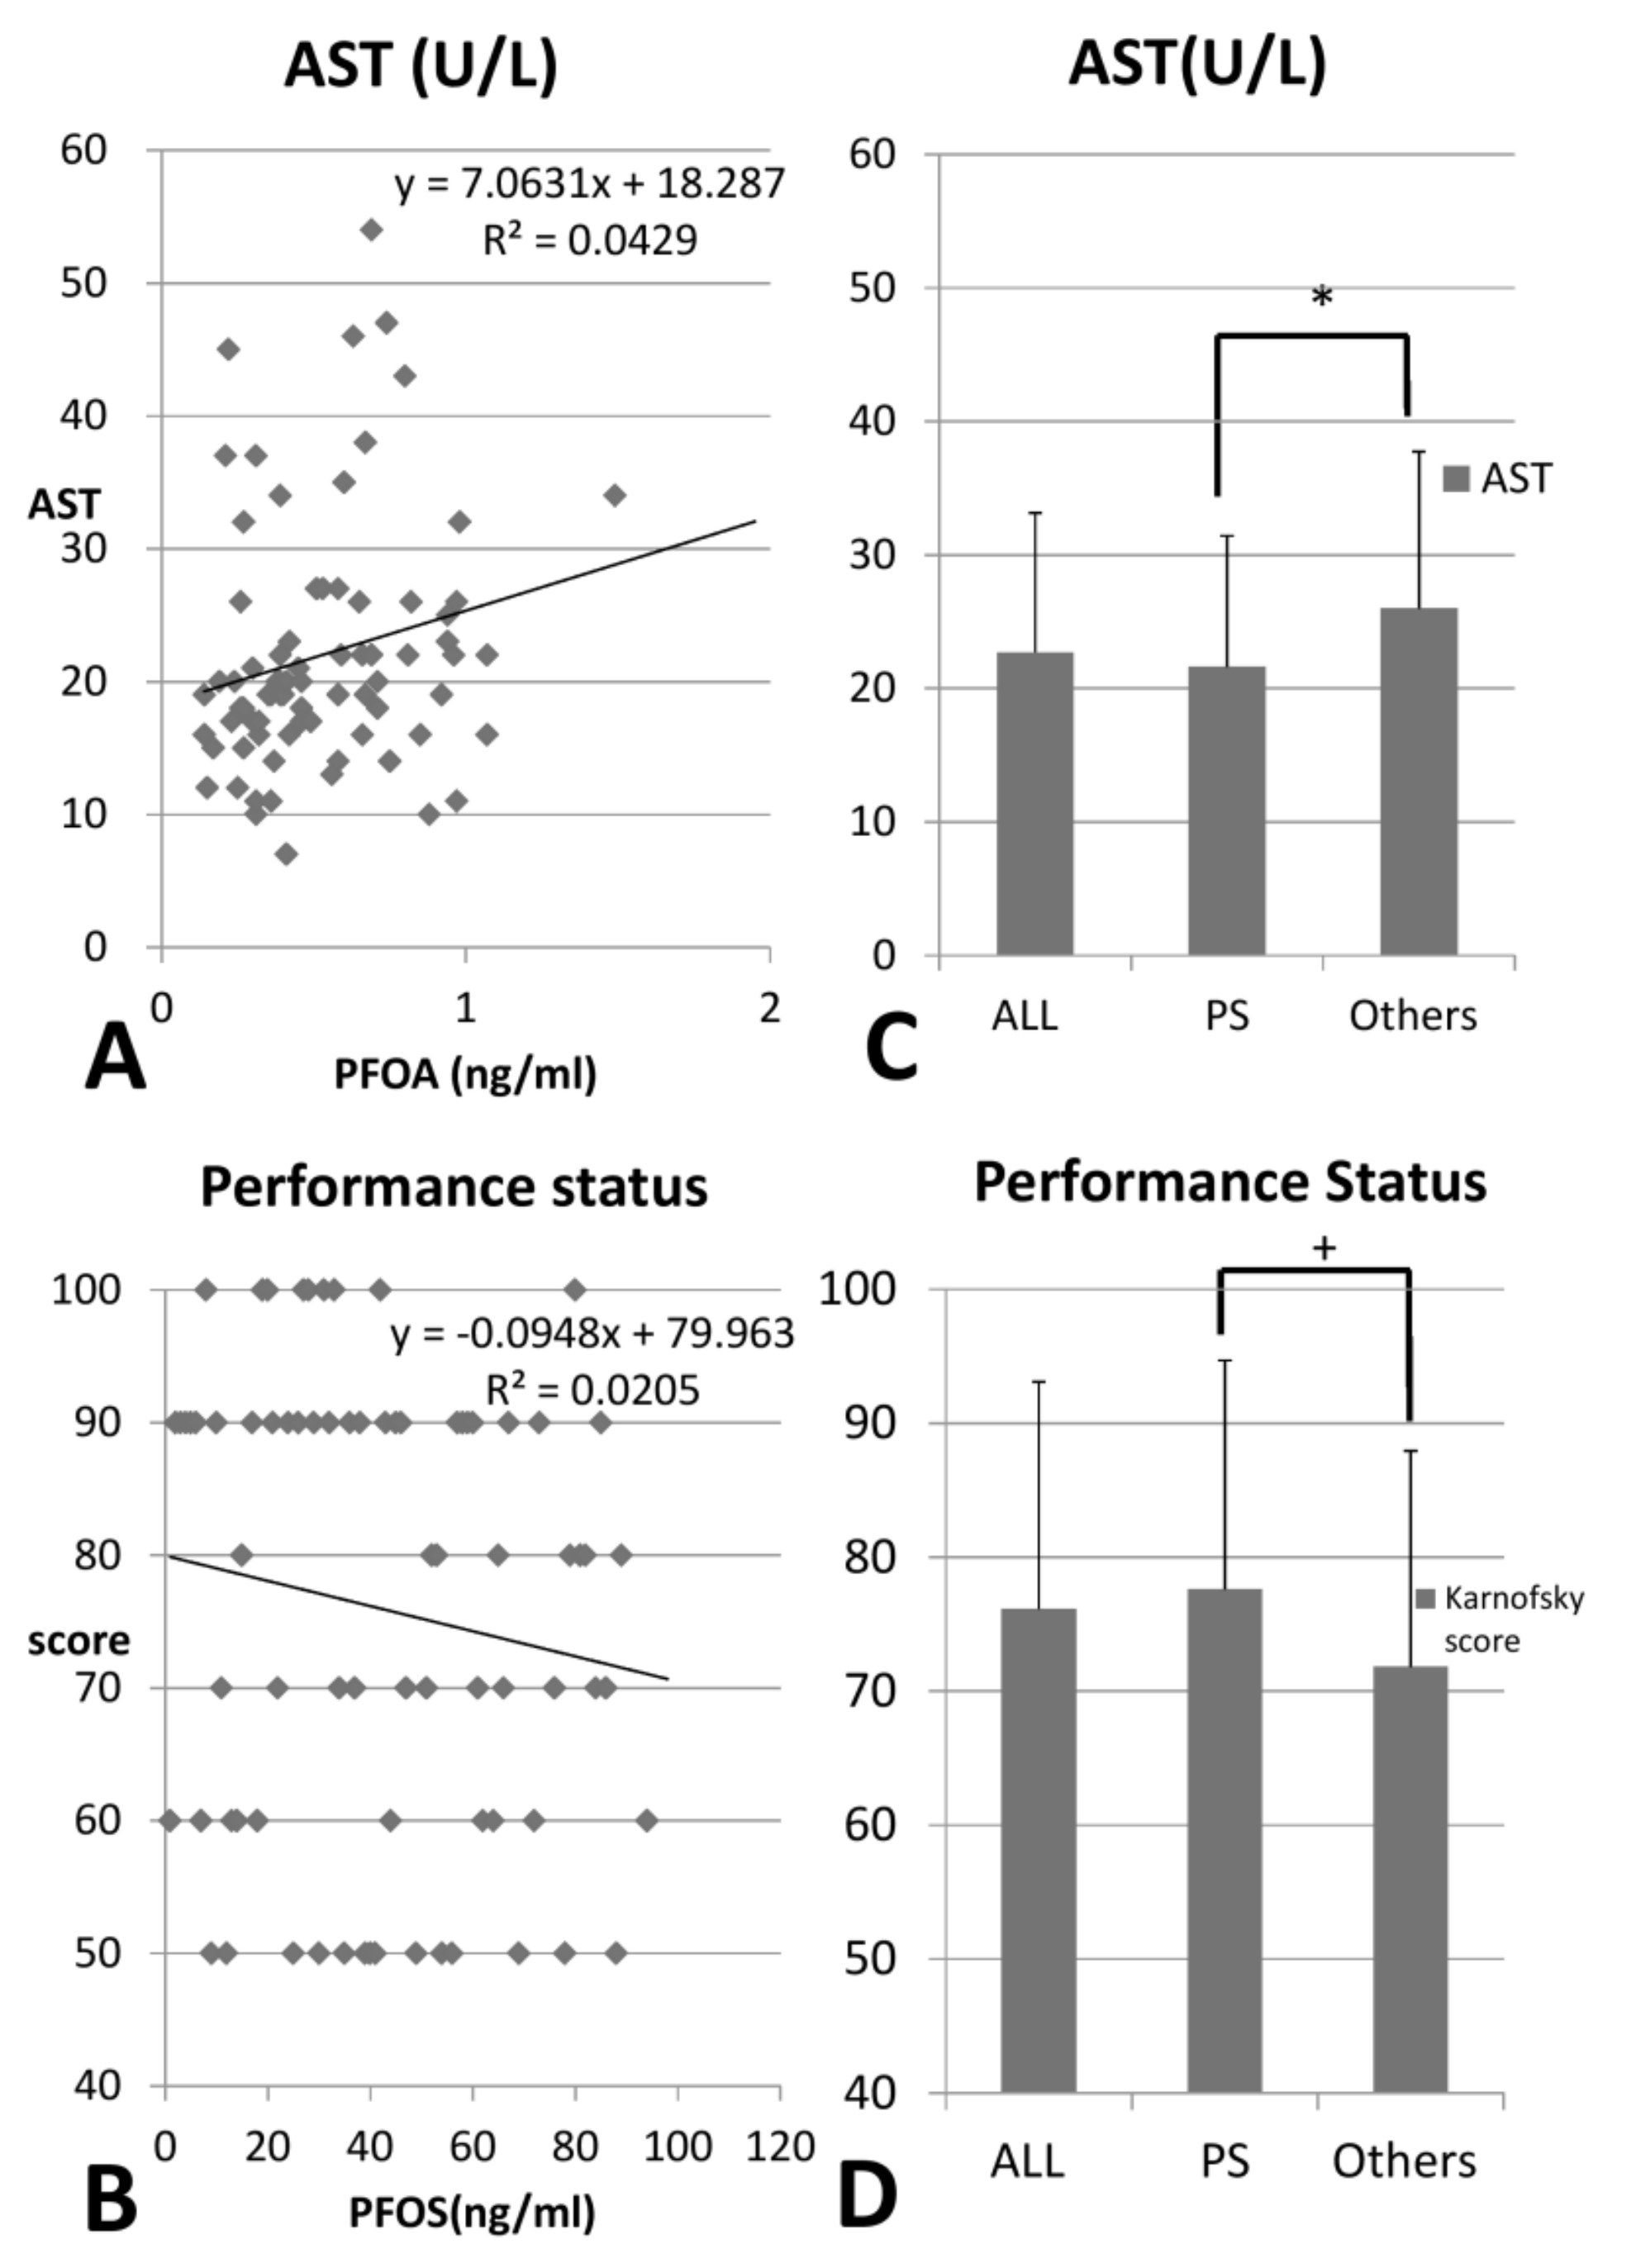
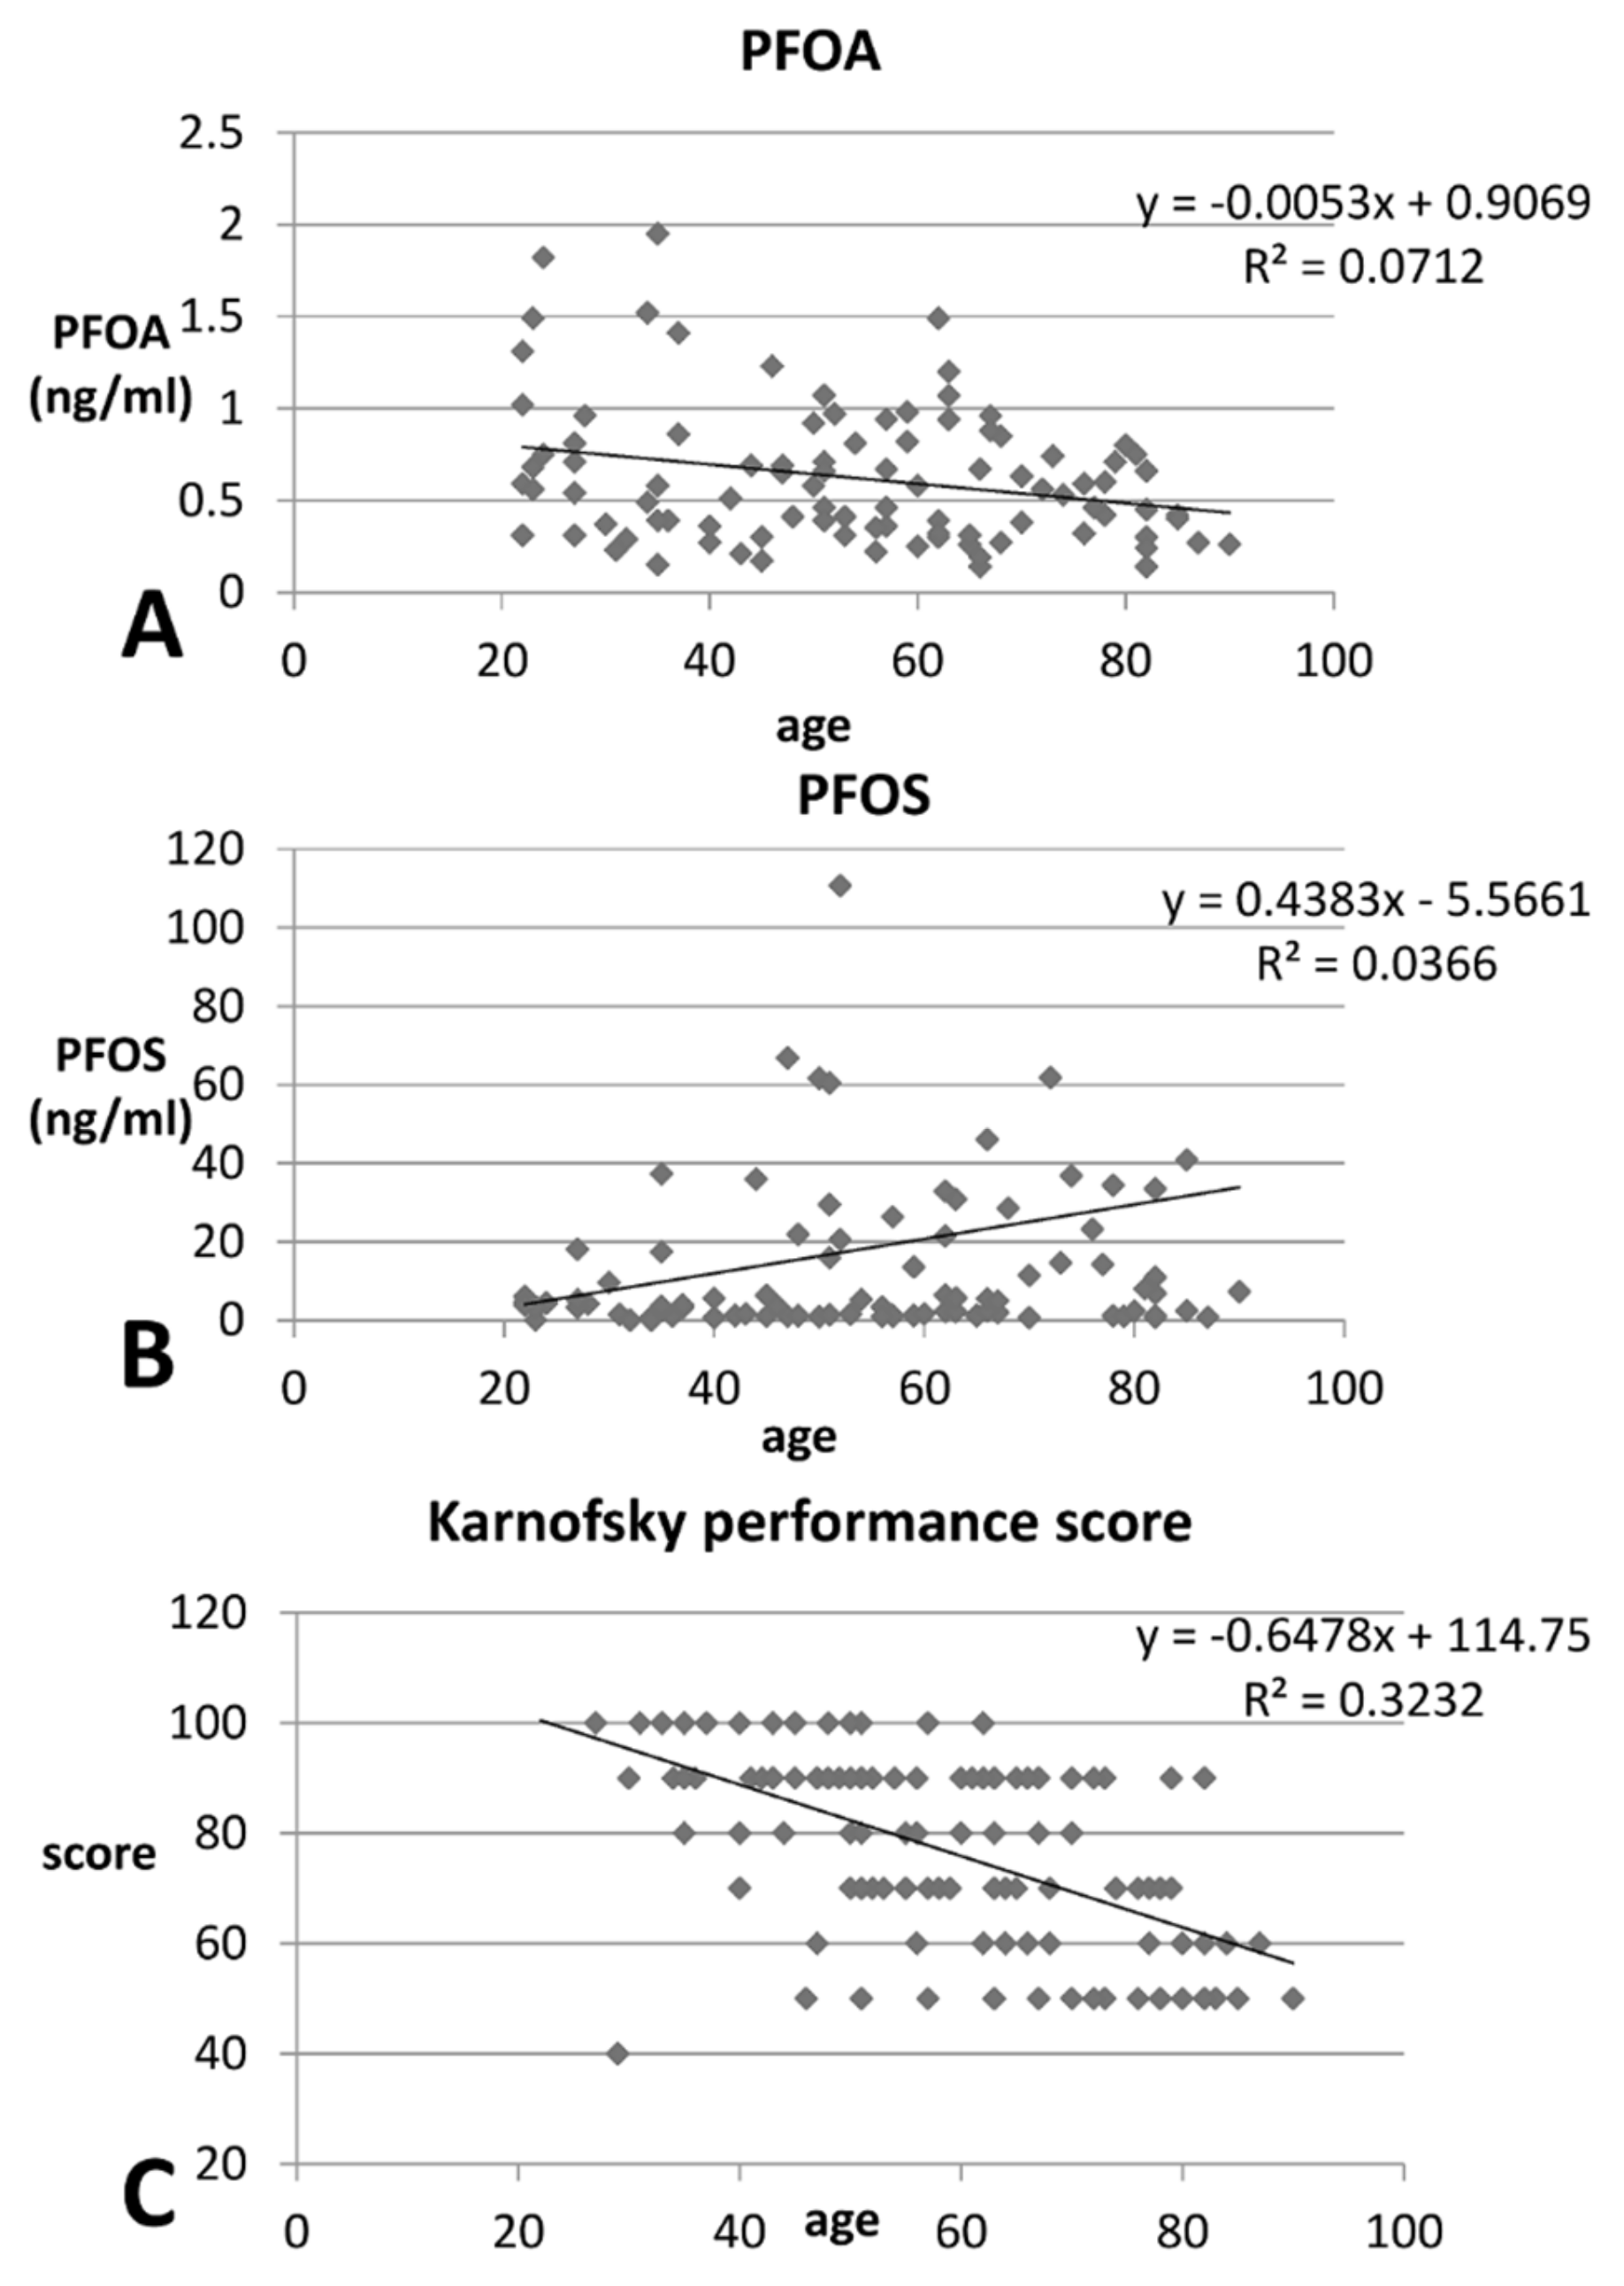
| + PFOA (pre-HD) | −14.19 | 0.083 | 5.61 | 0.540 | −14.18 | 0.082 |
| * PFOS (pre-HD) | 0.422 | 0.008 | 0.360 | 0.304 | 0.654 | 0.049 |
| * Karnofsky performance status | −0.65 | <0.001 | −0.63 | <0.001 | −0.58 | 0.007 |
| All (N = 98) | (%) | PS (N = 58) | (%) | Others (N = 40) | (%) | p | |
|---|---|---|---|---|---|---|---|
| Men | 55 | 56.1% | 33 | 56.9% | 22 | 55.0% | 1.00 |
| DM | 56 | 57.1% | 36 | 62.1% | 20 | 50.0% | 0.233 |
| HTN medication | 18 | 18.4% | 14 | 24.1% | 4 | 10.0% | 0.101 |
| Hepatitis | 19 | 19.4% | 12 | 20.7% | 7 | 17.5% | 0.807 |
| * Iron supplement | 48 | 48.9% | 25 | 43.1% | 23 | 57.5% | 0.016 |
| All (N = 98) | Mean | ±SD | PS Mean | (N = 58) ± SD | Other Mean | (N = 40) ± SD | p |
|---|---|---|---|---|---|---|---|
| Age (year) | 55.85 | 14.79 | 59.49 | 14.94 | 61.83 | 13.65 | 0.283 |
| HD duration (month) | 59.75 | 67.75 | 58.42 | 72.81 | 52.10 | 50.63 | 0.64 |
| EPO (×104 U) dosage/month | 2.09 | 1.02 | 2.12 | 1.06 | 1.99 | 0.86 | 0.526 |
| + Karnofsky performance status | 76.12 | 16.97 | 77.60 | 17.09 | 71.82 | 16.10 | 0.091 |
| Blood flow (mL/min) | 272.18 | 33.36 | 273.30 | 36.46 | 268.79 | 21.47 | 0.390 |
| Dialysate flow (mL/min) | 510.15 | 56.99 | 511.50 | 62.71 | 506.06 | 34.82 | 0.636 |
| HD frequency (/week) | 2.98 | 0.12 | 2.98 | 0.14 | 3.00 | 0.00 | 0.417 |
| Dialysis time (hours) | 4.023 | 0.37 | 4.045 | 0.39 | 3.96 | 0.29 | 0.221 |
| AK surface size (m2) | 1.90 | 0.27 | 1.91 | 0.28 | 1.86 | 0.23 | 0.294 |
| AC Initial dose (×103 U) | 1.32 | 0.98 | 1.36 | 0.96 | 1.20 | 1.05 | 0.444 |
| AC maintenance dose(×103 U) | 0.22 | 0.27 | 0.24 | 0.29 | 0.16 | 0.21 | 0.260 |
| Urea reduction ratio | 0.74 | 0.05 | 0.75 | 0.05 | 0.74 | 0.05 | 0.282 |
| Kt/V (Gotch) | 1.39 | 0.22 | 1.40 | 0.23 | 1.34 | 0.20 | 0.251 |
| Kt/V ((Daugirdes)) | 1.64 | 0.29 | 1.66 | 0.30 | 1.60 | 0.26 | 0.374 |
| Ccr (mL/min) | 6.03 | 2.00 | 6.01 | 1.99 | 6.11 | 2.08 | 0.797 |
| nPCR | 1.02 | 0.26 | 1.01 | 0.24 | 1.04 | 0.30 | 0.477 |
| TAC urea | 37.20 | 10.20 | 36.84 | 9.82 | 38.14 | 11.23 | 0.536 |
| All (N = 98) | Mean | ±SD | PS Mean | (N = 58) ± SD | Others Mean | (N = 40) ± SD | p |
|---|---|---|---|---|---|---|---|
| WBC (×1000/uL) | 6.83 | 2.46 | 6.71 | 2.53 | 7.17 | 2.25 | 0.355 |
| RBC (×106/uL) | 3.36 | 0.50 | 3.37 | 0.50 | 3.30 | 0.50 | 0.447 |
| Hb (g/dL) | 9.89 | 1.20 | 9.93 | 1.14 | 9.75 | 1.37 | 0.460 |
| Hct (%) | 30.39 | 3.67 | 30.52 | 3.54 | 30.01 | 4.08 | 0.497 |
| MCV (fL) | 91.17 | 7.23 | 90.94 | 7.34 | 91.87 | 7.00 | 0.522 |
| Platelets (×1000/uL) | 195.71 | 68.31 | 190.95 | 66.26 | 210.15 | 73.35 | 0.162 |
| Cholesterol (mg/dL) | 154.70 | 35.57 | 152.87 | 35.07 | 160.21 | 37.02 | 0.306 |
| Triglycerides (mg/dL) | 136.62 | 78.87 | 141.10 | 85.42 | 123.18 | 53.57 | 0.260 |
| * Glucose (mg/dL) | 131.26 | 52.86 | 124.73 | 48.08 | 149.71 | 61.58 | 0.017 |
| Total protein (gm/dL) | 6.94 | 3.98 | 6.58 | 0.78 | 6.62 | 0.99 | 0.833 |
| Albumin (gm/dL) | 3.92 | 0.37 | 3.94 | 0.36 | 3.85 | 0.40 | 0.209 |
| Globulin | 2.95 | 4.02 | 25.7 | 0.90 | 2.68 | 1.33 | 0.575 |
| * AST (IU/L) | 22.70 | 10.45 | 21.61 | 9.82 | 26.00 | 11.72 | 0.036 |
| ALT (IU/L) | 18.77 | 10.88 | 18.70 | 11.04 | 19.00 | 10.55 | 0.891 |
| Alk-P (IU/L) | 93.72 | 83.06 | 93.86 | 91.75 | 93.30 | 49.16 | 0.974 |
| Total bilirubin (mg/dL) | 0.54 | 0.15 | 0.55 | 0.17 | 0.52 | 0.10 | 0.311 |
| Uric acid (mg/dL) | 6.99 | 1.18 | 7.03 | 1.23 | 6.88 | 1.06 | 0.506 |
| Sodium (mEq/L) | 138.92 | 2.73 | 138.70 | 2.71 | 139.56 | 2.71 | 0.114 |
| Potassium (mEq/L) | 4.56 | 0.66 | 4.51 | 0.63 | 4.72 | 0.72 | 0.100 |
| Cl (mEq/L) | 98.83 | 5.62 | 98.46 | 5.32 | 99.91 | 6.38 | 0.202 |
| Calcium (mg/dL) | 9.27 | 0.86 | 9.26 | 0.86 | 9.33 | 0.85 | 0.702 |
| Phosphorus (mg/dL) | 4.69 | 1.33 | 4.64 | 1.30 | 4.86 | 1.41 | 0.406 |
| Creatinine (mg/dL) | 9.18 | 2.22 | 9.18 | 2.20 | 9.16 | 2.32 | 0.959 |
| BUN (mg/dL) | 61.69 | 17.09 | 61.79 | 16.38 | 61.41 | 19.37 | 0.913 |
| Fe (ug/dL) | 59.39 | 22.15 | 59.04 | 22.54 | 60.43 | 21.26 | 0.753 |
| UIBC (ug/dL) | 188.99 | 55.09 | 187.15 | 55.07 | 194.39 | 55.62 | 0.510 |
| TIBC (ug/dL) | 248.38 | 48.10 | 246.19 | 47.47 | 254.82 | 50.09 | 0.368 |
| Ferritin (ng/mL) | 488.95 | 422.60 | 443.26 | 435.96 | 465.67 | 386.28 | 0.791 |
| TSAT (%) | 24.78 | 9.93 | 24.90 | 10.41 | 24.45 | 8.49 | 0.822 |
| Al (ng/mL) | 15.16 | 9.85 | 14.84 | 8.98 | 16.57 | 13.85 | 0.680 |
| iPTH (pg/mL) | 205.26 | 301.44 | 208.98 | 325.22 | 194.77 | 225.21 | 0.817 |
© 2018 by the authors. Licensee MDPI, Basel, Switzerland. This article is an open access article distributed under the terms and conditions of the Creative Commons Attribution (CC BY) license (http://creativecommons.org/licenses/by/4.0/).
Share and Cite
Liu, W.-S.; Chan, H.L.; Lai, Y.-T.; Lin, C.-C.; Li, S.-Y.; Liu, C.-K.; Tsou, H.-H.; Liu, T.-Y. Dialysis Membranes Influence Perfluorochemical Concentrations and Liver Function in Patients on Hemodialysis. Int. J. Environ. Res. Public Health 2018, 15, 2574. https://doi.org/10.3390/ijerph15112574
Liu W-S, Chan HL, Lai Y-T, Lin C-C, Li S-Y, Liu C-K, Tsou H-H, Liu T-Y. Dialysis Membranes Influence Perfluorochemical Concentrations and Liver Function in Patients on Hemodialysis. International Journal of Environmental Research and Public Health. 2018; 15(11):2574. https://doi.org/10.3390/ijerph15112574
Chicago/Turabian StyleLiu, Wen-Sheng, Hsiang Lin Chan, Yen-Ting Lai, Chih-Ching Lin, Szu-Yuan Li, Chih-Kuang Liu, Han-Hsing Tsou, and Tsung-Yun Liu. 2018. "Dialysis Membranes Influence Perfluorochemical Concentrations and Liver Function in Patients on Hemodialysis" International Journal of Environmental Research and Public Health 15, no. 11: 2574. https://doi.org/10.3390/ijerph15112574
APA StyleLiu, W.-S., Chan, H. L., Lai, Y.-T., Lin, C.-C., Li, S.-Y., Liu, C.-K., Tsou, H.-H., & Liu, T.-Y. (2018). Dialysis Membranes Influence Perfluorochemical Concentrations and Liver Function in Patients on Hemodialysis. International Journal of Environmental Research and Public Health, 15(11), 2574. https://doi.org/10.3390/ijerph15112574