
Drivers of Microbial Risk for Direct Potable Reuse and de Facto Reuse Treatment Schemes: The Impacts of Source Water Quality and Blending


Abstract
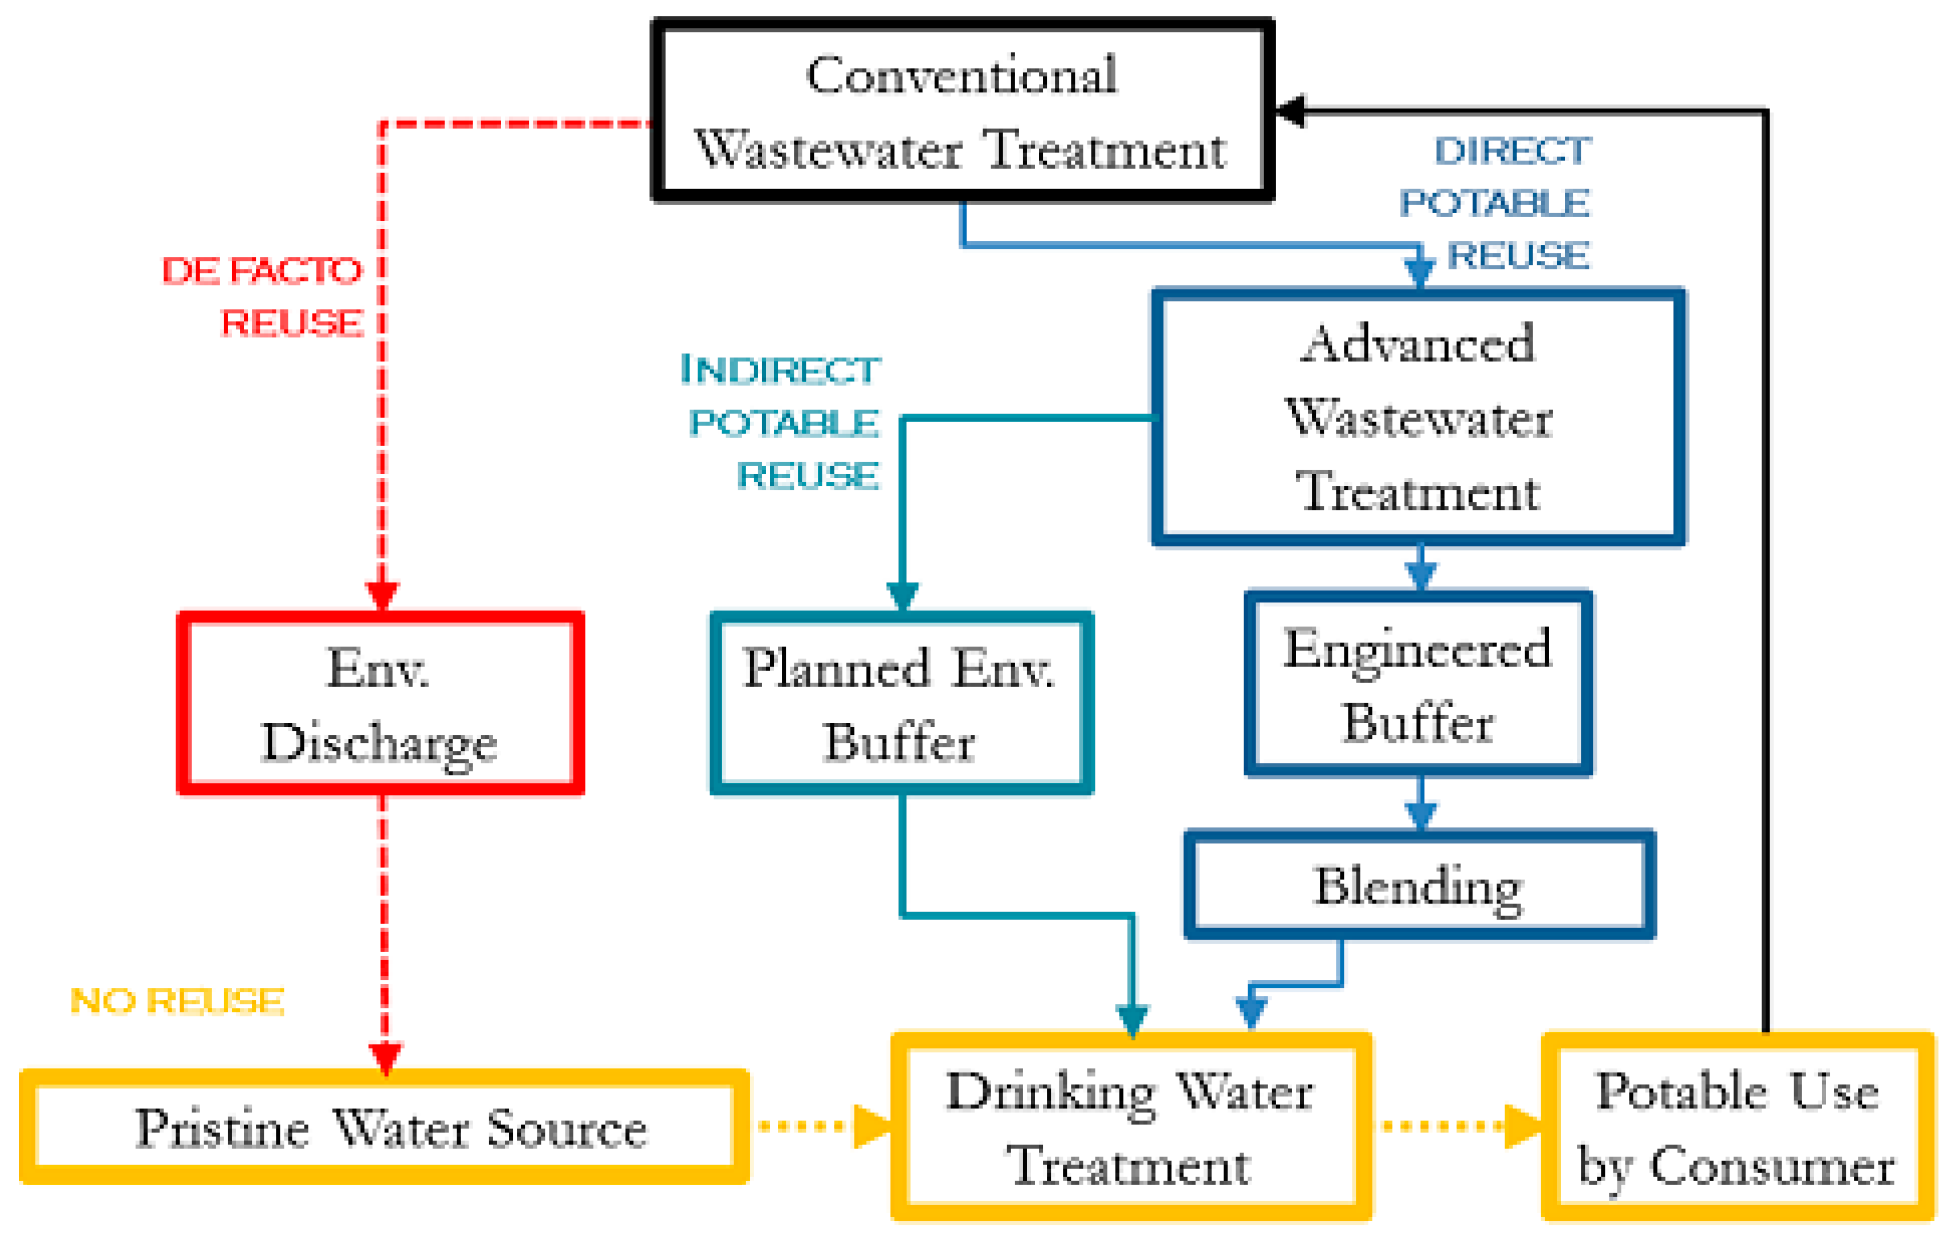
:1. Introduction
2. Materials and Methods
2.1. Hazard Identification
2.2. Treatment Train Scenarios
2.3. Pathogen Concentrations in Raw Wastewater
2.4. Pathogen Removals through Unit Process Treatment
2.4.1. Conventional Drinking Water Treatment Processes
2.4.2. Conventional Wastewater Treatment Processes
2.4.3. Advanced DPR Treatment Processes
2.4.4. Reverse Osmosis Treatment Process
2.4.5. Ultraviolet and Ozone Disinfection Processes
2.4.6. Membrane Bioreactor (MBR) Wastewater Treatment Process
2.4.7. Unit Process LRV Literature Gaps
2.5. Risk Model
- a.
- When Fblend = 0, only DPR trains are considered and no blending with de facto reuse source water is considered, but DPR effluent undergoes additional conventional drinking water treatment;
- b.
- Fblend = 1, only de facto reuse is considered;
- c.
- For 0 < Fblend < 1, DPR water is blended with de facto reuse source water prior to conventional drinking water treatment.
2.6. Risk Characterization
3. Results
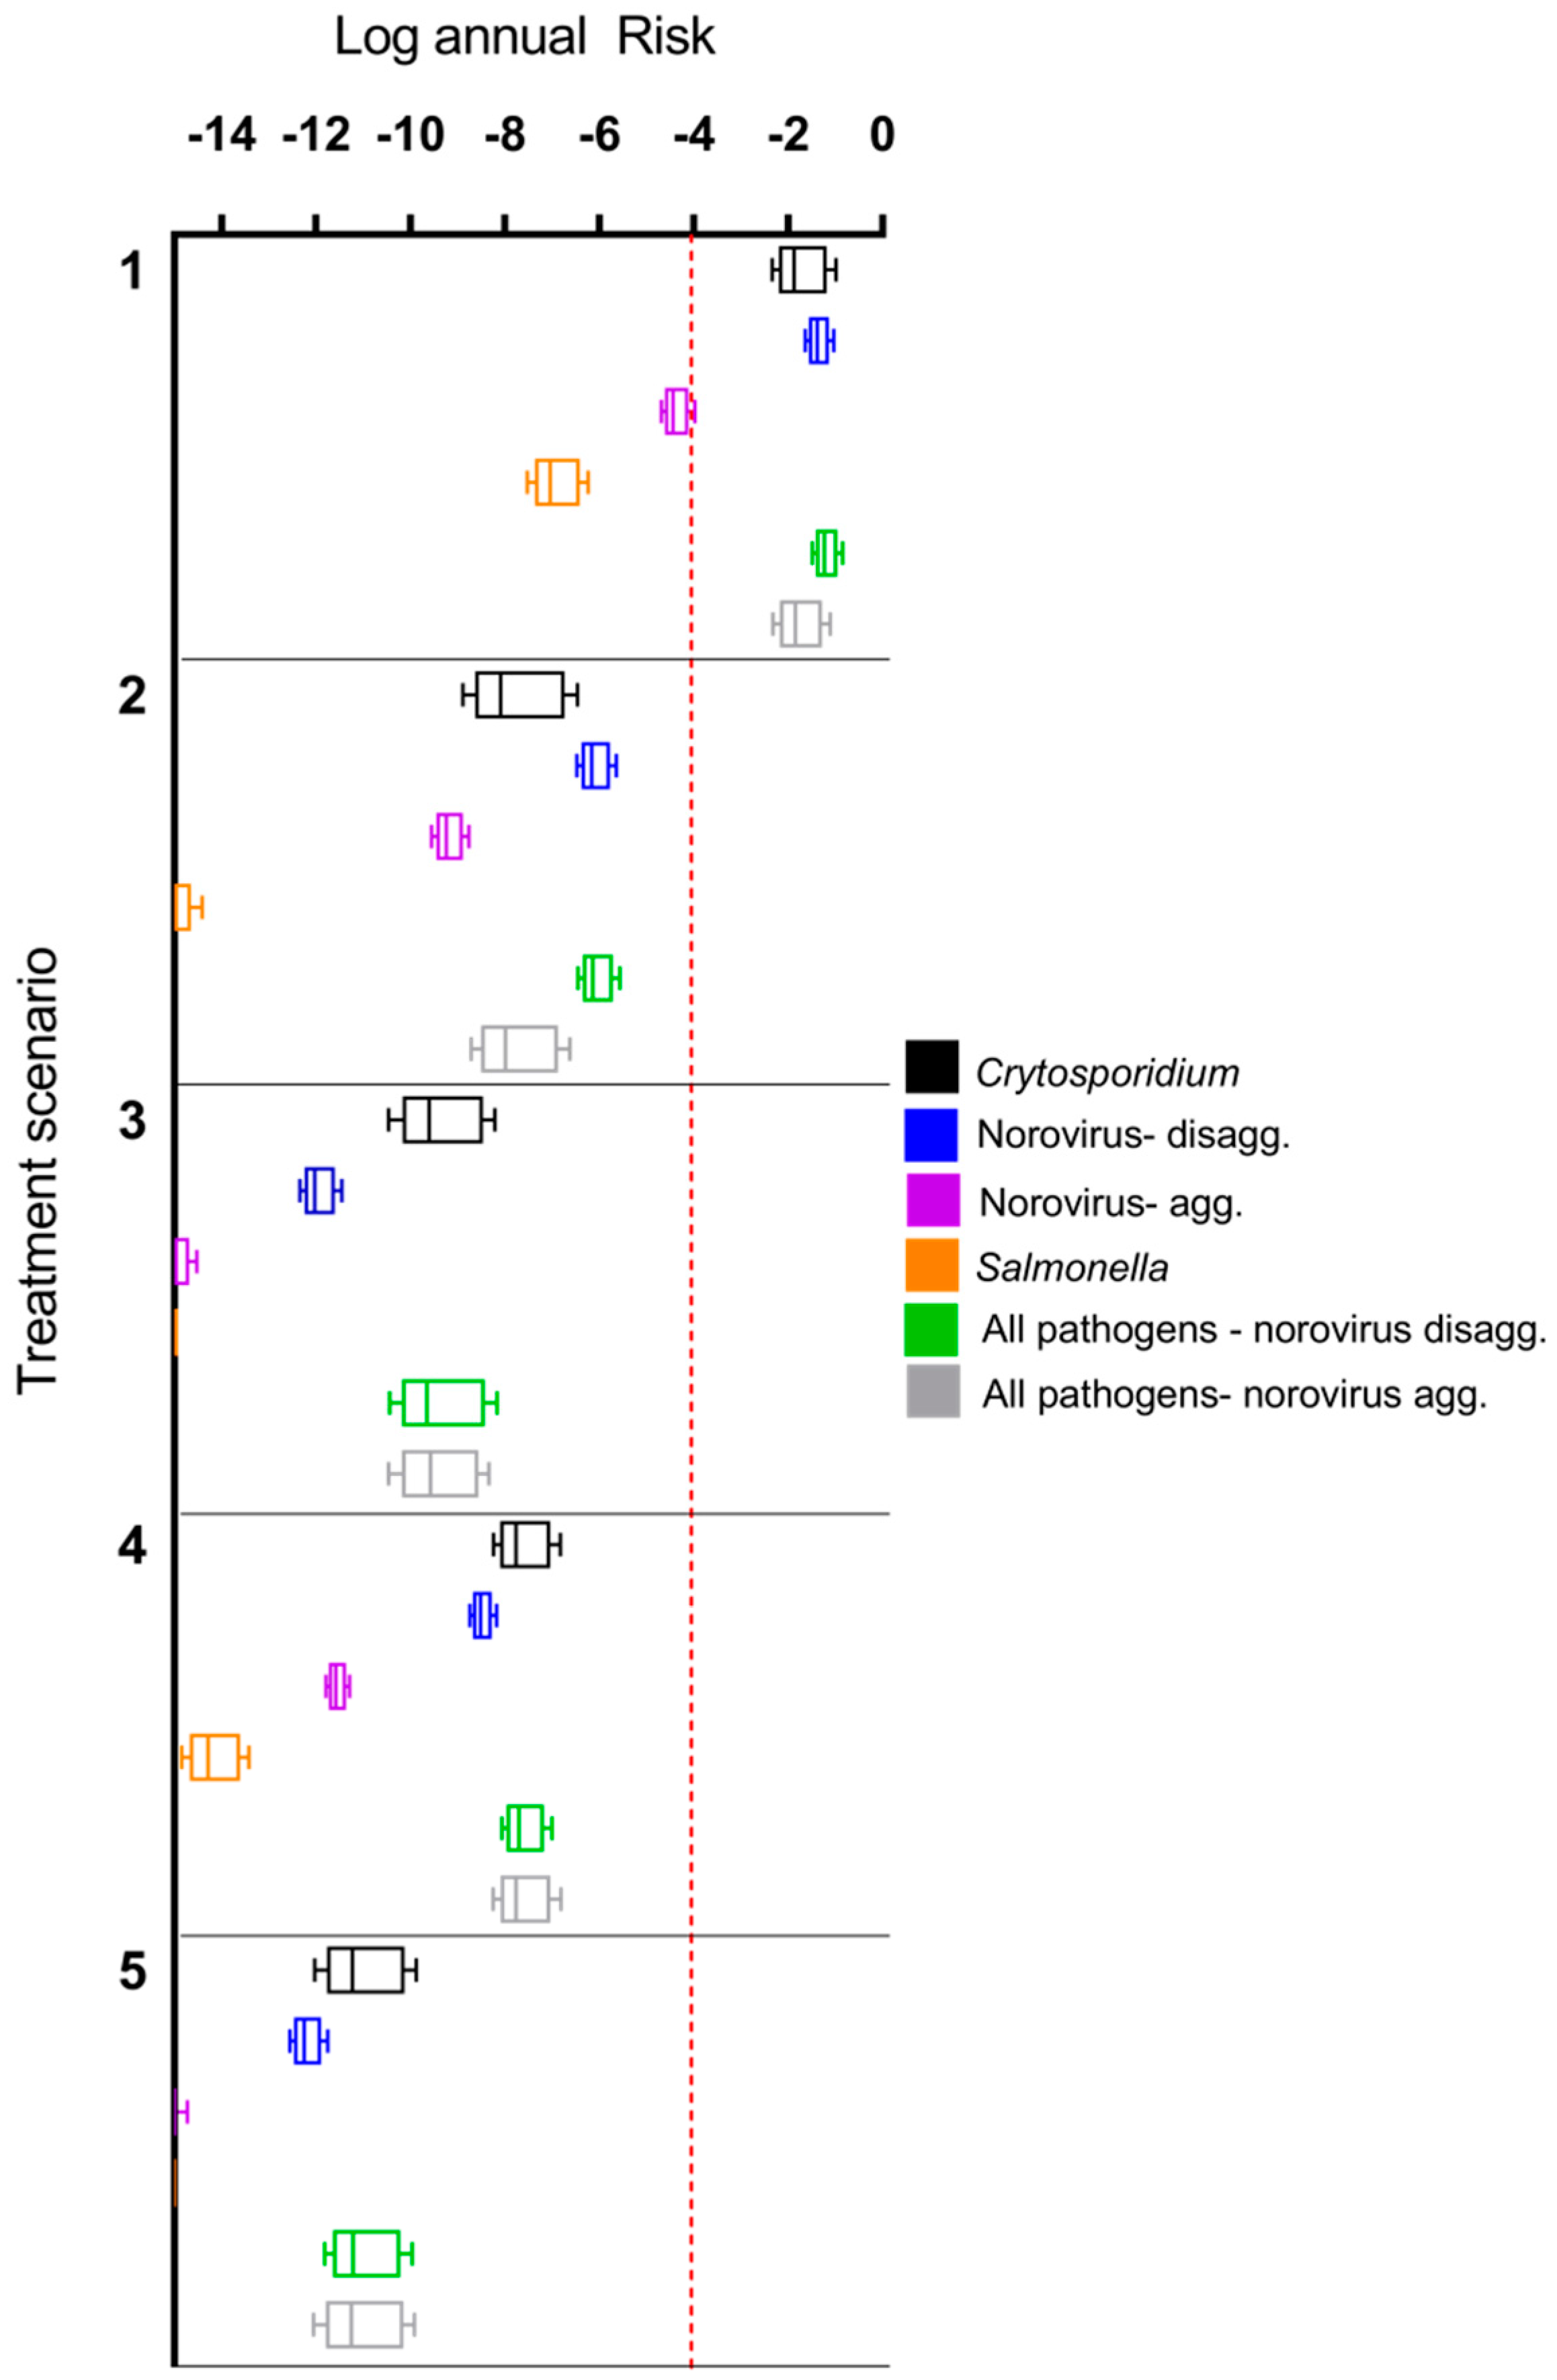
3.1. Comparison of Microbial Risks for DPR Configurations and de Facto Reuse
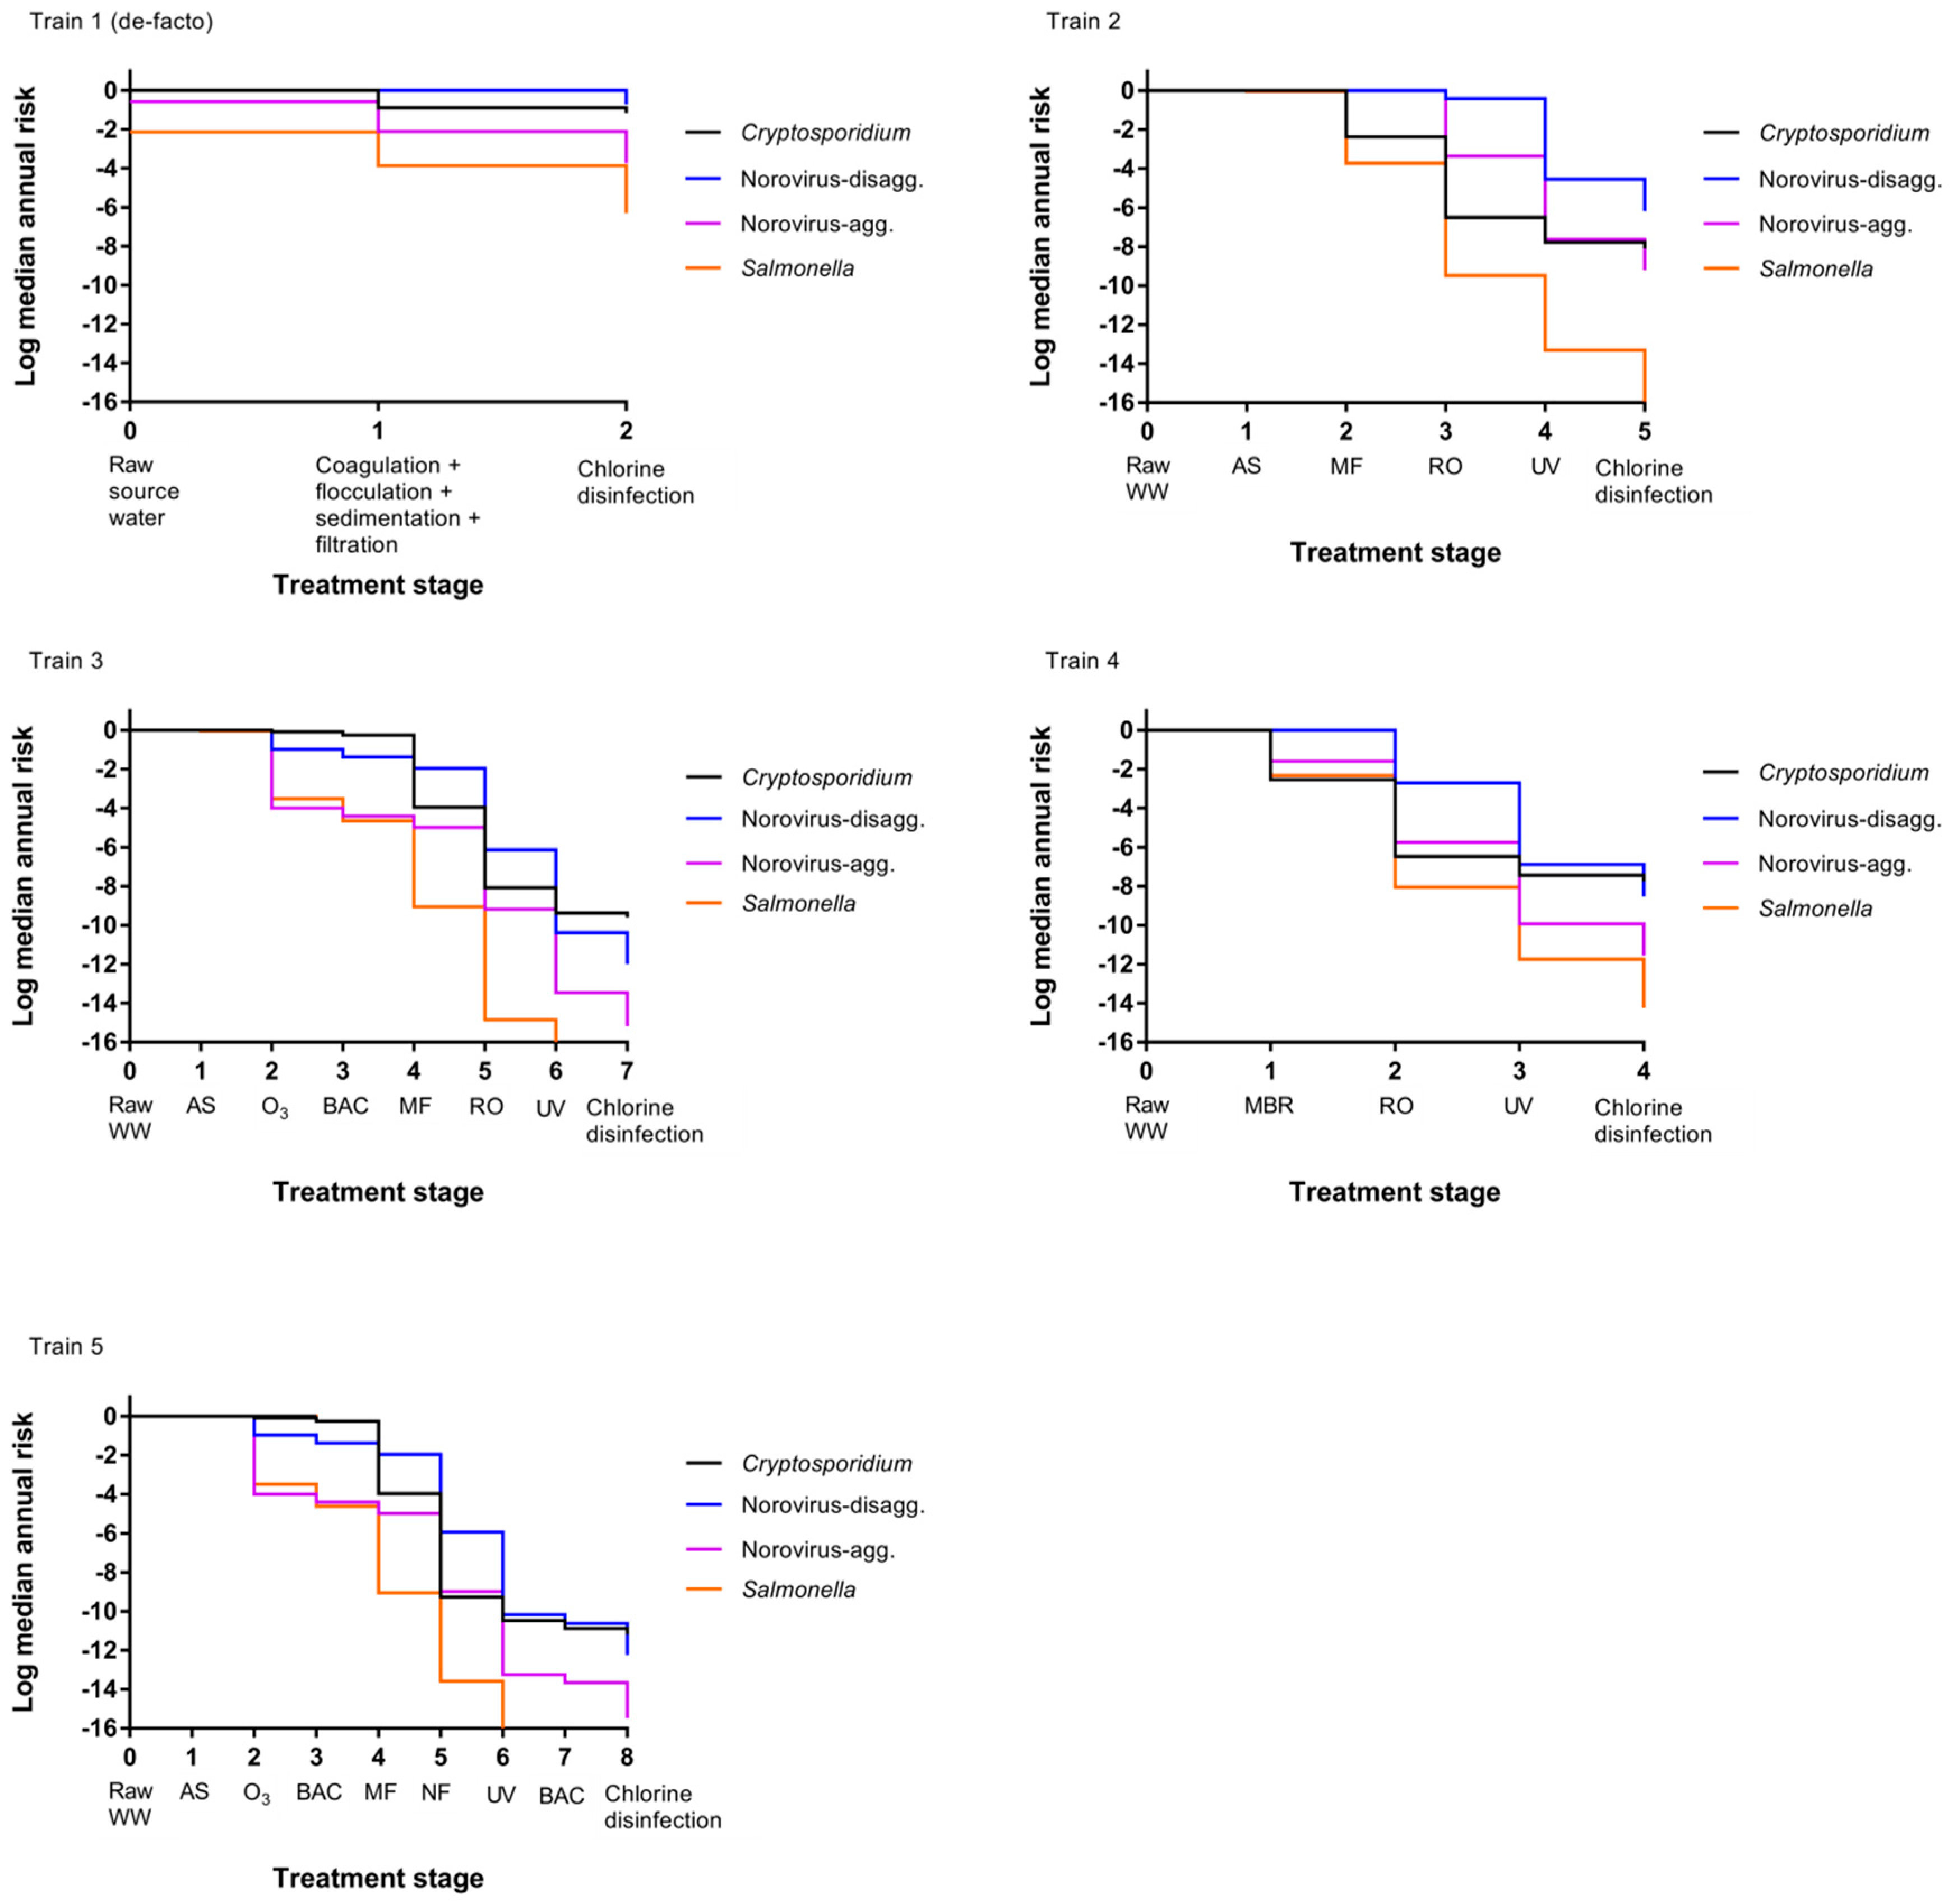
3.2. Impact of Treatment Stages on Annual Risk
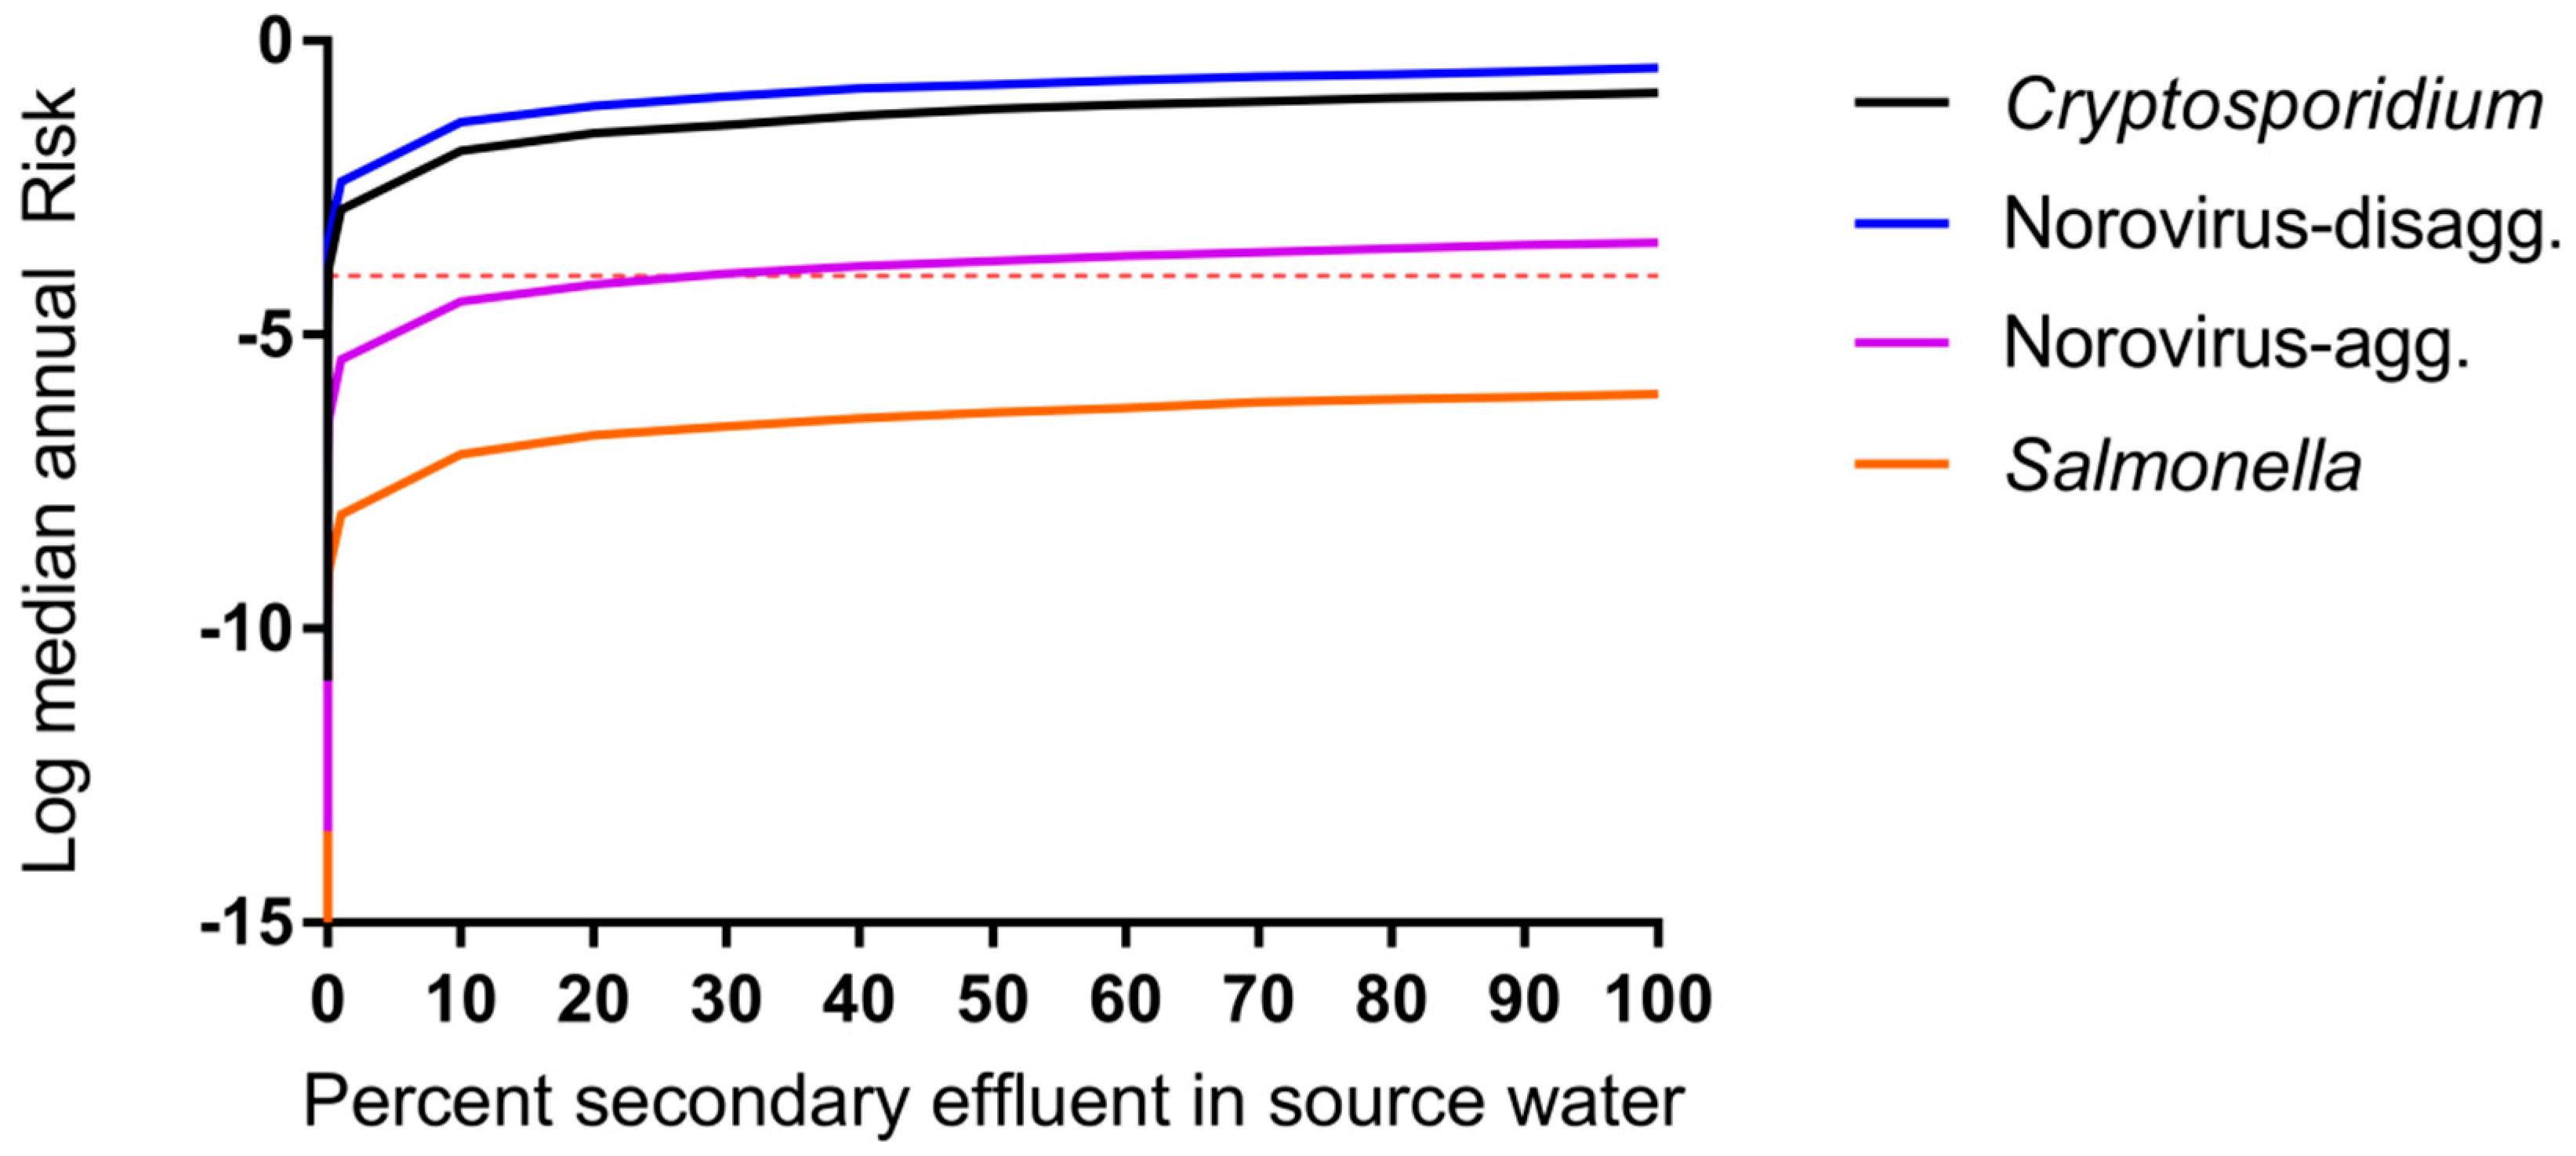
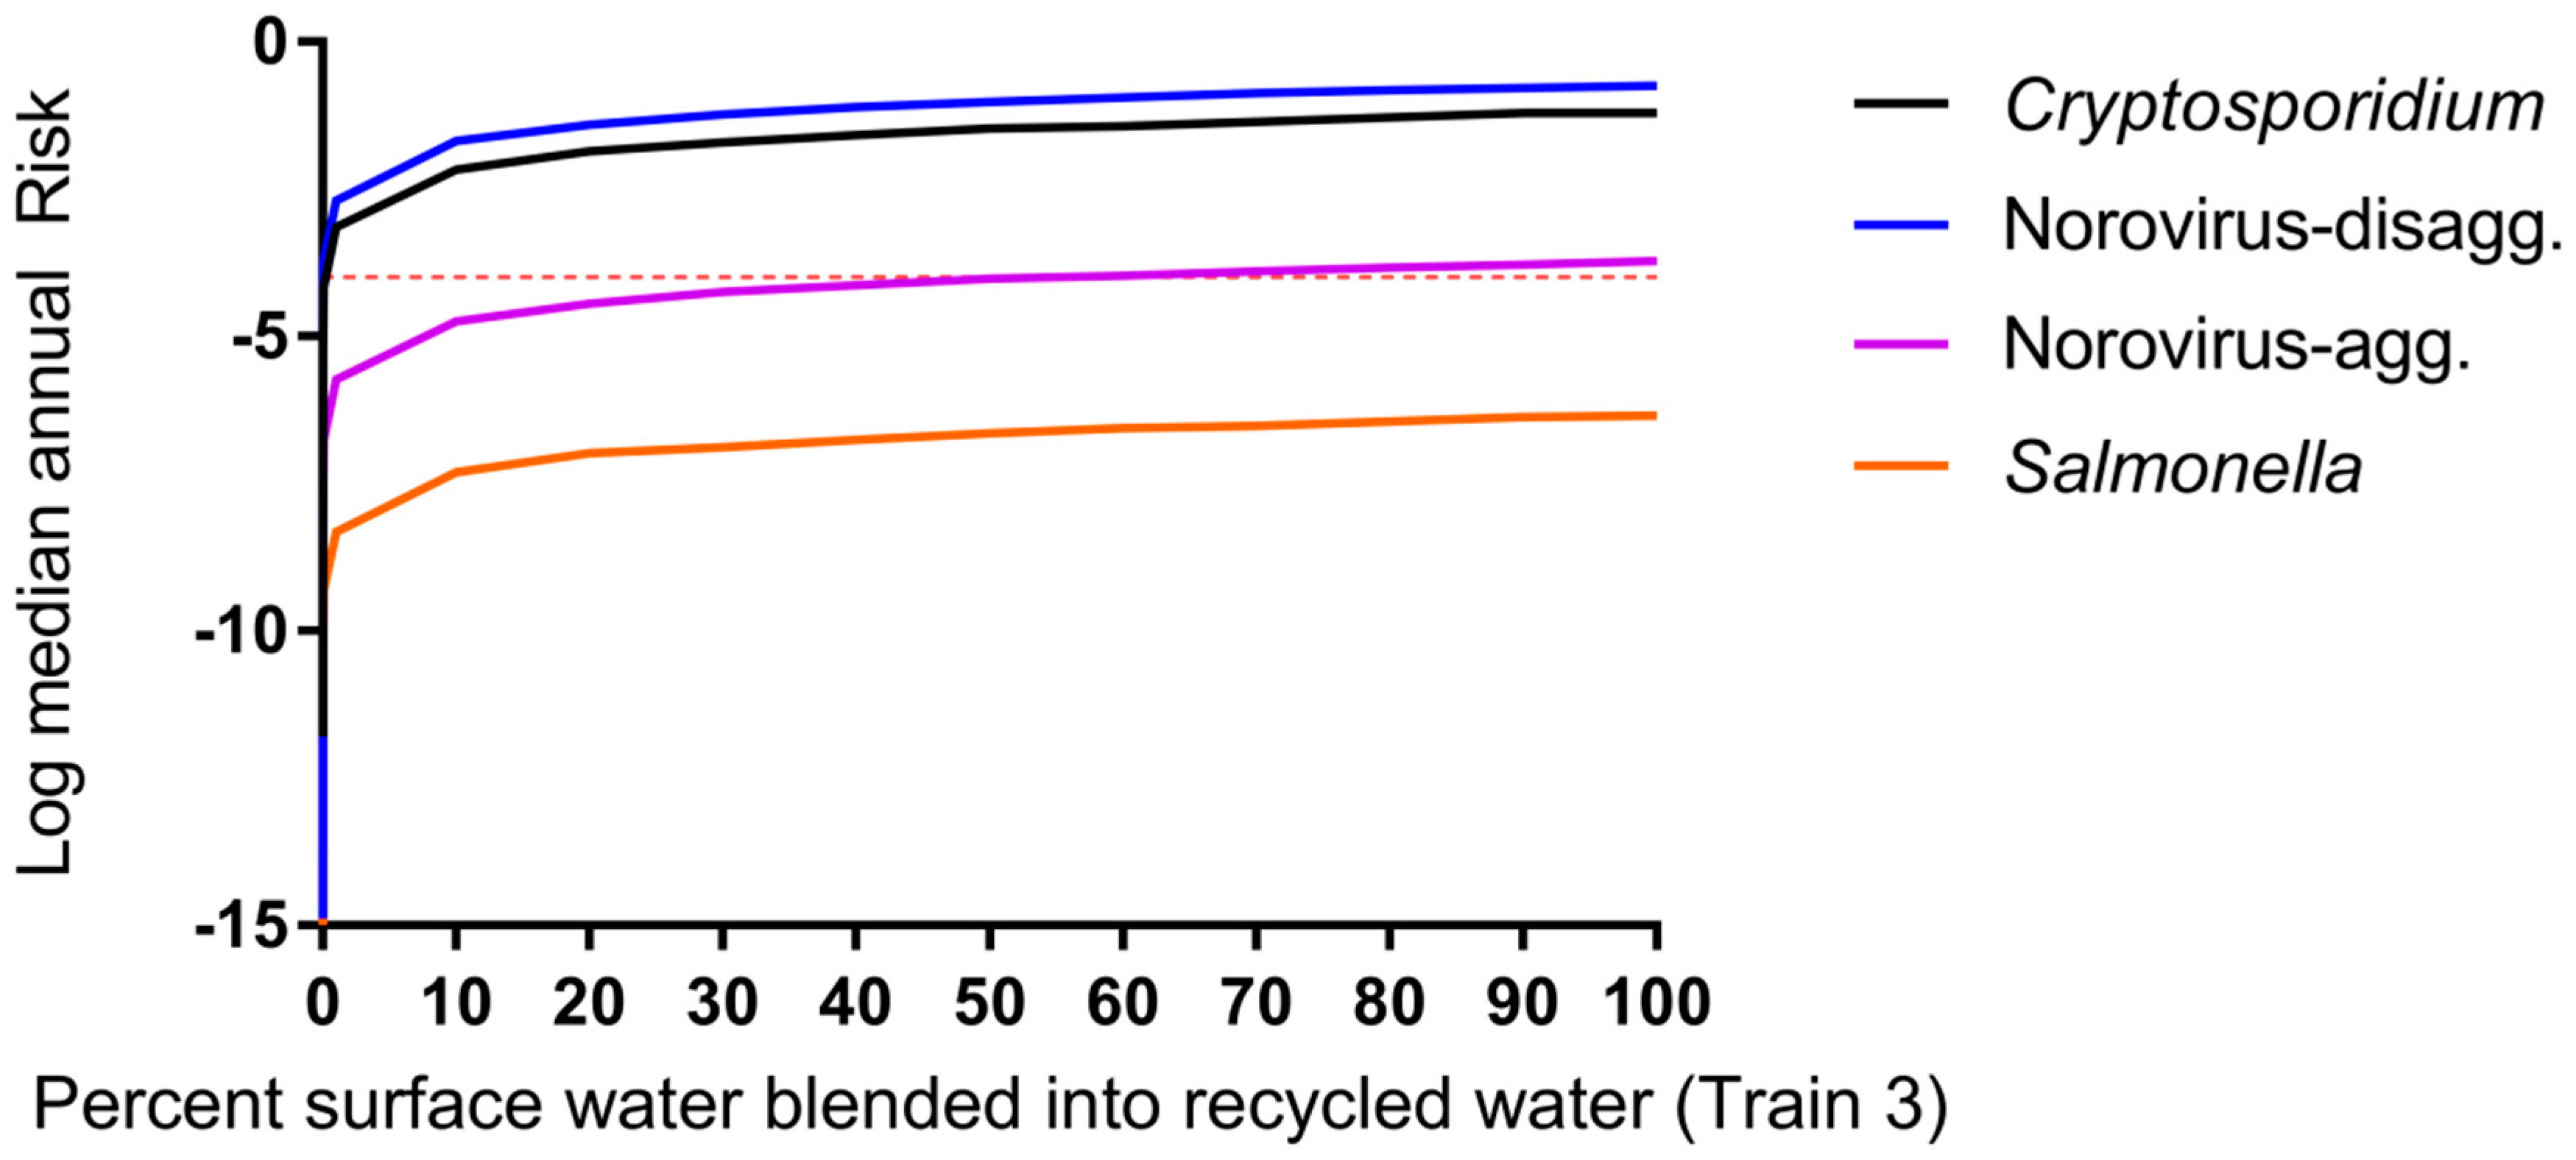
3.3. Impact of Blending Advanced-Treated DPR Water and Wastewater-Impacted Surface Water
4. Discussion
5. Conclusions
Supplementary Materials
Acknowledgments
Author Contributions
Conflicts of interest
References
- California Department of Water Resources. One of California’s Driest Years Ever; California Department of Water Resources: Sacramento, CA, USA, 2014.
- Metcalf & Eddy, Inc.; Asano, T.; Burton, F.; Leverenz, H.; Tsuchihashi, R.; Tchobanoglous, G. Water Reuse: Issues, Technologies, and Applications; McGraw-Hill Education: New York, NY, USA, 2006. [Google Scholar]
- NRC. Water Reuse: Potential for Expanding the Nation’s Water Supply through Reuse of Municipal Wastewater; Natural Research Council: Washington, DC, USA, 2012. [Google Scholar]
- Trussell, S.; Salveson, A.; Snyder, S.; Trussell, R.; Gerrity, D.; Pecson, B. Potable Reuse: State of the Science Report and Equivalency Criteria for Treatment Trains; Water Reuse Research Foundation, Bureau of Reclamation: Sacramento, CA, USA, 2013. [Google Scholar]
- USEPA. Guidelines for Water Reuse; U.S. Agency for International Development: Washington, DC, USA, 2012.
- Gerrity, D.; Pecson, B.; Trussell, R.S.; Trussell, R.R. Potable reuse treatment trains throughout the world. J. Water Supply Res. Technol.-AQUA 2013, 62, 321–338. [Google Scholar] [CrossRef]
- Du Pisani, P.; Menge, J. Direct potable reclamation in Windhoek: A critical review of the design philosophy of new goreangab drinking water reclamation plant. J. Water Supply Res. Technol.-AQUA 2013, 13, 214–226. [Google Scholar] [CrossRef]
- Lahnsteiner, J.; Lempert, G. Water management in windhoek, namibia. Water Sci. Technol. J. Int. Assoc. Water Pollut. Res. 2007, 55, 441–448. [Google Scholar] [CrossRef]
- Haas, C.N.; Rose, J.B.; Gerba, C.P. Quantitative Microbial Risk Assessment; Wiley: Hoboken, NJ, USA, 1999. [Google Scholar]
- CDPH. Groundwater Replenishment Using Recycled Water; Department of Public Health: Sacramento, CA, USA, 2011.
- Regli, S.; Rose, J.B.; Haas, C.N.; Gerba, C.P. Modeling the risk from giardia and viruses in drinking water. J. Am. Water Works Ass. 1991, 83, 76–84. [Google Scholar]
- Soller, J.A.; Eftim, S.E.; Warren, I.; Nappier, S.P. Evaluation of microbiological risks associated with direct potable reuse. Microb. Risk Anal. 2016, 5, 3–14. [Google Scholar] [CrossRef]
- TWDB. Direct Potable Reuse Resource Document; Texas Water Development Board: Austin, TX, USA, 2014.
- Olivieri, A.; Eisenberg, D.; Soller, J.; Eisenberg, J.; Cooper, R.; Tchobanoglous, G.; Trussell, R.; Gagliardo, P. Estimation of pathogen removal in an advanced water treatment facility using monto carlo simulation. Water Sci. Technol. 1999, 40, 223–233. [Google Scholar] [CrossRef]
- Lim, K.-Y.; Wu, Y.; Jiang, S.C. Assessment of cryptosporidium and norovirus risk associated with de facto wastewater reuse in trinity river, Texas. Microb. Risk Anal. 2016, 5, 15–24. [Google Scholar] [CrossRef]
- Tchobanoglous, G.; Cotruvo, J.; Crook, J.; McDonald, E.; Olivieri, A.; Salveson, A.; Trussell, S. Framework for Direct Potable Reuse; WateReuse Research Foundation: Sacramento, CA, USA, 2015. [Google Scholar]
- Craun, G.F.; Brunkard, J.M.; Yoder, J.S.; Roberts, V.A.; Carpenter, J.; Wade, T.; Calderon, R.L.; Roberts, J.M.; Beach, M.J.; Roy, S.L. Causes of outbreaks associated with drinking water in the United States from 1971 to 2006. Clin. Microbiol. Rev. 2010, 23, 507–528. [Google Scholar] [CrossRef] [PubMed]
- Leverenz, H.L.; Tchobanoglous, G.; Asano, T. Direct potable reuse: A future imperative. J. Water Reuse Desalination 2011, 1, 2–10. [Google Scholar] [CrossRef]
- Eftim, S.E.; Hong, T.; Soller, J.; Boehm, A.; Warren, I.; Ichida, A.; Nappier, S.P. Occurrence of norovirus in raw sewage—A systematic literature review and meta-analysis. Water Res. 2017, 111, 366–374. [Google Scholar] [CrossRef] [PubMed]
- Pouillot, R.; Van Doren, J.M.; Woods, J.; Plante, D.; Smith, M.; Goblick, G.; Roberts, C.; Locas, A.; Hajen, W.; Stobo, J. Meta-analysis of the reduction of norovirus and male-specific coliphage concentrations in wastewater treatment plants. Appl. Environ. Microb. 2015, 81, 4669–4681. [Google Scholar] [CrossRef] [PubMed]
- Koivunen, J.; Lanki, E.; Rajala, R.; Siitonen, A.; Heinonen-Tanski, H. Determination of salmonellae from municipal wastewaters. Water Sci. Technol. 2001, 43, 221–224. [Google Scholar] [PubMed]
- Koivunen, J.; Siitonen, A.; Heinonen-Tanski, H. Elimination of enteric bacteria in biological-chemical wastewater treatment and tertiary filtration units. Water Res. 2003, 37, 690–698. [Google Scholar] [CrossRef]
- Lemarchand, K.; Lebaron, P. Occurrence of salmonella spp. And cryptosporidium spp. in a French coastal watershed: Relationship with fecal indicators. FEMS. Microbiol. Lett. 2003, 218, 203–209. [Google Scholar] [CrossRef]
- Rose, J.B.; Dickson, L.J.; Farrah, S.R.; Carnahan, R.P. Removal of pathogenic and indicator microorganisms by a full-scale water reclamation facility. Water Res. 1996, 30, 2785–2797. [Google Scholar] [CrossRef]
- Harrington, G.W.; Xagoraraki, I.; Assavasilavasukul, P.; Standridge, J.H. Effect of filtration conditions on removal of emerging waterborne pathogens. J. Am. Water Works Assoc. 2003, 95, 95–104. [Google Scholar]
- Shirasaki, N.; Matsushita, T.; Matsui, Y.; Oshiba, A.; Ohno, K. Estimation of norovirus removal performance in a coagulation—Rapid sand filtration process by using recombinant norovirus VLPs. Water Res. 2010, 44, 1307–1316. [Google Scholar] [CrossRef] [PubMed]
- Francy, D.S.; Stelzer, E.A.; Bushon, R.N.; Brady, A.M.; Williston, A.G.; Riddell, K.R.; Borchardt, M.A.; Spencer, S.K.; Gellner, T.M. Comparative effectiveness of membrane bioreactors, conventional secondary treatment, and chlorine and UV disinfection to remove microorganisms from municipal wastewaters. Water Res. 2012, 46, 4164–4178. [Google Scholar] [CrossRef] [PubMed]
- Ottoson, J.; Hansen, A.; Björlenius, B.; Norder, H.; Stenström, T. Removal of viruses, parasitic protozoa and microbial indicators in conventional and membrane processes in a wastewater pilot plant. Water Res. 2006, 40, 1449–1457. [Google Scholar] [CrossRef] [PubMed]
- Lodder, W.J.; de Roda Husman, A.M. Presence of noroviruses and other enteric viruses in sewage and surface waters in the Netherlands. Appl. Environ. Microb. 2005, 71, 1453–1461. [Google Scholar] [CrossRef] [PubMed]
- Anderson, W.B.; DeLoyde, J.L.; Van Dyke, M.I.; Huck, P.M. Influence of design and operating conditions on the removal of MS2 bacteriophage by pilot-scale multistage slow sand filtration. J. Water Supply Res. Technol-AQUA 2009, 58, 450–462. [Google Scholar] [CrossRef]
- Hong, S.; Miller, F.; Taylor, J. Assessing pathogen removal efficiency of microfiltration by monitoring membrane integrity. Water Sci. Technol. Water Supply 2001, 1, 43–48. [Google Scholar]
- Matsushita, T.; Shirasaki, N.; Tatsuki, Y.; Matsui, Y. Investigating norovirus removal by microfiltration, ultrafiltration, and precoagulation–microfiltration processes using recombinant norovirus virus-like particles and real-time immuno-PCR. Water Res. 2013, 47, 5819–5827. [Google Scholar] [CrossRef] [PubMed]
- Adham, S.; Gagliardo, P.; Smith, D.; Ross, D.; Gramith, K.; Trussell, R. Monitoring the integrity of reverse osmosis membranes. Desalination 1998, 119, 143–150. [Google Scholar] [CrossRef]
- Governal, R.; Gerba, C. Removal of MS-2 and PRD-1 bacteriophages from an ultrapure water system. J. Ind. Microbiol. Biotechnol. 1999, 23, 166–172. [Google Scholar] [CrossRef]
- Gerba, C.P.; Naranjo, J.E.; Hansan, M.N. Evaluation of a combined portable reverse osmosis and iodine resin drinking water treatment system for control of enteric waterborne pathogens. J. Environ. Sci. Health A 1997, 32, 2337–2354. [Google Scholar] [CrossRef]
- Craik, S.A.; Weldon, D.; Finch, G.R.; Bolton, J.R.; Belosevic, M. Inactivation of cryptosporidium parvum oocysts using medium-and low-pressure ultraviolet radiation. Water Res. 2001, 35, 1387–1398. [Google Scholar] [CrossRef]
- Sherchan, S.P.; Snyder, S.A.; Gerba, C.P.; Pepper, I.L. Inactivation of MS2 coliphage by UV and hydrogen peroxide: Comparison by cultural and molecular methodologies. J. Environ. Sci. Health A 2014, 49, 397–403. [Google Scholar] [CrossRef] [PubMed]
- Payment, P.; Franco, E. Clostridium perfringens and somatic coliphages as indicators of the efficiency of drinking water treatment for viruses and protozoan cysts. Appl. Environ. Microb. 1993, 59, 2418–2424. [Google Scholar]
- Tanner, B.; Kuwahara, S.; Gerba, C.P.; Reynolds, K.A. Evaluation of electrochemically generated ozone for the disinfection of water and wastewater. Water Sci. Technol. 2004, 50, 19–25. [Google Scholar] [PubMed]
- Fu, C.; Xie, X.; Huang, J.; Zhang, T.; Wu, Q.; Chen, J.; Hu, H. Monitoring and evaluation of removal of pathogens at municipal wastewater treatment plants. Water Sci. Technol. 2010, 61, 1589–1599. [Google Scholar] [CrossRef] [PubMed]
- Rose, J.B.; Farrah, S.R.; Harwood, V.J.; Levine, A.; Lukasik, J.; Menendez, P.; Scott, T.M. Reduction of Pathogens, Indicator Bacteria, and Alternative Indicators by Wastewater Treatment and Reclamation Processes; WERF: Alexandria, VA, USA, 2004. [Google Scholar]
- Taran-Benshoshan, M.; Ofer, N.; Dalit, V.O.; Aharoni, A.; Revhun, M.; Nitzan, Y.; Nasser, A.M. Cryptosporidium and giardia removal by secondary and tertiary wastewater treatment. J. Environ. Sci. Heal. A 2015, 50, 1265–1273. [Google Scholar] [CrossRef] [PubMed]
- Marti, E.; Monclús, H.; Jofre, J.; Rodriguez-Roda, I.; Comas, J.; Balcázar, J.L. Removal of microbial indicators from municipal wastewater by a membrane bioreactor (MBR). Bioresour. Technol. 2011, 102, 5004–5009. [Google Scholar] [CrossRef] [PubMed]
- Chaudhry, R.M.; Nelson, K.L.; Drewes, J.E. Mechanisms of pathogenic virus removal in a full-scale membrane bioreactor. Environ. Sci. Technol. 2015, 49, 2815–2822. [Google Scholar] [CrossRef] [PubMed]
- Beauchamp, N.; Bouchard, C.; Lence, B.J. Qmra-based reliability analysis to assess the performance of an ultrafiltration plant. J. Water Supply Res. Technol-AQUA 2011, 60, 89–100. [Google Scholar] [CrossRef]
- Gómez, M.; Plaza, F.; Garralón, G.; Pérez, J.; Gómez, M.A. A comparative study of tertiary wastewater treatment by physico-chemical-uv process and macrofiltration–ultrafiltration technologies. Desalination 2007, 202, 369–376. [Google Scholar] [CrossRef]
- Betancourt, W.Q.; Rose, J.B. Drinking water treatment processes for removal of cryptosporidium and giardia. Vet. Parasitol. 2004, 126, 219–234. [Google Scholar] [CrossRef] [PubMed]
- Albinana-Gimenez, N.; Clemente-Casares, P.; Bofill-Mas, S.; Hundesa, A.; Ribas, F.; Girones, R. Distribution of human polyoma-viruses, adenoviruses, and hepatitis E virus in the environment and in a drinking-water treatment plant. Environ. Sci. Technol. 2006, 40, 7416–7422. [Google Scholar] [CrossRef] [PubMed]
- Hijnen, W.A.M.; Brouwer-Hanzens, A.J.; Charles, K.J.; Medema, G.J. Transport of MS2 phage, escherichia coli, clostridium perfringens, cryptosporidium parvum, and giardia intestinalis in a gravel and a sandy soil. Environ. Sci. Technol. 2005, 39, 7860–7868. [Google Scholar] [CrossRef] [PubMed]
- Cheng, H.-W.A.; Lucy, F.E.; Graczyk, T.K.; Broaders, M.A.; Tamang, L.; Connolly, M. Fate of cryptosporidium parvum and cryptosporidium hominis oocysts and giardia duodenalis cysts during secondary wastewater treatments. Parasitol. Res. 2009, 105, 689. [Google Scholar] [CrossRef] [PubMed]
- Rose, J.B.; Huffman, D.E.; Riley, K.; Farrah, S.R.; Lukasik, J.O.; Hamann, C.L. Reduction of enteric microorganisms at the upper occoquan sewage authority water reclamation plant. Water Environ. Res. 2001, 711–720. [Google Scholar] [CrossRef]
- Zhou, J.; Wang, X.C.; Ji, Z.; Xu, L.; Yu, Z. Source identification of bacterial and viral pathogens and their survival/fading in the process of wastewater treatment, reclamation, and environmental reuse. World J. Microbiol. Biotechnol. 2015, 31, 109–120. [Google Scholar] [CrossRef] [PubMed]
- Reardon, R.; DiGiano, F.; Aitken, M.; Paranjape, S.; Kim, J.H.; Chang, S.-Y. Membrane Treatment of Secondary Effluents for Subsequent Use; Intl Water Assn: London, UK, 2005. [Google Scholar]
- Chaudhry, R.M.; Holloway, R.W.; Cath, T.Y.; Nelson, K.L. Impact of virus surface characteristics on removal mechanisms within membrane bioreactors. Water Res. 2015, 84, 144–152. [Google Scholar] [CrossRef] [PubMed]
- USEPA. Ultraviolet Disinhfection Guidance Manual for the Final Long Term 2 Enhanced Surface Water Treatment Rule; USEPA: Washington, DC, USA, 2006.
- Korich, D.; Mead, J.; Madore, M.; Sinclair, N.; Sterling, C.R. Effects of ozone, chlorine dioxide, chlorine, and monochloramine on cryptosporidium parvum oocyst viability. Appl. Environ. Microbiol. 1990, 56, 1423–1428. [Google Scholar]
- Haas, C.N.; Trussell, R.R. Frameworks for assessing reliability of multiple, independent barriers in potable water reuse. Water Sci. Technol. 1998, 38, 1–8. [Google Scholar] [CrossRef]
- Rice, J.; Wutich, A.; Westerhoff, P. Assessment of de facto wastewater reuse across the US: Trends between 1980 and 2008. Environ. Sci. Technol. 2013, 47, 11099–11105. [Google Scholar] [CrossRef] [PubMed]
- Messner, M.J.; Berger, P.; Nappier, S.P. Fractional poisson—A simple dose-response model for human norovirus. Risk Anal. 2014, 34, 1820–1829. [Google Scholar] [CrossRef] [PubMed]
- Van Abel, N.; Schoen, M.E.; Kissel, J.C.; Meschke, J.S. Comparison of risk predicted by multiple norovirus dose–response models and implications for quantitative microbial risk assessment. Risk Anal. 2016, 37, 245–264. [Google Scholar] [CrossRef] [PubMed]
- De Man, H.; van den Berg, H.; Leenen, E.; Schijven, J.; Schets, F.; van der Vliet, J.; van Knapen, F.; de Roda Husman, A. Quantitative assessment of infection risk from exposure to waterborne pathogens in urban floodwater. Water Res. 2014, 48, 90–99. [Google Scholar] [CrossRef] [PubMed]
- Ahmed, W.; Vieritz, A.; Goonetilleke, A.; Gardner, T. Health risk from the use of roof-harvested rainwater in southeast Queensland, Australia, as potable or nonpotable water, determined using quantitative microbial risk assessment. Appl. Environ. Microbial. 2010, 76, 7382–7391. [Google Scholar] [CrossRef] [PubMed]
- USEPA. Exposure Factors Handbook; EPA: Washington, DC, USA, 2011.
- Pouillot, R.; Delignette-Muller, M.L. Evaluating variability and uncertainty in microbial risk assessment using two R packages. Int. J. Food. Microbiol. 2010, 142, 330–340. [Google Scholar] [CrossRef] [PubMed]
- Karavarsamis, N.; Hamilton, A. Estimators of annual probability of infection for quantitative microbial risk assessment. J. Water Health 2010, 8, 365–373. [Google Scholar] [CrossRef] [PubMed]
- Mattle, M.J.; Crouzy, B.; Brennecke, M.; Wigginton, K.R.; Perona, P.; Kohn, T. Impact of virus aggregation on inactivation by peracetic acid and implications for other disinfectants. Environ. Sci. Technol. 2011, 45, 7710–7717. [Google Scholar] [CrossRef] [PubMed]
- Sloan, D. Water reuse foundation direct raw water blending in big spring. In Proceedings of the Direct Potable Reuse Specialty Conference, Newport Beach, CA, USA, 7–8 November 2013. [Google Scholar]
- Da Silva, A.K.; Kavanagh, O.V.; Estes, M.K.; Elimelech, M. Adsorption and aggregation properties of norovirus GI and GII virus-like particles demonstrate differing responses to solution chemistry. Environ. Sci. Technol. 2010, 45, 520–526. [Google Scholar] [CrossRef] [PubMed]
- Langlet, J.; Ogorzaly, L.; Schrotter, J.-C.; Machinal, C.; Gaboriaud, F.; Duval, J.F.; Gantzer, C. Efficiency of MS2 phage and qβ phage removal by membrane filtration in water treatment: Applicability of real-time RT-PCR method. J. Membr. Sci. 2009, 326, 111–116. [Google Scholar] [CrossRef]
- Branch, A.; Trinh, T.; Carvajal, G.; Leslie, G.; Coleman, H.M.; Stuetz, R.M.; Drewes, J.E.; Khan, S.J.; Le-Clech, P. Hazardous events in membrane bioreactors—Part 3: Impacts on microorganism log removal efficiencies. J. Membr. Sci. 2016, 497, 514–523. [Google Scholar] [CrossRef]
- Barker, Z.A.; Stillwell, A.S. Implications of transitioning from de facto to engineered water reuse for power plant cooling. Environ. Sci. Technol. 2016, 50, 5379–5388. [Google Scholar] [CrossRef] [PubMed]
- Eisenberg, D.; Soller, J.; Sakaji, R.; Olivieri, A. A methodology to evaluate water and wastewater treatment plant reliability. Water Sci. Technol. 2001, 43, 91–99. [Google Scholar] [PubMed]
- Lindhe, A.; Rosén, L.; Norberg, T.; Bergstedt, O. Fault tree analysis for integrated and probabilistic risk analysis of drinking water systems. Water Res. 2009, 43, 1641–1653. [Google Scholar] [CrossRef] [PubMed]
- Westrell, T.; Bergstedt, O.; Stenström, T.; Ashbolt, N. A theoretical approach to assess microbial risks due to failures in drinking water systems. Int. J. Environ. Health Res. 2003, 13, 181–197. [Google Scholar] [CrossRef] [PubMed]
- Yang, J.; Schneider, O.D.; Jjemba, P.K.; Lechevallier, M.W. Microbial risk modeling for main breaks. J. Am. Water Works Assoc. 2015, 107, 2. [Google Scholar] [CrossRef]


| Train Scenarios | Cases Considered a | Type | Source Water | Treatment Train Processes | |||||||
|---|---|---|---|---|---|---|---|---|---|---|---|
| (1) | b, c | De facto | Wastewater impacted surface water | Coagulation/ sedimentation | Media filtration | chlorine | |||||
| (2) | a, c | DPR | Raw ww | Activated sludge | MF | RO | UV/H2O2 | chlorine | |||
| (3) | a, c | DPR | Raw ww | Activated sludge | Ozone | BAC | MF | RO | UV/H2O2 | chlorine | |
| (4) | a, c | DPR | Raw ww | MBR | RO | UV/H2O2 | chlorine | ||||
| (5) | a, c | DPR | Raw ww | Activated sludge | Ozone | BAC | MF | NF | UV/H2O2 | BAC | chlorine |
| Parameter | Symbol | Unit | Value | Distribution | Source |
|---|---|---|---|---|---|
| Norovirus | Cww,raw,No | gene copies per L | µ = 9.095, σ = 1.413 × 10⁻³ | Lognormal a | [19] |
| Salmonella spp. | Cww,raw,Sa | Number per L | µ = 7.171, σ = 2.985 | Lognormal | [22,23] |
| Cryptosporidium | Cww,raw,Cr | Number per L | µ = 2.262, µ = 0.944 | Lognormal | [24] |
| Process | Crytosporidium | Reference | Norovirus | Reference | Salmonella | Reference |
|---|---|---|---|---|---|---|
| Conventional drinking water treatment | ||||||
| Coagulation + sedimentation + granular media filtration | N (2, 0.5) a | [25] | N (2.1, 0.7) | [26] | N (1.77, 0.25) | [25] |
| Chlorine disinfection | N (0.41, 0.4) | [24] | N (1.68, 0.24) | [27] | N (2.57, 0.35) | [27] |
| Conventional wastewater treatment b | ||||||
| Sedimentation + Activated sludge | N (1.58, 1.3) c | [28] | N (2.1, 0.78) | [29] | N (3.32, 0.76) c | [28] |
| Filtration | - | - | N (0.5, 0.02) | [30] | - | - |
| DPR advanced treatment processes | ||||||
| Microfiltration (MF) | N (4.6, 0.96) | [31] | N (0.6, 0.1) | [32] | N (5.96, 1.47) | [31] |
| Reverse osmosis (RO) | N (4.5, 0.73) | [33] | N (4.3, 0.34) | [34] | N (6, 0.6) | [35] |
| UV | N (2.2, 1.17) | [36] | N (4.96, 0.85) | [37] | N (3.82, 0.34) | [27] |
| Ozone | 1.2 | [38] | 5.4 | [39] | 4.15 | [39] |
| Biological activated carbon filtration (BAC) | U (0,0.85) d | [12,40,41,42] | U (0, 1) | [12] | U (0.5, 2) | [12,21] |
| Membrane bioreactor (MBR) | N (4.3, 0.6) | [43] | N (5.10, 0.41) | [44] | N (6.26, 0.75) | [27] |
| Nanofiltration (NF) e | N (5.52, 0.51) | [45] | N (4, 0.1) | [32] | N (4.8, 0.6) | [46] |
| Parameter | Symbol | Unit | Value | Distribution | Source |
|---|---|---|---|---|---|
| Intake rate | Ving,dw | L per day | µ = −0.630, σ = 0.989 | Lognormal a | [63] |
| Exposure frequency | ndw | times per year | 365 | Point | Assumption |
| Cryptosporidium dose response | r | Unitless | 4.19 × 10⁻³ | Point | [9] |
| Norovirus dose response- aggregated | P | Unitless | 0.72 | Point | [59] |
| µ | Unitless | 1106 | Point | ||
| Norovirus dose response-disaggregated | P | Unitless | 0.72 | Point | [59] |
| µ | Unitless | 1 | Point | ||
| Salmonella nontyphoid dose response | α | Unitless | 0.3126 | Point | [9] |
| β | Unitless | 2884 | Point |
| Parameter | Cryptosporidium | Norovirus-Disagg. | Norovirus-Agg. | Salmonella | ||||||||||||
|---|---|---|---|---|---|---|---|---|---|---|---|---|---|---|---|---|
| 2 | 3 | 4 | 5 | 2 | 3 | 4 | 5 | 2 | 3 | 4 | 5 | 2 | 3 | 4 | 5 | |
| Wastewater concentration (Cww,raw) | 0.17 | 0.16 | 0.24 | 0.14 | 0.002 | 0.005 | 0.011 | −0.001 | −0.006 | −0.006 | −0.002 | 0.0001 | 0.092 | NA a | 0.277 | NA |
| Contact rate (Ving,dw) | −0.004 | −0.005 | 0.003 | −0.003 | −0.0004 | 0.002 | 0.004 | −0.003 | −0.001 | −0.001 | −0.005 | 0.005 | 0.0004 | 0.005 | ||
| Chlorine disinfection | −0.17 | −0.16 | −0.24 | −0.14 | −0.19 | −0.17 | −0.22 | −0.16 | −0.19 | −0.05 | −0.22 | −0.04 | −0.03 | −0.09 | ||
| Conventional ww treatment | −0.56 | −0.52 | −0.45 | −0.62 | −0.62 | −0.55 | −0.61 | −0.14 | −0.12 | −0.06 | ||||||
| MF | −0.41 | −0.39 | −0.33 | −0.08 | −0.06 | −0.07 | −0.08 | −0.02 | −0.02 | −0.09 | ||||||
| RO | −0.32 | −0.28 | −0.44 | −0.26 | −0.24 | −0.32 | −0.26 | −0.07 | −0.31 | −0.04 | −0.15 | |||||
| UV | −0.50 | −0.47 | −0.71 | −0.40 | −0.68 | −0.61 | −0.81 | −0.61 | −0.67 | −0.15 | −0.81 | −0.12 | −0.03 | −0.08 | ||
| BAC | −0.10 | −0.08 | −0.21 | −0.20 | −0.06 | −0.05 | ||||||||||
| MBR | −0.36 | −0.39 | −0.38 | −0.17 | ||||||||||||
| NF | −0.18 | −0.07 | −0.02 | |||||||||||||
© 2017 by the authors. Licensee MDPI, Basel, Switzerland. This article is an open access article distributed under the terms and conditions of the Creative Commons Attribution (CC BY) license (http://creativecommons.org/licenses/by/4.0/).
Share and Cite
Chaudhry, R.M.; Hamilton, K.A.; Haas, C.N.; Nelson, K.L. Drivers of Microbial Risk for Direct Potable Reuse and de Facto Reuse Treatment Schemes: The Impacts of Source Water Quality and Blending. Int. J. Environ. Res. Public Health 2017, 14, 635. https://doi.org/10.3390/ijerph14060635
Chaudhry RM, Hamilton KA, Haas CN, Nelson KL. Drivers of Microbial Risk for Direct Potable Reuse and de Facto Reuse Treatment Schemes: The Impacts of Source Water Quality and Blending. International Journal of Environmental Research and Public Health. 2017; 14(6):635. https://doi.org/10.3390/ijerph14060635
Chicago/Turabian StyleChaudhry, Rabia M., Kerry A. Hamilton, Charles N. Haas, and Kara L. Nelson. 2017. "Drivers of Microbial Risk for Direct Potable Reuse and de Facto Reuse Treatment Schemes: The Impacts of Source Water Quality and Blending" International Journal of Environmental Research and Public Health 14, no. 6: 635. https://doi.org/10.3390/ijerph14060635
APA StyleChaudhry, R. M., Hamilton, K. A., Haas, C. N., & Nelson, K. L. (2017). Drivers of Microbial Risk for Direct Potable Reuse and de Facto Reuse Treatment Schemes: The Impacts of Source Water Quality and Blending. International Journal of Environmental Research and Public Health, 14(6), 635. https://doi.org/10.3390/ijerph14060635