
Combined Effects of Prenatal Exposures to Environmental Chemicals on Birth Weight


Abstract
:1. Introduction
2. Experimental Section
2.1. Study Population
2.2. Chemical Exposures
2.3. Statistical Analysis
2.3.1. Single Pollutant Regression Models
2.3.2. Principal Component Regression
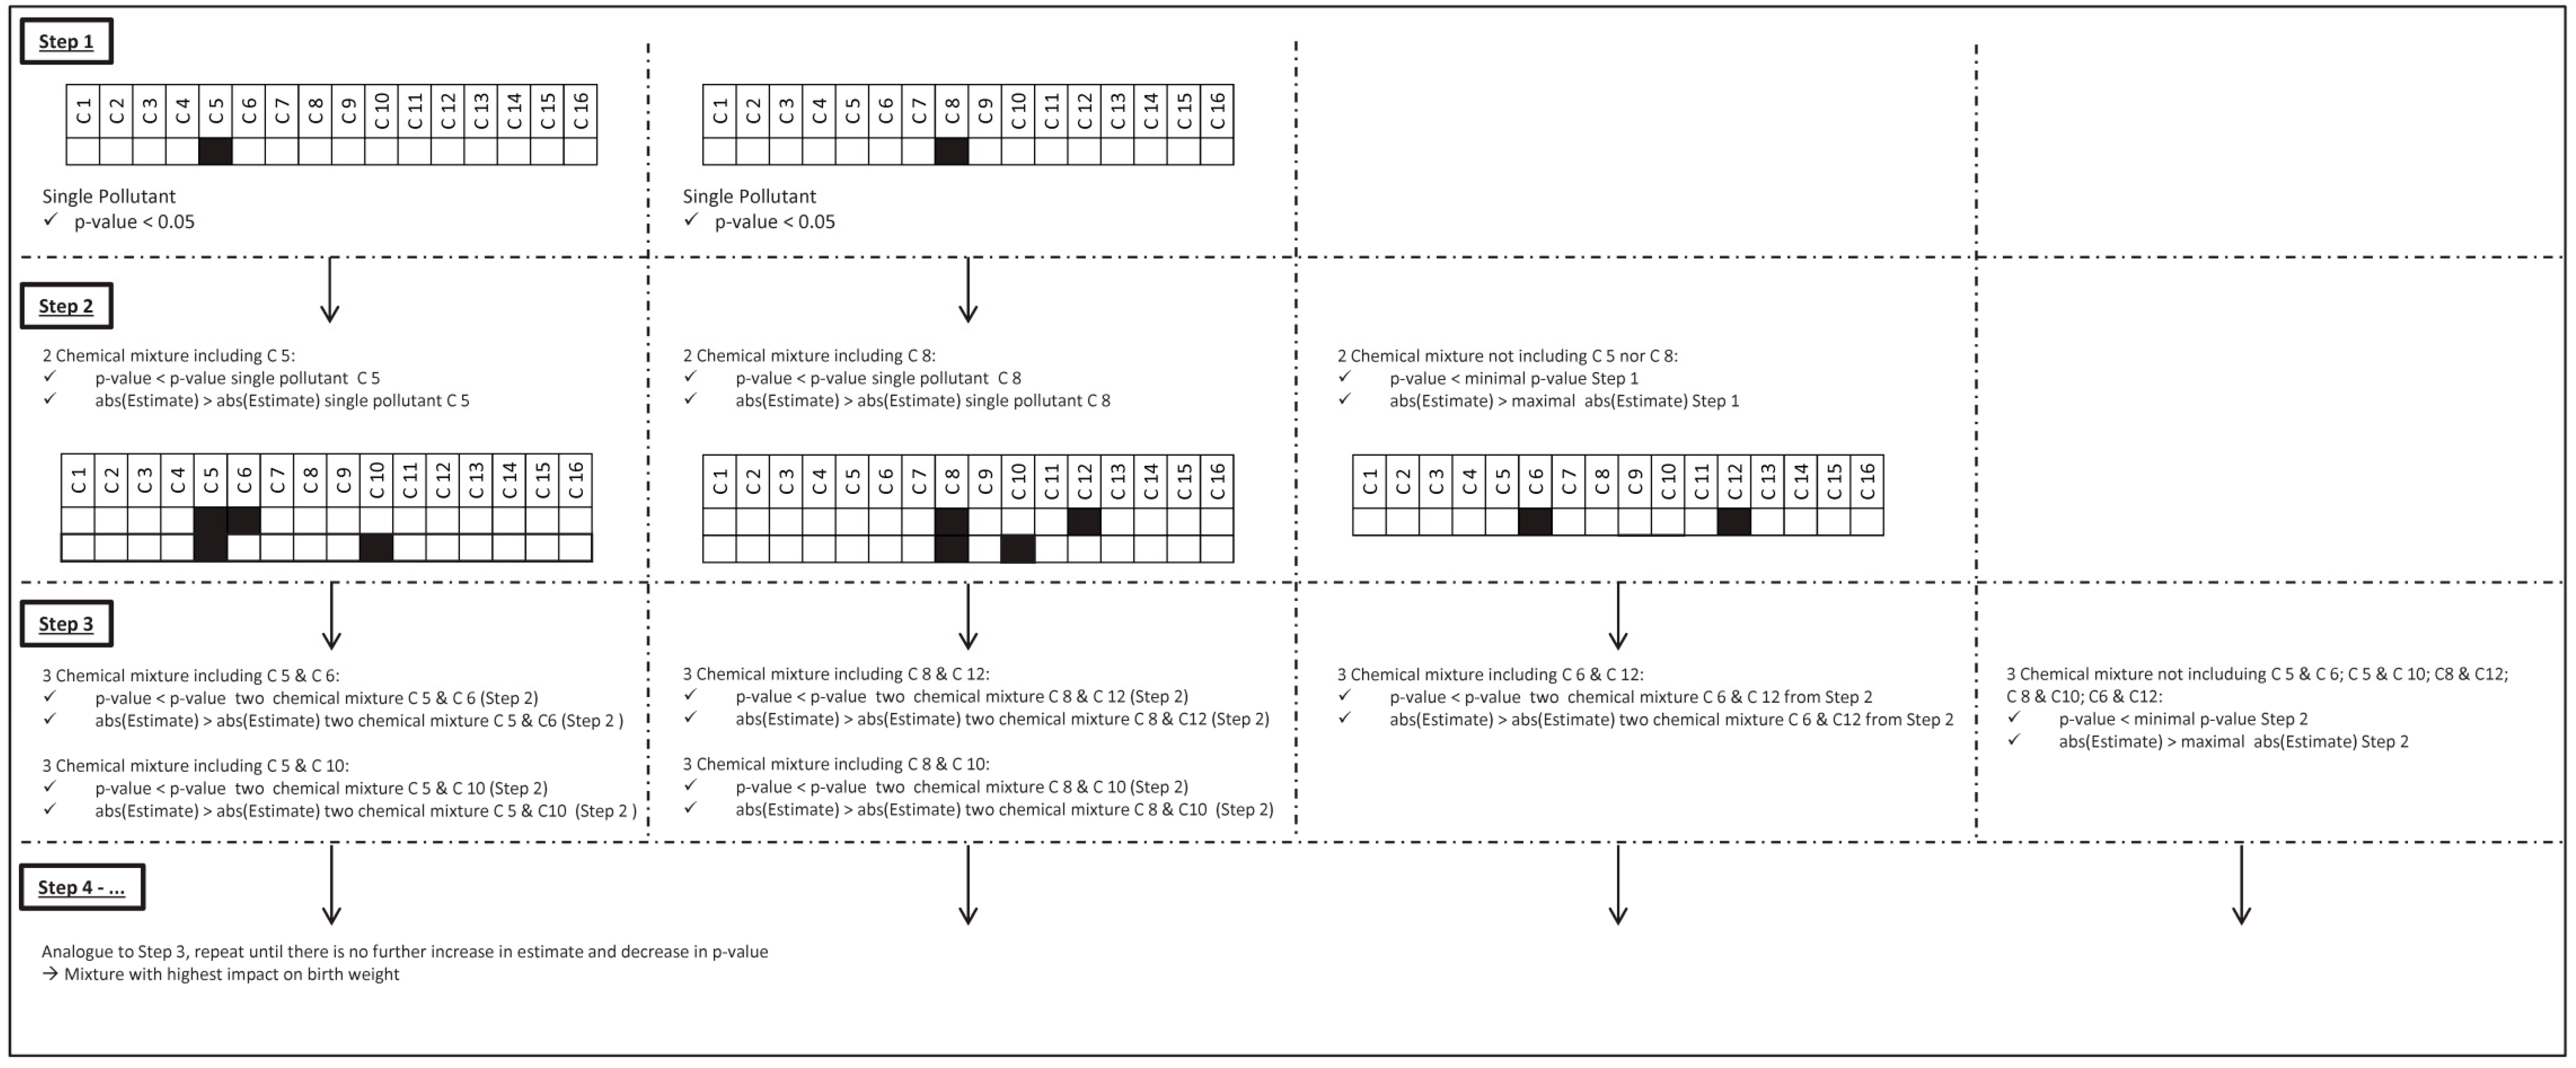
2.3.3. Exploring the Effect of Mixtures
3. Results
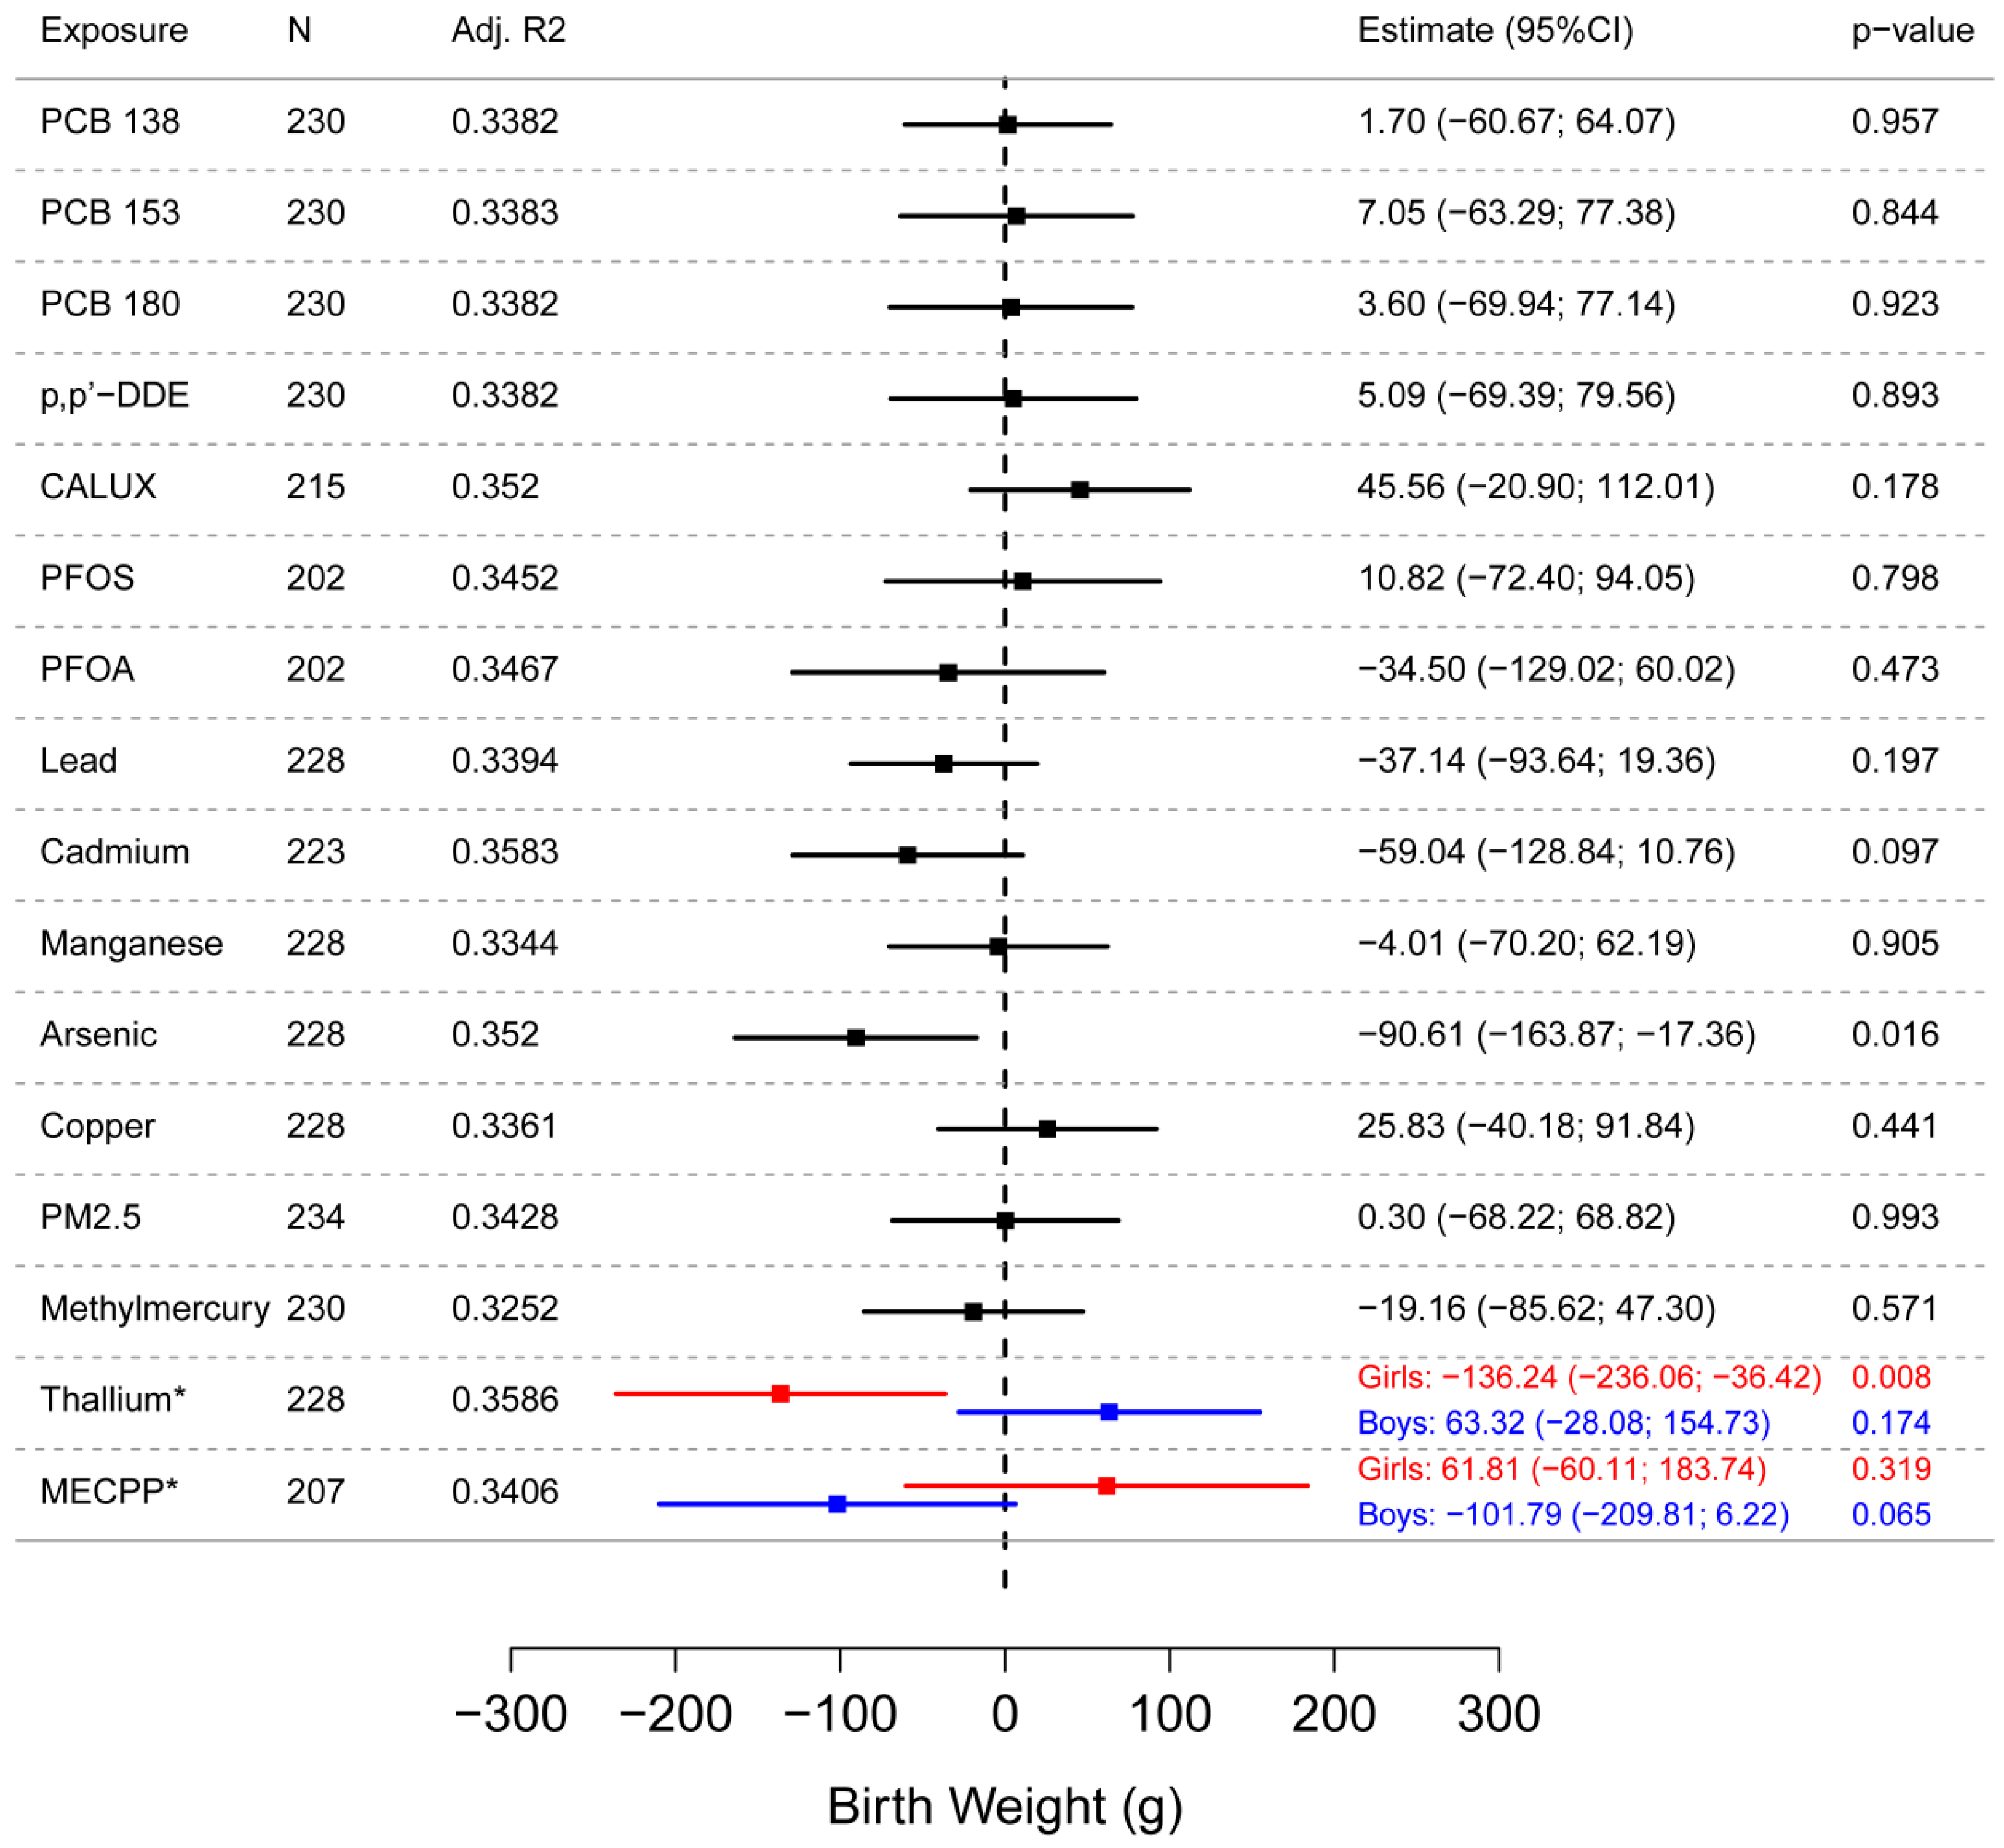
3.1. Single Pollutant Regression Models
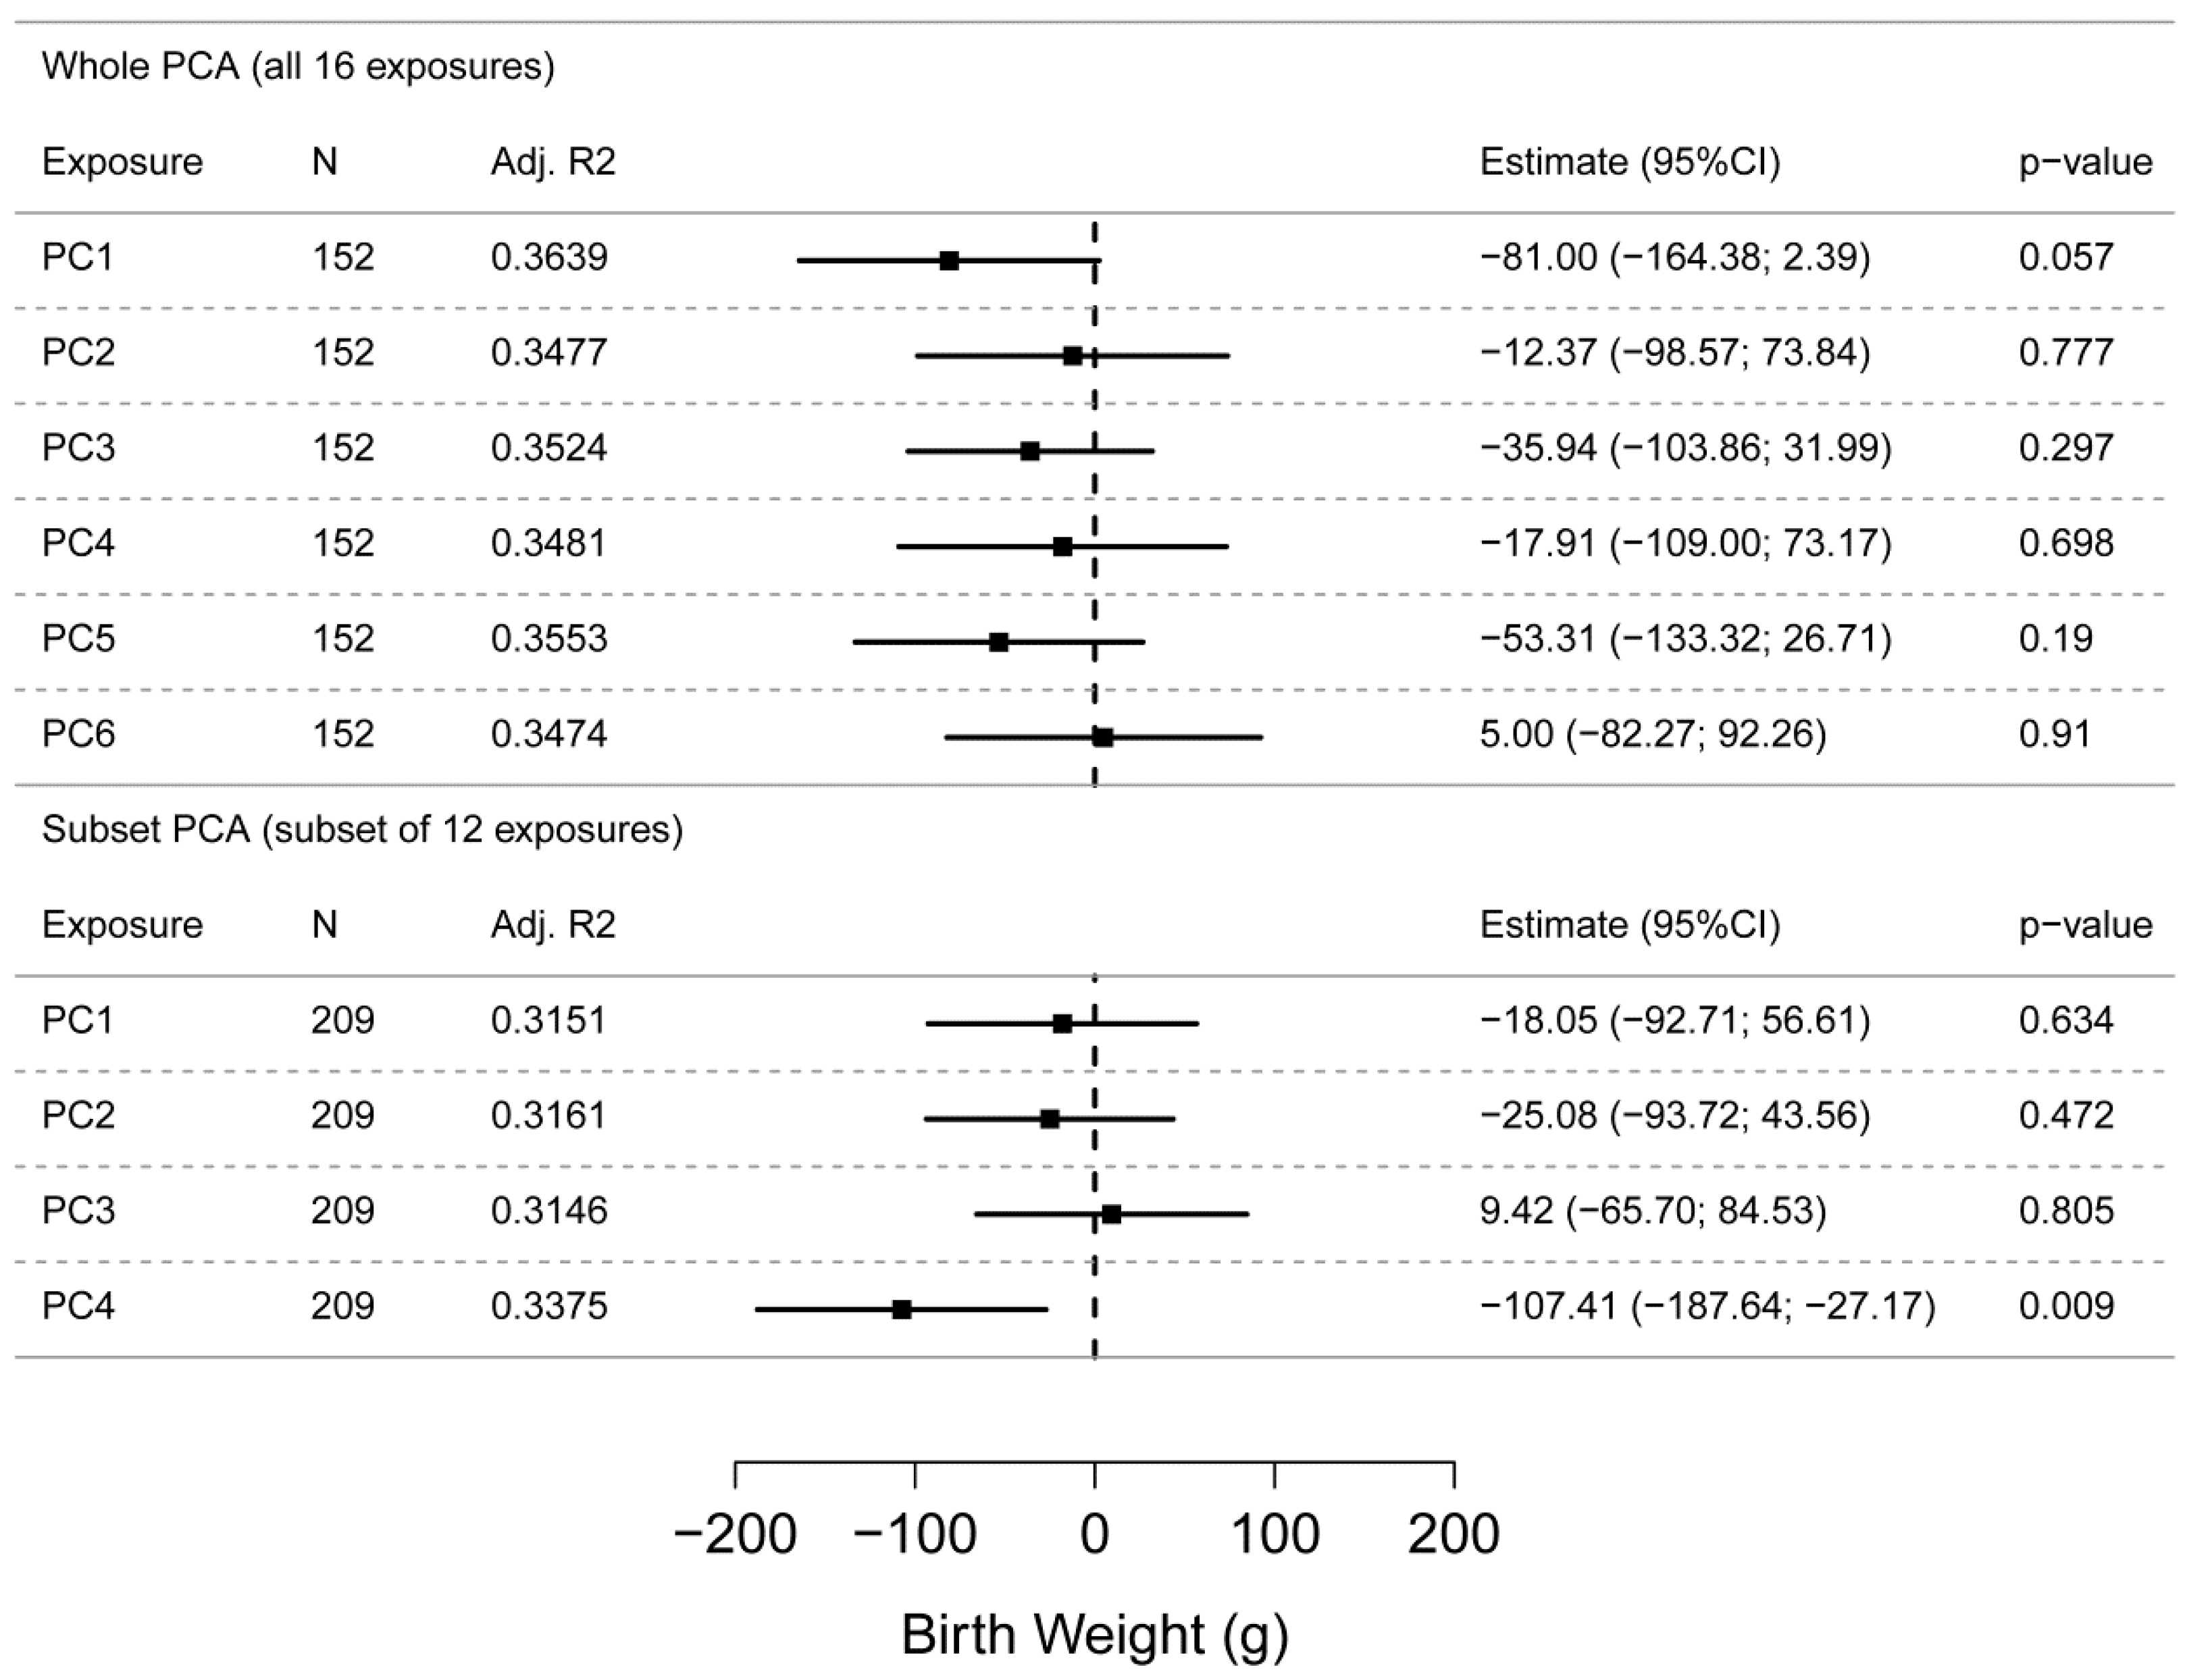
3.2. Principal Component Regression (PCR)
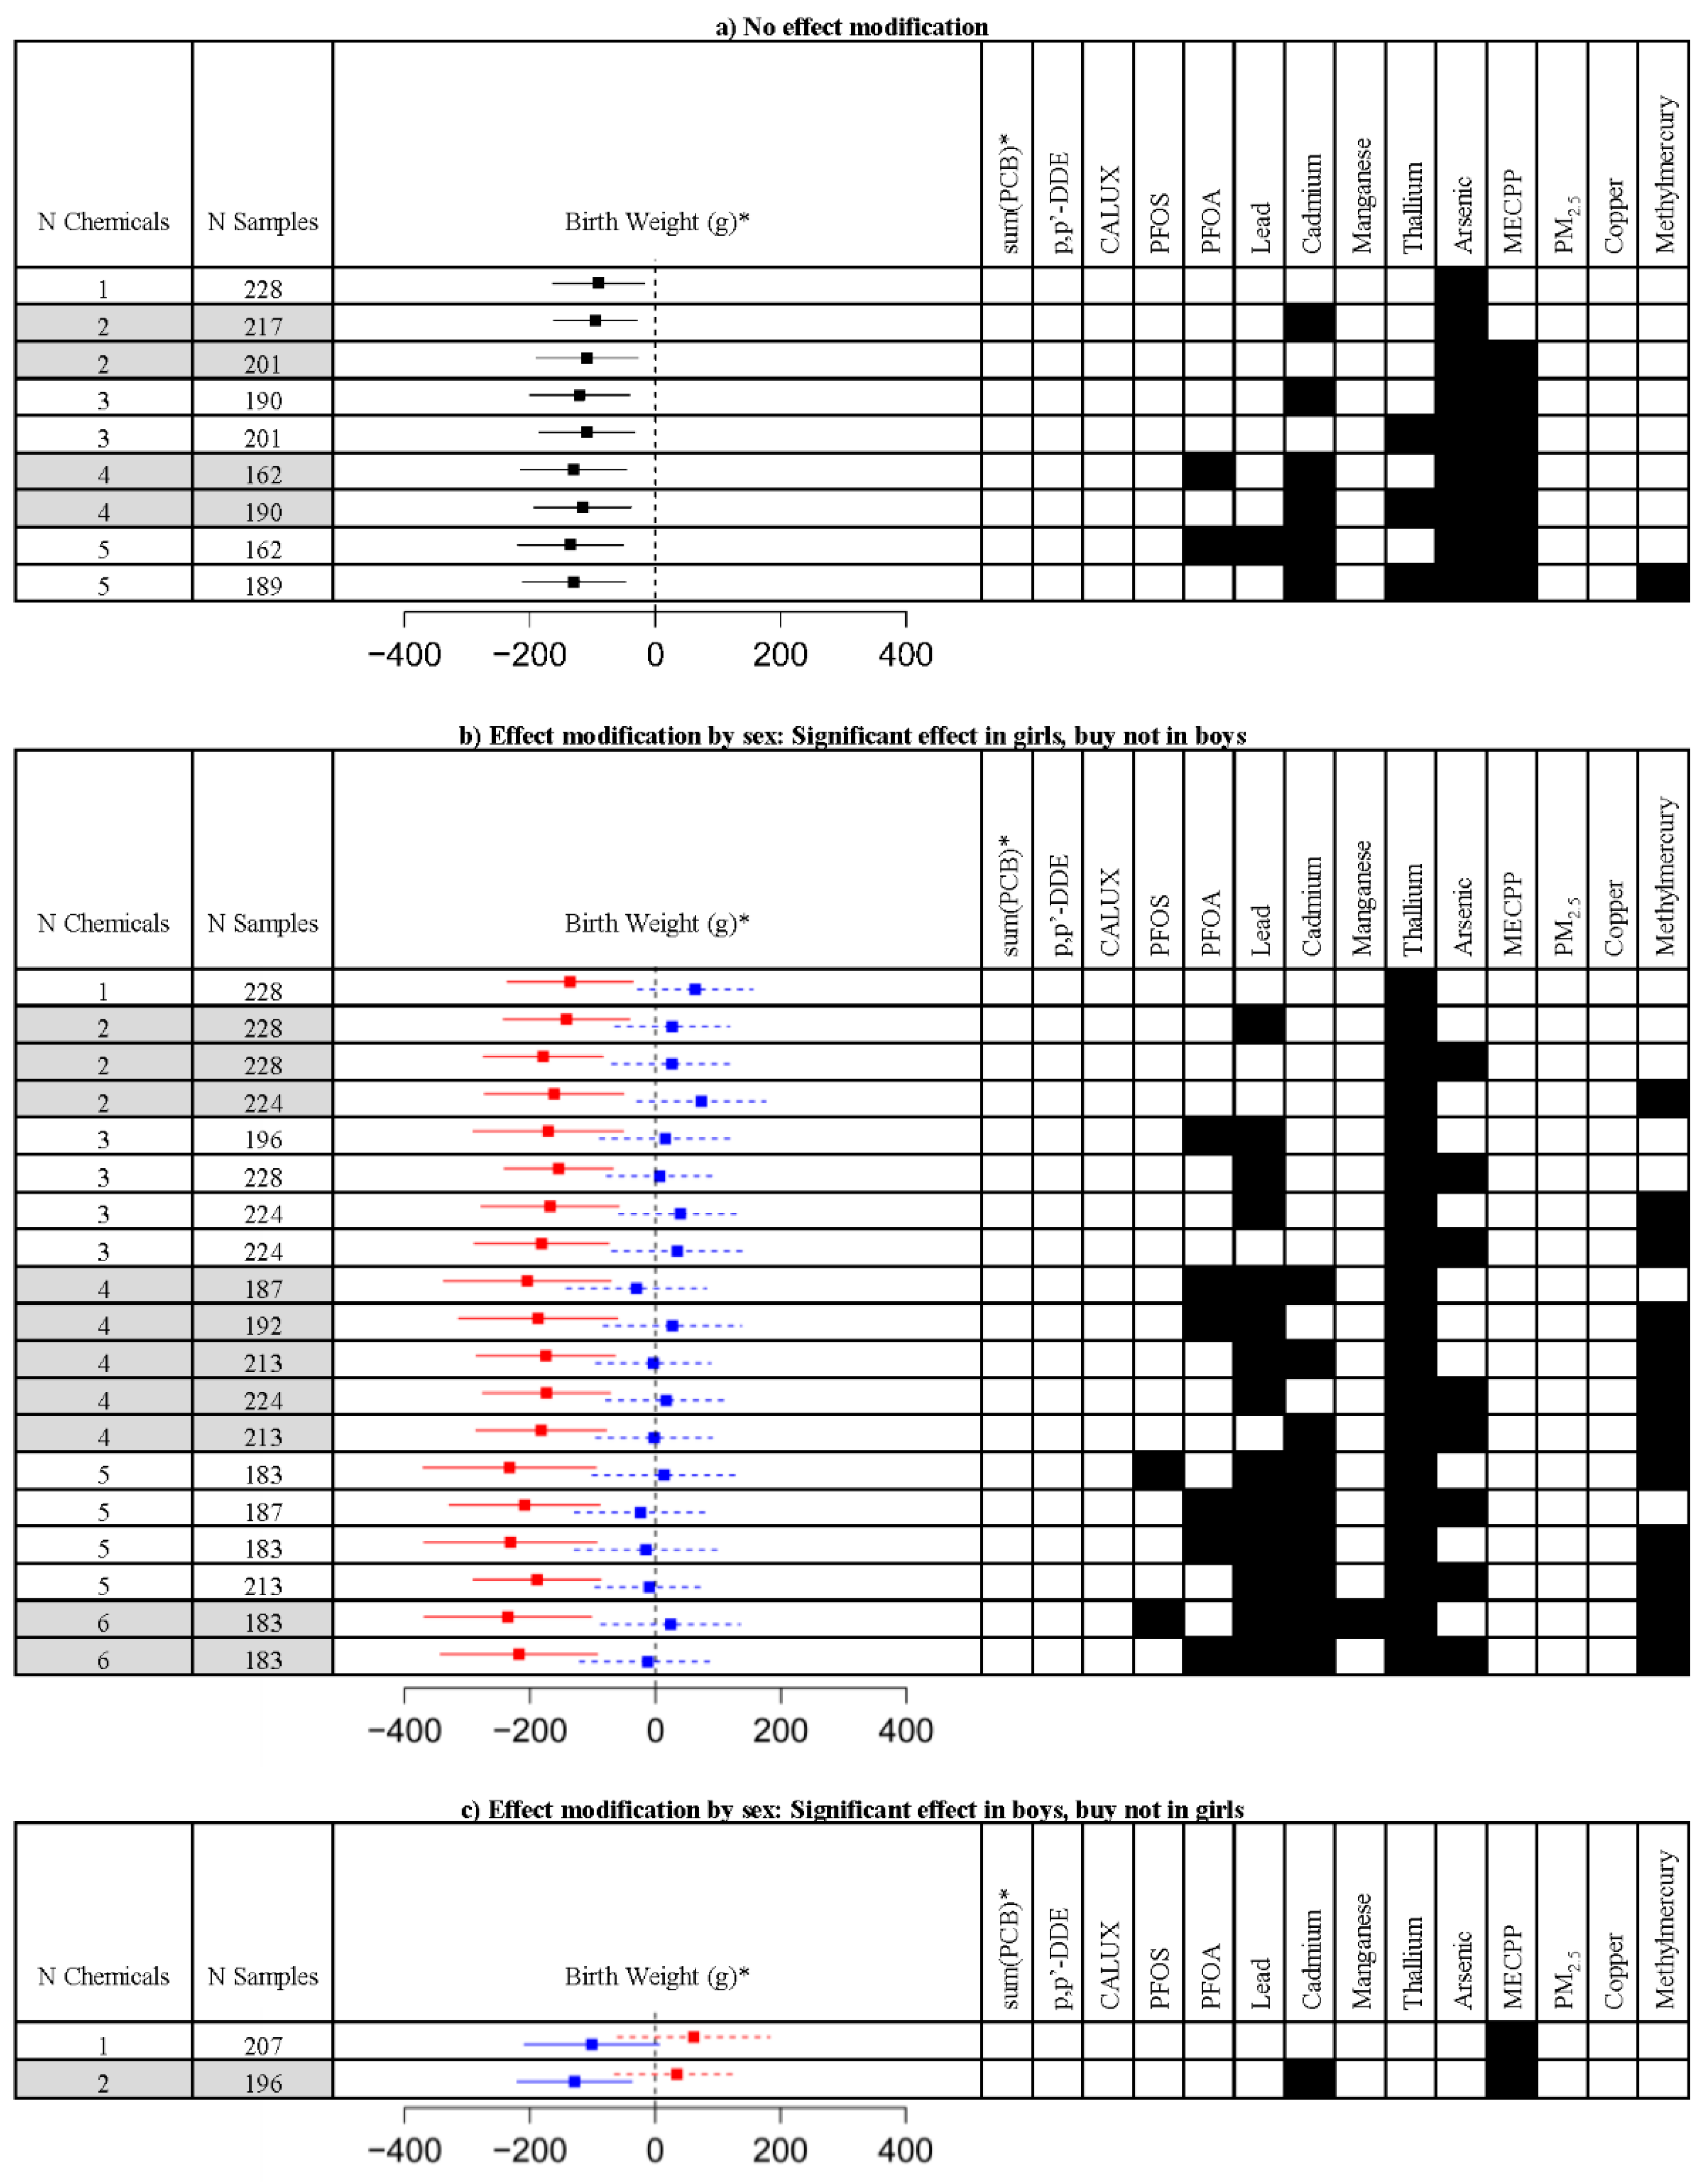
3.3. Exploring the Effect of Mixtures
4. Discussion
5. Conclusions
Supplementary Materials
Acknowledgments
Author Contributions
Conflicts of Interest
References
- Barker, D.J. In utero programming of chronic disease. Clin. Sci. (Lond.) 1998, 95, 115–128. [Google Scholar] [CrossRef] [PubMed]
- Balbus, J.M.; Barouki, R.; Birnbaum, L.S.; Etzel, R.A.; Gluckman, P.D.; Grandjean, P.; Hancock, C.; Hanson, M.A.; Heindel, J.J.; Hoffman, K.; et al. Early-life prevention of non-communicable diseases. Lancet 2013, 381, 3–4. [Google Scholar] [CrossRef]
- Seckl, J.R. Prenatal glucocorticoids and long-term programming. Eur. J. Endocrinol. 2004, 151, U49–U62. [Google Scholar] [CrossRef] [PubMed]
- Ong, K.K.; Ahmed, M.L.; Emmett, P.M.; Preece, M.A.; Dunger, D.B. Association between postnatal catch-up growth and obesity in childhood: Prospective cohort study. BMJ 2000, 320, 967–971. [Google Scholar] [CrossRef] [PubMed]
- Vucenik, I.; Stains, J.P. Obesity and cancer risk: Evidence, mechanisms, and recommendations. Ann. N. Y. Acad. Sci. 2012, 1271, 37–43. [Google Scholar] [CrossRef] [PubMed]
- La Merrill, M.; Birnbaum, L.S. Childhood obesity and environmental chemicals. Mt. Sinai J. Med. 2011, 78, 22–48. [Google Scholar] [CrossRef] [PubMed]
- Wang, G.; Chen, Z.; Bartell, T.; Wang, X. Early Life Origins of Metabolic Syndrome: The Role of Environmental Toxicants. Curr. Environ. Health Rep. 2014, 1, 78–89. [Google Scholar] [CrossRef] [PubMed]
- Winckelmans, E.; Cox, B.; Martens, E.; Fierens, F.; Nemery, B.; Nawrot, T.S. Fetal growth and maternal exposure to particulate air pollution—More marked effects at lower exposure and modification by gestational duration. Environ. Res. 2015, 140, 611–618. [Google Scholar] [CrossRef] [PubMed]
- Stieb, D.M.; Chen, L.; Eshoul, M.; Judek, S. Ambient air pollution, birth weight and preterm birth: A systematic review and meta-analysis. Environ. Res. 2012, 117, 100–111. [Google Scholar] [CrossRef] [PubMed]
- Ronco, A.M.; Urrutia, M.; Montenegro, M.; Llanos, M.N. Cadmium exposure during pregnancy reduces birth weight and increases maternal and foetal glucocorticoids. Toxicol. Lett. 2009, 188, 186–191. [Google Scholar] [CrossRef] [PubMed]
- Olsen, G.W.; Butenhoff, J.L.; Zobel, L.R. Perfluoroalkyl chemicals and human fetal development: An epidemiologic review with clinical and toxicological perspectives. Reprod. Toxicol. 2009, 27, 212–230. [Google Scholar] [CrossRef] [PubMed]
- Tang-Péronard, J.L.; Andersen, H.R.; Jensen, T.K.; Heitmann, B.L. Endocrine-disrupting chemicals and obesity development in humans: A review. Obes. Rev. 2011, 12, 622–636. [Google Scholar] [CrossRef] [PubMed]
- Newbold, R.R. Impact of environmental endocrine disrupting chemicals on the development of obesity. Hormones 2010, 9, 206–217. [Google Scholar] [CrossRef] [PubMed]
- Barr, D.B.; Bishop, A.; Needham, L.L. Concentrations of xenobiotic chemicals in the maternal-fetal unit. Reprod. Toxicol. 2007, 23, 260–266. [Google Scholar] [CrossRef] [PubMed]
- Crinnion, W.J. The CDC fourth national report on human exposure to environmental chemicals: What it tells us about our toxic burden and how it assist environmental medicine physicians. Altern. Med. Rev. 2010, 15, 101–109. [Google Scholar] [PubMed]
- Den Hond, E.; Govarts, E.; Willems, H.; Smolders, R.; Casteleyn, L.; Kolossa-Gehring, M.; Schwedler, G.; Seiwert, M.; Fiddicke, U.; Castaño, A.; et al. First Steps toward Harmonized Human Biomonitoring in Europe: Demonstration Project to Perform Human Biomonitoring on a European Scale. Environ. Health Perspect. 2015, 123, 255–263. [Google Scholar] [CrossRef] [PubMed]
- Van Larebeke, N.; Sioen, I.; Den Hond, E.; Nelen, V.; Van de Mieroop, E.; Nawrot, T.; Bruckers, L.; Schoeters, G.; Baeyens, W. Internal exposure to organochlorine pollutants and cadmium and self-reported health status: A prospective study. Int. J. Hyg. Environ. Health 2015, 218, 232–245. [Google Scholar] [CrossRef] [PubMed]
- Hadrup, N.; Taxvig, C.; Pedersen, M.; Nellemann, C.; Hass, U.; Vinggaard, A. M. Concentration addition, independent action and generalized concentration addition models for mixture effect prediction of sex hormone synthesis in vitro. PLoS ONE 2013, 8, e70490. [Google Scholar]
- Chen, C.; Wang, Y.; Qian, Y.; Zhao, X.; Wang, Q. The synergistic toxicity of the multiple chemical mixtures: Implications for risk assessment in the terrestrial environment. Environ. Int. 2015, 77, 95–105. [Google Scholar] [CrossRef] [PubMed]
- Vandenberg, L.N.; Colborn, T.; Hayes, T.B.; Heindel, J.J.; Jacobs, D.R.; Lee, D.-H.; Shioda, T.; Soto, A.M.; vom Saal, F.S.; Welshons, W.V.; et al. Hormones and endocrine-disrupting chemicals: Low-dose effects and nonmonotonic dose responses. Endocr. Rev. 2012, 33, 378–455. [Google Scholar] [CrossRef] [PubMed]
- Sun, Z.; Tao, Y.; Li, S.; Ferguson, K.K.; Meeker, J.D.; Park, S.K.; Batterman, S.A.; Mukherjee, B. Statistical strategies for constructing health risk models with multiple pollutants and their interactions: Possible choices and comparisons. Environ. Health 2013, 12, 85. [Google Scholar] [CrossRef] [PubMed]
- Billionnet, C.; Sherrill, D.; Annesi-Maesano, I. Estimating the health effects of exposure to multi-pollutant mixture. Ann. Epidemiol. 2012, 22, 126–141. [Google Scholar] [CrossRef] [PubMed]
- Agay-Shay, K.; Martinez, D.; Valvi, D.; Garcia-Esteban, R.; Basagaña, X.; Robinson, O.; Casas, M.; Sunyer, J.; Vrijheid, M. Exposure to Endocrine-Disrupting Chemicals during Pregnancy and Weight at 7 Years of Age: A Multi-pollutant Approach. Environ. Health Perspect. 2015, 123, 1030–1037. [Google Scholar] [CrossRef] [PubMed]
- Park, S.K.; Tao, Y.; Meeker, J.D.; Harlow, S.D.; Mukherjee, B. Environmental risk score as a new tool to examine multi-pollutants in epidemiologic research: An example from the NHANES study using serum lipid levels. PLoS ONE 2014, 9, e98632. [Google Scholar] [CrossRef] [PubMed]
- Gass, K.; Klein, M.; Chang, H.H.; Flanders, W.D.; Strickland, M.J. Classification and regression trees for epidemiologic research: An air pollution example. Environ. Health 2014, 13, 17. [Google Scholar] [CrossRef] [PubMed]
- Braun, J.M.; Kalkbrenner, A.E.; Just, A.C.; Yolton, K.; Calafat, A.M.; Sjödin, A.; Hauser, R.; Webster, G.M.; Chen, A.; Lanphear, B.P. Gestational exposure to endocrine-disrupting chemicals and reciprocal social, repetitive, and stereotypic behaviors in 4- and 5-year-old children: The HOME study. Environ. Health Perspect. 2014, 122, 513–520. [Google Scholar] [CrossRef] [PubMed]
- Lenters, V.; Portengen, L.; Rignell-Hydbom, A.; Jönsson, B.A.; Lindh, C.H.; Piersma, A.H.; Toft, G.; Bonde, J.P.; Heederik, D.; Rylander, L.; et al. Prenatal Phthalate, Perfluoroalkyl Acid, and Organochlorine Exposures and Term Birth Weight in Three Birth Cohorts: Multi-Pollutant Models Based on Elastic Net Regression. Environ. Health Perspect. 2015. [Google Scholar] [CrossRef] [PubMed]
- Schoeters, G.; Den Hond, E.; Colles, A.; Loots, I.; Morrens, B.; Keune, H.; Bruckers, L.; Nawrot, T.; Sioen, I.; De Coster, S.; et al. Concept of the Flemish human biomonitoring programme. Int. J. Hyg. Environ. Health 2012, 215, 102–108. [Google Scholar] [CrossRef] [PubMed]
- Remy, S.; Govarts, E.; Bruckers, L.; Paulussen, M.; Wens, B.; Hond, E.D.; Nelen, V.; Baeyens, W.; van Larebeke, N.; Loots, I.; et al. Expression of the sFLT1 Gene in Cord Blood Cells Is Associated to Maternal Arsenic Exposure and Decreased Birth Weight. PLoS ONE 2014, 9, e92677. [Google Scholar] [CrossRef] [PubMed]
- Baeyens, W.; Vrijens, J.; Gao, Y.; Croes, K.; Schoeters, G.; Den Hond, E.; Sioen, I.; Bruckers, L.; Nawrot, T.; Nelen, V. Trace metals in blood and urine of newborn/mother pairs, adolescents and adults of the Flemish population (2007–2011). Int. J. Hyg. Environ. Health 2014, 217, 878–890. [Google Scholar] [CrossRef] [PubMed]
- Covaci, A.; Schepens, P. Simplified method for determination of organochlorine pollutants in human serum by solid-phase disk extraction and gas chromatography. Chemosphere 2001, 43, 439–447. [Google Scholar] [CrossRef]
- Covaci, A.; Voorspoels, S. Optimization of the determination of polybrominated diphenyl ethers in human serum using solid-phase extraction and gas chromatography-electron capture negative ionization mass spectrometry. J. Chromatogr. B Analyt. Technol. Biomed. Life Sci. 2005, 827, 216–223. [Google Scholar] [CrossRef] [PubMed]
- Koppen, G.; Den Hond, E.; Nelen, V.; Van De Mieroop, E.; Bruckers, L.; Bilau, M.; Keune, H.; Van Larebeke, N.; Covaci, A.; Van De Weghe, H.; et al. Organochlorine and heavy metals in newborns: Results from the Flemish Environment and Health Survey (FLEHS 2002–2006). Environ. Int. 2009, 35, 1015–1022. [Google Scholar] [CrossRef] [PubMed]
- Midasch, O.; Drexler, H.; Hart, N.; Beckmann, M.W.; Angerer, J. Transplacental exposure of neonates to perfluorooctanesulfonate and perfluorooctanoate: A pilot study. Int. Arch. Occup. Environ. Health 2007, 80, 643–648. [Google Scholar] [CrossRef] [PubMed]
- Gao, Y.; De Galan, S.; De Brauwere, A.; Baeyens, W.; Leermakers, M. Mercury speciation in hair by headspace injection-gas chromatography-atomic fluorescence spectrometry (methylmercury) and combustion-atomic absorption spectrometry (total Hg). Talanta 2010, 82, 1919–1923. [Google Scholar] [CrossRef] [PubMed]
- De Cock, M.; de Boer, M.R.; Lamoree, M.; Legler, J.; van de Bor, M. First year growth in relation to prenatal exposure to endocrine disruptors—A Dutch prospective cohort study. Int. J. Environ. Res. Public Health 2014, 11, 7001–7021. [Google Scholar] [CrossRef] [PubMed]
- Intergewestelijke Cel voor Het Leefmilieu (IRCEL). Available online: http://www.irceline.be/nl (accessed 9 May 2016).
- Janssen, S.; Dumont, G.; Fierens, F.; Mensink, C. Spatial interpolation of air pollution measurements using CORINE land cover data. Atmos. Environ. 2008, 42, 4884–4903. [Google Scholar] [CrossRef]
- Atmosys (Air Quality Modelling System). How Are the Annual Air Quality Maps Created? Available online: http://www.atmosys.eu/faces/doc/Annual Air Quality Maps—How are the annual maps created.pdf (accessed 9 May 2016).
- Casas, M.; Nieuwenhuijsen, M.; Martínez, D.; Ballester, F.; Basagaña, X.; Basterrechea, M.; Chatzi, L.; Chevrier, C.; Eggesbø, M.; Fernandez, M.F.; et al. Prenatal exposure to PCB-153, p,p′-DDE and birth outcomes in 9000 mother-child pairs: Exposure–response relationship and effect modifiers. Environ. Int. 2015, 74, 23–31. [Google Scholar] [CrossRef] [PubMed]
- Eggesbø, M.; Stigum, H.; Longnecker, M.P.; Polder, A.; Aldrin, M.; Basso, O.; Thomsen, C.; Skaare, J.U.; Becher, G.; Magnus, P. Levels of hexachlorobenzene (HCB) in breast milk in relation to birth weight in a Norwegian cohort. Environ. Res. 2009, 109, 559–566. [Google Scholar] [CrossRef] [PubMed]
- Hertz-Picciotto, I.; Charles, M.J.; James, R.A.; Keller, J.A.; Willman, E.; Teplin, S. In utero polychlorinated biphenyl exposures in relation to fetal and early childhood growth. Epidemiology 2005, 16, 648–656. [Google Scholar] [CrossRef] [PubMed]
- Konishi, K.; Sasaki, S.; Kato, S.; Ban, S.; Washino, N.; Kajiwara, J.; Todaka, T.; Hirakawa, H.; Hori, T.; Yasutake, D.; et al. Prenatal exposure to PCDDs/PCDFs and dioxin-like PCBs in relation to birth weight. Environ. Res. 2009, 109, 906–913. [Google Scholar] [CrossRef] [PubMed]
- Lamb, M.R.; Taylor, S.; Liu, X.; Wolff, M.S.; Borrell, L.; Matte, T.D.; Susser, E.S.; Factor-Litvak, P. Prenatal exposure to polychlorinated biphenyls and postnatal growth: A structural analysis. Environ. Health Perspect. 2006, 114, 779–785. [Google Scholar] [CrossRef] [PubMed]
- Sonneborn, D.; Park, H.-Y.; Petrik, J.; Kocan, A.; Palkovicova, L.; Trnovec, T.; Nguyen, D.; Hertz-Picciotto, I. Prenatal polychlorinated biphenyl exposures in eastern Slovakia modify effects of social factors on birthweight. Paediatr. Perinat. Epidemiol. 2008, 22, 202–213. [Google Scholar] [CrossRef] [PubMed]
- Vafeiadi, M.; Vrijheid, M.; Fthenou, E.; Chalkiadaki, G.; Rantakokko, P.; Kiviranta, H.; Kyrtopoulos, S.A.; Chatzi, L.; Kogevinas, M. Persistent organic pollutants exposure during pregnancy, maternal gestational weight gain, and birth outcomes in the mother-child cohort in Crete, Greece (RHEA study). Environ. Int. 2014, 64, 116–123. [Google Scholar] [CrossRef] [PubMed]
- White, H. A Heteroscedasticity-Consistent Covariance Matrix Estimator and a Direct Test for Heteroscedasticity. Econometrica 1980, 48, 817–838. [Google Scholar] [CrossRef]
- Neter, J.; Kutner, M.H.; Nachtsheim, C.J.; Wasserman, W. Applied Linear Statistical Models; McGraw-Hill Irwin: New York, NY, USA, 1999. [Google Scholar]
- Shaw, P.J.A. Multivariate Statistics for the Environmental Sciences; John Wiley & Sons: New York, NY, USA, 2003. [Google Scholar]
- Arif, A.A.; Shah, S.M. Association between personal exposure to volatile organic compounds and asthma among US adult population. Int. Arch. Occup. Environ. Health 2007, 80, 711–719. [Google Scholar] [CrossRef] [PubMed]
- Burstyn, I. Principal component analysis is a powerful instrument in occupational hygiene inquiries. Ann. Occup. Hyg. 2004, 48, 655–661. [Google Scholar] [CrossRef] [PubMed]
- Dominici, F.; Peng, R.D.; Barr, C.D.; Bell, M.L. Protecting human health from air pollution: Shifting from a single-pollutant to a multipollutant approach. Epidemiology 2010, 21, 187–194. [Google Scholar] [CrossRef] [PubMed]
- Lampa, E.; Lind, L.; Hermansson, A.B.; Salihovic, S.; van Bavel, B.; Lind, P.M. An investigation of the co-variation in circulating levels of a large number of environmental contaminants. J. Expo. Sci. Environ. Epidemiol. 2012, 22, 476–482. [Google Scholar] [CrossRef] [PubMed]
- Maresca, M.M.; Hoepner, L.A.; Hassoun, A.; Oberfield, S.E.; Mooney, S.J.; Calafat, A.M.; Ramirez, J.; Freyer, G.; Perera, F.P.; Whyatt, R.M.; et al. Prenatal Exposure to Phthalates and Childhood Body Size in an Urban Cohort. Environ. Health Perspect. 2015. [Google Scholar] [CrossRef] [PubMed]
- Odland, J.Ø.; Nieboer, E.; Romanova, N.; Thomassen, Y.; Hofoss, D.; Lund, E. Factor analysis of essential and toxic elements in human placentas from deliveries in arctic and subarctic areas of Russia and Norway. J. Environ. Monit. 2001, 3, 177–184. [Google Scholar] [CrossRef] [PubMed]
- Molin, M.; Ulven, S.M.; Meltzer, H.M.; Alexander, J. Arsenic in the human food chain, biotransformation and toxicology—Review focusing on seafood arsenic. J. Trace Elem. Med. Biol. 2015, 31, 249–259. [Google Scholar] [CrossRef] [PubMed]
- Gilbert-Diamond, D.; Cottingham, K.L.; Gruber, J.F.; Punshon, T.; Sayarath, V.; Gandolfi, A.J.; Baker, E.R.; Jackson, B.P.; Folt, C.L.; Karagas, M.R. Rice consumption contributes to arsenic exposure in US women. Proc. Natl. Acad. Sci. USA 2011, 108, 20656–20660. [Google Scholar] [CrossRef] [PubMed]
- Xu, L.; Yokoyama, K.; Tian, Y.; Piao, F.-Y.; Kitamura, F.; Kida, H.; Wang, P. Decrease in birth weight and gestational age by arsenic among the newborn in Shanghai, China. Nihon Koshu Eisei Zasshi 2011, 58, 89–95. [Google Scholar] [PubMed]
- Guan, H.; Piao, F.; Zhang, X.; Li, X.; Li, Q.; Xu, L.; Kitamura, F.; Yokoyama, K. Prenatal exposure to arsenic and its effects on fetal development in the general population of Dalian. Biol. Trace Elem. Res. 2012, 149, 10–15. [Google Scholar] [CrossRef] [PubMed]
- Xia, W.; Du, X.; Zhang, B.; Li, Y.; Bassig, B.A.; Zhou, A.; Wang, Y.; Xiong, C.; Li, Z.; Yao, Y.; et al. A Case-Control Study of Prenatal Thallium Exposure and Low Birth Weight in China. Environ. Health Perspect. 2016, 124, 164–169. [Google Scholar] [CrossRef] [PubMed]
- Bailey, B.A.; Byrom, A.R. Factors predicting birth weight in a low-risk sample: The role of modifiable pregnancy health behaviors. Mater. Child Health J. 2007, 11, 173–179. [Google Scholar] [CrossRef] [PubMed]
- Goldenberg, R.L.; Cliver, S.P.; Neggers, Y.; Copper, R.L.; DuBard, M.D.; Davis, R.O.; Hoffman, H.J. The relationship between maternal characteristics and fetal and neonatal anthropometric measurements in women delivering at term: A summary. Acta Obstet. Gynecol. Scand. Suppl. 1997, 165, 8–13. [Google Scholar] [PubMed]
- McCowan, L.; Horgan, R.P. Risk factors for small for gestational age infants. Best Pract. Res. Clin. Obstet. Gynaecol. 2009, 23, 779–793. [Google Scholar] [CrossRef] [PubMed]
- Menai, M.; Heude, B.; Slama, R.; Forhan, A.; Sahuquillo, J.; Charles, M.-A.; Yazbeck, C. Association between maternal blood cadmium during pregnancy and birth weight and the risk of fetal growth restriction: The EDEN mother-child cohort study. Reprod. Toxicol. 2012, 34, 622–627. [Google Scholar] [CrossRef] [PubMed]
- Bach, C.C.; Bech, B.H.; Brix, N.; Nohr, E.A.; Bonde, J.P.E.; Henriksen, T.B. Perfluoroalkyl and polyfluoroalkyl substances and human fetal growth: A systematic review. Crit. Rev. Toxicol. 2015, 45, 53–67. [Google Scholar] [CrossRef] [PubMed]
- Taylor, C.M.; Golding, J.; Emond, A.M. Adverse effects of maternal lead levels on birth outcomes in the ALSPAC study: A prospective birth cohort study. BJOG 2015, 122, 322–328. [Google Scholar] [CrossRef] [PubMed]
- Schneider, J.E.; Brozek, J.M.; Keen-Rhinehart, E. Our stolen figures: The interface of sexual differentiation, endocrine disruptors, maternal programming, and energy balance. Horm. Behav. 2014, 66, 104–119. [Google Scholar] [CrossRef] [PubMed]
- Li, Y.; Ley, S.H.; Tobias, D.K.; Chiuve, S.E.; VanderWeele, T.J.; Rich-Edwards, J.W.; Curhan, G.C.; Willett, W.C.; Manson, J.E.; Hu, F.B.; et al. Birth weight and later life adherence to unhealthy lifestyles in predicting type 2 diabetes: Prospective cohort study. BMJ 2015, 351, h3672. [Google Scholar] [CrossRef] [PubMed]


| Continuous Parameters | N | N Missing | Median (min-max) |
|---|---|---|---|
| Birth weight (g) | 248 | 0 | 3540 (2175–4950) |
| Gestational Age (weeks) | 243 | 5 | 40 (34–42) |
| Categorical Parameters | Class | N | Percentage |
| Child gender | Boy | 128 | 51.6% |
| Girl | 120 | 48.4% | |
| Missing | 0 | 0.0% | |
| Maternal age at delivery (years) | ≤25 | 27 | 10.9% |
| (25,30) | 92 | 37.1% | |
| (30,35) | 94 | 37.9% | |
| >35 | 35 | 14.1% | |
| Missing | 0 | 0.0% | |
| Maternal pre-pregnancy BMI (kg/m2) | <18.5 | 15 | 6.0% |
| (18.5,25) | 172 | 69.4% | |
| (25,30) | 37 | 14.9% | |
| ≥30 | 22 | 8.9% | |
| Missing | 2 | 0.8% | |
| Maternal height (cm) | <164 | 62 | 25.0% |
| (164,168) | 58 | 23.4% | |
| (168,171) | 56 | 22.6% | |
| ≥171 | 70 | 28.2% | |
| Missing | 2 | 0.8% | |
| Parity | 0 | 99 | 39.9% |
| 1 | 82 | 33.1% | |
| ≥2 | 66 | 26.6% | |
| Missing | 1 | 0.4% | |
| Caesarean section | Yes | 12 | 4.8% |
| No | 235 | 94.8% | |
| Missing | 1 | 0.4% | |
| Maternal education | Lower secondary education | 22 | 8.9% |
| Higher secondary education | 74 | 29.8% | |
| Higher education | 149 | 60.1% | |
| Missing | 3 | 1.2% | |
| Use of folic acid during pregnancy | Yes | 157 | 63.3% |
| No | 91 | 36.7% | |
| Missing | 0 | 0.0% | |
| Infections/complications during pregnancy | No | 151 | 60.9% |
| Yes | 93 | 37.5% | |
| Missing | 4 | 1.6% | |
| Maternal smoking during pregnancy | Yes | 29 | 11.7% |
| No | 213 | 85.9% | |
| Missing | 6 | 2.4% | |
| Maternal smoking prior to pregnancy | Never smoked | 135 | 54.4% |
| Ex-smoker | 37 | 14.9% | |
| Less than daily | 16 | 6.5% | |
| Daily | 56 | 22.6% | |
| Missing | 4 | 1.6% | |
| Maternal alcohol use before pregnancy | Never | 36 | 14.5% |
| Less than monthly | 60 | 24.2% | |
| Less than weekly | 56 | 22.6% | |
| Weekly | 95 | 38.3% | |
| Missing | 1 | 0.4% | |
| Maternal alcohol use during pregnancy | Yes | 104 | 41.9% |
| No | 142 | 57.3% | |
| Missing | 2 | 0.8% | |
| Stress during pregnancy | Never-sometimes a little | 180 | 72.6% |
| Usually a little-always | 65 | 26.2% | |
| Missing | 3 | 1.2% | |
| Pressure during pregnancy | Never-sometimes a little | 134 | 54.0% |
| Usually a little-always | 112 | 45.2% | |
| Missing | 2 | 0.8% |
| Exposure marker | Matrix | N | LOD/LOQ | N < LOD/LOQ (%) | Geomean (95% CI) | P25–P75 |
|---|---|---|---|---|---|---|
| Arsenic (µg/L) | Cord blood | 242 | LOD = 0.028 µg/L | 1 (0.4%) | 0.561 (0.485–0.648) | 0.256–1.223 |
| Cadmium (µg/L) | Maternal blood | 237 | LOD = 0.06 µg/L | 1 (0.4%) | 0.316 (0.291–0.344) | 0.210–0.434 |
| Copper (µg/L) | Cord blood | 242 | LOD = 2.04µg/L | 0 (0%) | 598 (584–613) | 534–679 |
| Dichlorodiphenyldichloroethylene (ng/g lipids) | Cord plasma | 243 | LOQ = 20 ng/L | 0 (0%) | 77.9 (71.3–85.2) | 47.1–126.0 |
| Dioxin-like compounds (pg Calux TEQ/g lipids) | Cord plasma | 227 | LOD = 9.7 pg Calux TEQ/g lipids | 14 (6%) | 17.4 (16.3–18.6) | 13.0–24.0 |
| Lead (µg/L) | Cord blood | 242 | LOD = 1.9 µg/L | 0 (0%) | 8.64 (8.08–9.23) | 6.52–11.38 |
| Manganese (µg/L) | Cord blood | 242 | LOD = 0.86 µg/L | 0 (0%) | 30.9 (29.5–32.4) | 24.6–38.9 |
| Methylmercury (µg/g) | Maternal hair | 244 | LOD = 0.00004 µg/g | 0 (0%) | 0.255 (0.230–0.283) | 0.161–0.441 |
| Mono-(2-ethyl-5-carboxypentyl) phthalate (µg/L) | Cord plasma | 219 | LOQ = 0.07–0.18 µg/L | 0 (0%) | 0.699 (0.628–0.779) | 0.380–1.300 |
| Particulate matter (≤2.5 µM) (µg/m³) | RIO model | 242 | / | / | 19.6 (19.3–19.9] | 18.4–21.4 |
| Perfluorooctane sulfonate (µg/L) | Cord plasma | 213 | LOD = 0.3 µg/L | 0 (0%) | 2.63 (2.45–2.83) | 1.70–3.80 |
| Perfluorooctanoic acid (µg/L) | Cord plasma | 213 | LOD = 0.3 µg/L | 0 (0%) | 1.52 (1.44–1.61) | 1.10–2.10 |
| Polychlorinated biphenyl-138 (ng/g lipids) | Cord plasma | 243 | LOQ = 20 ng/L | 41 (17%) | 16.4 (15.1–17.9) | 12.0–25.9 |
| Polychlorinated biphenyl-153 (ng/g lipids) | Cord plasma | 243 | LOQ = 20 ng/L | 8 (3%) | 26.4 (24.5–28.5) | 18.4–39.3 |
| Polychlorinated biphenyl-180 (ng/g lipids) | Cord plasma | 243 | LOQ = 20 ng/L | 50 (21%) | 14.6 (13.4–15.9) | 9.40–23.11 |
| Thallium (µg/L) | Cord blood | 242 | LOD = 0.001 µg/L | 0 (0%) | 0.017 (0.016–0.018) | 0.014–0.021 |
© 2016 by the authors; licensee MDPI, Basel, Switzerland. This article is an open access article distributed under the terms and conditions of the Creative Commons Attribution (CC-BY) license (http://creativecommons.org/licenses/by/4.0/).
Share and Cite
Govarts, E.; Remy, S.; Bruckers, L.; Den Hond, E.; Sioen, I.; Nelen, V.; Baeyens, W.; Nawrot, T.S.; Loots, I.; Van Larebeke, N.; et al. Combined Effects of Prenatal Exposures to Environmental Chemicals on Birth Weight. Int. J. Environ. Res. Public Health 2016, 13, 495. https://doi.org/10.3390/ijerph13050495
Govarts E, Remy S, Bruckers L, Den Hond E, Sioen I, Nelen V, Baeyens W, Nawrot TS, Loots I, Van Larebeke N, et al. Combined Effects of Prenatal Exposures to Environmental Chemicals on Birth Weight. International Journal of Environmental Research and Public Health. 2016; 13(5):495. https://doi.org/10.3390/ijerph13050495
Chicago/Turabian StyleGovarts, Eva, Sylvie Remy, Liesbeth Bruckers, Elly Den Hond, Isabelle Sioen, Vera Nelen, Willy Baeyens, Tim S Nawrot, Ilse Loots, Nick Van Larebeke, and et al. 2016. "Combined Effects of Prenatal Exposures to Environmental Chemicals on Birth Weight" International Journal of Environmental Research and Public Health 13, no. 5: 495. https://doi.org/10.3390/ijerph13050495
APA StyleGovarts, E., Remy, S., Bruckers, L., Den Hond, E., Sioen, I., Nelen, V., Baeyens, W., Nawrot, T. S., Loots, I., Van Larebeke, N., & Schoeters, G. (2016). Combined Effects of Prenatal Exposures to Environmental Chemicals on Birth Weight. International Journal of Environmental Research and Public Health, 13(5), 495. https://doi.org/10.3390/ijerph13050495