
Urinary Mineral Concentrations in European Pre-Adolescent Children and Their Association with Calcaneal Bone Quantitative Ultrasound Measurements †

 , , ,
, , ,  ,
,  ,
,  , , and
Abstract
:1. Introduction
- (1)
- urinary mineral concentrations differ across countries;
- (2)
- high concentrations of uNa are associated with a higher concentrations of uCa;
- (3)
- high concentrations of uK is associated with a lower concentration of uCa; and
- (4)
- high concentrations of uNa are associated with lower calcaneal QUS parameters.
2. Methods
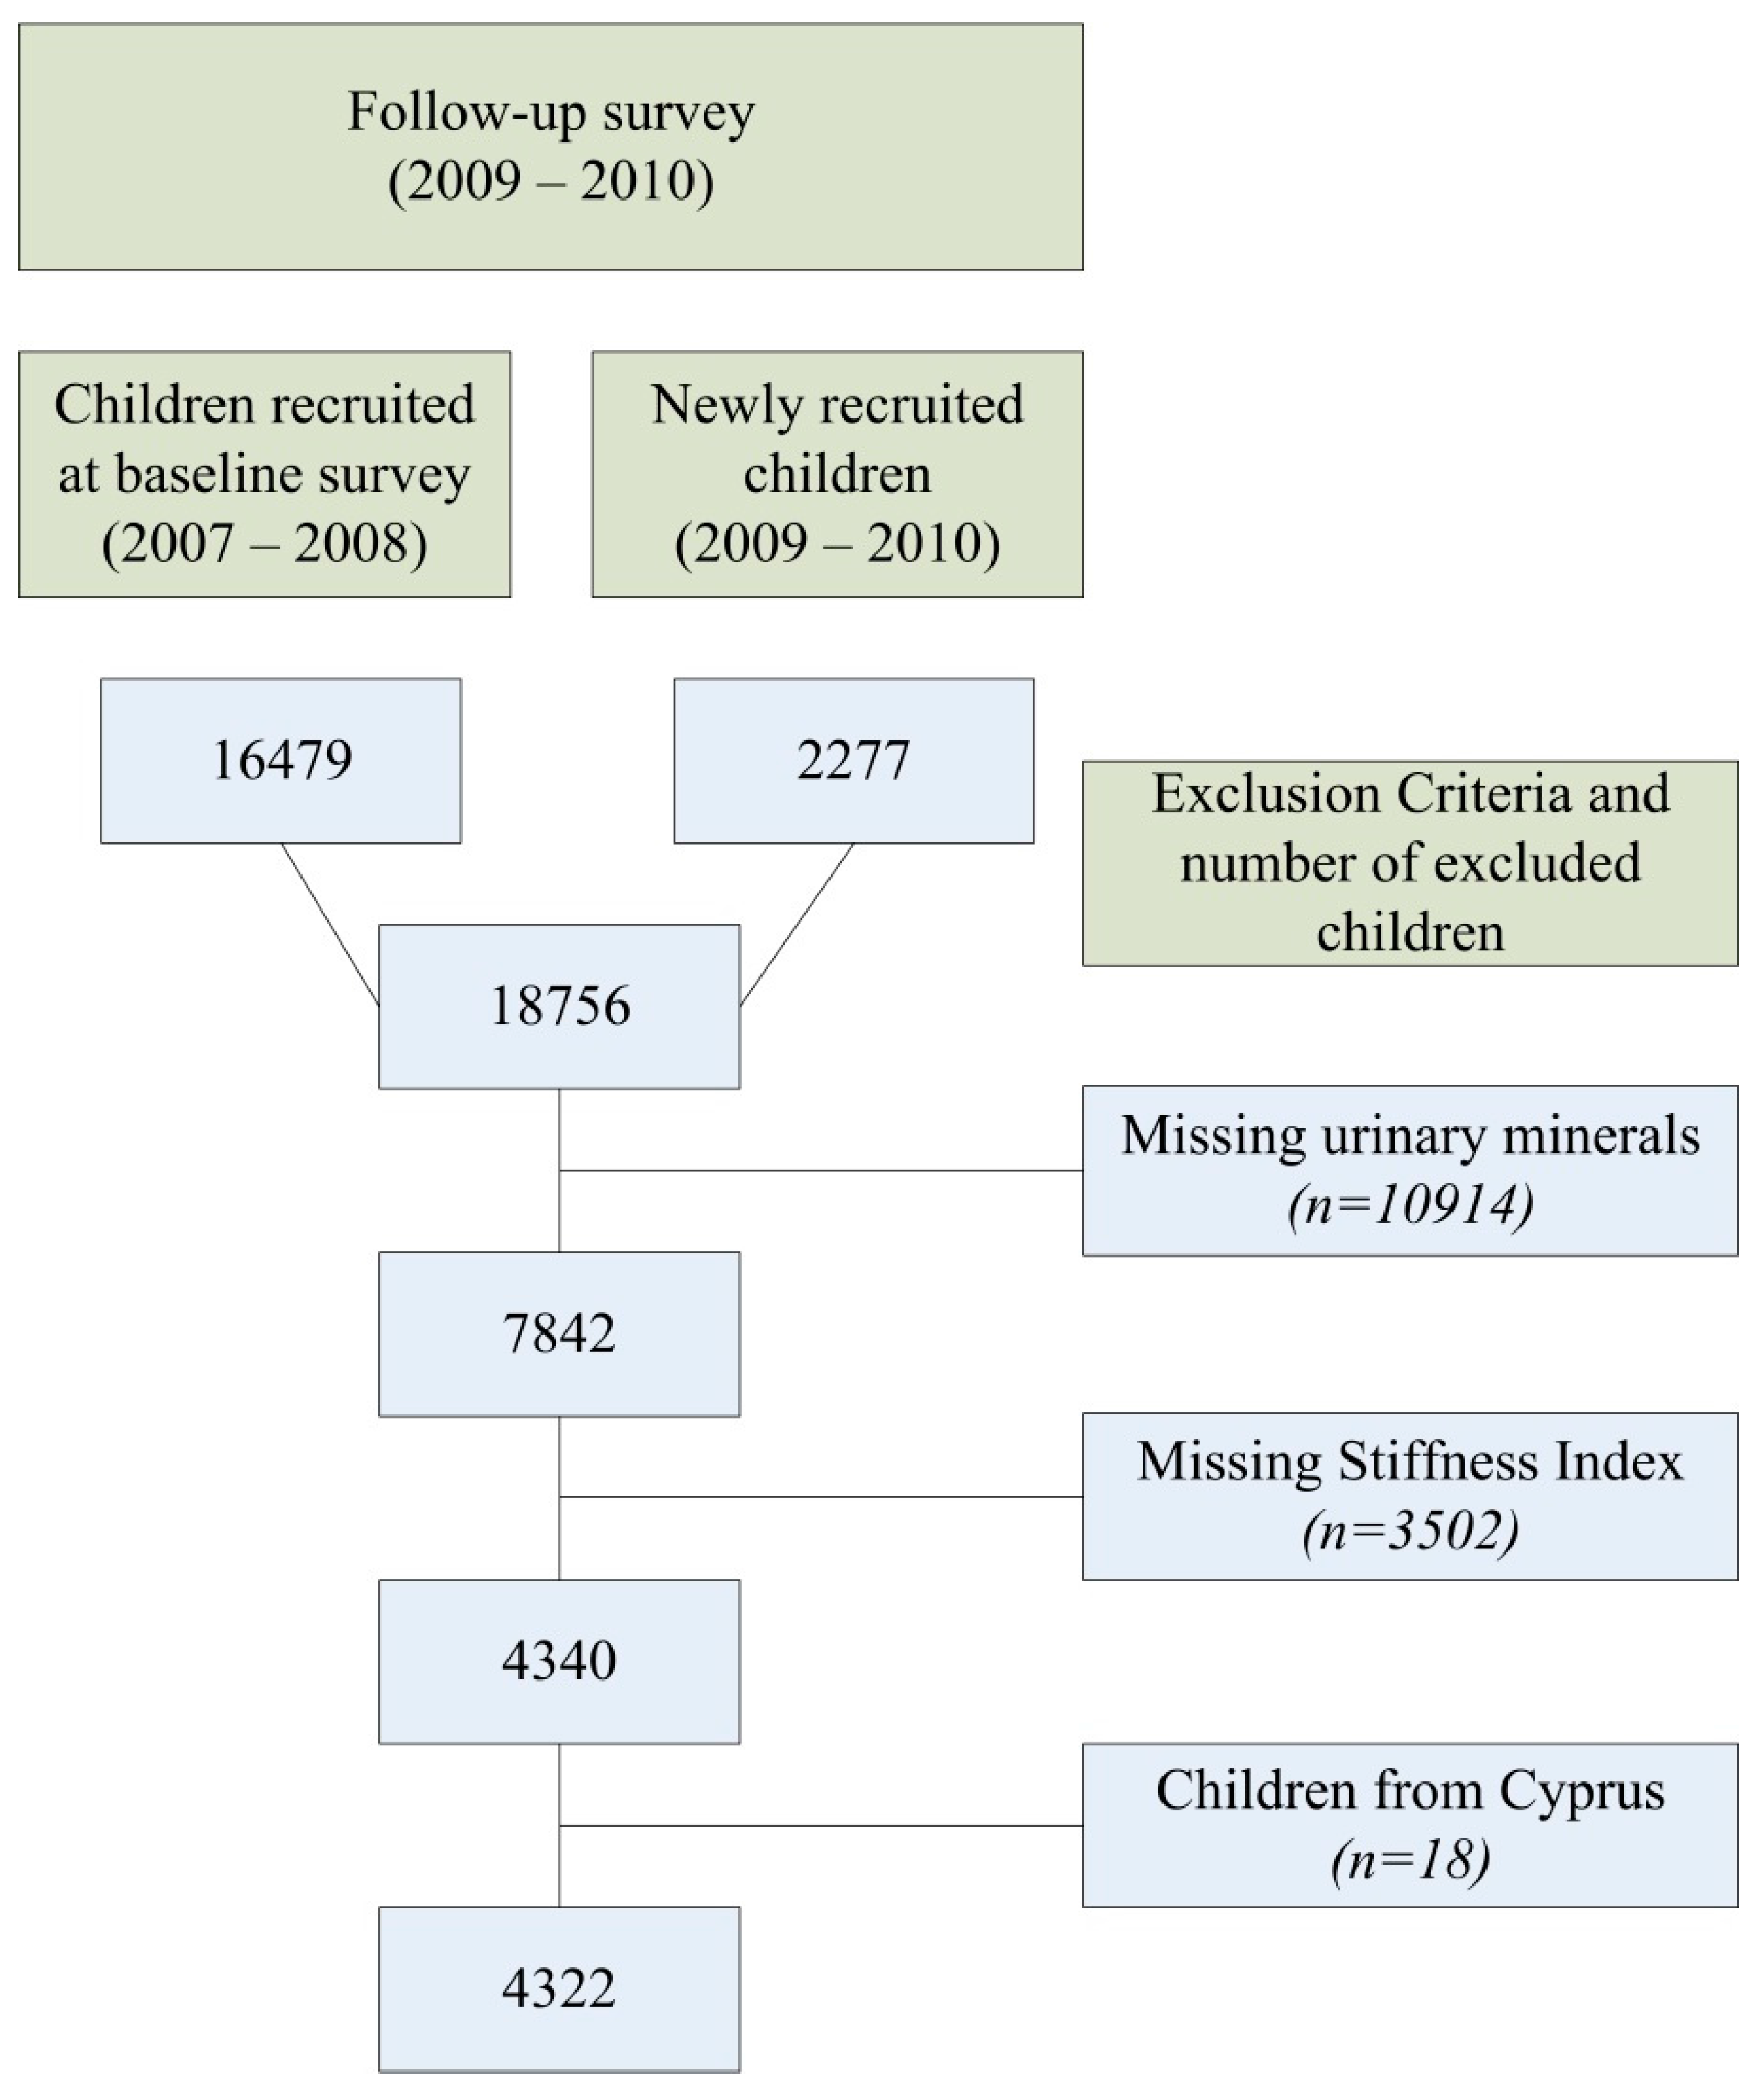
2.1. Study Sample
2.2. Assessment of Calcaneal Bone Parameters
2.3. Assessment of Urinary Mineral Concentrations
2.4. Assessment of Body Composition
2.5. Questionnaire
2.6. Statistical Analysis
3. Results
3.1. Subject Characteristics
3.2. Differences in Urinary Mineral Concentrations and Calcaneal QUS Parameters Between Countries
3.3. Associations between the Concentrations of the Various Urinary Mineral Concentrations
3.4. Patterns in Concentrations of Urinary Mineral Concentrations
3.5. Associations between Concentrations of Urinary Mineral Concentrations and Calcaneal QUS Parameters
4. Discussion
4.1. Urinary Mineral Concentrations in Different Countries
4.2. Urine and QUS Results
4.3. Strengths and Limitations
5. Conclusions
Supplementary Materials
Acknowledgments
Author Contributions
Conflicts of Interest
References
- Rizzoli, R.; Bianchi, M.L.; Garabedian, M.; McKay, H.A.; Moreno, L.A. Maximizing bone mineral mass gain during growth for the prevention of fractures in the adolescents and the elderly. Bone 2010, 46, 294–305. [Google Scholar] [CrossRef] [PubMed]
- Sioen, I.; Mouratidou, T.; Herrmann, D.; De, H.S.; Kaufman, J.M.; Molnar, D.; Moreno, L.A.; Marild, S.; Barba, G.; Siani, A.; et al. Relationship between markers of body fat and calcaneal bone stiffness differs between preschool and primary school children: Results from the idefics baseline survey. Calcif. Tissue Int. 2012, 91, 276–285. [Google Scholar] [CrossRef] [PubMed]
- Gracia-Marco, L.; Ortega, F.B.; Casajus, J.A.; Sioen, I.; Widhalm, K.; Beghin, L.; Vicente-Rodriguez, G.; Moreno, L.A. Socioeconomic status and bone mass in Spanish adolescents. The HELENA study. J. Adolesc. Health 2012, 50, 484–490. [Google Scholar] [CrossRef] [PubMed]
- Gracia-Marco, L.; Ortega, F.B.; Jimenez-Pavon, D.; Rodriguez, G.; Castillo, M.J.; Vicente-Rodriguez, G.; Moreno, L.A. Adiposity and bone health in Spanish adolescents. The HELENA study. Osteoporos. Int. 2012, 23, 937–947. [Google Scholar] [CrossRef] [PubMed]
- Gracia-Marco, L.; Vicente-Rodriguez, G.; Casajus, J.A.; Molnar, D.; Castillo, M.J.; Moreno, L.A. Effect of fitness and physical activity on bone mass in adolescents: The HELENA study. Eur. J. Appl. Physiol 2011, 111, 2671–2680. [Google Scholar] [CrossRef] [PubMed]
- Suda, T.; Ueno, Y.; Fujii, K.; Shinki, T. Vitamin D and bone. J. Cell Biochem. 2003, 88, 259–266. [Google Scholar] [CrossRef] [PubMed]
- Saggese, G.; Baroncelli, G.I.; Bertelloni, S. Puberty and bone development. Best. Pract. Res. Clin. Endocrinol. Metab 2002, 16, 53–64. [Google Scholar] [CrossRef] [PubMed]
- Seeman, E. Effects of tobacco and alcohol use on bone. In Osteoporosis, 2nd ed.; Marcus, R., Feldman, D., Kelsey, J., Eds.; Academic Press: San Diego, CA, USA, 2001; pp. 771–794. [Google Scholar]
- Stagi, S.; Cavalli, L.; Iurato, C.; Seminara, S.; Brandi, M.L.; de Martino, M. Bone metabolism in children and adolescents: Main characteristics of the determinants of peak bone mass. Clin. Cases Miner. Bone Metab. 2013, 10, 172–179. [Google Scholar] [PubMed]
- Guyton, C.G.; Hall, J.E. Parathyroid hormone, calcitonin, calcium and phosphate metabolism, vitamin D, bone, and teeth. In Textbook of Medical Physiology; Elsevier Inc.: Philadelphia, PA, USA, 2006; pp. 978–995. [Google Scholar]
- EFSA. Tolerable Upper Intake Levels for Vitamins and Minerals. Available online: http://www.efsa.europa.eu/sites/default/files/efsa_rep/blobserver_assets/ndatolerableuil.pdf (accessed on 1 February 2016).
- Penido, M.G.; Alon, U.S. Phosphate homeostasis and its role in bone health. Pediatr. Nephrol. 2012, 27, 2039–2048. [Google Scholar] [CrossRef] [PubMed]
- Verbalis, J.G.; Barsony, J.; Sugimura, Y.; Tian, Y.; Adams, D.J.; Carter, E.A.; Resnick, H.E. Hyponatremia-induced osteoporosis. J. Bone Miner. Res. 2010, 25, 554–563. [Google Scholar] [CrossRef] [PubMed]
- Cashman, K.D. Diet, nutrition, and bone health. J. Nutr. 2007, 137, 2507S–2512S. [Google Scholar] [PubMed]
- Nieves, J.W. Osteoporosis: The role of micronutrients. Am. J. Clin. Nutr. 2005, 81, 1232S–1239S. [Google Scholar] [PubMed]
- Livingstone, M.B.; Robson, P.J.; Wallace, J.M. Issues in dietary intake assessment of children and adolescents. Br. J. Nutr. 2004, 92 (Suppl. 2), S213–S222. [Google Scholar] [CrossRef] [PubMed]
- Bingham, S.A. Biomarkers in nutritional epidemiology. Public Health Nutr. 2002, 5, 821–827. [Google Scholar] [CrossRef] [PubMed]
- Jones, G.; Riley, M.D.; Whiting, S. Association between urinary potassium, urinary sodium, current diet, and bone density in prepubertal children. Am. J. Clin. Nutr. 2001, 73, 839–844. [Google Scholar] [PubMed]
- Palacios, C.; Wigertz, K.; Braun, M.; Martin, B.R.; McCabe, G.P.; McCabe, L.; Pratt, J.H.; Peacock, M.; Weaver, C.M. Magnesium retention from metabolic-balance studies in female adolescents: Impact of race, dietary salt, and calcium. Am. J. Clin. Nutr. 2013, 97, 1014–1019. [Google Scholar] [CrossRef] [PubMed]
- Matkovic, V.; Ilich, J.Z.; Andon, M.B.; Hsieh, L.C.; Tzagournis, M.A.; Lagger, B.J.; Goel, P.K. Urinary calcium, sodium, and bone mass of young females. Am. J. Clin. Nutr. 1995, 62, 417–425. [Google Scholar] [PubMed]
- Shi, L.; Libuda, L.; Schonau, E.; Frassetto, L.; Remer, T. Long term higher urinary calcium excretion within the normal physiologic range predicts impaired bone status of the proximal radius in healthy children with higher potential renal acid load. Bone 2012, 50, 1026–1031. [Google Scholar] [CrossRef] [PubMed]
- Remer, T.; Manz, F.; Alexy, U.; Schoenau, E.; Wudy, S.A.; Shi, L. Long-term high urinary potential renal acid load and low nitrogen excretion predict reduced diaphyseal bone mass and bone size in children. J. Clin. Endocrinol. Metab. 2011, 96, 2861–2868. [Google Scholar] [CrossRef] [PubMed]
- Tylavsky, F.A.; Holliday, K.; Danish, R.; Womack, C.; Norwood, J.; Carbone, L. Fruit and vegetable intakes are an independent predictor of bone size in early pubertal children. Am. J. Clin. Nutr. 2004, 79, 311–317. [Google Scholar] [PubMed]
- Ahrens, W.; Bammann, K.; Siani, A.; Buchecker, K.; De Henauw, S.; Iacoviello, L.; Hebestreit, A.; Krogh, V.; Lissner, L.; Marild, S.; et al. The IDEFICS cohort: Design, characteristics and participation in the baseline survey. Int. J. Obes. (Lond.) 2011, 35 (Suppl. 1), S3–S15. [Google Scholar] [CrossRef] [PubMed]
- Peplies, J.; Gunther, K.; Bammann, K.; Fraterman, A.; Russo, P.; Veidebaum, T.; Tornaritis, M.; Vanaelst, B.; Marild, S.; Molnar, D.; et al. Influence of sample collection and preanalytical sample processing on the analyses of biological markers in the European multicentre study IDEFICS. Int. J. Obes. (Lond.) 2011, 35 (Suppl. 1), S104–S112. [Google Scholar] [CrossRef] [PubMed]
- IDEFICS Study. Available online: http://www.ideficsstudy.eu/Idefics/ (accessed on 1 February 2016).
- De Henauw, S.; Huybrechts, I.; De Bourdeaudhuij, I.; Bammann, K.; Barba, G.; Lissner, L.; Mårild, S.; Molnár, D.; Moreno, L.; Pigeot, I. Effects of a community-oriented obesity prevention programme on indicators of body fatness in preschool and primary school children. Main results from the IDEFICS study. Obes. Rev. 2015, 16, 16–29. [Google Scholar] [CrossRef] [PubMed]
- Pigeot, I.; Baranowski, T.; De Henauw, S. The IDEFICS intervention trial to prevent childhood obesity: Design and study methods. Obes. Rev. 2015, 16, 4–15. [Google Scholar] [CrossRef] [PubMed]
- Schoenau, E.; Saggese, G.; Peter, F.; Baroncelli, G.I.; Shaw, N.J.; Crabtree, N.J.; Zadik, Z.; Neu, C.M.; Noordam, C.; Radetti, G.; et al. From bone biology to bone analysis. Horm. Res. 2004, 61, 257–269. [Google Scholar] [CrossRef] [PubMed]
- Baroncelli, G.I. Quantitative ultrasound methods to assess bone mineral status in children: Technical characteristics, performance, and clinical application. Pediatr. Res. 2008, 63, 220–228. [Google Scholar] [CrossRef] [PubMed]
- Jaworski, M.; Lebiedowski, M.; Lorenc, R.S.; Trempe, J. Ultrasound bone measurement in pediatric subjects. Calcif. Tissue Int. 1995, 56, 368–371. [Google Scholar] [CrossRef] [PubMed]
- Economos, C.D.; Sacheck, J.M.; Wacker, W.; Shea, K.; Naumova, E.N. Precision of Lunar Achilles plus bone quality measurements: Time dependency and multiple machine use in field studies. Br. J. Radiol. 2007, 80, 919–925. [Google Scholar] [CrossRef] [PubMed]
- Herrmann, D.; Intemann, T.; Lauria, F.; Marild, S.; Molnar, D.; Moreno, L.A.; Sioen, I.; Tornaritis, M.; Veidebaum, T.; Pigeot, I.; et al. Reference values of bone stiffness index and C-terminal telopeptide in healthy European children. Int. J. Obes. (Lond.) 2014, 38 (Suppl. 2), S76–S85. [Google Scholar] [CrossRef] [PubMed]
- Stomfai, S.; Ahrens, W.; Bammann, K.; Kovacs, E.; Marild, S.; Michels, N.; Moreno, L.A.; Pohlabeln, H.; Siani, A.; Tornaritis, M.; et al. Intra- and inter-observer reliability in anthropometric measurements in children. Int. J. Obes. (Lond.) 2011, 35 (Suppl. 1), S45–S51. [Google Scholar] [CrossRef] [PubMed]
- Tyrrell, V.J.; Richards, G.; Hofman, P.; Gillies, G.F.; Robinson, E.; Cutfield, W.S. Foot-to-foot bioelectrical impedance analysis: A valuable tool for the measurement of body composition in children. Int. J. Obes. Relat. Metab. Disord. 2001, 25, 273–278. [Google Scholar] [CrossRef] [PubMed]
- Obesity: Preventing and Managing the Global Epidemic. Available online: http://www.who.int/nutrition/publications/obesity/WHO_TRS_894/en/ (accessed on 1 February 2016).
- Cole, T.J.; Freeman, J.V.; Preece, M.A. British 1990 growth reference centiles for weight, height, body mass index and head circumference fitted by maximum penalized likelihood. Stat. Med. 1998, 17, 407–429. [Google Scholar] [CrossRef]
- Cohen, J. Eta-squared and partial eta-squared in fixed factor ANOVA designs. Edu. Psychol. Meas. 1973, 33, 107–112. [Google Scholar] [CrossRef]
- Cohen, J. The analysis of variance. In Statistical Power Analysis for the Behavioral Sciences, 2nd ed.; Lawrence Erlbaum Associates: Hillsdale, MI, USA, 1988; pp. 273–406. [Google Scholar]
- Janssens, W.; De Pelsmacker, P.; Wijnen, K.; Van Kenhove, P. Marketing Research with SPSS; Pearson Education: Harlow, UK, 2008. [Google Scholar]
- Barr, D.B.; Wilder, L.C.; Caudill, S.P.; Gonzalez, A.J.; Needham, L.L.; Pirkle, J.L. Urinary creatinine concentrations in the U.S. Population: Implications for urinary biologic monitoring measurements. Environ. Health Perspect. 2005, 113, 192–200. [Google Scholar] [CrossRef] [PubMed]
- Remer, T.; Neubert, A.; Maser-Gluth, C. Anthropometry-based reference values for 24-h urinary creatinine excretion during growth and their use in endocrine and nutritional research. Am. J. Clin. Nutr. 2002, 75, 561–569. [Google Scholar] [PubMed]
- Fernandez-Alvira, J.M.; Bammann, K.; Pala, V.; Krogh, V.; Barba, G.; Eiben, G.; Hebestreit, A.; Veidebaum, T.; Reisch, L.; Tornaritis, M.; et al. Country-specific dietary patterns and associations with socioeconomic status in European children: The IDEFICS study. Eur. J. Clin. Nutr. 2014, 68, 811–821. [Google Scholar] [CrossRef] [PubMed]
- Huybrechts, I.; Bornhorst, C.; Pala, V.; Moreno, L.A.; Barba, G.; Lissner, L.; Fraterman, A.; Veidebaum, T.; Hebestreit, A.; Sieri, S.; et al. Evaluation of the children’s eating habits questionnaire used in the IDEFICS study by relating urinary calcium and potassium to milk consumption frequencies among European children. Int. J. Obes. (Lond.) 2011, 35 (Suppl. 1), S69–S78. [Google Scholar] [CrossRef] [PubMed]
- Tamaki, J.; Yoshita, K.; Kikuchi, Y.; Takebayashi, T.; Chiba, N.; Okamura, T.; Tanaka, T.; Kasagi, F.; Minai, J.; Ueshima, H. Applicability of the stages of change model for analyzing fruit and vegetable intake in relation to urinary potassium excretion: Baseline results from the high-risk and population strategy for occupational health promotion (HIPOP-OHP) study. Hypertens. Res. 2004, 27, 843–850. [Google Scholar] [CrossRef] [PubMed]
- Krogholm, K.S.; Haraldsdottir, J.; Knuthsen, P.; Rasmussen, S.E. Urinary total flavonoid excretion but not 4-pyridoxic acid or potassium can be used as a biomarker for the intake of fruits and vegetables. J. Nutr. 2004, 134, 445–451. [Google Scholar] [PubMed]
- De Keyzer, W. Methodological Aspects of Dietary Intake Assessment in Food Consumption Surveys: From a National to an International Level; Ghent University: Ghent, Belgium, 2014. [Google Scholar]
- Musso, C.G. Magnesium metabolism in health and disease. Int. Urol. Nephrol. 2009, 41, 357–362. [Google Scholar] [CrossRef] [PubMed]
- Palacios, C. The role of nutrients in bone health, from A to Z. Crit. Rev. Food Sci. Nutr. 2006, 46, 621–628. [Google Scholar] [CrossRef] [PubMed]
- Remer, T.; Krupp, D.; Shi, L. When is low potential renal acid load (UPRAL) beneficial for bone? In Nutritional Influences on Bone Health: 8th International Symposium; Burckhardt, P., Dawson-Hughes, B., Weaver, C.M., Eds.; Springer: London, UK, 2013; pp. 101–108. [Google Scholar]
- Fulgoni, V., III; Nicholls, J.; Reed, A.; Buckley, R.; Kafer, K.; Huth, P.; DiRienzo, D.; Miller, G.D. Dairy consumption and related nutrient intake in African-American adults and children in the United States: Continuing survey of food intakes by individuals 1994–1996, 1998, and the national health and nutrition examination survey 1999–2000. J. Am. Diet. Assoc. 2007, 107, 256–264. [Google Scholar] [CrossRef] [PubMed]
- Lorson, B.A.; Melgar-Quinonez, H.R.; Taylor, C.A. Correlates of fruit and vegetable intakes in US children. J. Am. Diet. Assoc. 2009, 109, 474–478. [Google Scholar] [CrossRef] [PubMed]
- Osorio, A.V.; Alon, U.S. The relationship between urinary calcium, sodium, and potassium excretion and the role of potassium in treating idiopathic hypercalciuria. Pediatrics 1997, 100, 675–681. [Google Scholar] [CrossRef] [PubMed]
- Jones, G.; Beard, T.; Parameswaran, V.; Greenaway, T.; von, W.R. A population-based study of the relationship between salt intake, bone resorption and bone mass. Eur. J. Clin. Nutr. 1997, 51, 561–565. [Google Scholar] [CrossRef] [PubMed]
- Natri, A.M.; Karkkainen, M.U.; Ruusunen, M.; Puolanne, E.; Lamberg-Allardt, C. A 7-week reduction in salt intake does not contribute to markers of bone metabolism in young healthy subjects. Eur. J. Clin. Nutr. 2005, 59, 311–317. [Google Scholar] [CrossRef] [PubMed]
- Safarinejad, M.R. Urinary mineral excretion in healthy Iranian children. Pediatr. Nephrol. 2003, 18, 140–144. [Google Scholar] [PubMed]
- Jones, G.; Dwyer, T.; Hynes, K.L.; Parameswaran, V.; Udayan, R.; Greenaway, T.M. A prospective study of urinary electrolytes and bone turnover in adolescent males. Clin. Nutr. 2007, 26, 619–623. [Google Scholar] [CrossRef] [PubMed]
- Kemi, V.E.; Karkkainen, M.U.; Lamberg-Allardt, C.J. High phosphorus intakes acutely and negatively affect Ca and bone metabolism in a dose-dependent manner in healthy young females. Br. J. Nutr. 2006, 96, 545–552. [Google Scholar] [PubMed]
- Ahrens, W.; Bammann, K.; De, H.S.; Halford, J.; Palou, A.; Pigeot, I.; Siani, A.; Sjostrom, M. Understanding and preventing childhood obesity and related disorders—IDEFICS: A European multilevel epidemiological approach. Nutr. Metab. Cardiovasc. Dis. 2006, 16, 302–308. [Google Scholar] [CrossRef] [PubMed]
- Bammann, K.; Peplies, J.; Sjostrom, M.; Lissner, L.; Ahrens, W.; De, H.S.; Iacoviello, L.; Krogh, V.; Marild, S.; Pigeot, I.; et al. Assessment of diet, physical activity and biological, social and environmental factors in a multi-centre European project on diet-and lifestyle-related disorderds in children (IDEFICS). J. Public Health 2006, 279–289. [Google Scholar] [CrossRef]
- Tanaka, T.; Okamura, T.; Miura, K.; Kadowaki, T.; Ueshima, H.; Nakagawa, H.; Hashimoto, T. A simple method to estimate populational 24-h urinary sodium and potassium excretion using a casual urine specimen. J. Hum. Hypertens. 2002, 16, 97–103. [Google Scholar] [CrossRef] [PubMed]
- Cogswell, M.E.; Elliott, P.; Wang, C.Y.; Rhodes, D.G.; Pfeiffer, C.M.; Loria, C.M. Assessing U.S. Sodium intake through dietary data and urine biomarkers. Adv. Nutr. 2013, 4, 560–562. [Google Scholar] [CrossRef] [PubMed]
- Garde, A.H.; Hansen, A.M.; Kristiansen, J.; Knudsen, L.E. Comparison of uncertainties related to standardization of urine samples with volume and creatinine concentration. Ann. Occup. Hyg. 2004, 48, 171–179. [Google Scholar] [CrossRef] [PubMed]
- Mage, D.T.; Allen, R.H.; Kodali, A. Creatinine corrections for estimating children’s and adult’s pesticide intake doses in equilibrium with urinary pesticide and creatinine concentrations. J. Expo. Sci. Environ. Epidemiol. 2008, 18, 360–368. [Google Scholar] [CrossRef] [PubMed]
- Specker, B.L.; Schoenau, E. Quantitative bone analysis in children: Current methods and recommendations. J. Pediatr. 2005, 146, 726–731. [Google Scholar] [CrossRef] [PubMed]
- Wren, T.A.L.; Gilsanz, V. Pediatric orthopedic imaging. In Bone Density; Stein-Wexler, R., Ozonff, M.B., Wootton-Gorges, S.L., Eds.; Springer: Berlin, Germany, 2015; p. 13. [Google Scholar]

| Characteristic | Boys | Girls | Total | p-Value a,b Gender Difference | |||
|---|---|---|---|---|---|---|---|
| n = 2187 | n = 2135 | n = 4322 | |||||
| Mean | SD | Mean | SD | Mean | SD | ||
| Calcaneal SI | 82.95 | 14.20 | 82.77 | 14.26 | 82.86 | 14.23 | 0.675 |
| Calcaneal SOS c (m/s) | 1590.10 | 43.83 | 1589.90 | 44.09 | 1590.00 | 43.94 | 0.914 |
| Calcaneal BUA d (dB/MHz) | 87.97 | 16.96 | 86.71 | 16.10 | 87.36 | 16.55 | 0.070 |
| Age (years) | 8.11 | 1.83 | 8.19 | 1.83 | 8.15 | 1.83 | 0.155 |
| Height (cm) | 130.86 | 11.91 | 130.62 | 12.24 | 130.74 | 12.07 | 0.526 |
| Weight (kg) | 30.64 | 9.98 | 30.44 | 9.85 | 30.54 | 9.90 | 0.509 |
| Fat-free mass (kg) | 21.44 | 5.06 | 19.90 | 5.13 | 20.67 | 5.15 | <0.001 |
| uCr (g/L) | 1.06 | 0.44 | 1.03 | 0.43 | 1.04 | 0.43 | 0.014 |
| uCa (mmol/L) | 3.03 | 2.22 | 3.00 | 2.25 | 3.02 | 2.23 | 0.734 |
| uCa/Cr (mmol/g) | 3.11 | 2.27 | 3.15 | 2.30 | 3.13 | 2.29 | 0.501 |
| uNa (mmol/L) | 138.86 | 54.44 | 133.13 | 53.91 | 136.03 | 54.25 | 0.001 |
| uNa/Cr (mmol/g) | 151.69 | 84.22 | 150.67 | 87.07 | 151.18 | 85.63 | 0.696 |
| uK (mmol/L) | 43.46 | 23.04 | 38.86 | 20.84 | 41.19 | 22.10 | <0.001 |
| uK/Cr (mmol/g) | 47.32 | 34.33 | 43.69 | 31.76 | 45.53 | 33.13 | <0.001 |
| uMg (mmol/L) | 6.06 | 2.71 | 6.02 | 2.85 | 6.04 | 2.78 | 0.637 |
| uMg/Cr (mmol/g) | 6.01 | 2.15 | 6.08 | 2.16 | 6.04 | 2.16 | 0.238 |
| uPO4 (g/L) | 1.14 | 0.49 | 1.08 | 0.49 | 1.11 | 0.49 | <0.001 |
| uPO4/Cr | 1.12 | 0.36 | 1.09 | 0.35 | 1.10 | 0.36 | 0.004 |
| Characteristic | Belgium | Estonia | Germany | Hungary | Italy | Spain | Sweden | p-Value b | Eta Squared | |||||||
|---|---|---|---|---|---|---|---|---|---|---|---|---|---|---|---|---|
| n = 542 a | n = 271 | n = 951 | n = 803 | n = 1190 | n = 200 | n = 365 | ||||||||||
| Mean | SD | Mean | SD | Mean | SD | Mean | SD | Mean | SD | Mean | SD | Mean | SD | |||
| uCa/Cr (mmol/g) | 2.71 | 2.02 | 2.38 | 1.57 | 2.81 | 2.12 | 3.40 | 2.29 | 3.28 | 2.44 | 4.08 | 2.53 | 3.56 | 2.47 | <0.001 | 0.03 |
| uNa/Cr (mmol/g) | 143.14 | 78.68 | 125.68 | 77.70 | 148.58 | 85.77 | 171.93 | 95.53 | 142.03 | 79.59 | 204.12 | 91.95 | 144.04 | 70.09 | <0.000 | 0.04 |
| uK/Cr (mmol/g) | 56.60 | 38.18 | 39.69 | 28.23 | 46.70 | 34.73 | 41.50 | 32.09 | 41.12 | 27.84 | 55.74 | 40.49 | 48.22 | 32.37 | <0.001 | 0.03 |
| uMg/Cr (mmol/g) | 5.86 | 2.18 | 4.82 | 1.59 | 5.83 | 2.06 | 6.60 | 2.24 | 6.07 | 2.09 | 6.60 | 2.25 | 6.17 | 2.23 | <0.001 | 0.04 |
| uPO4/Cr (g/L) | 1.11 | 0.35 | 1.01 | 0.31 | 1.08 | 0.34 | 0.99 | 0.34 | 1.10 | 0.33 | 1.41 | 0.40 | 1.27 | 0.38 | <0.001 | 0.08 |
| uCr (g/L) | 1.03 | 0.40 | 1.26 | 0.51 | 1.08 | 0.44 | 0.98 | 0.46 | 1.05 | 0.41 | 0.84 | 0.32 | 1.03 | 0.39 | <0.001 | 0.03 |
| SI | 93.67 | 15.66 | 81.25 | 10.04 | 79.68 | 12.24 | 88.51 | 14.63 | 76.13 | 11.59 | 86.11 | 10.29 | 83.99 | 13.33 | <0.001 | 0.18 |
| SOS (m/s) | 1623.27 | 49.47 | 1582.93 | 20.61 | 1590.2 | 39.36 | 1609.24 | 57.42 | 1567.36 | 32.68 | 1589.97 | 28.03 | / | / | <0.000 | 0.19 |
| n = 349 | n = 261 | n = 522 | n = 272 | n = 667 | n = 190 | n = 0 | ||||||||||
| BUA (dB/MHz) | 90.14 | 24.61 | 87.03 | 10.76 | 84.55 | 15.46 | 87.09 | 17.22 | 86.91 | 14.17 | 92.32 | 12.35 | / | / | <0.001 | 0.02 |
| n = 347 | n = 261 | n = 519 | n = 272 | n = 667 | n = 190 | n = 0 | ||||||||||
| Age (years) | 7.69 | 1.55 | 9.65 | 1.06 | 8.14 | 1.82 | 7.94 | 2.06 | 8.15 | 1.80 | 8.19 | 1.35 | 8.17 | 1.92 | <0.001 | 0.05 |
| BMI z-score | 0.01 | 0.92 | 0.28 | 1.05 | 0.26 | 1.04 | 0.14 | 1.34 | 1.27 | 1.21 | 0.65 | 1.06 | 0.13 | 1.00 | <0.001 | 0.16 |
| FFM (kg) | 18.87 | 4.26 | 24.53 | 4.17 | 20.43 | 4.91 | 20.43 | 5.51 | 21.08 | 5.38 | 20.41 | 5.29 | 20.44 | 4.89 | <0.001 | 0.05 |
| n = 539 | n = 271 | n = 950 | n = 803 | n = 1170 | n = 199 | n = 365 | ||||||||||
| % boys | 51.7 | 47.6 | 51.2 | 48.6 | 52.2 | 51 | 48.8 | 0.625 c | ||||||||
| Urinary Mineral Concentrations | uNa/Cr a | uK/Cr | uMg/Cr | uPO4/Cr |
|---|---|---|---|---|
| uCa/Cr | 0.328 * | −0.116 * | 0.495 * | 0.343 * |
| uNa/Cr | 0.414 * | 0.199 * | 0.162 * | |
| uK/Cr | −0.061 * | −0.005 | ||
| uMg/Cr | 0.465 * |
| Characteristic | Cluster 1 c | Cluster 2 | Cluster 3 | Eta Squared | |||
|---|---|---|---|---|---|---|---|
| n = 1409 d | n = 1742 | n = 1171 | |||||
| Mean | SD | Mean | SD | Mean | SD | ||
| uCa/Cr (mmol/g) | 1.03 | 0.46 | 4.04 | 1.92 | 4.30 | 2.36 | 0.41 |
| uNa/Cr (mmol/g) | 111.80 | 54.83 | 123.68 | 45.74 | 239.49 | 97.74 | 0.40 |
| uK/Cr (mmol/g) | 45.52 | 28.87 | 27.92 | 9.66 | 71.73 | 41.99 | 0.28 |
| uMg/Cr (mmol/g) | 4.75 | 1.62 | 6.45 | 1.89 | 7.00 | 2.36 | 0.18 |
| uPO4/Cr | 0.96 | 0.31 | 1.12 | 0.30 | 1.25 | 0.42 | 0.10 |
| SI | 82.99 | 13.80 | 82.08 a | 13.82 | 83.86 a | 15.25 | 0.003 |
| SOS (m/s) | 1587.72 a | 39.59 | 1584.24 b | 40.25 | 1601.49 a,b | 51.90 | 0.03 |
| n = 799 | n = 868 | n = 594 | |||||
| BUA (dB/MHz) | 88.41 a | 15.39 | 87.92 b | 15.73 | 85.11 a,b | 18.89 | 0.007 |
| n = 796 | n = 867 | n = 593 | |||||
| Age (years) | 8.41 a | 1.74 | 8.38 b | 1.76 | 7.50 a,b | 1.88 | 0.05 |
| BMI z-score | 0.50 a | 1.22 | 0.56 b | 1.24 | 0.36 a,b | 1.25 | 0.004 |
| FFM (kg) | 21.36 a | 5.01 | 21.17 b | 4.94 | 19.11 a,b | 5.29 | 0.03 |
| n = 1400 | n = 1734 | n = 1163 | |||||
| Cr (g/L) | 1.19 a | 0.47 | 1.10 a | 0.38 | 0.72 a | 0.26 | 0.21 |
| % boys e | 51.5 | 48.2 | 53.1 | ||||
| Country f | 32.8% Italy 40.6% Estonia 40.8% Belgium 29.3% Sweden 38.1% Germany 23.8% Hungary 14.0% Spain | 45.9% Italy 44.3% Estonia 28.6% Belgium 36.4% Sweden 37.5% Germany 45.8% Hungary 31.5% Spain | 21.3% Italy 15.1% Estonia 30.6% Belgium 34.2% Sweden 24.4% Germany 30.4% Hungary 54.5% Spain | ||||
| Urinary Mineral Concentrations c | SOS | BUA | SI | ||||||
|---|---|---|---|---|---|---|---|---|---|
| n = 2261 | n = 2256 | n = 4322 | |||||||
| B (95%CI) | p-Value d | R2 | B (95%CI) | p-Value | R2 | B (95%CI) | p-Value | R2 | |
| uCa/Cr a | −0.356 (−2.112;1.399) | 0.691 | 0.195 | 0.280 (−0.370;0.929) | 0.389 | 0.367 | −0.234 (−0.699;0.232) | 0.325 | 0.031 |
| uNa/Cr a | 2.496 (−0.301;5.294) | 0.080 | 0.196 | 1.315 (0.281;2.348) | 0.013 | 0.369 | 1.324 (0.599;2.049) | <0.001 | 0.034 |
| uK/Cr a | 3.086 (0.348;5.824) | 0.027 | 0.197 | 0.614 (−0.399;1.626) | 0.235 | 0.368 | 0.453 (−0.261;1.167) | 0.213 | 0.031 |
| uMg/Cr a | −0.429 (−4.258;3.400) | 0.826 | 0.195 | 0.374 (−1.045;1.794) | 0.605 | 0.367 | −0.191 (−1.214;0.831) | 0.713 | 0.031 |
| uPO4/Cr a | 1.515 (−3.120;6.149) | 0.522 | 0.195 | 1.630 (−0.082;3.341) | 0.062 | 0.368 | 0.704 (−0.459;1.867) | 0.236 | 0.031 |
| uCa/Cr b | −0.888 (−2.722;0.946) | 0.342 | 0.197 | 0.044 (−0.634;0.722) | 0.898 | 0.369 | −0.542 (−1.029;−0.054) | 0.029 | 0.035 |
© 2016 by the authors; licensee MDPI, Basel, Switzerland. This article is an open access article distributed under the terms and conditions of the Creative Commons Attribution (CC-BY) license (http://creativecommons.org/licenses/by/4.0/).
Share and Cite
Van den Bussche, K.; Herrmann, D.; De Henauw, S.; Kourides, Y.A.; Lauria, F.; Marild, S.; Molnár, D.; Moreno, L.A.; Veidebaum, T.; Ahrens, W.; et al. Urinary Mineral Concentrations in European Pre-Adolescent Children and Their Association with Calcaneal Bone Quantitative Ultrasound Measurements. Int. J. Environ. Res. Public Health 2016, 13, 471. https://doi.org/10.3390/ijerph13050471
Van den Bussche K, Herrmann D, De Henauw S, Kourides YA, Lauria F, Marild S, Molnár D, Moreno LA, Veidebaum T, Ahrens W, et al. Urinary Mineral Concentrations in European Pre-Adolescent Children and Their Association with Calcaneal Bone Quantitative Ultrasound Measurements. International Journal of Environmental Research and Public Health. 2016; 13(5):471. https://doi.org/10.3390/ijerph13050471
Chicago/Turabian StyleVan den Bussche, Karen, Diana Herrmann, Stefaan De Henauw, Yiannis A. Kourides, Fabio Lauria, Staffan Marild, Dénes Molnár, Luis A. Moreno, Toomas Veidebaum, Wolfgang Ahrens, and et al. 2016. "Urinary Mineral Concentrations in European Pre-Adolescent Children and Their Association with Calcaneal Bone Quantitative Ultrasound Measurements" International Journal of Environmental Research and Public Health 13, no. 5: 471. https://doi.org/10.3390/ijerph13050471
APA StyleVan den Bussche, K., Herrmann, D., De Henauw, S., Kourides, Y. A., Lauria, F., Marild, S., Molnár, D., Moreno, L. A., Veidebaum, T., Ahrens, W., & Sioen, I. (2016). Urinary Mineral Concentrations in European Pre-Adolescent Children and Their Association with Calcaneal Bone Quantitative Ultrasound Measurements. International Journal of Environmental Research and Public Health, 13(5), 471. https://doi.org/10.3390/ijerph13050471