
Environmental Exposure to Triclosan and Semen Quality

 ,
,
Abstract
:1. Introduction
2. Materials and Methods
2.1. Study Subjects
2.2. Measurement of Urinary TCS
2.3. Semen Analysis
2.4. Statistical Analysis
3. Results
4. Discussion
5. Conclusions
Supplementary Materials
Acknowledgments
Author Contributions
Conflicts of Interest
Appendix

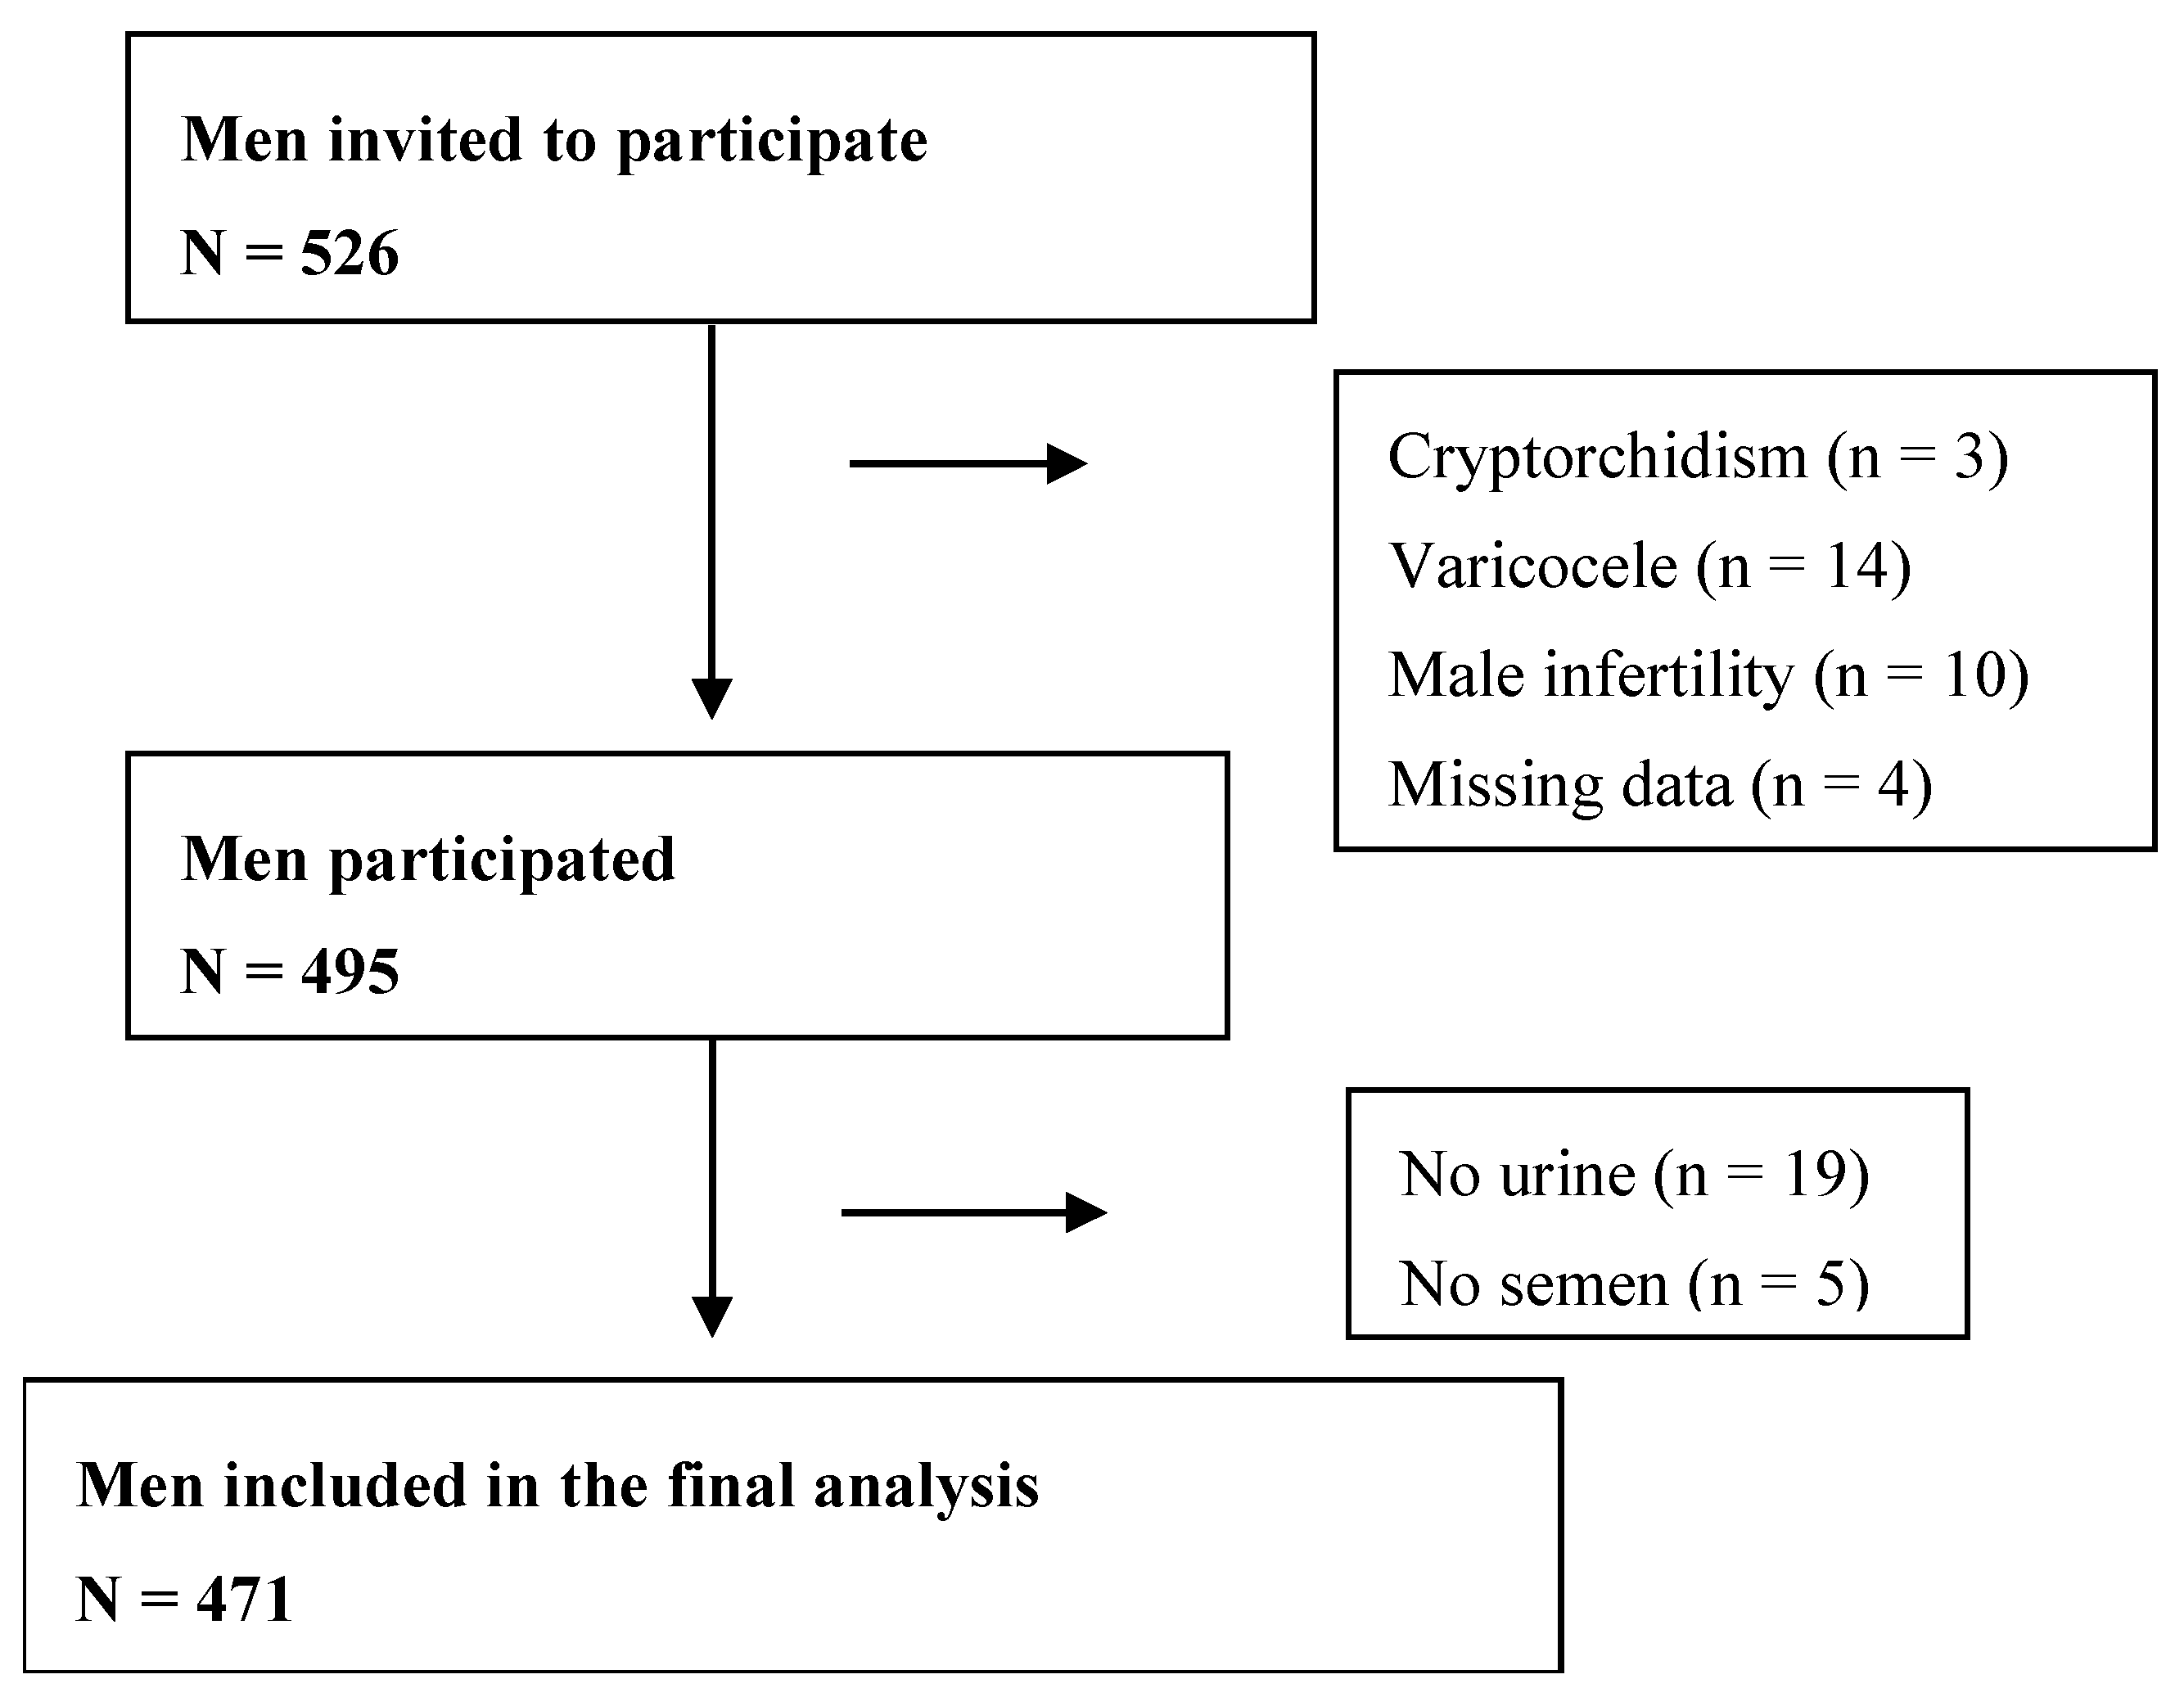
| Demographic Characteristics | Included | Excluded | p Value |
|---|---|---|---|
| N = 471 | N = 55 | ||
| Age (Years) mean ± SD | 30.8 ± 4.1 | 31.1 ± 3.5 | 0.69 |
| BMI (Kg·m−2) mean ± SD | 24.0 ± 3.1 | 24.0 ± 3.3 | 0.93 |
| Education (Years) | 0.91 | ||
| ≤15 | 129 (27.4%) | 13 (23.6%) | |
| 16 | 232 (49.3%) | 30 (54.5%) | |
| ≥17 | 110 (23.4%) | 12 (21.8%) | |
| Income (¥104/y) | 0.97 | ||
| <10 | 161 (34.2%) | 19 (34.5%) | |
| 10–30 | 234 (49.7%) | 28 (50.9%) | |
| >30 | 42 (8.9%) | 5 (9.1%) | |
| Refuse to answer | 30 (7.2%) | 3 (5.5%) | |
| Current Smoking (No./day) | 0.11 | ||
| 0 | 361 (76.6%) | 44 (80.0%) | |
| 1–10 | 83 (17.7%) | 5 (9.1%) | |
| >10 | 27 (5.7%) | 6 (10.9%) | |
| Drinking a | 0.83 | ||
| Never | 164 (34.8%) | 20 (36.4%) | |
| Seldom | 281 (59.7%) | 33 (60.0%) | |
| Frequent | 26 (5.5%) | 2 (3.6%) | |
| Abstinence time (days) | 0.99 | ||
| ≤3 | 138 (29.4%) | 12 (30.0%) | |
| >3, ≤5 | 154 (32.8%) | 13 (32.5%) | |
| >5 | 178 (37.9%) | 15 (37.5%) |
| Demographic Characteristics | TCS_Cre | |
|---|---|---|
| ≤0.97 (ng·mg−1) N = 236 | >0.97 (ng·mg−1) N = 235 | |
| Age (Years) mean ± SD | 30.8 ± 4.1 | 30.9 ± 4.2 |
| BMI (Kg·m−2) mean ± SD | 24.0 ± 3.0 | 24.0 ± 3.2 |
| Education (Years) | ||
| ≤15 | 70 (29.7) | 56 (23.8) |
| 16 | 118 (50.0) | 118 (50.2) |
| ≥17 | 48 (20.3) | 61 (26.0) |
| Income (¥104/y) | ||
| <10 | 90 (38.1) | 68 (28.9) |
| 10–30 | 114 (48.3) | 121 (51.5) |
| >30 | 19 (8.1) | 24 (10.2) |
| Refuse to answer | 13 (5.5) | 22 (9.4) |
| Current Smoking (No./day) | ||
| 0 | 177 (75.0) | 184 (78.3) |
| 1–10 | 46 (19.5) | 37 (15.7) |
| >10 | 13 (5.5) | 14 (6.0) |
| Drinking a | ||
| Never | 76 (32.5) | 88 (37.0) |
| Seldom | 145 (61.6) | 136 (58.0) |
| Frequent | 15 (5.9) | 11 (5.0) |
| Abstinence Time (days) | ||
| ≤3 | 67 (28.4) | 72 (30.6) |
| >3, ≤5 | 83 (35.2) | 71 (30.2) |
| >5 | 86 (36.4) | 92 (39.2) |
| Demographic Characteristics | Semen Parameters | |||
|---|---|---|---|---|
| Normal a (N = 275) | Sperm Count b <39 Million (N = 27) | Sperm Concerntration b <15 Million/mL (N = 21) | Percentage of Moving Forward Sperm b <32% (N = 117) | |
| Age (Years) mean ± SD | 30.6 ± 4.0 | 30.3 ± 3.9 | 31.4 ± 4.8 | 31.5 ± 4.8 |
| BMI (Kg·m−2) mean ± SD | 24.2 ± 3.2 | 23.7 ± 2.6 | 23.7 ± 2.6 | 23.3 ± 2.9 |
| Education (Years) | ||||
| ≤15 | 72 (26.2) | 8(29.6) | 6 (28.6) | 35 (29.9) |
| 16 | 143 (52.0) | 8(29.6) | 6 (28.6) | 52 (44.4) |
| ≥17 | 60 (21.8) | 11(40.7) | 9 (42.9) | 30 (25.6) |
| Income (¥104/y) | ||||
| <10 | 87 (31.6) | 11 (40.7) | 6 (28.6) | 40 (34.2) |
| 10–30 | 136 (49.5) | 12 (44.4) | 12 (57.1) | 65 (55.6) |
| >30 | 29 (10.6) | 2 (7.4) | 1 (4.8) | 4 (3.4) |
| Refuse to answer | 23 (8.4) | 2 (7.4) | 2 (9.5) | 8 (6.8) |
| Current Smoking (No./day) | ||||
| 0 | 213 (77.5) | 21 (77.9) | 20 (95.2) | 91 (77.8) |
| 1–10 | 44 (16.0) | 5 (6.2) | 1 (4.8) | 22 (18.8) |
| >10 | 18 (6.6) | 1 (9.6) | 0 (0.0) | 4 (3.4) |
| Drinking c | ||||
| Never | 90 (32.7) | 7 (26.0) | 8 (38.1) | 47 (40.2) |
| Seldom | 171 (62.2) | 20 (74.1) | 13 (61.9) | 62 (53.0) |
| Frequent | 14 (5.1) | 0 (0.0) | 0 (0.0) | 8 (6.8) |
| Abstinence Time (days) | ||||
| ≤3 | 86 (31.3) | 14 (51.9) | 10 (47.6) | 32 (27.4) |
| >3, ≤5 | 92 (33.5) | 4 (14.8) | 5 (23.8) | 36 (30.8) |
| >5 | 97 (35.3) | 9 (33.3) | 6 (28.6) | 49 (41.9) |
References
- Rodricks, J.V.; Swenberg, J.A.; Borzelleca, J.F.; Maronpot, R.R.; Shipp, A.M. Triclosan: A critical review of the experimental data and development of margins of safety for consumer products. Crit. Rev. Toxicol. 2010, 40, 422–484. [Google Scholar] [CrossRef] [PubMed]
- Chalew, T.E.; Halden, R.U. Environmental exposure of aquatic and terrestrial biota to triclosan and triclocarban. J. Am. Water Works Assoc. 2009, 45, 4–13. [Google Scholar] [CrossRef] [PubMed]
- Reiss, R.; Lewis, G.; Griffin, J. An ecological risk assessment for triclosan in the terrestrial environment. Environ. Toxicol. Chem./SETAC 2009, 28, 1546–1556. [Google Scholar] [CrossRef] [PubMed]
- Moss, T.; Howes, D.; Williams, F.M. Percutaneous penetration and dermal metabolism of triclosan (2,4, 4′-trichloro-2′-hydroxydiphenyl ether). Food Chem. Toxicol. 2000, 38, 361–370. [Google Scholar] [CrossRef]
- Sandborgh-Englund, G.; Adolfsson-Erici, M.; Odham, G.; Ekstrand, J. Pharmacokinetics of triclosan following oral ingestion in humans. J. Toxicol. Environ. Health Part A 2006, 69, 1861–1873. [Google Scholar] [CrossRef] [PubMed]
- Geens, T.; Neels, H.; Covaci, A. Sensitive and selective method for the determination of bisphenol-a and triclosan in serum and urine as pentafluorobenzoate-derivatives using gc-ecni/ms. J. Chromatogr. B Anal. Technol. Biomed. Life Sci. 2009, 877, 4042–4046. [Google Scholar] [CrossRef] [PubMed]
- Allmyr, M.; Adolfsson-Erici, M.; McLachlan, M.S.; Sandborgh-Englund, G. Triclosan in plasma and milk from swedish nursing mothers and their exposure via personal care products. Sci. Total Environ. 2006, 372, 87–93. [Google Scholar] [CrossRef] [PubMed]
- Calafat, A.M.; Ye, X.; Wong, L.Y.; Reidy, J.A.; Needham, L.L. Urinary concentrations of triclosan in the U.S. Population: 2003–2004. Environ. Health Perspect. 2008, 116, 303–307. [Google Scholar] [CrossRef] [PubMed]
- Gee, R.H.; Charles, A.; Taylor, N.; Darbre, P.D. Oestrogenic and androgenic activity of triclosan in breast cancer cells. J. Appl. Toxicol. 2008, 28, 78–91. [Google Scholar] [CrossRef] [PubMed]
- Kumar, V.; Balomajumder, C.; Roy, P. Disruption of lh-induced testosterone biosynthesis in testicular leydig cells by triclosan: Probable mechanism of action. Toxicology 2008, 250, 124–131. [Google Scholar] [CrossRef] [PubMed]
- Forgacs, A.L.; Ding, Q.; Jaremba, R.G.; Huhtaniemi, I.T.; Rahman, N.A.; Zacharewski, T.R. Bltk1 murine leydig cells: A novel steroidogenic model for evaluating the effects of reproductive and developmental toxicants. Toxicol. Sci.: Off. J. Soc. Toxicol. 2012, 127, 391–402. [Google Scholar] [CrossRef] [PubMed]
- Kumar, V.; Chakraborty, A.; Kural, M.R.; Roy, P. Alteration of testicular steroidogenesis and histopathology of reproductive system in male rats treated with triclosan. Reprod. Toxicol. 2009, 27, 177–185. [Google Scholar] [CrossRef] [PubMed]
- Lan, Z.; Hyung Kim, T.; Shun Bi, K.; Hui Chen, X.; Sik Kim, H. Triclosan exhibits a tendency to accumulate in the epididymis and shows sperm toxicity in male sprague-dawley rats. Environ. Toxicol. 2015, 30, 83–91. [Google Scholar] [CrossRef] [PubMed]
- Zhao, S.-S.; Zhang, J.; Tian, Y. Establishment and application of determination method for BPA, TCS and 4-n-NP in urine by HPLC-MS/MS. J. Environ. Occup. Med. 2015, 32, 846–851. [Google Scholar]
- Lu, J.C.; Huang, Y.F.; Lu, N.Q. Who laboratory manual for the examination and processing of human semen: Its applicability to andrology laboratories in china. Natl. J. Androl. 2010, 16, 867–871. [Google Scholar]
- Mendiola, J.; Jorgensen, N.; Andersson, A.M.; Calafat, A.M.; Ye, X.; Redmon, J.B.; Drobnis, E.Z.; Wang, C.; Sparks, A.; Thurston, S.W.; et al. Are environmental levels of bisphenol a associated with reproductive function in fertile men? Environ. Health Perspect. 2010, 118, 1286–1291. [Google Scholar] [CrossRef] [PubMed]
- Li, D.K.; Zhou, Z.; Miao, M.; He, Y.; Wang, J.; Ferber, J.; Herrinton, L.J.; Gao, E.; Yuan, W. Urine bisphenol-a (BPA) level in relation to semen quality. Fertil. Steril. 2011, 95, 625–630.e4. [Google Scholar] [CrossRef] [PubMed]
- Kleinbaum, D.G.; Muller, K.E.; Nizam, A. Selecting the best regression equation. In Applied Regression Analysis and Other Multivariate Methods, 3rd ed.; Brooks/Cole: Pacific Grove, CA, USA, 1998. [Google Scholar]
- Arbuckle, T.E.; Marro, L.; Davis, K.; Fisher, M.; Ayotte, P.; Belanger, P.; Dumas, P.; LeBlanc, A.; Berube, R.; Gaudreau, E.; et al. Exposure to free and conjugated forms of bisphenol a and triclosan among pregnant women in the mirec cohort. Environ. Health Perspect. 2015, 123, 277–284. [Google Scholar] [CrossRef] [PubMed]
- Jurewicz, J.; Radwan, M.; Sobala, W.; Ligocka, D.; Radwan, P.; Bochenek, M.; Hanke, W. Lifestyle and semen quality: Role of modifiable risk factors. Syst. Biol. Reprod. Med. 2014, 60, 43–51. [Google Scholar] [CrossRef] [PubMed]
- Li, Y.; Lin, H.; Li, Y.; Cao, J. Association between socio-psycho-behavioral factors and male semen quality: Systematic review and meta-analyses. Fertil. Steril. 2011, 95, 116–123. [Google Scholar] [CrossRef] [PubMed]
- Chen, M.; Tang, R.; Fu, G.; Xu, B.; Zhu, P.; Qiao, S.; Chen, X.; Qin, Y.; Lu, C.; Hang, B.; et al. Association of exposure to phenols and idiopathic male infertility. J. Hazard. Mater. 2013, 250–251, 115–121. [Google Scholar] [CrossRef] [PubMed]
- Den Hond, E.; Tournaye, H.; De Sutter, P.; Ombelet, W.; Baeyens, W.; Covaci, A.; Cox, B.; Nawrot, T.S.; Van Larebeke, N.; D’Hooghe, T. Human exposure to endocrine disrupting chemicals and fertility: A case-control study in male subfertility patients. Environ. Int. 2015, 84, 154–160. [Google Scholar] [CrossRef] [PubMed]
- Ahn, K.C.; Zhao, B.; Chen, J.; Cherednichenko, G.; Sanmarti, E.; Denison, M.S.; Lasley, B.; Pessah, I.N.; Kultz, D.; Chang, D.P.; et al. In vitro biologic activities of the antimicrobials triclocarban, its analogs, and triclosan in bioassay screens: Receptor-based bioassay screens. Environ. Health Perspect. 2008, 116, 1203–1210. [Google Scholar] [CrossRef] [PubMed]
- Casas, L.; Fernandez, M.F.; Llop, S.; Guxens, M.; Ballester, F.; Olea, N.; Irurzun, M.B.; Rodriguez, L.S.; Riano, I.; Tardon, A.; et al. Urinary concentrations of phthalates and phenols in a population of Spanish pregnant women and children. Environ. Int. 2011, 37, 858–866. [Google Scholar] [CrossRef] [PubMed]
- Lankester, J.; Patel, C.; Cullen, M.R.; Ley, C.; Parsonnet, J. Urinary triclosan is associated with elevated body mass index in NHANES. PLoS ONE 2013, 8, e80057. [Google Scholar] [CrossRef] [PubMed]
- Huang, H.; Du, G.; Zhang, W.; Hu, J.; Wu, D.; Song, L.; Xia, Y.; Wang, X. The in vitro estrogenic activities of triclosan and triclocarban. J. Appl. Toxicol. 2014, 34, 1060–1067. [Google Scholar] [CrossRef] [PubMed]
- Stoker, T.E.; Gibson, E.K.; Zorrilla, L.M. Triclosan exposure modulates estrogen-dependent responses in the female Wistar rat. Toxicol. Sci.: Off. J. Soc. Toxicol. 2010, 117, 45–53. [Google Scholar] [CrossRef] [PubMed]
- Louis, G.W.; Hallinger, D.R.; Stoker, T.E. The effect of triclosan on the uterotrophic response to extended doses of ethinyl estradiol in the weanling rat. Reprod. Toxicol. 2013, 36, 71–77. [Google Scholar] [CrossRef] [PubMed]
- Saunders, P.T.; Sharpe, R.M.; Williams, K.; Macpherson, S.; Urquart, H.; Irvine, D.S.; Millar, M.R. Differential expression of oestrogen receptor alpha and beta proteins in the testes and male reproductive system of human and non-human primates. Mol. Hum. Reprod. 2001, 7, 227–236. [Google Scholar] [CrossRef] [PubMed]
- Aschim, E.L.; Giwercman, A.; Stahl, O.; Eberhard, J.; Cwikiel, M.; Nordenskjold, A.; Haugen, T.B.; Grotmol, T.; Giwercman, Y.L. The rsai polymorphism in the estrogen receptor-beta gene is associated with male infertility. J. Clin. Endocrinol. Metab. 2005, 90, 5343–5348. [Google Scholar] [CrossRef] [PubMed]
- Schulze, C. Response of the human testis to long-term estrogen treatment: Morphology of sertoli cells, leydig cells and spermatogonial stem cells. Cell Tissue Res. 1988, 251, 31–43. [Google Scholar] [CrossRef] [PubMed]
- Lange, A.; Sebire, M.; Rostkowski, P.; Mizutani, T.; Miyagawa, S.; Iguchi, T.; Hill, E.M.; Tyler, C.R. Environmental chemicals active as human antiandrogens do not activate a stickleback androgen receptor but enhance a feminising effect of oestrogen in roach. Aquat. Toxicol. 2015, 168, 48–59. [Google Scholar] [CrossRef] [PubMed]
- Couse, J.F.; Lindzey, J.; Grandien, K.; Gustafsson, J.A.; Korach, K.S. Tissue distribution and quantitative analysis of estrogen receptor-alpha (ERalpha) and estrogen receptor-beta (ERbeta) messenger ribonucleic acid in the wild-type and eralpha-knockout mouse. Endocrinology 1997, 138, 4613–4621. [Google Scholar] [PubMed]
- Chen, J.; Ahn, K.C.; Gee, N.A.; Gee, S.J.; Hammock, B.D.; Lasley, B.L. Antiandrogenic properties of parabens and other phenolic containing small molecules in personal care products. Toxicol. Appl. Pharmacol. 2007, 221, 278–284. [Google Scholar] [CrossRef] [PubMed]
- Christen, V.; Crettaz, P.; Oberli-Schrammli, A.; Fent, K. Some flame retardants and the antimicrobials triclosan and triclocarban enhance the androgenic activity in vitro. Chemosphere 2010, 81, 1245–1252. [Google Scholar] [CrossRef] [PubMed]
- Foran, C.M.; Bennett, E.R.; Benson, W.H. Developmental evaluation of a potential non-steroidal estrogen: Triclosan. Mar. Environ. Res. 2000, 50, 153–156. [Google Scholar] [CrossRef]
- Eick, G.N.; Colucci, J.K.; Harms, M.J.; Ortlund, E.A.; Thornton, J.W. Evolution of minimal specificity and promiscuity in steroid hormone receptors. PLoS Genet. 2012, 8, e1003072. [Google Scholar] [CrossRef] [PubMed]
- Witorsch, R.J. Endocrine disruptors: Can biological effects and environmental risks be predicted? Regul. Toxicol. Pharmacol. 2002, 36, 118–130. [Google Scholar] [CrossRef] [PubMed]
- Teitelbaum, S.L.; Britton, J.A.; Calafat, A.M.; Ye, X.; Silva, M.J.; Reidy, J.A.; Galvez, M.P.; Brenner, B.L.; Wolff, M.S. Temporal variability in urinary concentrations of phthalate metabolites, phytoestrogens and phenols among minority children in the united states. Environ. Res. 2008, 106, 257–269. [Google Scholar] [CrossRef] [PubMed]
- Francavilla, F.; Barbonetti, A.; Necozione, S.; Santucci, R.; Cordeschi, G.; Macerola, B.; Francavilla, S. Within-subject variation of seminal parameters in men with infertile marriages. Int. J. Androl. 2007, 30, 174–181. [Google Scholar] [CrossRef] [PubMed]
- Stokes-Riner, A.; Thurston, S.W.; Brazil, C.; Guzick, D.; Liu, F.; Overstreet, J.W.; Wang, C.; Sparks, A.; Redmon, J.B.; Swan, S.H. One semen sample or 2? Insights from a study of fertile men. J. Androl. 2007, 28, 638–643. [Google Scholar] [CrossRef] [PubMed]

| Semen Parameter | N | Mean | Selected Percentiles | ||||
|---|---|---|---|---|---|---|---|
| 10th | 25th | 50th | 75th | 90th | |||
| Semen volume (mL) | 471 | 3.5 | 1.6 | 2.2 | 3.0 | 4.9 | 6.0 |
| Concentration (106 mL−1) | 471 | 85.7 | 24.9 | 40.1 | 70.8 | 115.6 | 163.7 |
| Total sperm count (106) | 471 | 275.9 | 63.7 | 120.8 | 217.2 | 377.6 | 550.0 |
| Sperm motility (Moving forward %) | 464 | 39.5 | 19.4 | 31.9 | 40.8 | 49.0 | 55.7 |
| Sperm morphology (Normal %) | 380 | 12.3 | 6.0 | 8.0 | 12.0 | 16.0 | 18.9 |
| VAP (Average path Velocity μm·s−1) | 458 | 10.1 | 6.9 | 9.0 | 10.0 | 12.0 | 14.0 |
| EED | PercentDetected | GM | LOD | Percentile | Maximum | |||||
|---|---|---|---|---|---|---|---|---|---|---|
| 10th | 25th | 50th | 75th | 90th | 95th | |||||
| TCS(ng·mL−1) | 96.4 | 1.12 | 0.1 | 0.20 | 0.50 | 1.12 | 3.38 | 14.35 | 33.37 | 98.01 |
| TCS_Cre(ng·mg−1) | 96.4 | 0.99 | 0.21 | 0.41 | 0.97 | 2.95 | 12.23 | 21.13 | 131.22 | |
| Semen Parameter | TCS_Cre a | |||||||
|---|---|---|---|---|---|---|---|---|
| 1st Tertile (<0.66 ng·mg−1) | 2nd Tertile (0.66–2.33 ng·mg−1) | 3rd Tertile (≥2.33 ng·mg−1) | Total N = 471 | |||||
| Adjusted-β b Coefficient (95% CI) | p-Value | Adjusted-β b Coefficient (95% CI) | p-Value | Adjusted-β b Coefficient (95% CI) | p-Value | Adjusted-β b Coefficient (95% CI) | p-Value | |
| Sperm volume (mL) | −0.16 (−0.63, 0.32) | 0.51 | −0.28 (−1.07, 0.52) | 0.50 | −0.24 (−0.50, 0.03) | 0.08 | −0.20 (−0.43, 0.02) | 0.07 |
| Concentration a (106 mL−1) | −0.21 (−0.41, −0.01) | 0.04 | 0.15 (−0.19, 0.49) | 0.40 | 0.04 (−0.09, 0.16) | 0.58 | −0.01 (−0.11, 0.08) | 0.77 |
| Total sperm count a (106) | −0.25 (−0.48, −0.02) | 0.04 | 0.03 (−0.32, 0.39) | 0.85 | −0.06 (−0.19, 0.08) | 0.40 | −0.09 (−0.20, 0.01) | 0.09 |
| Sperm motility | ||||||||
| Percentage of forward moving (%) | −0.99 (−4.74, 2.76) | 0.60 | 0.66 (−6.42, 7.74) | 0.86 | −1.55 (−3.94, 0.84) | 0.20 | −1.19 (−3.11, 0.72) | 0.22 |
| Number of forward moving (106) a | −0.35 (−0.68,−0.03) | 0.04 | −0.18 (−0.72, 0.35) | 0.50 | −0.12 (−0.28, 0.04) | 0.16 | −0.17 (−0.32,−0.02) | 0.02 |
| Sperm morphology | ||||||||
| Percentage of normal (%) | −1.64 (−3.05,−0.23) | 0.02 | 2.76 (0.25, 5.28) | 0.03 | −0.13 (−0.96, 0.70) | 0.76 | −0.39 (−1.09, 0.32) | 0.28 |
| Number of normal (106) a | −0.48 (−0.80,−0.16) | <0.01 | 0.25 (−0.24, 0.74) | 0.31 | −0.06 (−0.23, 0.12) | 0.54 | −0.14 (−0.28, 0.01) | 0.06 |
| VAP (average path Velocity μm·s−1) | −0.24 (−1.03, 0.56) | 0.56 | 0.36 (−1.02, 1.75) | 0.61 | 0.02 (−0.46, 0.51) | 0.93 | 0.03 (−0.36, 0.42) | 0.88 |
© 2016 by the authors; licensee MDPI, Basel, Switzerland. This article is an open access article distributed under the terms and conditions of the Creative Commons by Attribution (CC-BY) license (http://creativecommons.org/licenses/by/4.0/).
Share and Cite
Zhu, W.; Zhang, H.; Tong, C.; Xie, C.; Fan, G.; Zhao, S.; Yu, X.; Tian, Y.; Zhang, J. Environmental Exposure to Triclosan and Semen Quality. Int. J. Environ. Res. Public Health 2016, 13, 224. https://doi.org/10.3390/ijerph13020224
Zhu W, Zhang H, Tong C, Xie C, Fan G, Zhao S, Yu X, Tian Y, Zhang J. Environmental Exposure to Triclosan and Semen Quality. International Journal of Environmental Research and Public Health. 2016; 13(2):224. https://doi.org/10.3390/ijerph13020224
Chicago/Turabian StyleZhu, Wenting, Hao Zhang, Chuanliang Tong, Chong Xie, Guohua Fan, Shasha Zhao, Xiaogang Yu, Ying Tian, and Jun Zhang. 2016. "Environmental Exposure to Triclosan and Semen Quality" International Journal of Environmental Research and Public Health 13, no. 2: 224. https://doi.org/10.3390/ijerph13020224
APA StyleZhu, W., Zhang, H., Tong, C., Xie, C., Fan, G., Zhao, S., Yu, X., Tian, Y., & Zhang, J. (2016). Environmental Exposure to Triclosan and Semen Quality. International Journal of Environmental Research and Public Health, 13(2), 224. https://doi.org/10.3390/ijerph13020224