
Fat Mass Centile Charts for Brazilian Children and Adolescents and the Identification of the Roles of Socioeconomic Status and Physical Fitness on Fat Mass Development


Abstract
:1. Introduction
2. Methods
2.1. Participants

| Cohort | Ages (years) | Girls | Boys | Total |
|---|---|---|---|---|
| C1 | (8–9–10) | 690 | 834 | 1524 |
| C2 | (10–11–12) | 570 | 516 | 1086 |
| C3 | (12–13–14) | 606 | 678 | 1284 |
| C4 | (14–15–16) | 252 | 324 | 576 |
| Total | 2118 | 2352 | 4470 |
| Ages | Girls | Boys | Total |
|---|---|---|---|
| 8 | 115 | 132 | 247 |
| 9 | 136 | 154 | 290 |
| 10 | 160 | 131 | 291 |
| 11 | 224 | 192 | 416 |
| 12 | 309 | 288 | 597 |
| 13 | 371 | 287 | 658 |
| 14 | 267 | 239 | 506 |
| 15 | 207 | 185 | 392 |
| 16 | 132 | 130 | 262 |
| Total | 1921 | 1738 | 3659 |
2.2. Ethical Statement
2.3. Dependent Variables
Anthropometrics
2.4. Time-Invariant Predictor
Socioeconomic Status
2.5. Time-Varying Predictors
Maturity Status
2.6. Physical Fitness
2.7. Data Quality Control
2.8. Statistical Analyses
2.8.1. Centile Charts
2.8.2. Multilevel Modelling
3. Results
| Variables | 8 Years | 9 Years | 10 Years | 11 Years | 12 Years | 13 Years | 14 Years | 15 Years | 16 Years | |
|---|---|---|---|---|---|---|---|---|---|---|
| (n) Mean ± SD | (n) Mean ± SD | (n) Mean ± SD | (n) Mean ± SD | (n) Mean ± SD | (n) Mean ± SD | (n) Mean ± SD | (n) Mean ± SD | (n) Mean ± SD | ||
| Anthropometrics measures | ||||||||||
| Heigth (cm) | Girls | (67) 125.2 ± 6.0 | (139) 127.2 ± 6.2 | (166) 135.5 ± 7.3 | (179) 139.6 ± 7.7 | (161) 146.8 ± 8.1 | (179) 150.0 ± 7.7 | (136) 154.1 ± 6.6 | (110) 156.2 ± 6.2 | (56) 157.6 ± 6.1 |
| Boys | (75) 125.1 ± 6.1 | (153) 128.5 ± 6.9 | (196) 134.6 ± 6.9 | (177) 137.6 ± 6.6 | (141) 144.5 ± 6.9 | (191) 149.1 ± 7.6 | (179) 156.9 ± 7.3 | (131) 160.4 ± 7.4 | (55) 166.7 ± 5.6 | |
| Weight (kg) | Girls | (67) 24.2 ± 4.4 | (139) 27.3 ± 6.3 | (166) 33.3 ± 9.6 | (179) 35.9 ± 9.6 | (161) 41.3 ± 10.6 | (179) 45.1 ± 10.9 | (136) 47.5 ± 10.9 | (110) 48.9 ± .0 | (56) 50.5 ± 5.8 |
| Boys | (75) 26.6 ± 6.3 | (153) 28.5 ± 7.7 | (196) 32.5 ± 8.4 | (177) 34.0 ± 8.3 | (141) 37.8 ± 8.2 | (191) 42.0 ± 8.9 | (179) 47.5 ± 8.9 | (131) 50.5 ± 8.0 | (55) 57.9 ± 9.5 | |
| Fat mass (%) | Girls | (67) 16.8 ± 5.1 | (128) 16.4 ± 4.3 | (147) 18.9 ± 6.0 | (157) 18.6 ± 5.9 | (155) 21.6 ± 8.2 | (174) 23.3 ± 8.9 | (134) 24.0 ± 7.6 | (109) 23.9 ± 7.9 | (55) 24.7 ± 5.5 |
| Boys | (69) 15.2 ± 5.3 | (137) 14.3 ± 4.7 | (161) 15.3 ± 5.6 | (155) 13.4 ± 5.0 | (132) 14.5 ± 6.1 | (178) 14.4 ± 5.8 | (159) 10.8 ± 3.5 | (122) 11.3 ± 3.9 | (51) 13.6 ± 5.8 | |
| Maturity Offset (years) | Girls | (67) −3.51 ± 0.35 | (139) −2.97 ± 0.48 | (166) −1.99 ± 0.57 | (179) −1.36 ± 0.60 | (161) −0.35 ± 0.62 | (179) 0.29 ± 0.57 | (136) 1.14 ± 0.51 | (110) 1.68 ± 0.49 | (56) 2.49 ± 0.46 |
| Boys | (75) −4.61 ± 0.34 | (152) −4.25 ± 0.48 | (196) −3.51 ± 0.53 | (178) −3.15 ± 0.47 | (141) −2.27 ± 0.56 | (191) −1.72 ± 0.59 | (179) −0.70 ± 0.68 | (131) −0.08 ± 0.70 | (55) 1.11 ± 0.50 | |
| Physical Fitness tests | ||||||||||
| 12-minute run (m) | Girls | (54) 1431.6 ± 126.6 | (139) 1570.4 ± 348.2 | (117) 1601.8 ± 280.1 | (151) 1647.2 ± 258.3 | (148) 1641.7 ± 283.0 | (164) 1632.8 ± 321.1 | (123) 1680.6 ± 326.9 | (87) 1624.9 ± 339.1 | (40) 1619.3 ± 250.8 |
| Boys | (57) 1445.6 ± 173.8 | (153) 1593.3 ± 369.9 | (152) 1764.0 ± 371.1 | (156) 1827.0 ± 353.8 | (137) 1884.5 ± 342.4 | (180) 1989.4 ± 390.1 | (168) 2116.0 ± 334.6 | (124) 2165.4 ± 380.8 | (47) 2161.9 ± 364.5 | |
| SLJ (cm) | Girls | (67) 109.6 ± 22.2 | (139) 121.4 ± 21.6 | (165) 125.9 ± 22.0 | (173) 130.6 ± 23.0 | (159) 134.5 ± 20.4 | (177) 139.9 ± 21.9 | (131) 139.5 ± 19.6 | (107) 138.7 ± 22.6 | (51) 137.4 ± 17.4 |
| Boys | (57) 117.0 ± 22.0 | (153) 128.7 ± 20.6 | (195) 136.2 ± 18.7 | (176) 142.7 ± 18.5 | (141) 146.4 ± 19.5 | (188) 158.2 ± 21.2 | (174) 174.4 ± 23.4 | (129) 178.9 ± 25.4 | (55) 178.3 ± 26.8 | |
| SHR (s) | Girls | (67) 25.7 ± 1.9 | (130) 24.5 ± 2.2 | (164) 23.7 ± 1.8 | (171) 23.2 ± 1.8 | (158) 22.8 ± 1.7 | (171) 22.6 ± 1.6 | (129) 22.8 ± 1.9 | (100) 22.9 ± 2.0 | (49) 23.2 ± 1.9 |
| Boys | (57) 24.7 ± 2.2 | (153) 23.3 ± 1.8 | (191) 22.4 ± 3.7 | (174) 22.1 ± 1.5 | (140) 22.0 ± 1.6 | (185) 21.4 ± 1.7 | (171) 20.7 ± 1.6 | (130) 20.5 ± 1.6 | (50) 20.5 ± 1.7 | |
| HGr (kg) | Girls | (67) 9.5 ± 2.0 | (139) 10.6 ± 2.6 | (158) 14.7 ± 3.7 | (161) 15.9 ± 4.2 | (144) 18.8 ± 5.7 | (164) 20.8 ± 5.3 | (120) 22.5 ± 5.5 | (102) 24.1 ± 4.4 | (55) 26.6 ± 3.4 |
| Boys | (57) 11.0 ± 2.9 | (153) 11.7 ± 2.7 | (180) 15.2 ± 3.8 | (158) 16.2 ± 3.8 | (122) 19.5 ± 4.5 | (167) 22.5 ± 5.4 | (154) 28.7 ± 7.2 | (109) 33.2 ± 7.1 | (52) 36.0 ± 8.0 | |
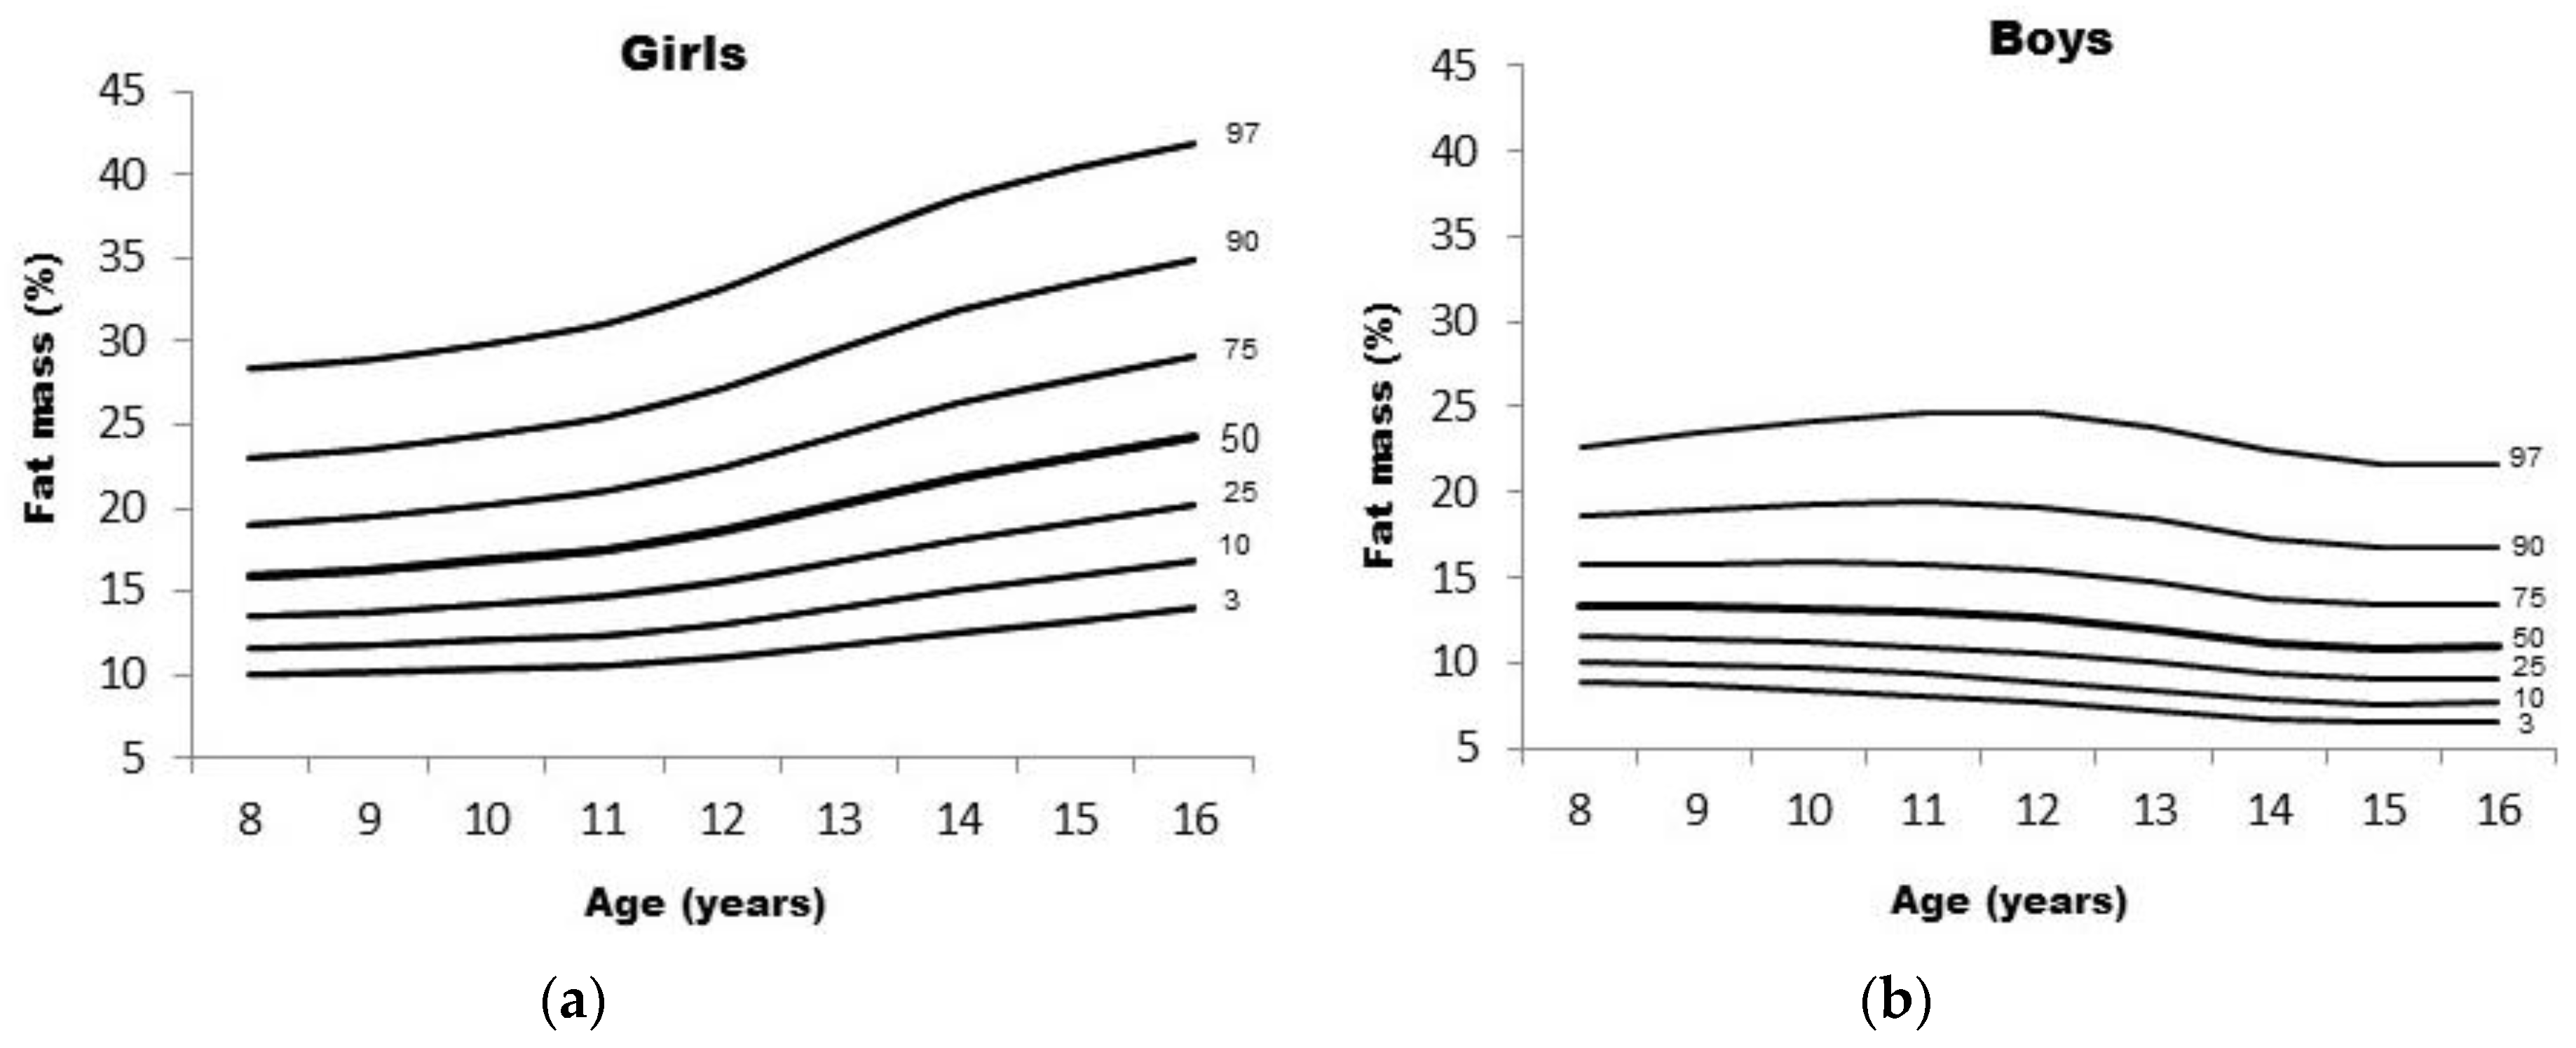
| Girls—Fat Mass (%) | Boys—Fat Mass (%) | |||||||||||||||||
|---|---|---|---|---|---|---|---|---|---|---|---|---|---|---|---|---|---|---|
| Ages | L | S | 3rd | 10th | 25th | 50th | 75th | 90th | 97th | L | S | 3rd | 10th | 25th | 50th | 75th | 90th | 97th |
| 8 | −0.398 | 0.257 | 9.98 | 11.55 | 13.50 | 15.94 | 19.04 | 23.05 | 28.36 | −0.557 | 0.228 | 8.92 | 10.11 | 11.58 | 13.40 | 15.71 | 18.70 | 22.69 |
| 9 | −0.344 | 0.260 | 10.11 | 11.75 | 13.78 | 16.30 | 19.49 | 23.57 | 28.89 | −0.546 | 0.243 | 8.64 | 9.87 | 11.39 | 13.30 | 15.77 | 19.01 | 23.42 |
| 10 | −0.286 | 0.264 | 10.32 | 12.06 | 14.20 | 16.86 | 20.19 | 24.42 | 29.86 | −0.536 | 0.258 | 8.38 | 9.65 | 11.22 | 13.23 | 15.85 | 19.37 | 24.23 |
| 11 | −0.227 | 0.269 | 10.52 | 12.38 | 14.66 | 17.49 | 21.01 | 25.43 | 31.07 | −0.525 | 0.272 | 8.05 | 9.32 | 10.92 | 12.99 | 15.73 | 19.44 | 24.69 |
| 12 | −0.169 | 0.275 | 11.00 | 13.04 | 15.54 | 18.62 | 22.43 | 27.19 | 33.17 | −0.514 | 0.283 | 7.67 | 8.93 | 10.52 | 12.60 | 15.37 | 19.17 | 24.59 |
| 13 | −0.115 | 0.279 | 11.76 | 14.03 | 16.80 | 20.20 | 24.39 | 29.56 | 35.99 | −0.503 | 0.290 | 7.22 | 8.43 | 9.98 | 12.00 | 14.71 | 18.44 | 23.80 |
| 14 | −0.064 | 0.281 | 12.55 | 15.06 | 18.10 | 21.80 | 26.32 | 31.84 | 38.63 | −0.492 | 0.293 | 6.72 | 7.86 | 9.32 | 11.23 | 13.79 | 17.33 | 22.41 |
| 15 | −0.019 | 0.279 | 13.24 | 15.92 | 19.16 | 23.07 | 27.79 | 33.50 | 40.41 | −0.481 | 0.293 | 6.50 | 7.62 | 9.04 | 10.89 | 13.37 | 16.78 | 21.66 |
| 16 | 0.025 | 0.275 | 13.96 | 16.80 | 20.20 | 24.26 | 29.13 | 34.94 | 41.87 | −0.471 | 0.291 | 6.57 | 7.69 | 9.12 | 10.98 | 13.46 | 16.85 | 21.67 |
| Variables | Model 1 | Model 2 | Model 3 | |||
|---|---|---|---|---|---|---|
| Estimate (SE) | p-Value | Estimate (SE) | p-Value | Estimate (SE) | p-Value | |
| Fixed effects | – | – | – | – | – | – |
| Intercept | 16.709 (0.547) | <0.001 | 15.919 (0.649) | <0.001 | 24.719 (1.414) | <0.001 |
| SES | – | – | 3.003 (1.169) | 0.011 | 1.848 (0.815) | 0.024 |
| Age | 0.641 (0.352) | 0.069 | 0.275 (0.421) | 0.515 | −0.333 (0.566) | 0.557 |
| SES | – | – | 1.276 (0.758) | 0.093 | – | – |
| Age2 | 0.199 (0.107) | 0.062 | 0.300 (0.126) | 0.018 | −0.018 (0.149) | 0.511 |
| SES | – | – | −0.349 (0.233) | 0.134 | – | – |
| Age3 | −0.017 (0.009) | 0.053 | −0.023 (0.011) | 0.032 | 0.007 (0.012) | 0.549 |
| SES | – | – | 0.018 (0.019) | 0.366 | – | – |
| Maturity offset | – | – | – | – | 3.265 (0.320) | <0.001 |
| Shuttle-run (s) | – | – | – | – | 0.063 (0.075) | 0.403 |
| SLJump (m) | – | – | – | – | −0.026 (0.080) | 0.002 |
| 12‘ run (m∙m−1) | – | – | – | – | −0.010 (0.005) | 0.040 |
| Hand-grip (kg∙kg−1) | – | – | – | – | −9.308 (1.829) | <0.001 |
| Random effects | – | – | – | – | – | |
| Intercept | 44.085 | <0.001 | 41.826 | <0.001 | 33.067 | <0.001 |
| Residual | 5.572 | – | 5.512 | – | 5.623 | – |
| Deviance | 6227.143 | – | 6201.162 | – | 4209.196 | – |
| Variables | Model 1 | Model 2 | Model 3 | |||
|---|---|---|---|---|---|---|
| Estimate (SE) | p-Value | Estimate (SE) | p-Value | Estimate (SE) | p-Value | |
| Fixed effects | – | – | – | – | – | – |
| Intercept | 14.531 (0.419) | <0.001 | 13.234 (0.379) | <0.001 | 15.860 (1.372) | <0.001 |
| SES | – | – | 6.145 (1.176) | <0.001 | 4.572 (0.771) | <0.001 |
| Age | 1.468 (0.364) | <0.001 | 1.209 (0.335) | <0.001 | 1.536 (0.606) | 0.012 |
| SES | – | – | 1.423 (1.095) | 0.192 | –- | – |
| Age2 | −0.481 (0.118) | <0.001 | −0.390 (0.106) | <0.001 | −0.448 (0.158) | 0.005 |
| SES | – | – | −0.576 (0.390) | 0.141 | – | – |
| Age3 | 0.031 (0.010) | 0.003 | 0.025 (0.009) | 0.006 | 0.025 (0.013) | 0.050 |
| SES | – | – | 0.043 (0.035) | 0.219 | – | – |
| Maturity offset | – | – | – | – | 1.089 (0.260) | <0.001 |
| Shuttle-run (s) | – | – | – | – | 0.108 (0.071) | 0.126 |
| SLJump (m) | – | – | – | – | −0.225 (0.007) | <0.001 |
| 12‘ run (m∙m−1) | – | – | – | – | −0.007 (0.003) | 0.033 |
| Hand-grip (kg∙kg−1) | – | – | – | – | −5.974 (0.185) | 0.001 |
| Random effects | – | – | – | – | – | – |
| Intercept | 28.947 | <0.001 | 24.065 | <0.001 | 22.680 | <0.001 |
| Residual | 4.113 | – | 4.032 | – | 3.958 | – |
| Deviance | 6074.389 | – | 5992.822 | – | 4158.121 | – |
4. Discussion
5. Conclusions
Acknowledgments
Author Contributions
Conflicts of Interest
References
- WHO Expert Committee. Physical Status: The Use and Interpretation of Anthropometry; World Health Organization: Geneva, Switzerland, 1995; p. 452. [Google Scholar]
- De Onis, M. Growth curves for school-age children and adolescents. Indian Pediatr. 2009, 46, 463–465. [Google Scholar] [PubMed]
- Hermanussen, M.; Stec, K.; Abmann, C.; Meigen, C.; van Buuren, S. Synthetic growth reference charts. Am. J. Hum. Biol. 2015, 28, 98–111. [Google Scholar] [CrossRef] [PubMed]
- Beunen, G.; Malina, R. Growth and physical performance relative to the timing of the adolescent spurt. Exerc. Sport Sci. Rev. 1988, 16, 503–540. [Google Scholar] [CrossRef] [PubMed]
- Dietz, W. Critical periods in childhood for the development of obesity. Am. J. Clin. Nutr. 1994, 59, 955–959. [Google Scholar] [PubMed]
- Silva, S.P.; Maia, J.; Claessens, A.; Beunen, G.; Pan, H. Growth references for brazilian children and adolescents: Healthy growth in cariri study. Ann. Hum. Biol. 2012, 39, 11–18. [Google Scholar] [CrossRef] [PubMed]
- Lobstein, T.; Baur, L.; Uauy, R. Obesity in children and young people: A crisis in public health. Obes. Rev. 2004, 5, S4–S85. [Google Scholar] [CrossRef] [PubMed]
- Molnar, D.; Livingstone, B. Physical activity in relation to overweight and obesity in children and adolescents. Eur. J. Pediatr. 2000, 159, S45–S55. [Google Scholar] [CrossRef] [PubMed]
- Wong, S.L.; Katzmarzyk, P.; Nichaman, M.Z.; Church, T.S.; Blair, S.N.; Ross, R. Cardiorespiratory fitness is associated with lower abdominal fat independent of body mass index. Med. Sci. Sports Exerc. 2004, 36, 286–291. [Google Scholar] [CrossRef] [PubMed]
- Wells, J.; Fewtrell, M. Measuring body composition. Arch. Dis. Child. 2006, 91, 612–617. [Google Scholar] [CrossRef] [PubMed]
- Hoffman, D.J.; Toro-Ramos, T.; Sawaya, A.L.; Roberts, S.B.; Rondo, P. Estimating total body fat using a skinfold prediction equation in brazilian children. Ann. Hum. Biol. 2012, 39, 156–160. [Google Scholar] [CrossRef] [PubMed]
- Olds, T. One million skinfolds: Secular trends in the fatness of young people 1951–2004. Eur. J. Clin. Nutr. 2009, 63, 934–946. [Google Scholar] [CrossRef] [PubMed]
- Laurson, K.; Eisenmann, J.; Welk, G. Body fat percentile curves for U.S. Children and adolescents. Am. J. Prev. Med. 2011, 41, S87–S92. [Google Scholar] [CrossRef] [PubMed]
- Weber, D.; Moore, R.; Leonard, M.; Zemel, B. Fat and lean bmi reference curves in children and adolescents and their utility in identifying excess adiposity compared with BMI and percentage body fat. Am. J. Clin. Nutr. 2013, 98, 49–56. [Google Scholar] [CrossRef] [PubMed]
- Plachta-Danielzik, S.; Gehrke, M.I.; Kehden, B.; Kromeyer-Hauschild, K.; Grillenberger, M.; Willhöft, C.; Bosy-Westphal, A.; Müller, M.J. Body fat percentiles for German children and adolescents. Obes. Facts 2012, 5, 77–90. [Google Scholar] [CrossRef] [PubMed]
- Cicek, B.; Ozturk, A.; Unalan, D.; Bayat, M.; Mazicioglu, M.; Kurtoglu, S. Four-site skinfolds and body fat percentage references in 6-to-17-year old Turkish children and adolescents. J. Pak. Med. Assoc. 2014, 64, 1154–1161. [Google Scholar] [PubMed]
- Tanner, J. Introduction: Growth in height as a mirror of the standard of living. In Stature, Living Standards, and Economic Development; Komlos, J., Ed.; The University of Chicago Press: Chicago, IL, USA; 1994; pp. 1–6. [Google Scholar]
- Malina, R.; Bouchard, C.; Bar-Or, O. Growth, Maturation and Physical Activity, 4th ed.; Human Kinetics Books: Champaign, IL, USA, 2004. [Google Scholar]
- Shrewsbury, V.; Wardle, J. Socioeconomic status and adiposity in childhood: A systematic review of cross-sectional studies 1990–2005. Obesity 2008, 16, 275–284. [Google Scholar] [CrossRef] [PubMed]
- Steele, R.M.; Brage, S.; Corder, K.; Wareham, N.J.; Ekelund, U. Physical activity, cardiorespiratory fitness, and the metabolic syndrome in youth. J. Appl. Physiol. 2008, 105, 342–351. [Google Scholar] [CrossRef] [PubMed]
- Malina, R. Top 10 research questions related to growth and maturation of relevance to physical activity, performance, and fitness. Res. Q. Exerc. Sport 2014, 85, 153–173. [Google Scholar] [CrossRef] [PubMed]
- Chaput, J.; Perusse, L.; Despres, J.; Tremblay, A.; Bouchard, C. Findings from the quebec family study on the etiology of obesity: Genetics and environmental highlights. Curr. Obes. Rep. 2014, 3, 54–66. [Google Scholar] [CrossRef] [PubMed]
- Huang, Y.; Malina, R. Body mass index and individual physical fitness tests in taiwanese youth aged 9–18 years. Int. J. Pediatr. Obes. 2010, 5, 404–411. [Google Scholar] [CrossRef] [PubMed]
- Spruijt, M. Etiology, treatment and prevention of obesity in childhood and adolescence: A decade in review. J. Res. Adolesc. 2012, 21, 129–152. [Google Scholar] [CrossRef] [PubMed]
- Gulias-Gonzáles, R.; Martinez-Vizcaíno, V.; García-Pietro, J.; Díez-Fernandez, A.; Olivas-Bravo, A.; Sánchez-Lopez, M. Excess of weight, but not underweight, is associated with poor physical fitness in children and adolescents from Castilla-La Mancha, Spain. Eur. J. Pediatr. 2014, 173, 727–735. [Google Scholar] [CrossRef] [PubMed]
- Martins, D.; Maia, A.; Seabra, A.; Garganta, R.; Katzmarzyk, P.; Beunen, G. Correlates of change in BMI of children from Azores islands. Int. J. Obes. 2010, 34, 1487–1493. [Google Scholar] [CrossRef] [PubMed]
- De Souza, M.; Eisenmann, J.; Santos, D.; de Chaves, R.; de Moraes Forjaz, C.; Maia, J. Modeling the dynamics of BMI changes during adolescence. The oporto growth, health and performance study. Int. J. Obes. 2015, 39, 1063–1069. [Google Scholar] [CrossRef] [PubMed]
- Byrd-Williams, C.; Shaibi, G.; Sun, P.; Lane, C.; Ventura, E.; Davis, J.; Kelly, L.; Goran, M. Cardiorespiratory fitness predicts changes in adiposity in overweight Hispanic boys. Obesity 2008, 16, 1072–1077. [Google Scholar] [CrossRef] [PubMed]
- Prentice, A.M.; Jebb, S.A. Beyond body mass index. Obes. Rev. 2001, 2, 141–147. [Google Scholar] [CrossRef] [PubMed]
- Silva, S.P.; Maia, J.A.; Beunen, G. Crescer Com Saúde no Cariri. O Estudo do Crescimento Físico e Desempenho Motor de Crianças e Jovens Caririenses; RDS Editora: Crato, Ceará, 2014; p. 160. [Google Scholar]
- Claessens, A.; Beunen, G.; Malina, R. Antropometry, physique, body composition, and maturity. In Paediatric Exercise Science and Medicine, 2nd ed.; Armstrong, N., Mechelen, W.V., Eds.; Oxford University Press: New York, NY, USA, 2008. [Google Scholar]
- Slaughter, M.H.; Lohman, T.G.; Boileau, R.A.; Horswill, C.A.; Stillman, R.J.; van Loan, M.D.; Bemben, D.A. Skinfold equations for estimation of body fatness in children and youth. Hum. Biol. 1988, 60, 709–726. [Google Scholar] [PubMed]
- Hoffman, D.; Sawaya, A.; Verreschi, L.; Tucker, K.; Roberts, S. Why are nutritionally stunted children at increased risk of obesity? Studies of metabolic rate and fat oxidation in shantytown children from São Paulo, Brazil. Am. J. Clin. Nutr. 2000, 72, 702–707. [Google Scholar] [PubMed]
- Hussain, Z.; Jafar, T.; Zaman, M.U.; Parveen, R.; Saeed, F. Correlations of skin fold thickness and validation of prediction equations using DEXA as the gold standard for estimation of body fat composition in Pakistani children. BMJ Open 2014, 4. [Google Scholar] [CrossRef] [PubMed]
- Wells, J.; Hallal, P.; Reichert, F.; Menezes, A.; Araújo, C.; Victora, C. Sleep patterns and television viewing in relation to obesity and blood pressure: Evidence from an adolescent Brazilian birth cohort. Int. J. Obes. 2008, 32, 1042–1049. [Google Scholar] [CrossRef] [PubMed]
- Silva, D.R.; Ribeiro, A.S.; Pavao, F.H.; Ronque, E.R.; Avelar, A.; Silva, A.M.; Cyrino, E.S. Validity of the methods to assess body fat in children and adolescents using multi-compartment models as the reference method: A systematic review. Rev. Assoc. Med. Bras. 2013, 59, 475–486. [Google Scholar] [CrossRef]
- Mirwald, R.L.; Baxter-Jones, A.D.; Bailey, D.A.; Beunen, G.P. An assessment of maturity from anthropometric measurements. Med. Sci. Sports Exerc. 2002, 34, 689–694. [Google Scholar] [CrossRef]
- AAHPERD. Health Related Physical Fitness Manual; American Alliance for Health, Physical Educations, Recreation and Dance: Washington, DC, USA, 1980. [Google Scholar]
- EUROFIT. Handbook for the European Test of Physical Fitness; Council of European Committee for Development of Sport: Rome, Italy, 1988; p. 72. [Google Scholar]
- Cole, T.J.; Bellizzi, M.C.; Flegal, K.M.; Dietz, W.H. Establishing a standard definition for child overweight and obesity worldwide: International survey. BMJ 2000, 320, 1240–1243. [Google Scholar] [CrossRef] [PubMed]
- Cole, T.J.; Freeman, J.V.; Preece, M.A. British 1990 growth reference centiles for weight, height, body mass index and head circumference fitted by maximum penalized likelihood. Stat. Med. 1998, 17, 407–429. [Google Scholar] [CrossRef]
- Pan, H.; Cole, T.J. A comparison of goodness of fit tests for age-related reference ranges. Stat. Med. 2004, 1749–1765. [Google Scholar] [CrossRef] [PubMed]
- Royston, P.; Wright, E.M. Goodness-of-fit statistics for age-specific reference intervals. Stat. Med. 2000, 2943–2962. [Google Scholar] [CrossRef]
- Pan, H.; Jiang, Y.; Jing, X.; Fu, S.; Jiang, Y.; Lin, Z.; Sheng, Z.; Cole, T. Child body mass index in four cities of East China compared to Western references. Ann. Hum. Biol. 2009, 36, 98–109. [Google Scholar] [CrossRef] [PubMed]
- Pan, H.; Cole, T. User’s Guide to Lmschartmaker Pro; Medical Research Council: London, UK; pp. 1997–2005.
- Raudenbush, S.; Bryk, A.; Cheong, Y.; Congdon, R., Jr.; du Toit, M. HLM 7. Hierarchical Linear and Nonlinear Modeling; Scientific Software International: Lincolnwood, IL, USA, 2011. [Google Scholar]
- Raudenbush, S. Hierarchical linear models to study the effects of social context on development. In The Analysis of Change; Gottman, J., Ed.; Lawrence Erlbaum Associates, Publishers: Mahwah, NJ, USA, 1995; pp. 165–202. [Google Scholar]
- Hedeker, D.; Gibbons, R. Longitudinal Data Analysis; John Wiley & Sons: Hoboken, NJ, USA, 2006. [Google Scholar]
- McCarthy, H.; Cole, T.; Fry, T.; Jebb, S.; Prentice, A. Body fat reference curves for children. Int. J. Obes. 2006, 30, 598–602. [Google Scholar] [CrossRef] [PubMed]
- Flegal, K.M.; Ogden, C.L. Childhood obesity: Are we all speaking the same language? Adv. Nutr. 2011, 2, 159S–166S. [Google Scholar] [CrossRef] [PubMed]
- Deforche, B.; Lefevre, J.; de Bourdeaudhuij, I.; Al, E. Physical fitness and physical activity in obese and nonobese Flemish youth. Obes. Res. 2003, 11, 434–441. [Google Scholar] [CrossRef] [PubMed]
- Kimm, S.; Glynn, N.; Obarzanek, E.; Kriska, A.; Daniels, S.; Barton, B.; Liu, K. Relation between the changes in physical activity and body-mass index during adolescence: A multicentre longitudinal study. Lancet 2005, 366, 301–307. [Google Scholar] [CrossRef]
- McLaren, L. Socioeconomic status and obesity. Epidemiol. Rev. 2007, 29, 29–48. [Google Scholar] [CrossRef] [PubMed]
- Guo, S.S.; Chumlea, W.C.; Roche, A.F.; Siervogel, R.M. Age-and maturity-related changes in body composition during adolescence into adulthood: The fels longitudinal study. Int. J. Obes. Relat. Metab. Disord. 1997, 21, 1167–1175. [Google Scholar] [CrossRef] [PubMed]
- Forbes, G.B. Human Body Composition. Growth, Aging, Nutrition, and Activity; Springer-Verlag: New York, NY, USA, 1987; p. 350. [Google Scholar]
- Rogol, A.D.; Roemmich, J.N.; Clark, P.A. Growth at puberty. J. Adolesc. Health 2002, 31, 192–200. [Google Scholar] [CrossRef]
- Malina, R. Variation in body composition associated with sex and ethnicity. In Human Body Composition; Heymsfield, S., Lohman, T., Wang, Z., Going, S., Eds.; Human Kinetics: Champaign, IL, USA, 2005; pp. 271–298. [Google Scholar]
- Lohman, T.; Roche, A.; Martorell, R. Anthropometric Standardization Reference Manual; Human Kinetics Books: Champaign, IL, USA, 1988. [Google Scholar]
© 2016 by the authors; licensee MDPI, Basel, Switzerland. This article is an open access article distributed under the terms and conditions of the Creative Commons by Attribution (CC-BY) license (http://creativecommons.org/licenses/by/4.0/).
Share and Cite
Silva, S.; Baxter-Jones, A.; Maia, J. Fat Mass Centile Charts for Brazilian Children and Adolescents and the Identification of the Roles of Socioeconomic Status and Physical Fitness on Fat Mass Development. Int. J. Environ. Res. Public Health 2016, 13, 151. https://doi.org/10.3390/ijerph13020151
Silva S, Baxter-Jones A, Maia J. Fat Mass Centile Charts for Brazilian Children and Adolescents and the Identification of the Roles of Socioeconomic Status and Physical Fitness on Fat Mass Development. International Journal of Environmental Research and Public Health. 2016; 13(2):151. https://doi.org/10.3390/ijerph13020151
Chicago/Turabian StyleSilva, Simonete, Adam Baxter-Jones, and José Maia. 2016. "Fat Mass Centile Charts for Brazilian Children and Adolescents and the Identification of the Roles of Socioeconomic Status and Physical Fitness on Fat Mass Development" International Journal of Environmental Research and Public Health 13, no. 2: 151. https://doi.org/10.3390/ijerph13020151
APA StyleSilva, S., Baxter-Jones, A., & Maia, J. (2016). Fat Mass Centile Charts for Brazilian Children and Adolescents and the Identification of the Roles of Socioeconomic Status and Physical Fitness on Fat Mass Development. International Journal of Environmental Research and Public Health, 13(2), 151. https://doi.org/10.3390/ijerph13020151