2. Results and Discussion
Compound
1 was isolated as a white powder. The molecular formula was deduced as C
16H
18O
5 based on the (+)-HRESIMS ion at
m/
z 291.1224 [M+H]
+ (calcd for C
16H
19O
5, 291.1227), indicating eight degrees of unsaturation. The
1H,
13C NMR (
Table 1), DEPT and HSQC spectra revealed the presence of two carbonyl carbons (
δC 212.3, C-4′; 171.4, C-1), six aromatic quaternary carbons (
δC 161.7, C-5; 158.7, C-7; 148.8, C-3a; 117.0, C-6; 116.3, C-4; 102.9, C-7a), one oxygen-bearing methine (
δC/H 88.0/5.13, C-2′), one methine (
δC/H 52.4/3.08, C-3′), one methylene group (
δC/H 32.3/3.58, 3.21, C-1′), an oxygenated aliphatic methylene group (
δC/H 70.7/5.22, C-3), one aromatic methyl group (
δC/H 11.0/2.06, C-8), one aromatic methoxyl group (
δC/H 59.7/4.00, 5-OCH
3), and two aliphatic methyl groups (
δC/H 29.8/2.27 C-5′; 12.1/1.16, C-6′). These data showed a close similarity to those reported for 2-(4-methoxy-5-methyl-8-oxo-2,3,6,8-tetrahydrobenzo [1,2-b:5,6-c′] difuran-2-yl) propanoic acid isolated from
Penicillium sp. SCSIO sof101 [
12], and then
1 was inferred to be an analog. Detailed analysis of 1D NMR (
Table 1), HSQC, HMBC and
1H-
1H COSY spectra (
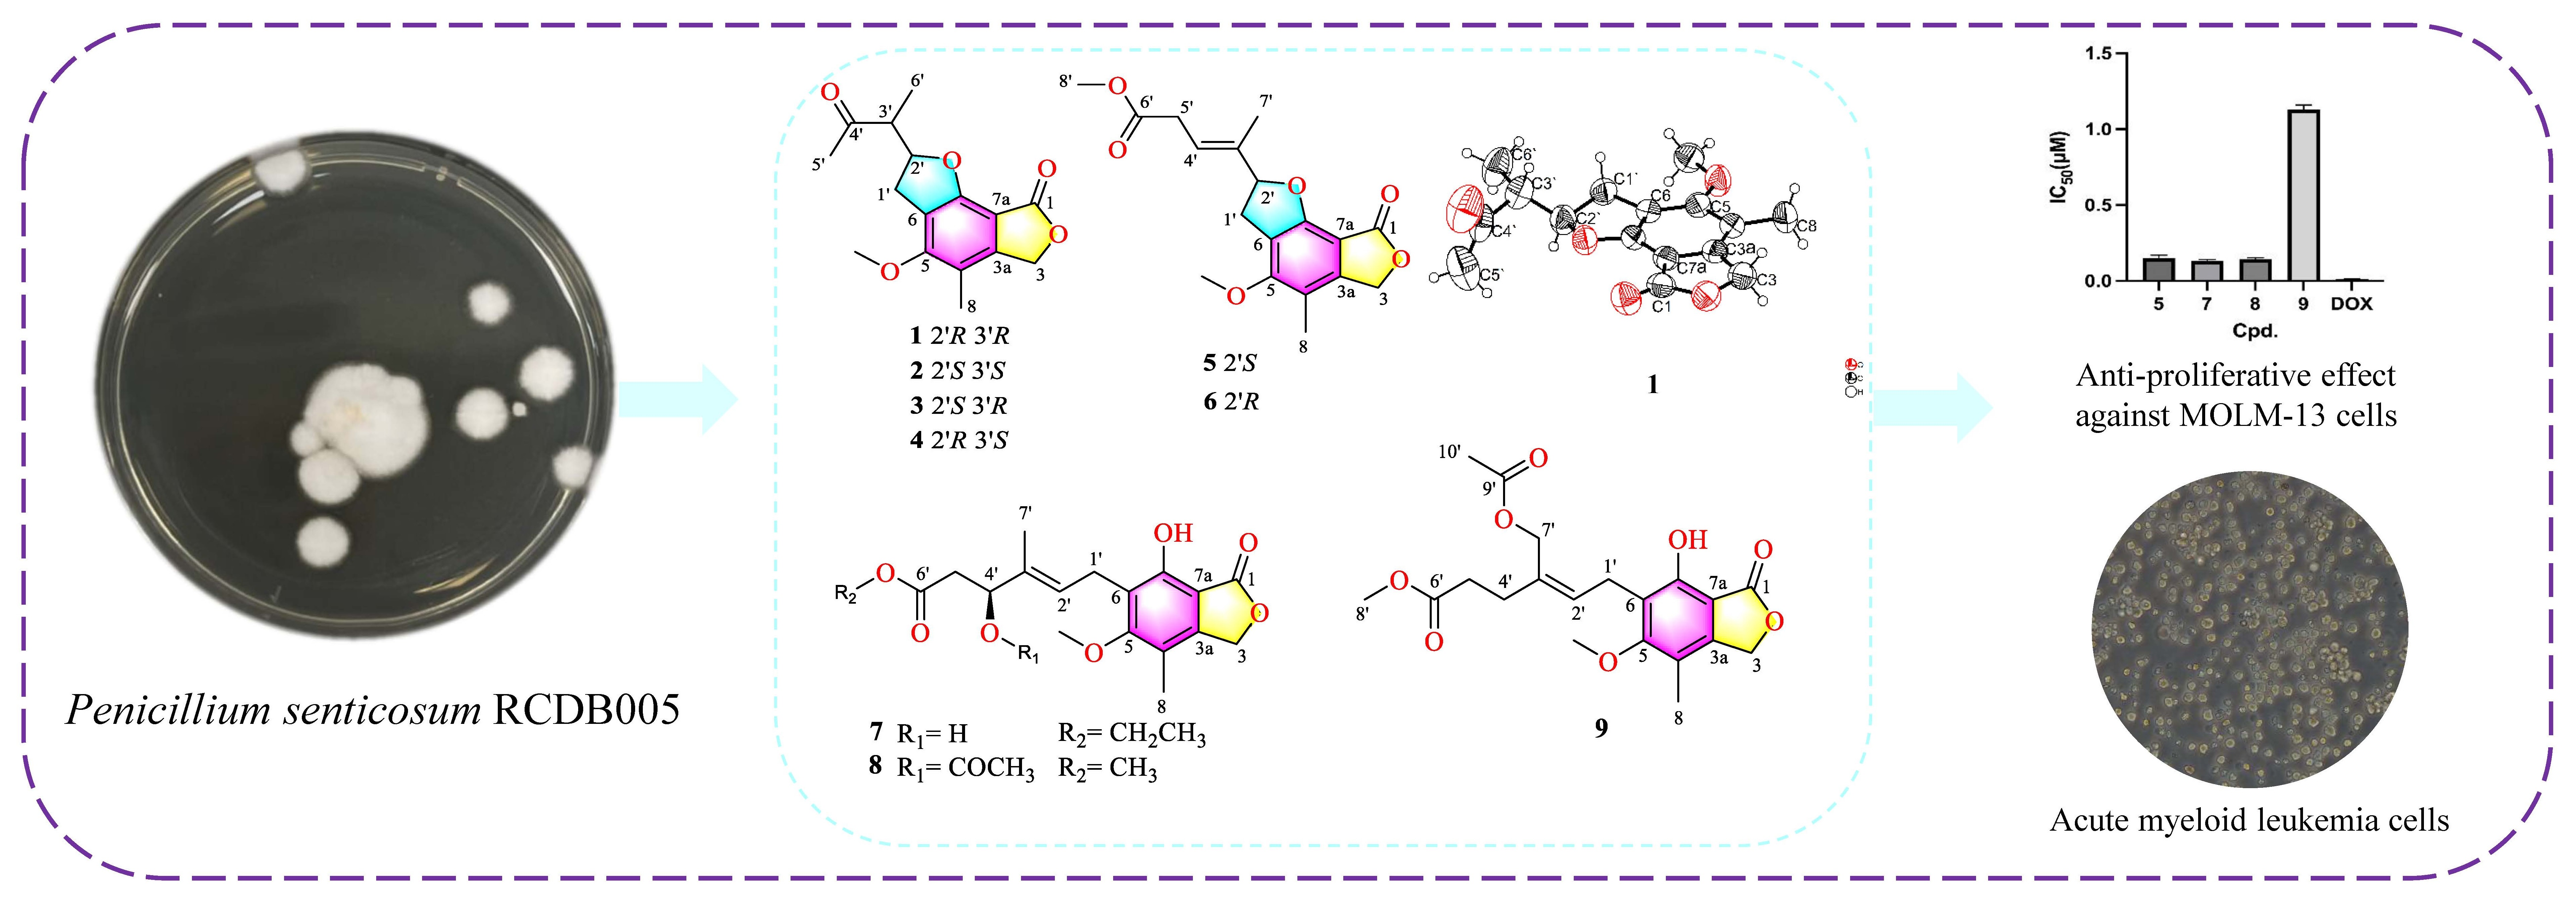
Figure 1) revealed that the major difference was the shift in the 4′-carbonyl carbon to the low field, suggesting that a methyl substitution may occur at the 4′-hydroxyl group, which was confirmed by the HMBC correlations from H-5′ to C-4′ and C-3′, from H-6′ to C-4′ and C-2′, from H-1′ to C-6 and C-7, from 5-OCH
3 to C-5, from H-8 to C-3a, C-4, and C-5, from H-3 to C-1, C-3a, C-4 and C-7a. In addition, COSY correlations of H
2-1′/H-2′/H-3′/H-6′ were observed, displaying the linkage between the carbons directly connected to the protons. Thus, the planar structure of
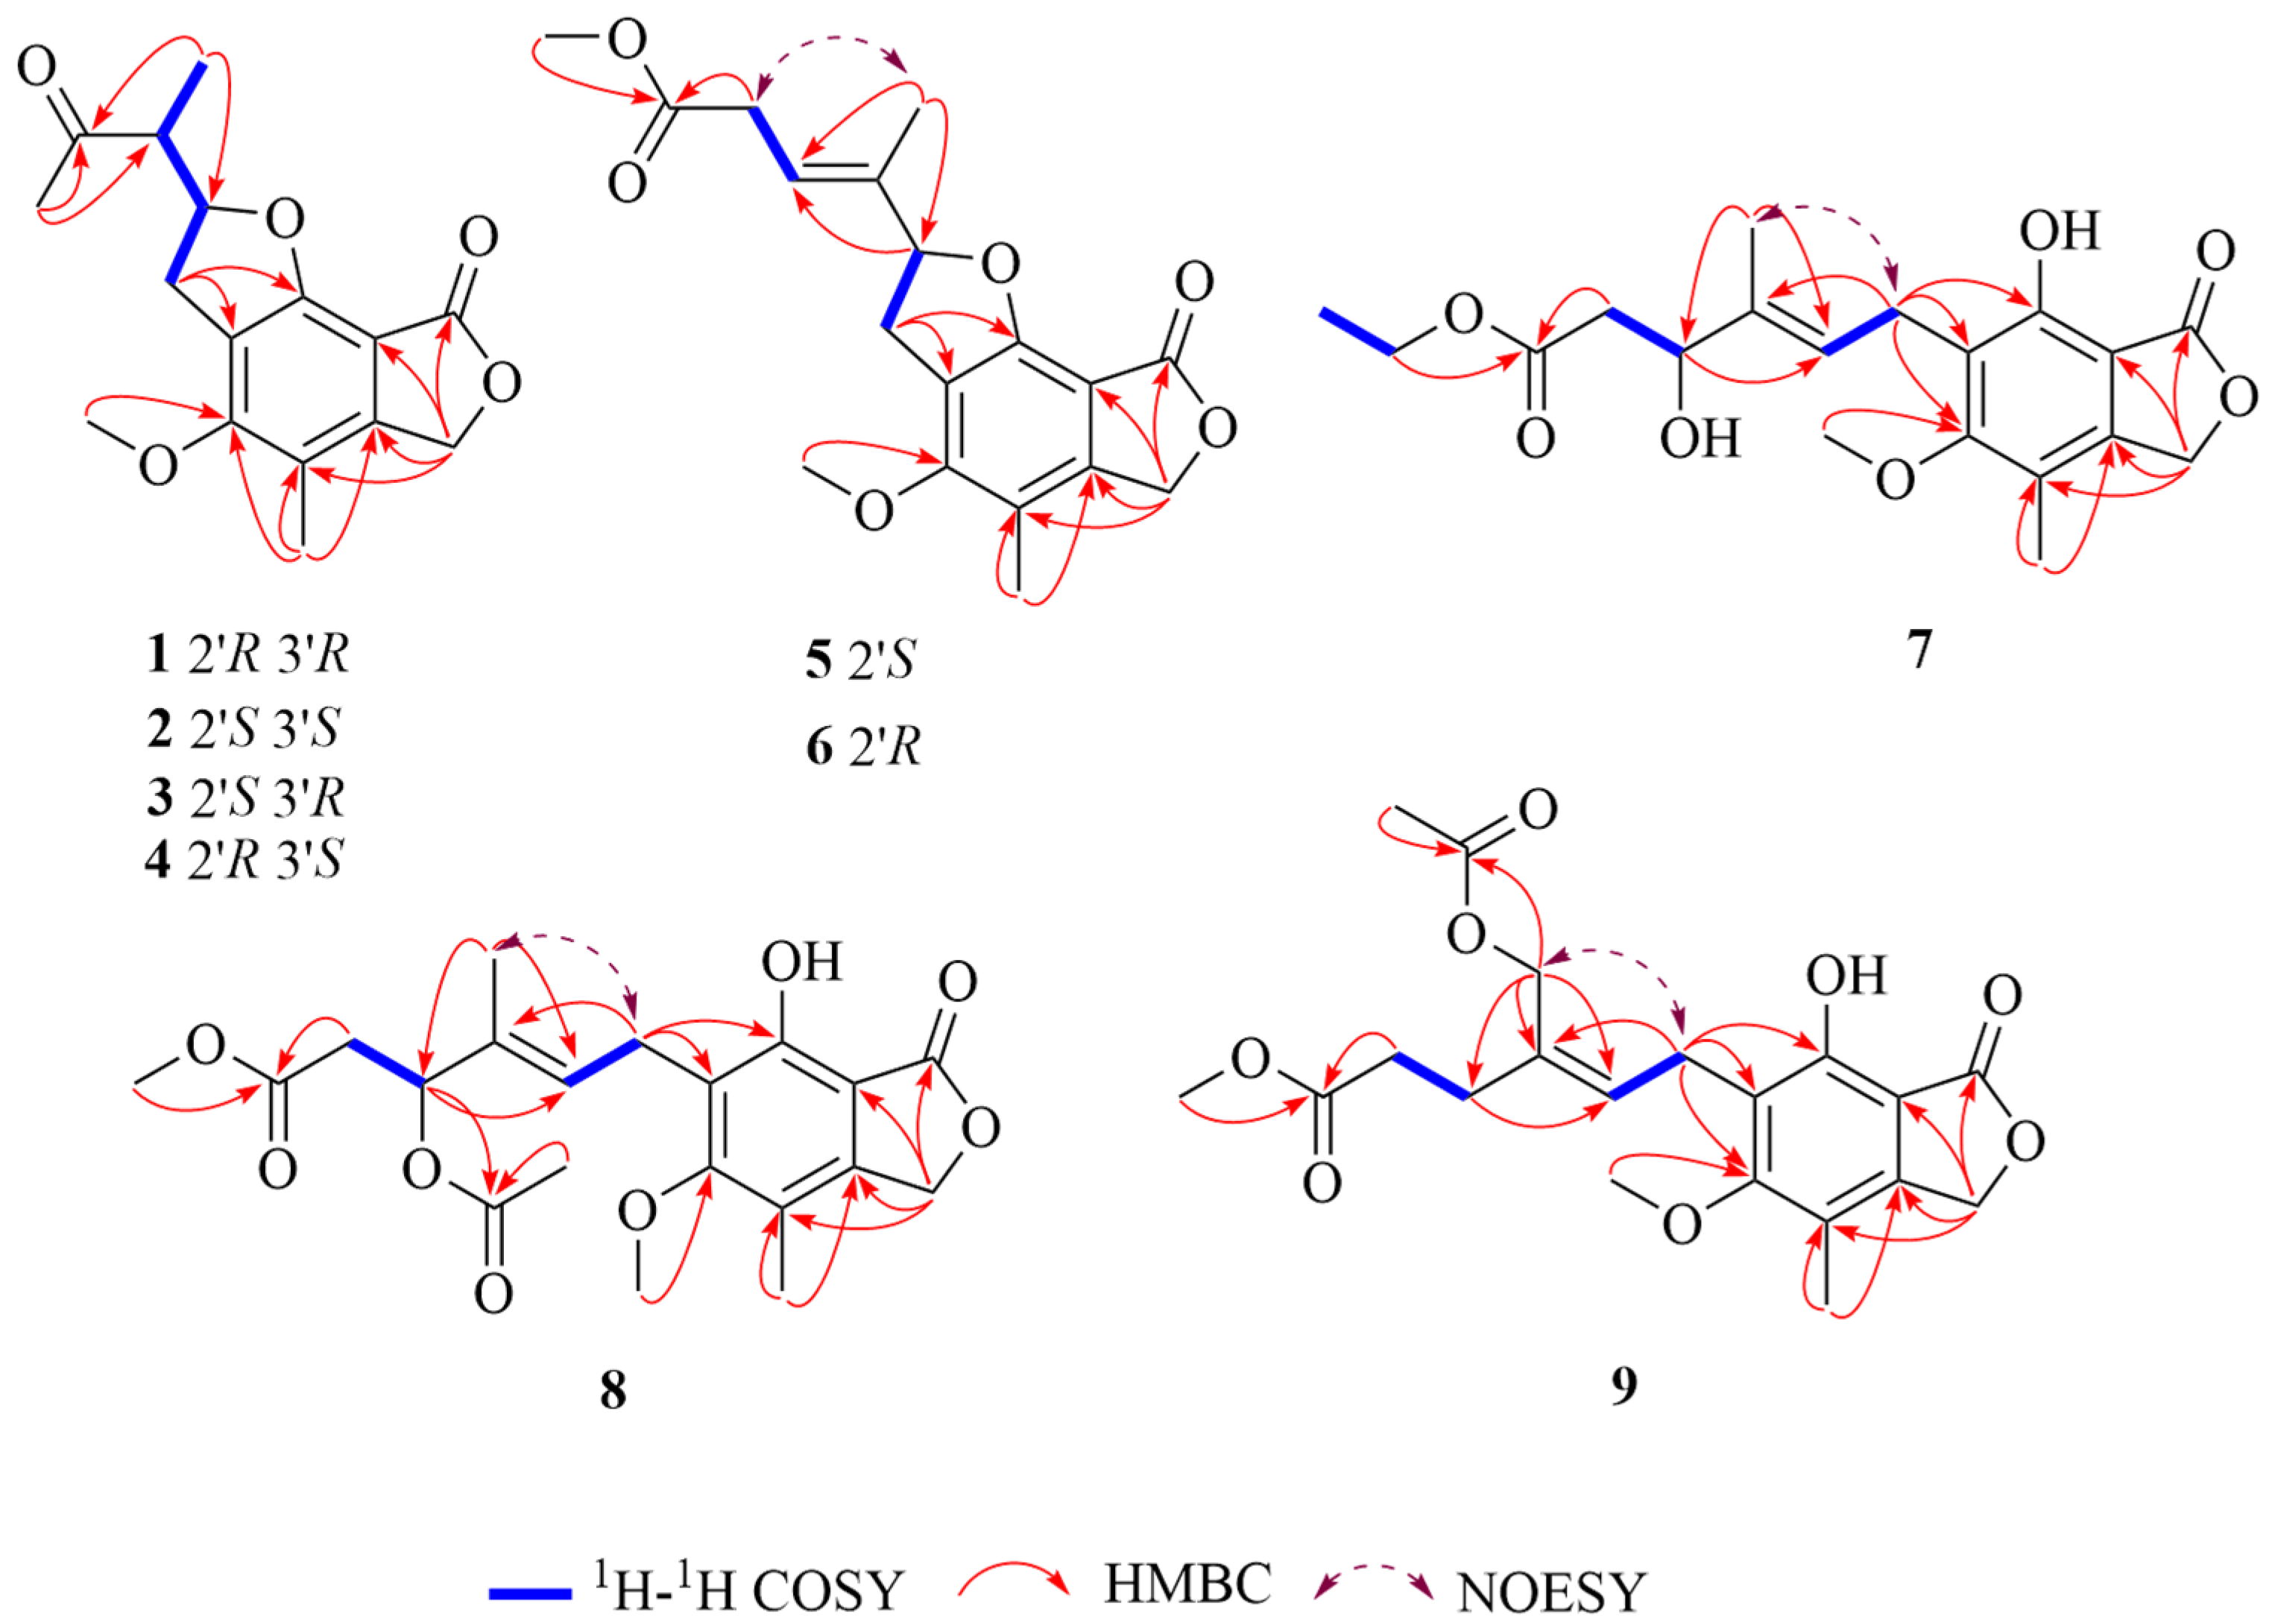
1 was established as shown (
Figure 2) and named penicacid O.
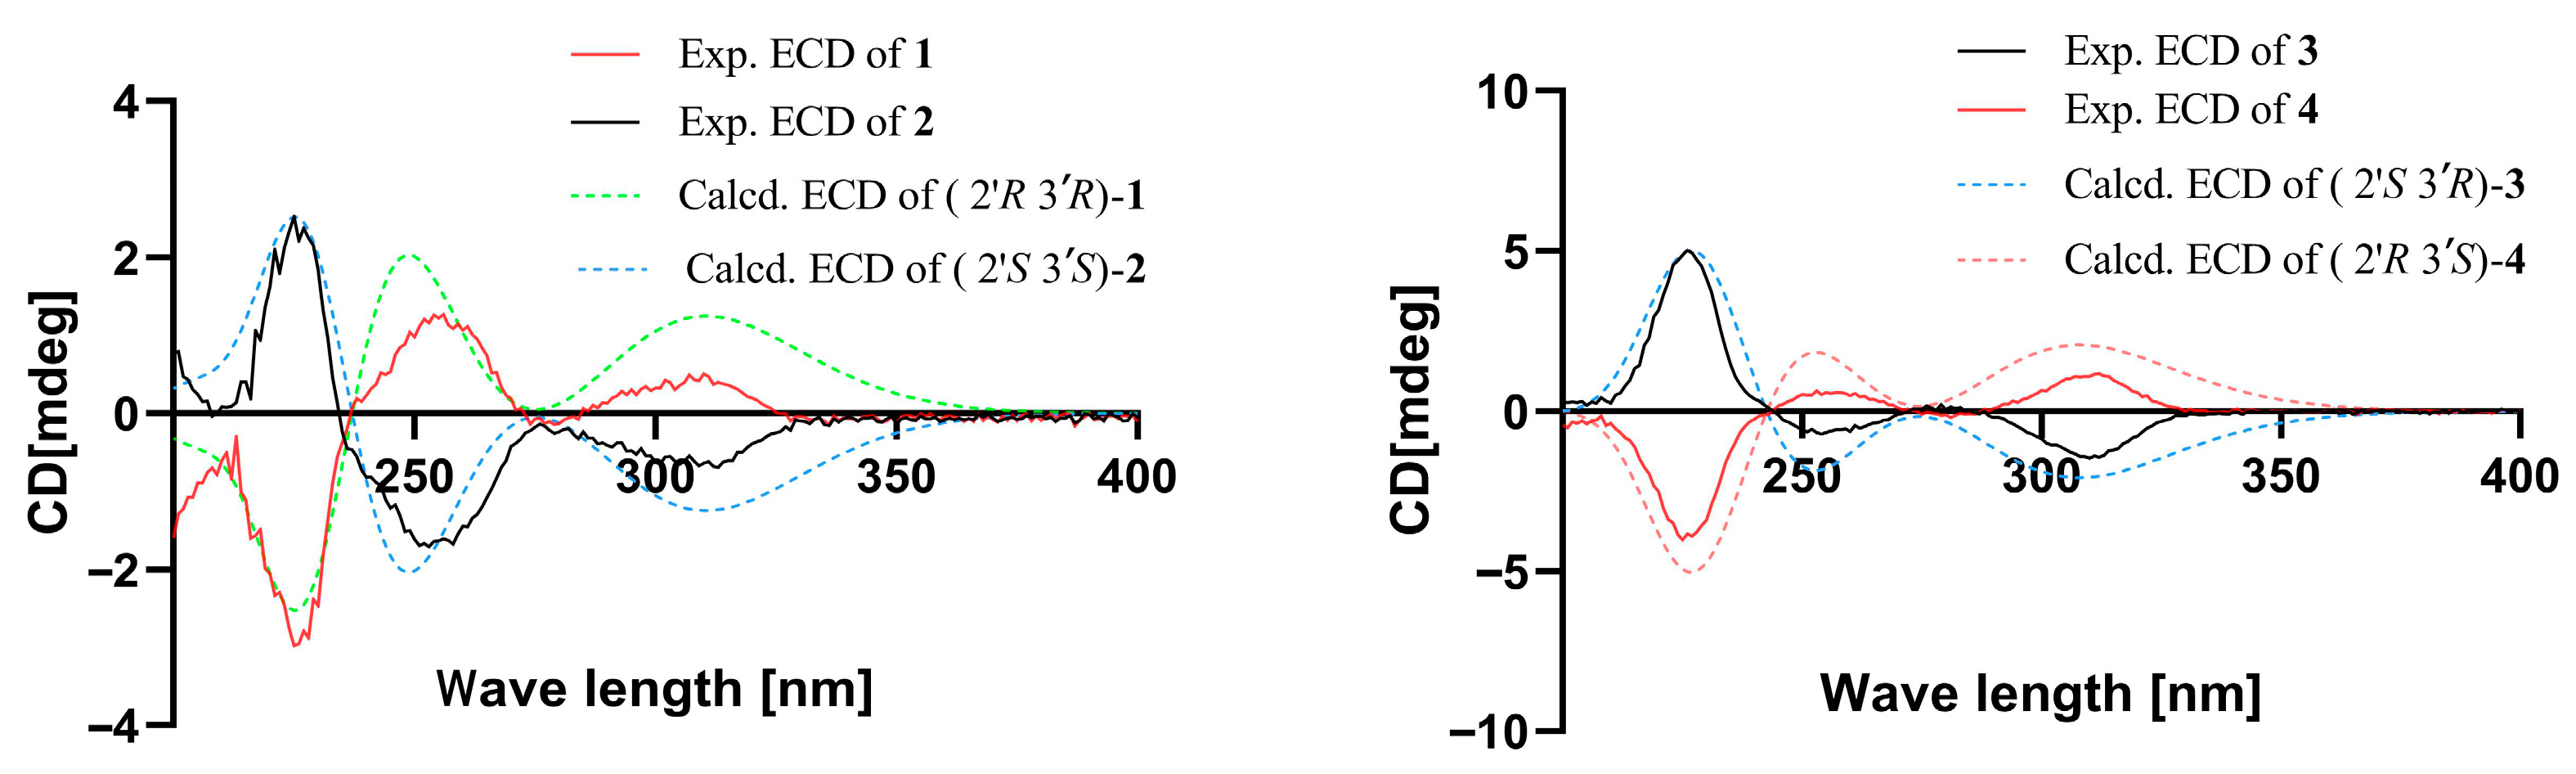
The theoretical ECD curve of
1 was then calculated and compared with the experimental ECD curve. The experimental ECD curve of
1 showed a higher similarity to the calculated ECD curve of (2′
R, 3′
R)-
1 (
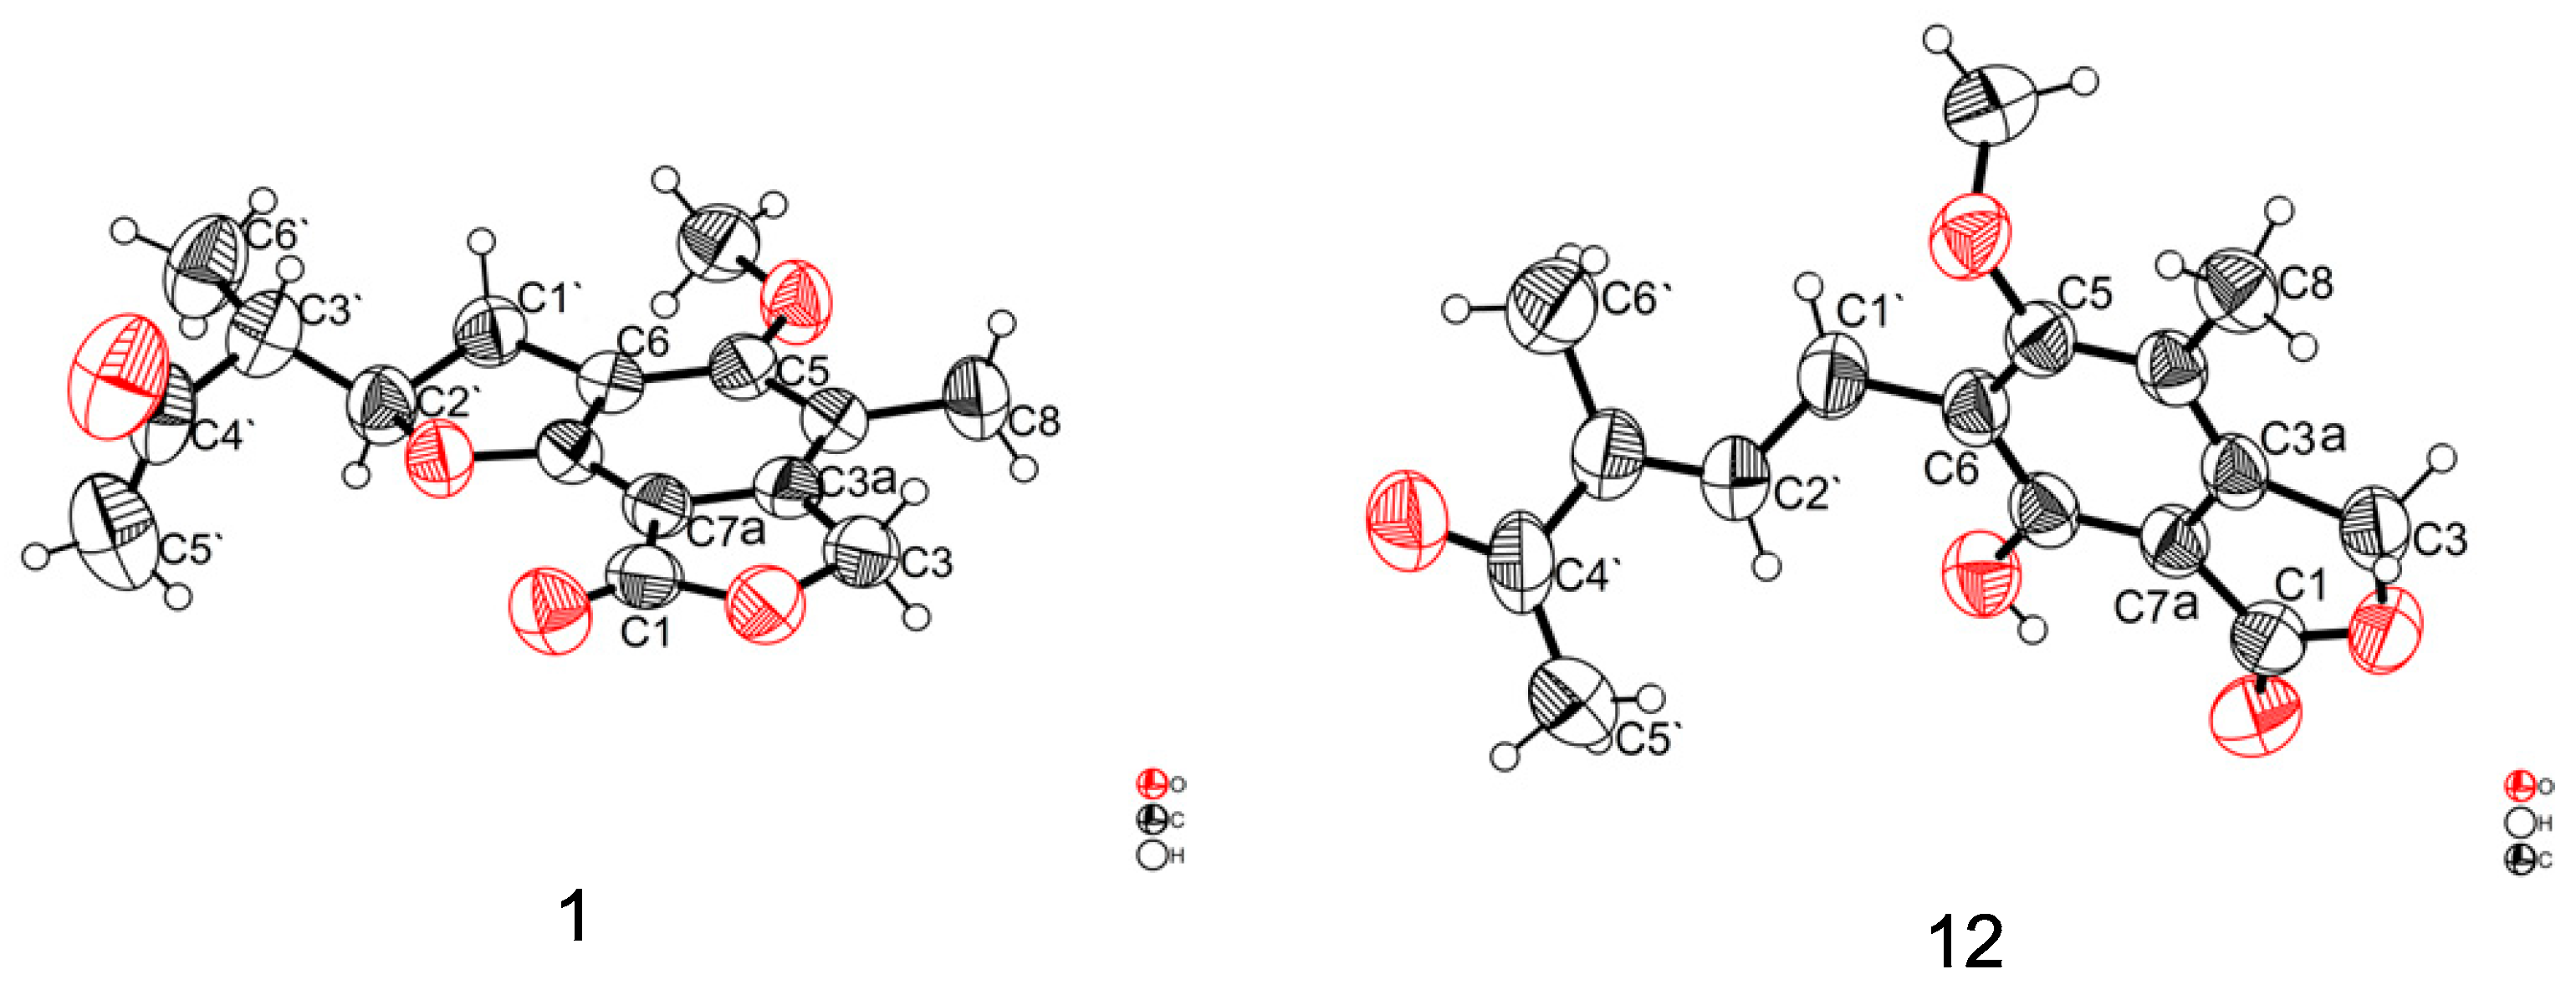
Figure 3). Finally, the absolute configuration of
1 was confirmed as 2′
R, 3′
R by X-ray crystallographic analysis (
Figure 4), and the compound was named penicacid O (
Figure 2).
Compound
2 was isolated as a white powder with the same molecular formula as that of
1 according to (+)-HRESIMS data, implying eight degrees of unsaturation. Their
1H,
13C NMR (
Table 1) and DEPT data were quite similar, suggesting
2 may be an enantiomer of
1. According to the 1D and 2D NMR data (
Table 1 and
Figure 1), the planar structure of
2 was established, and the compound was designated as penicacid P.
The theoretical ECD curve of
2 was then calculated and compared with the experimental ECD curve. The experimental ECD curve of
2 showed a higher similarity to the calculated ECD curve of (2′
S, 3′
S)-
2, and the experimental ECD curve of
2 was completely opposite to the experimental ECD curve for
1 (
Figure 3), suggesting that
2 was an enantiomer of
1, which was further supported by the NOESY correlation between H-1′ and H-6′ in both
1 and
2 (
Figure 1). Accordingly, the absolute configuration of
2 was identified as 2′
S, 3′
S (
Figure 2).
Compound
3 was isolated as a white powder with the same molecular formula as that of
1 according to (+)-HRESIMS data, implying eight degrees of unsaturation. The
1H,
13C NMR (
Table 1) and DEPT data of
3 closely resembled those of
1. The major difference was that the chemical shift in methyl group (
δC/H 12.7/1.28, recorded in CD
3OD) attached to C-6′ in
3 was downfield shifted with respect to that in
1 (
δC/H 12.1/1.16, recorded in CD
3OD), suggesting
3 was a diastereomer at C-2′ or C-3′ of
4. According to the 1D and 2D NMR data (
Table 1 and
Figure 1), the planar structure of
3 was established, and the compound was designated as penicacid Q.
The theoretical ECD curve of
3 was then calculated and compared with the experimental ECD curve. The experimental ECD curve of
3 showed a higher similarity to the calculated ECD curve of (2′
S, 3′
R)-
3 (
Figure 3). Accordingly, the absolute configuration of
3 was identified as 2′
S, 3′
R (
Figure 2).
Compound
4 was isolated as a white powder with the same molecular formula as that of
1 according to (+)-HRESIMS data, implying eight degrees of unsaturation. Their
1H,
13C NMR (
Table 1) and DEPT data were quite similar, suggesting
4 may be an enantiomer of
3. According to the 1D and 2D NMR data (
Table 1 and
Figure 1), the planar structure of
4 was established, and the compound was designated as penicacid R.
The theoretical ECD curve of
4 was then calculated and compared with the experimental ECD curve. The experimental ECD curve of
4 showed a higher similarity to the calculated ECD curve of (2′
R, 3′
S)-
4, and the experimental ECD curve of
4 was completely opposite to the experimental ECD curve for
3 (
Figure 3), suggesting
4 was an enantiomer of
3. Accordingly, the absolute configuration of
4 was identified as 2′
R, 3′
S (
Figure 2).
Compound
5 was obtained as yellow oil. The molecular formula was deduced as C
18H
20O
6 based on the (+)-HRESIMS ion at
m/
z 333.1350 [M+H]
+ (calcd for C
18H
21O
6, 333.1333), indicating nine degrees of unsaturation. The
1H,
13C NMR (
Table 2), DEPT and HSQC spectra revealed the presence of two ester carbonyls (
δC 169.2, C-1; 172.0, C-6′), six aromatic quaternary carbons (
δC 159.9, C-5; 158.1, C-7; 147.2, C-3a; 116.2, C-6; 114.9, C-4; 102.7, C-7a), one oxygenated sp
3 methine (
δC/H 90.1/5.40, C-2′), two methylene [including one oxygenated methylene (
δC/H 69.2/5.13, C-3)] and four methyl groups [including two oxygenated methine groups (
δC/H 59.3/3.95, 5-OCH
3; 52.1/3.70, C-8′)]. These data showed a close similarity to those reported for compound
2 from
Penicillium sp. HN 66 [
13], and then
5 was inferred to be an analog. Detailed analysis of 1D NMR (
Table 2), HSQC, HMBC and
1H-
1H COSY spectra (
Figure 1) revealed that the major difference was the shift of the C-4′ carbon to the low field and shift of the C-2′ carbon to the high field, suggesting the possibility that after opening the ∆
2′ double bond on compound
16, it reacted not only with the 4′-hydroxyl group to remove one molecule of H
2O and form the ∆
3′ double bond, but also with the 7-hydroxyl group to form a five-membered ring, as confirmed by the HMBC correlations from H-7′ to C-4′, C-3′ and C-2′, from H-1′ to C-6 and C-7, from H-8′ to C-6′, from H-5′ to C-6′, from 5-OCH
3 to C-5, from H-8 to C-3a, C-4, and C-5, and from H-3 to C-1, C-3a, C-4 and C-7a. In addition, COSY correlations of H
2-1′/H-2′ and H-4′/H
2-5′ were observed, revealing the linkage between the carbons directly connected to the protons. Thus, the planar structure of
5 was established as shown (
Figure 2) and named penicacid S. According to NOESY data correlation between H
2-5′ and H
3-7′, the double bond is in
E-geometry (
Figure 1).
Compound
6 was isolated as yellow oil with the same molecular formula as that of
5 according to (+)-HRESIMS data, implying nine degrees of unsaturation. Their
1H,
13C NMR (
Table 2) and DEPT data were quite similar. According to the 1D and 2D NMR data (
Table 2 and
Figure 1), the planar structure of
6 was established, and the compound was designated as penicacid T. According to NOESY data (
Figure 1), the double bond in
6 has an
E configuration, which is confirmed by the correlation of H
2-5′/H
3-7′.
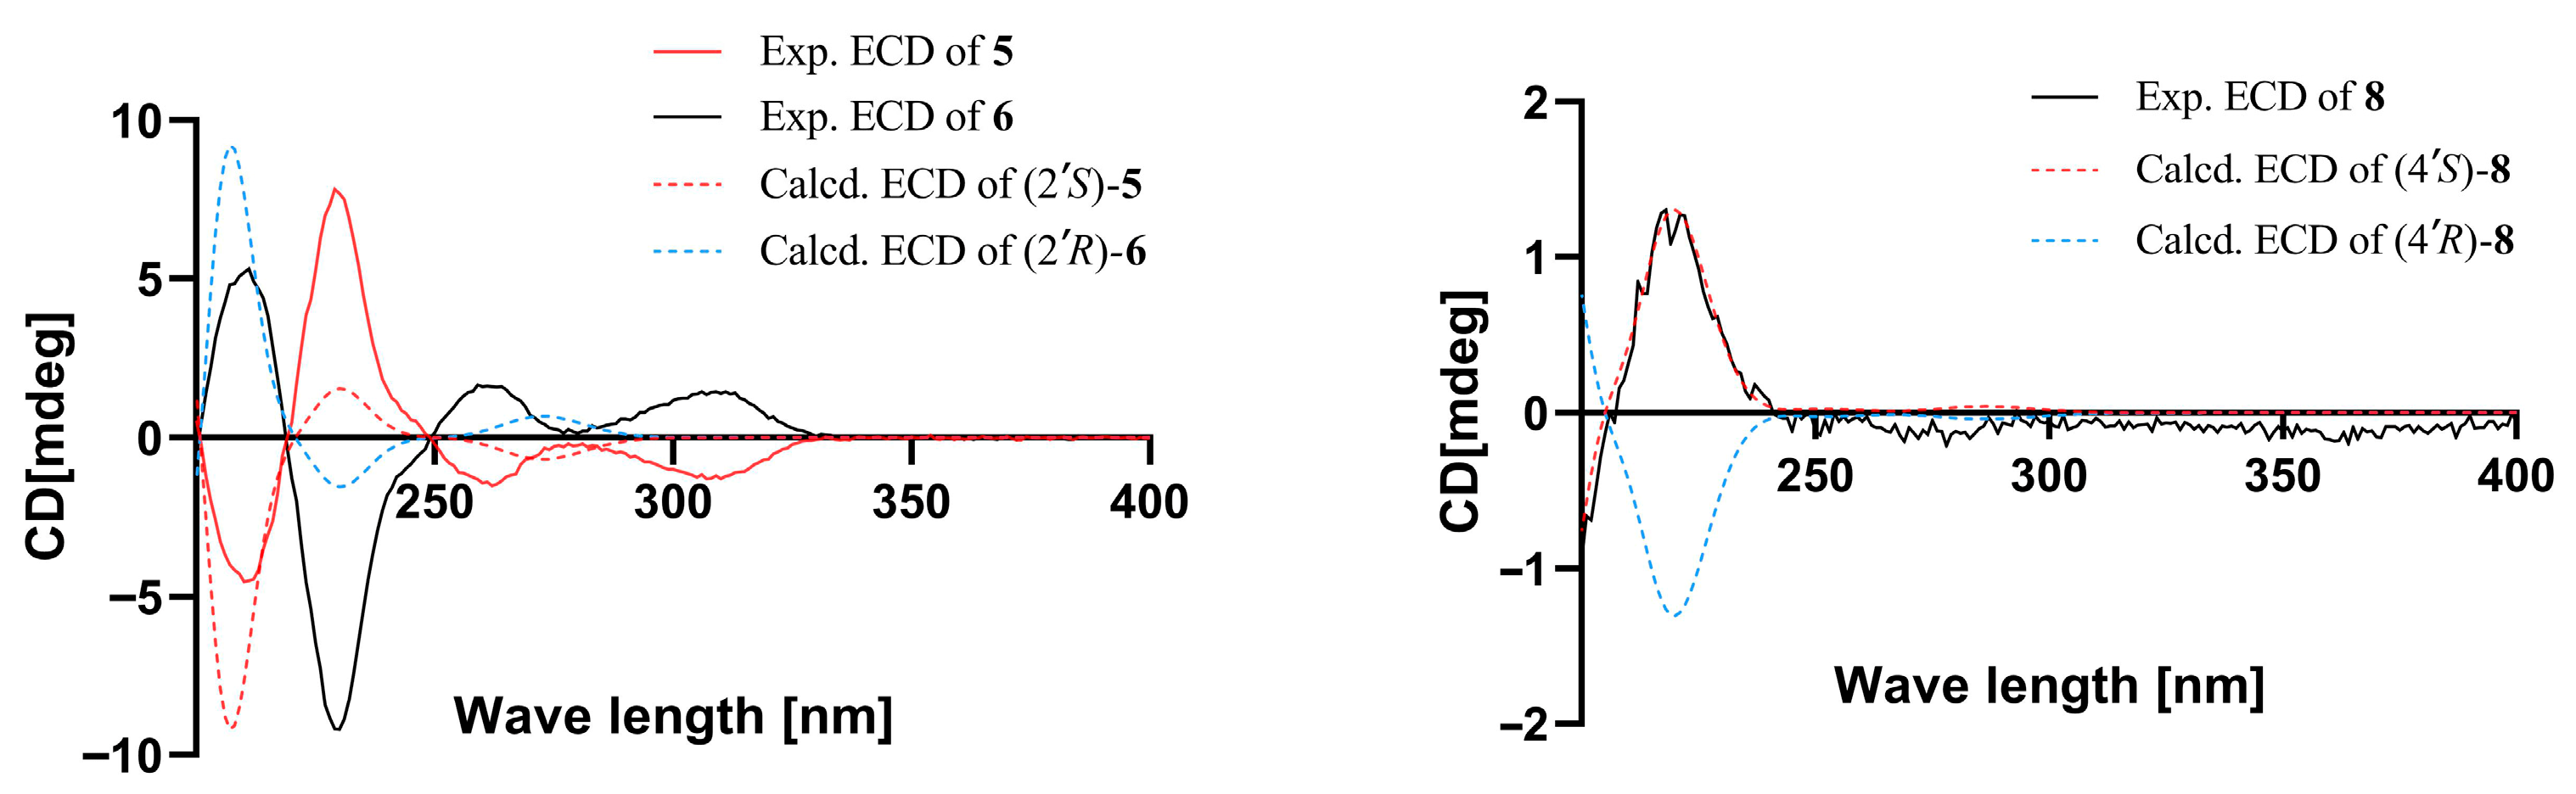
The theoretical ECD curves of
5 and
6 were then calculated and compared with the experimental ECD curves. Compound
5 showed a higher similarity to the calculated ECD curve for 2′
S. Accordingly, the absolute configuration of
5 was identified as 2′
S (
Figure 5). And the experimental ECD curve of
6 was completely opposite to the experimental ECD curve for
5 (
Figure 5). Accordingly, the absolute configuration of
6 was identified as 2′
R (
Figure 5).
Compound
7 was obtained as yellow oil. The molecular formula was deduced as C
19H
24O
7 based on the (+)-HRESIMS ion at
m/
z 387.1414 [M+Na]
+ (calcd for C
19H
24O
7Na, 387.1414), indicating eight degrees of unsaturation. Careful comparison of the 1D NMR data of
7 and penicacid N revealed a high structural similarity except for the appearance of an oxyethyl group (
δC/H 60.9/4.13, C-8′; 14.3/1.24, C-9′) in
7 instead of the methoxy group at C-6′ in penicacid N [
13].
1H-
1H COSY correlations of H
2-8′/H-9′ were observed, revealing the linkage between the carbons directly connected to the protons. The location of the oxyethyl group at C-6′ in
7 was confirmed by the HMBC correlation from H-8′ to C-6′ (
δC 172.8). Additionally, the key HMBC correlations from H-5′ to C-6′, from H-4′ to C-2′, from H-7′ to C-2′ and C-4′, from H-1′ to C-3′, C-5, C-6 and C-7, from 5-OCH
3 to C-5, from H-8 to C-3a and C-4, and from H-3 to C-1, C-3a, C-4 and C-7a further supported the planar structure of
7 (
Figure 2), which was elucidated as 4′
S-hydroxy-6′-ethoxy mycophenolic acid and named penicacid U. According to NOESY data correlation between H
2-1′ and H
3-7′, the double bond is in
E-geometry (
Figure 1).
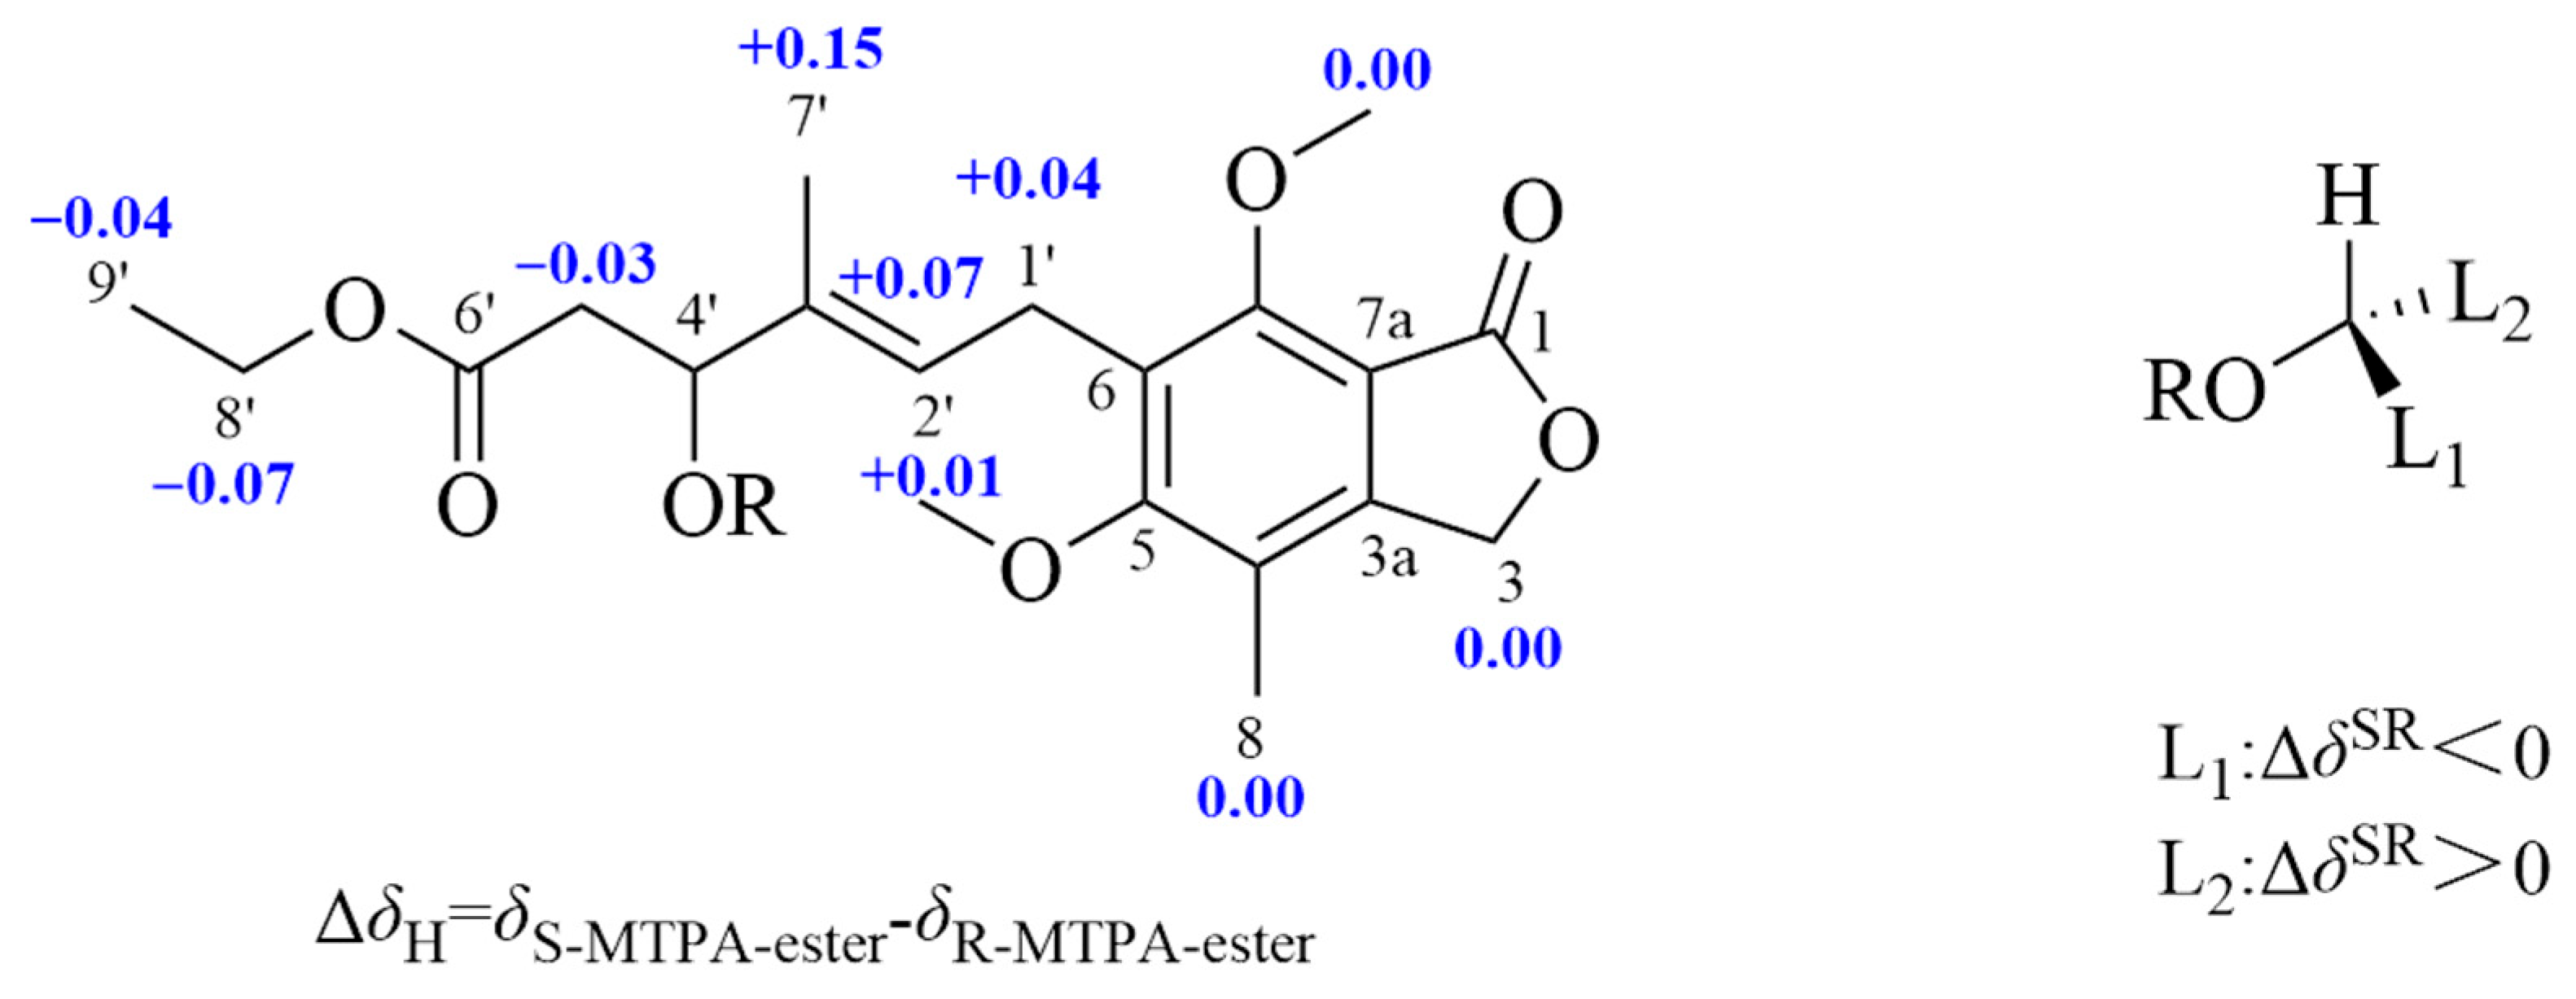
The configuration at C-4′ was determined by a modified Mosher’s method [
14,
15,
16]. Firstly, the phenol group of compound
7 was methylated by TMSCHN
2 [
7]. Then, the (
S)- and (
R)-MTPA esters of
7,
7a and
7b were obtained by acylation of
7 with (
R)- and (
S)-MTPA-Cl, respectively. According to the rule of the modified Mosher’s method, a 4′
S configuration in
7 was inferred from the Δ
δH values (Δ
δH =
δS-MTPA-ester −
δR-MTPA-ester) of the hydrogen signals adjacent to C-4′ (
Figure 6). Thus, the absolute configuration of
7 was established as 4′
S (
Figure 2).
Compound
8 was obtained as yellow oil. The molecular formula was deduced as C
20H
24O
8 based on the (+)-HRESIMS ion at
m/
z 415.1373[M+Na]
+ (calcd for C
20H
24O
8Na, 415.1363), indicating nine degrees of unsaturation. After comparing its NMR data with those of penicacid N [
13], compound
8 was determined to have an identical planar structure to penicacid N. However, the optical rotatory dispersion (ORD) value of compound
8 was −10°, which was opposite to the ORD value of penicacid N
= +8 (
c 0.1, MeOH). This discrepancy suggests that the configuration of the C-4′ position in compound
8 is opposite to that of penicacid N. The ECD spectrum of
8 (
Figure 5) shows a negative Cotton effect at 205 nm, as opposed to penicacid N. The absolute configuration of chiral center 4′
S was determined by comparing the experimental and calculated ECD spectra (
Figure 5). According to NOESY data correlation between H
2-1′ and H
3-7′, the double bond is in
E-geometry (
Figure 1). Consequently, the structure of
8 was elucidated as 4′
S-methyl acetate-6′-methoxy mycophenolic acid and named penicacid V.
Compound
9 was obtained as yellow oil. The molecular formula was deduced as C
20H
24O
8 based on the (+)-HRESIMS ion at
m/
z 415.1373[M+Na]
+ (calcd for C
20H
24O
8Na, 415.1363), indicating nine degrees of unsaturation. This suggests that compound
9 should have an identical chemical formula as compound
8. The most notable difference observed in the NMR data (1D NMR in
Table 3; HSQC, HMBC, and
1H-
1H COSY in
Figure 1) was an upfield shift for C-4′ and a downfield shift for C-7′. This shift pattern implies that the methyl acetate group in compound
8 may have been repositioned as confirmed by the HMBC correlations from H-7′ to C-9′, C-4′, C-3′ and C-2′. Additionally, the key HMBC correlations from H-10′ to C-9′, from H-8′ to C-6′, from H-5′ to C-6′, from H-4′ to C-2′, from H-1′ to C-3′, C-5, C-6 and C-7, from 5-OCH
3 to C-5, from H-8 to C-3a and C-4, and from H-3 to C-1, C-3a, C-4 and C-7a further supported the planar structure of
9. In addition, the COSY correlations of H
2-1′/H-2′ and H
2-4′/H
2-5′ were observed, revealing the linkage between the carbons directly connected to the protons. Thus, the planar structure of
9 was established as shown (
Figure 2), elucidated as 6′-methoxy-7′-methyl acetate mycophenolic acid and named penicacid W. According to NOESY data correlation between H
2-1′ and H
2-7′, the double bond is in
Z-geometry (
Figure 1).
Compound
10 was obtained as yellow oil and determined to be C
17H
20O
6 based on the (-)-HRESIMS. The planar structure of
10 was the same as a synthesized compound methyl-6-(4,6-dihydroxy-7-methyl-3-oxo-1,3-dihydroisobenzofuran-5-yl)-4-methylhex-4-enoate (
10) by 1D and 2D NMR spectra (
Table S1 and Figure S1) [
17]. The double bond of
10 was identified as in
E-geometry by NOESY data correlation between H
2-1′ and H
3-7′ (
Figure S2). Notably, compound
10 was isolated from a natural source for the first time.
Compound
11 was isolated as yellow oil, and the molecular formula was determined as C
17H
20O
6 by (-)-HRESIMS. The 1D and 2D NMR data (
Table S1 and Figure S1) showed the same planar structure as a synthesized compound methyl (
E)-6-(4-hydroxy-6-methoxy-3-oxo-1,3-dihydroisobenzofuran-5-yl)-4-methylhex-4-enoate [
18]. Compound
11 was often synthesized but has never been isolated from natural sources. According to NOESY data correlation between H
2-1′ and H
3-7′, the double bond is in
E-geometry (
Figure S3).
Five known compounds were compared of their spectrometric data with those in the literature and identified as penicacid L (
12) [
13], mycophenolic acid (
13) [
19], 4′-hydroxy-MPA (
14) [
20], methyl mycophenolic acid (
15) [
21], and penicacid M (
16) [
13]. Among them, the double bond of
12 is in
E-geometry by X-ray crystallographic analysis (
Figure 3).
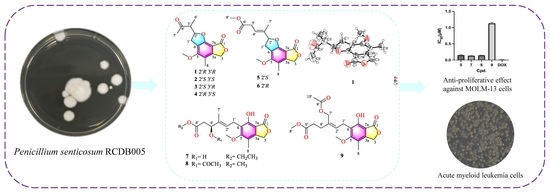
All the isolated compounds were evaluated for their anti-proliferative effects against human acute myeloid leukemia cells (OCI-AML3) using the CCK-8 method. Among them, compounds
5,
7–
9 and
13–
16 showed potent inhibitory activity, while the remaining eight compounds had IC
50 values above 40 μM (
Table S2). Compounds
5,
7–
9 and
13–
16 were subsequently assessed against a panel of human tumor cell lines derived from leukemia, lymphoma, colon cancer, and pancreatic cancer. As shown in
Table 4, all of them displayed a broad spectrum of anti-proliferative effects with IC
50 values ranging from 60 nM to more than 40 μM, but the inhibition was weaker than that of commonly used chemotherapeutic agent doxorubicin. MOLM-13 (human acute myeloid leukemia), MOLT-3 (human T cell leukemia), and OCI-AML3 (human acute myeloid leukemia) cells were particularly sensitive to these compounds, with
5,
7 and
8 exhibiting stronger inhibition than MPA (
13) in MOLM-13 cells. In contrast, the human pancreatic cell line BXPC3 showed the lowest sensitivity. Compound
9 had the weakest anti-proliferative effect against tumor cells, with IC
50 values above 40 μM in four out of eight cell lines.
3. Materials and Methods
3.1. General Experiment Procedures
Optical rotations were taken on a Rudolph Research Analytical Autopol III polarimeter (Rudolph Research Analytical, Hackettstown, NJ, USA). The UV spectra were recorded on an Evolution 350 UV–Vis spectrometer (ThermoFisher Scientific, Madison, WI, USA). ECD data were measured on a Chirascan V100 spectrometer (Applied Photophysics, Leatherhead, Surrey, UK). The NMR spectra were recorded on Bruker 600 MHz NMR spectrometers (Bruker AG, Zürich, Switzerland), while HRESIMS data were obtained using Agilent 6520 and 6545 Q-TOF LC-MS spectrometers (Agilent Technologies, Singapore). Crystal data were obtained on a Bruker D8 Single-Crystal X-Ray Diffractometer (Bruker AXS, Karlsruhe, Germany). The separation and purification of the isolated compounds were carried out using the Agilent 1260 and 1290 HPLC (Agilent Technologies, Waldbronn, Germany) equipped with a 250 mm × 10 mm i.d., 5 μm, Titank C18 column (FLM, Guangzhou, China). The other chromatographic columns used included a 250 mm × 4.6 mm i.d., 5 μm, Chiral NQ(2)-RH column (FLM) and 250 mm × 10 mm i.d., Pursuit 5 PFP column (Agilent, Santa Clara, CA, USA). Medium pressure liquid chromatography (MPLC) separations were performed on a Buchi Sepacore® X50 (BUCHI Labortechnik AG, Flawil, Switzerland) using a C18 column (SW-5222-120-SP, Santai Technologies, Changzhou, China) and glass columns filled with 300–400 mesh silica gel (Qingdao Marine Chemical Factory, Qingdao, China). The solvents and culture media utilized were sourced from Sinopharm Chemical Reagent Co., Ltd. (Shanghai, China), while the deuterated solvents were obtained from Cambridge Isotope Laboratories, Inc. (Shanghai, China). Deuterated solvents used for NMR were CDCl3 (δH 7.260/δC 77.160) and CD3OD (δH 3.310/δC 49.000). (Trimethylsilyl)diazomethane was procured from Shanghai McLean Biochemical Technology Co., Ltd. (Shanghai, China). (R)- and (S)-MTPA-Cl ((S)-(+)-a-methoxy-a-(trifluoromethyl)phenylacetyl chloride) were procured from Shanghai Aladdin Biochemical Technology Co., Ltd. (Shanghai, China).
3.2. Microbial Materials and Fermentation
The fungal strain RCDB005 was isolated from the sediments collected at a depth of 1400 m in the South China Sea and identified as Penicillium senticosum (accession No. PX069401) based on ITS region sequences. Strain RCDB005 was cultured on MB (malt extract powder 15 g, sea salt 15 g, H2O 1 L, 15 g agar, pH 7.4–7.8) agar plates for 3 days before inoculation into MB seed liquid (without agar), which was incubated at 28 °C on a rotary shaker at 180 rpm for 2 days. The seed liquid was then transferred to sterile rice medium (rice 200 g, 1.5% sea salt water 200 mL, per bottle), and large-scale fermentation was performed in 100 flasks at 25 °C for 31 days.
3.3. Extraction and Isolation
The rice culture of RCDB005 was broken by ultrasonication and transferred to a vat, soaked in 60 L of EtOAc overnight, the extraction was repeated three times, and the solvent was evaporated to obtain a crude (207.8 g). The crude was filtered to remove spores and insoluble matter and extracted with MeOH and PE three times to obtain the de-oiled methanolic fraction (122.3 g). The methanolic fraction was first extracted with DCM–PE (1:9, 3:7, 5:5, 7:3, 9:1, 1:0, v/v, per 3.0 L) and DCM–MeOH (1:9, 3:7, 5:5, 7:3, 1:0, v/v, per 6.0 L). Gradient elution of the de-oiled crude was subjected to silica gel column chromatography, and five fractions (Fr. 1–Fr. 5) were obtained. Fraction Fr. 1 (20.5 g) was subjected to MPLC with MeOH and H2O (2:8–1:0, v/v, per 2.0 L). Subfraction Fr. 1-1 (633.0 mg) was isolated and purified by preparative HPLC with a Titank C18 column (55% ACN in H2O, v/v, 2 mL/min) to give compound 12 (3.1 mg, tR = 31 min) and mixture S7. Mixture S7 (30.0 mg) was isolated and purified by analytical HPLC with a chiral column (70% MeOH in H2O, v/v, 0.8 mL/min) to give compounds 1 (2.3 mg, tR = 33 min), 2 (2.0 mg, tR = 20 min), 3 (1.0 mg, tR = 16 min), and 4 (2.6 mg, tR = 27 min). Fraction Fr. 2 (3.0 g) was isolated and purified by preparative HPLC with a Pursuit 5 PFP column (35% ACN in H2O, v/v, 2 mL/min) to give compound 15 (11.5 mg, tR = 12 min). Fraction Fr. 3 (40.6 g) was subjected to MPLC with MeOH and H2O (2:8–1:0, v/v, per 2.0 L) to obtain the compound 16 (908.6 mg) and nine subfractions. Subfraction Fr. 3–7 was isolated by preparative HPLC with a Titank C18 column (50% ACN in H2O, v/v, 2 mL/min) to give compound 7 (12.4 mg, tR = 16 min), compound 8 (10.2 mg, tR = 22 min), compound 13 (11.7 mg, tR = 14 min), compound 14 (9.9 mg, tR = 27 min), compound 11 (4.6 mg, tR = 17 min), compound 10 (3.4 mg, tR = 24 min) and mixture S15. Mixture S15 (15.5 mg) was isolated and purified by analytical HPLC with a chiral column (50% ACN in H2O, v/v, 0.8 mL/min) to give compounds 5 (1.0 mg, tR = 20 min), 6 (1.0 mg, tR = 22 min) and 3 (0.9 mg, tR = 24 min).
Penicacid O (
1). White powder; UV (MeOH) λ
max (log
ε) 222 (4.54), 252 (4.08), 307 (3.82) nm; ECD (0.15 mg/mL, MeOH) λ
max (Δ
ε) 213 (−0.17), 225 (−1.74), 256 (0.74), 279 (−0.09), 310 (0.29) nm;
1H and
13C NMR data, see
Table 1; HRESIMS
m/
z 291.1224 [M + H]
+ (calcd for C
16H
19O
5, 291.1227).
Penicacid P (
2). White powder; UV (MeOH) λ
max (log
ε) 222 (4.13), 252 (3.66), 307 (3.41) nm; ECD (0.30 mg/mL, MeOH) λ
max (Δ
ε) 208 (−0.01), 225 (0.74), 253 (−0.50), 276 (−0.04), 313 (−0.20) nm;
1H and
13C NMR data, see
Table 1; HRESIMS
m/
z 291.1227 [M + H]
+ (calcd for C
16H
19O
5, 291.1227).
Penicacid Q (
3). White powder; UV (MeOH) λ
max (log
ε) 219 (4.15), 306 (3.38) nm; ECD (0.30 mg/mL, MeOH) λ
max (Δ
ε) 226 (1.47), 254 (−0.21), 279 (0.06), 310 (−0.43) nm;
1H and
13C NMR data, see
Table 1; HRESIMS
m/
z 291.1227 [M+H]
+ (calcd for C
16H
19O
5, 291.1227).
Penicacid R (
4). White powder; UV (MeOH) λ
max (log
ε) 221 (4.42), 306 (3.69) nm; ECD (0.30 mg/mL, MeOH) λ
max (Δ
ε) 225 (−1.18), 253 (0.19), 281 (−0.06), 312 (0.34) nm;
1H and
13C NMR data, see
Table 1; HRESIMS
m/
z 291.1224 [M+H]
+ (calcd for C
16H
19O
5, 291.1227).
Penicacid S (
5). Yellow oil; UV (MeOH) λ
max (log
ε) 223 (4.45), 256 (3.99), 308 (3.75) nm; ECD (0.20 mg/mL, MeOH) λ
max (Δ
ε) 210 (−2.28), 229 (3.93), 262 (−0.76), 278 (−0.10), 307 (−0.65) nm;
1H and
13C NMR data, see
Table 2; HRESIMS
m/
z 333.1350 [M + H]
+ (calcd for C
18H
21O
6, 333.1333).
Penicacid T (
6). Yellow oil; UV (MeOH) λ
max (log
ε) 222 (4.43), 254 (3.95), 308 (3.72) nm; ECD (0.20 mg/mL, MeOH) λ
max (Δ
ε) 211 (2.68), 230 (−4.63), 259 (0.83), 277 (0.07), 306 (0.73) nm;
1H and
13C NMR data, see
Table 2; HRESIMS
m/
z 333.1347 [M + H]
+ (calcd for C
18H
21O
6, 333.1333).
Penicacid U (
7). Yellow oil;
= −2.3 (
c 0.3, MeOH); UV (MeOH) λ
max (log
ε) 215 (4.51), 250 (3.85), 304 (3.57) nm; ECD (0.10 mg/mL, MeOH) λ
max (Δ
ε) 210 (0.58), 222 (1.21), 281 (−0.20) nm;
1H and
13C NMR data, see
Table 3; HRESIMS
m/
z 387.1414 [M + Na]
+ (calcd for C
19H
24O
7Na, 387.1414).
Penicacid V (
8). Yellow oil;
= −10.3 (
c 0.3, MeOH); UV (MeOH) λ
max (log
ε) 216 (4.57), 250 (3.89), 304 (3.62) nm; ECD (0.10 mg/mL, MeOH) λ
max (Δ
ε) 218 (1.55), 278 (−0.25) nm;
1H and
13C NMR data, see
Table 3; HRESIMS
m/
z 415.1373 [M + Na]
+ (calcd for C
20H
24O
8Na, 415.1363).
Penicacid W (
9). Yellow oil; UV (MeOH) λ
max (log
ε) 216 (4.55), 250 (3.91), 305 (3.60) nm; ECD (0.20 mg/mL, MeOH) λ
max (Δ
ε) 211 (0.16), 229 (−0.23), 257 (0.01) nm;
1H and
13C NMR data, see
Table 3; HRESIMS
m/
z 415.1377 [M+Na]
+ (calcd for C
20H
24O
8Na, 415.1363).
3.4. X-Ray Crystallographic Analysis
Colorless crystals of compound
1 were obtained in PE/DCM (1:1) solution by slow evaporation at 4 °C. Similarly, colorless crystals of compound
12 were obtained in MeOH/PE/H
2O (5:5:1) solution by slow evaporation at 4 °C. Their crystal data were collected from a single crystal on a Bruker D8 VENTURE dual-wavelength Mo/Cu three-circle diffractometer with a microfocus sealed X-ray tube using mirror optics as the monochromator and a Bruker PHOTON III detector. The crystallographic data of
1 and
12 were measured at 302.00 K, respectively, with Cu
Kα radiation (λ = 1.54178 Å). The structure was solved by the direct method using SHELXT and refined by the full-matrix least-square approach against
F2 by SHELXL-2019/1 [
22,
23]. All non-hydrogen atoms were refined with anisotropic displacement parameters. All C-bound hydrogen atoms were refined with isotropic displacement parameters. Crystallographic data of
1 and
12 (
Tables S4 and S5) have been deposited in the Cambridge Crystallographic Data Centre (deposition No.: CCDC 2498064 for
1 and CCDC 2498063 for
12). These data can be obtained, free of charge, on application to CCDC, 12 Union Road, Cambridge CB21EZ, UK [fax: +44(0)-1223-336033 or e-mail:
deposit@ccdc.cam.ac.uk].
Crystal data for
1. C
16H
18O
5,
Mr = 290.30, crystal size 0.228 × 0.142 × 0.015 mm
3, monoclinic,
a = 5.02400(10) Å,
b = 13.6427(4) Å,
c = 20.9641(6) Å,
α = 90°,
β = 96.049(2)°,
γ = 90°,
V = 1428.90(7) Å
3, T = 302.00 K, space group
P2
1,
Z = 4, μ(Cu Kα) = 0.831 mm
−1, 27,611 reflections collected, 4888 independent reflections (
Rint = 0.0635,
Rsigma = 0.0494). The final
R1 values were 0.0466 (
I ≥ 2σ(
I)). The final w
R2 values were 0.1347 (
I ≥ 2σ(
I)). The final
R1 values were 0.0798 (all data). The final w
R2 values were 0.1347 (all data). The goodness of fit on
F2 was 1.005. The Flack parameter was −0.1(2) (
Table S3).
Crystal data for
12. C
16H
18O
5,
Mr = 290.30, crystal size 0.306 × 0.02 × 0.004 mm
3, monoclinic,
a = 4.5267(3) Å,
b = 11.7847(7) Å,
c = 14.4718(9) Å,
α = 71.277(4)°,
β = 86.160(4)°,
γ = 85.886(4)°,
V = 728.48(8) Å
3, T = 302.00 K, space group
,
Z = 2, μ(Cu Kα) = 0.815 mm
−1, 31,113 reflections collected, 2584 independent reflections (
Rint = 0.0517,
Rsigma = 0.0229). The final
R1 values were 0.0557 (
I ≥ 2σ(
I)). The final w
R2 values were 0.1615 (
I ≥ 2σ(
I)). The final
R1 values were 0.0709 (all data). The final w
R2 values were 0.1748 (all data). The goodness of fit on
F2 was 1.093 (
Table S4).
3.5. ECD Calculation
Conformational searches were carried out by means of the Maestro 12.8 software using the Molecular Merck force field. All density functional theory and time-dependent calculations were performed with the Gaussian 09 program. Conformers within a 12 kcal/mol energy window were generated and optimized by DFT calculations at the B3LYP/6-31+G (d,p) level [
24].
The relative configurations of compounds
1–
6 and
8 also underwent a series of random conformational searches using Maestro 12.8 software with MMFF. Subsequently, the low-energy conformers were re-optimized using the TD-DFT method at the B3LYP/6-31G (d,p) level in MeOH, employing the IEFPCM model in the Gaussian 09 program. Theoretical calculations for ECD were performed in MeOH at the B3LYP/6-31G (d,p) level [
25]. The calculated ECD curves were generated using the SpecDis 3.0 and GraphPad Prism 8.0 from dipole length rotational strengths by applying Gaussian band shapes with a half-bandwidth ranging from 0.2 to 0.4 eV, based on the contributions of each conformer calculated via the Boltzmann distribution following UV correction.
3.6. Methylate the Phenol Group of 7 (7-R)
To a solution of 7 (10.0 mg) in CH2Cl2 (3.0 mL), excess TMSCHN2 (2 mL, 2.0 M) was added, and the mixture was stirred at room temperature (RT) for 48 h. The reaction mixture was concentrated under vacuum and purified by analytical HPLC with a Pursuit 5 PFP column (40% ACN in H2O, v/v, 2 mL/min) to furnish 3.2 mg of 7R: HRESIMS m/z 401.1583 [M+Na]+ (calcd for C20H26O7Na, 401.1571).
3.7. Preparation of the (S)- and (R)-MTPA Esters of 7R
Compound 7R (3.2 mg), 4-(dimethylamino)pyridine (1.0 mg) and (R)-MTPA-Cl were added to 400 µL stirred pyridine solution. The mixture was reacted at RT for 48 h and then dried to give (S)-MTPA ester (7Ra). (R)-MTPA ester of 7R (7Rb) was obtained by the same experimental procedure.
(S)-MTPA ester of 7R (7Ra). 1H NMR (600 MHz, CDCl3) δH 5.15 (2H, s, H2-3), 2.18 (3H, s, H3-8), 3.42 (2H, dd, J = 11.2, 7.1 Hz, H2-1′), 5.68 (1H, t, J = 6.9 Hz, H-2′), 2.82–2.54 (2H, m, H2-5′), 1.84 (3H, s, H3-7′), 4.02 (2H, qd, J = 7.2, 6.1 Hz, H2-8′), 1.16 (3H, t, J = 7.1 Hz, H3-9′), 4.02 (3H, s, H3-5-OCH3), 3.74 (3H, s, H3-7-OCH3); HRESIMS m/z 617.1979 [M + Na]+ (calcd for C30H33F3O9Na, 617.1969).
(R)-MTPA ester of 7R (7Rb). 1H NMR (600 MHz, CDCl3) δH 5.15 (2H, s, H2-3), 2.18 (3H, s, H3-8), 3.38 (2H, dd, J = 11.2, 7.1 Hz, H2-1′), 5.61 (1H, t, J = 6.8 Hz, H-2′), 2.85–2.54 (2H, m, H2-5′), 1.69 (3H, s, H3-7′), 4.09 (2H, qd, J = 7.1, 1.8 Hz, H2-8′), 1.20 (3H, t, J = 7.1 Hz, H3-9′), 4.01 (3H, s, H3-5-OCH3), 3.74 (3H, s, H3-7-OCH3); HRESIMS m/z 617.1986 [M + Na]+ (calcd for C30H33F3O9Na, 617.1969).
3.8. Biological Assay
The bioactivity of the 16 compounds and doxorubicin (MedChemExpress, Monmouth Junction, NJ, USA) against human tumor cell proliferation was assessed by the CCK-8 method, a colorimetric assay for measuring cell viability, proliferation, and cytotoxicity [
26]. MOLT-3, CCRF-CEM, HT-29 and BXPC-3 were obtained from ATCC; Karpas-422 and WSU-DL-CL2 were purchased from DSMZ; MOLM-13 was obtained from JRCB; OCI-AML3 was purchased from COBIOER (Nanjing, China); and HL-60 was obtained from the National Collection of Authenticated Cell Cultures (Shanghai, China). All cells were cultured according to the recommendations. Cells were seeded in each well of 96-well plates and cultured with different concentrations of test compounds for 72 h. Then, 10 μL of CCK-8 was added per well. The absorbance of each well was measured after 2 h of incubation at 37 °C by SpectraMAX190 (Molecular Devices, San Jose, CA, USA) at 450 nm. The IC
50 value was calculated by SoftMax Pro (Molecular Devices).



 ,
,