
Structural and Functional Insights into a Novel Aspergillus ochraceus Polysaccharide from the Weddell Sea: Implications for Melanoma Immunotherapy In Vitro
 and
and 
Abstract
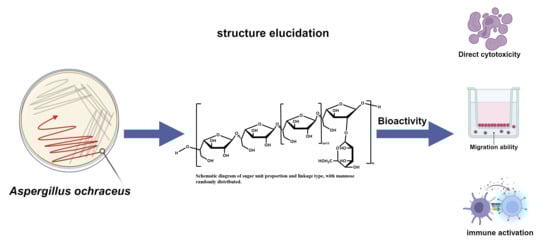
1. Introduction
2. Results
2.1. Yield and Purification
2.2. Molecular Weight and Monosaccharide Composition
2.3. NMR Spectroscopy Analysis
2.4. Mass Spectrometric Fragment Ion Analysis of AOP Oligosaccharides
2.5. Cell Proliferation Analysis
2.6. AOP Might Inhibit the Migration of Melanoma Cells by Suppressing the EMT Process
2.7. AOP Could Exert Immune Anti-Tumor Activity In Vitro by Activating M1 Macrophages
3. Discussion
4. Materials and Methods
4.1. Chemicals and Reagents
4.2. Aspergillus Ochraceus Cultured Condition
4.3. Preparation of AOP
4.4. Monosaccharide Composition
4.5. NMR Analysis
4.6. Mass Spectrometry
4.7. Cell Lines and Extraction of Primary BMDM Cells
4.8. Cell Proliferation and Apoptosis Detection
4.9. Cell Migration Ability Detection
4.10. RT-qPCR Assay
4.11. ELISA Assay
4.12. Tumor and Immune Cell Co-Incubation Assay
4.13. Statistics Assay
5. Conclusions
Author Contributions
Funding
Institutional Review Board Statement
Data Availability Statement
Acknowledgments
Conflicts of Interest
Abbreviations
| BMDM | bone marrow-derived macrophage |
| TNF-α | Tumor necrosis factor alpha |
| IL-6 | Interleukin-6hree letter acronym |
| DAMPs | Damage-associated molecular patterns |
| IL-1β | Interleukin-1β |
| TAMs | Tumor-associated macrophages |
| EMT | Epithelial-to-mesenchymal transition |
References
- Zhou, R.; Wang, M.; Li, X.; Liu, Y.; Yao, Y.; Wang, A.; Chen, C.; Zhang, Q.; Wu, Q.; Zhang, Q.; et al. TBK1-Zyxin signaling controls tumor-associated macrophage recruitment to mitigate antitumor immunity. EMBO J. 2024, 43, 4984–5017. [Google Scholar] [CrossRef] [PubMed]
- Fan, C.Y.; Zheng, J.S.; Hong, L.L.; Ling, Z.-Q. Macrophage crosstalk and therapies: Between tumor cells and immune cells. Int. Immunopharmacol. 2024, 141, 113037. [Google Scholar] [CrossRef] [PubMed]
- Zhang, W.; Wang, M.; Ji, C.; Liu, X.; Gu, B.; Dong, T. Macrophage polarization in the tumor microenvironment: Emerging roles and therapeutic potentials. Biomed. Pharmacother. 2024, 177, 116930. [Google Scholar] [CrossRef]
- Hinshaw, D.C.; Shevde, L.A. The Tumor Microenvironment Innately Modulates Cancer Progression. Cancer Res. 2019, 79, 4557–4566. [Google Scholar] [CrossRef] [PubMed]
- Gu, X.; Zhu, Y.; Su, J.; Wang, S.; Su, X.; Ding, X.; Jiang, L.; Fei, X.; Zhang, W. Lactate-induced activation of tumor-associated fibroblasts and IL-8-mediated macrophage recruitment promote lung cancer progression. Redox Biol. 2024, 74, 103209. [Google Scholar] [CrossRef]
- Wang, J.; Zhu, N.; Su, X.; Gao, Y.; Yang, R. Novel tumor-associated macrophage populations and subpopulations by single cell RNA sequencing. Front. Immunol. 2024, 14, 1264774. [Google Scholar] [CrossRef]
- Wang, H.; Wang, X.; Zhang, X.; Xu, W. The promising role of tumor-associated macrophages in the treatment of cancer. Drug Resist. Updates 2024, 73, 101041. [Google Scholar] [CrossRef]
- Liu, Y.; Fu, W.X.; Wang, W.W.; Zhou, C.L.; Ding, X.D.; Zhang, Q. A novel 12bp deletion in the ITGB5 gene is strongly associated with Escherichia coli F4ac adhesion and increased susceptibility to infection in pigs. Livest. Sci. 2015, 172, 1–4. [Google Scholar] [CrossRef]
- Yeung, O.W.H.; Lo, C.M.; Ling, C.C.; Qi, X.; Geng, W.; Li, C.X.; Ng, K.T.P.; Forbes, S.J.; Guan, X.Y.; Poon, R.T.P.; et al. Alternatively activated (M2) macrophages promote tumor growth and invasiveness in hepatocellular carcinoma. J. Hepatol. 2015, 62, 607–616. [Google Scholar] [CrossRef]
- Hua, H.K.; Zhu, H.M.; Zhang, Z.G. Clinical significance of downregulated NISCH expression in skin cutaneous melanoma: Modulation of tumor cell invasion, migration, and EMT via PAK1 inhibition. Tissue Cell 2024, 88, 102399. [Google Scholar] [CrossRef]
- Dai, L.H.; Zhang, G.R.; Ou, Y.H.; Liu, X.J.; Yao, H.L.; Hu, W.H.; Li, H.J.; Lan, W.J. Five New Indole Alkaloid Derivatives from Deep-Sea Fungus Aspergillus fumigatus AF1. Mar. Drugs 2024, 23, 4. [Google Scholar] [CrossRef] [PubMed]
- Park, M.S.; Son, S.U.; Kim, T.E.; Shim, S.H.; Jang, B.K.; Park, S.; Shin, K.S. Polysaccharide Fraction Isolated from Saccharina japonica Exhibits Anti-Cancer Effects Through Immunostimulating Activities. Mar. Drugs 2025, 23, 38. [Google Scholar] [CrossRef]
- Zou, Z.B.; Li, Y.; Wang, Y.; Xie, C.L.; Li, Z.Q.; Nie, S.S.; Li, Y.; Fang, S.Y.; Zhong, T.H.; Li, L.S.; et al. Stephaochratidin A, a Rare Stephacidin-Asperochratide Hybrid with Ferroptosis Inhibitory Activity from the Deep-Sea-Derived Aspergillus ochraceus. Org. Lett. 2024, 26, 5695–5699. [Google Scholar] [CrossRef] [PubMed]
- Nasr, A.R.; Komarevtsev, S.K.; Baidamshina, D.R.; Ryskulova, A.B.; Makarov, D.A.; Stepanenko, V.N.; Trizna, E.Y.; Gorshkova, A.S.; Osmolovskiy, A.A.; Miroshnikov, K.A.; et al. Targeting mono- and dual-species biofilms of Staphylococcus aureus and Pseudomonas aeruginosa by the recombinant anticoagulant enzyme PAPC from micromycete Aspergillus ochraceus. Biochimie 2025, 230, 33–42. [Google Scholar] [CrossRef]
- Guo, S.; Mao, W.; Yan, M.; Zhao, C.; Li, N.; Shan, J.; Lin, C.; Liu, X.; Guo, T.; Guo, T.; et al. Galactomannan with novel structure produced by the coral endophytic fungus Aspergillus ochraceus. Carbohydr. Polym. 2014, 105, 325–333. [Google Scholar] [CrossRef]
- Leonard-Murali, S.; Bhaskarla, C.; Yadav, G.S.; Maurya, S.K.; Galiveti, C.R.; Tobin, J.A.; Kann, R.J.; Ashwat, E.; Murphy, P.S.; Chakka, A.B.; et al. Uveal melanoma immunogenomics predict immunotherapy resistance and susceptibility. Nat. Commun. 2024, 15, 2863. [Google Scholar] [CrossRef]
- Fontaine, T.; Latgé, J.-P. Galactomannan Produced by Aspergillus fumigatus: An Update on the Structure, Biosynthesis and Biological Functions of an Emblematic Fungal Biomarker. J. Fungi 2020, 6, 283. [Google Scholar] [CrossRef] [PubMed]
- Chen, Y.; Wang, T.; Zhang, X.; Zhang, F.; Linhardt, R.J. Structural and immunological studies on the polysaccharide from spores of a medicinal entomogenous fungus Paecilomyces cicadae. Carbohydr Polym. 2021, 254, 117462. [Google Scholar] [CrossRef]
- Fontana, C.; Widmalm, G. Primary Structure of Glycans by NMR Spectroscopy. Chem. Rev. 2023, 123, 1040–1102. [Google Scholar] [CrossRef]
- Álvarez-Martínez, I.; Pfrengle, F. On the structure, conformation and reactivity of β-1,4-linked plant cell wall glycans: Why are xylan polysaccharides or furanosyl substituents easier to hydrolyze than cellulose? Cellulose 2025, 32, 2145–2165. [Google Scholar] [CrossRef]
- Boutros, A.; Croce, E.; Ferrari, M.; Gili, R.; Massaro, G.; Marconcini, R.; Arecco, L.; Tanda, E.T.; Spagnolo, F. The treatment of advanced melanoma: Current approaches and new challenges. Crit. Rev. Oncol. Hematol. 2024, 196, 104276. [Google Scholar] [CrossRef] [PubMed]
- Li, S.; Wu, F.; Gao, P.; Jin, C.; Wang, Y.; Liao, W.; Ding, K. A novel peptidoglycan isolated from Semiaquilegia adoxoides inhibits Aβ42 production via activating autophagy. Fitoterapia 2023, 169, 105552. [Google Scholar] [CrossRef] [PubMed]
- Fedele, M.; Sgarra, R.; Battista, S.; Cerchia, L.; Manfioletti, G. The Epithelial–Mesenchymal Transition at the Crossroads Between Metabolism and Tumor Progression. Int. J. Mol. Sci. 2022, 23, 800. [Google Scholar] [CrossRef] [PubMed]
- Chen, Z.; Hu, T.; Zhou, J.; Gu, X.; Chen, S.; Qi, Q.; Wang, L. Overview of tumor immunotherapy based on approved drugs. Life Sci. 2024, 340, 122419. [Google Scholar] [CrossRef]
- Wu, M.; Wu, L.; Wu, W.; Zhu, M.; Li, J.; Wang, Z.; Li, J.; Ding, R.; Liang, Y.; Li, L.; et al. Phagocytosis of Glioma Cells Enhances the Immunosuppressive Phenotype of Bone Marrow–Derived Macrophages. Cancer Res. 2023, 83, 771–785. [Google Scholar] [CrossRef]
- Marchese, P.; Garzoli, L.; Young, R.; Allcock, L.; Barry, F.; Tuohy, M.; Murphy, M. Fungi populate deep-sea coral gardens as well as marine sediments in the Irish Atlantic Ocean. Environ. Microbiol. 2021, 23, 4168–4184. [Google Scholar] [CrossRef]
- Hareeri, R.H.; Aldurdunji, M.M.; Abdallah, H.M.; Alqarni, A.A.; Mohamed, S.G.A.; Mohamed, G.A.; Ibrahim, S.R.M. Aspergillus ochraceus: Metabolites, Bioactivities, Biosynthesis, and Biotechnological Potential. Molecules 2022, 27, 6759. [Google Scholar] [CrossRef]
- Bardalaye, P.; Nordin, J. Chemical structure of the galactomannan from the cell wall of Aspergillus niger. J. Biol. Chem. 1977, 252, 2584–2591. [Google Scholar] [CrossRef]
- Gomez-Miranda, B. Extracellular and cell wall polysaccharides of Aspergillus alliaceus. Trans. Br. Mycol. Soc. 1981, 76, 249–253. [Google Scholar] [CrossRef]


| Target Gene | Forward Primer | Reverse Primer |
|---|---|---|
| E-cadherin | CAGTTCCGAGGTCTACACCTT | TGAATCGGGAGTCTTCCGAAAA |
| N-cadherin | AGGCTTCTGGTGAAATTGCAT | GTCCACCTTGAAATCTGCTGG |
| vimentin | CGTCCACACGCACCTACAG | GGGGGATGAGGAATAGAGGCT |
| snail | CACACGCTGCCTTGTGTCT | GGTCAGCAAAAGCACGGTT |
| GAPDH | AGGTCGGTGTGAACGGATTTG | GGGGTCGTTGATGGCAACA |
| CD86 | TCAATGGGACTGCATATCTGCC | GCCAAAATACTACCAGCTCACT |
| CD206 | CTCTGTTCAGCTATTGGACGC | TGGCACTCCCAAACATAATTTGA |
| iNOS | GTTCTCAGCCCAACAATACAAGA | GTGGACGGGTCGATGTCAC |
| IFN-γ | GACAACTACACCCTAAAGTGGAG | GCTCTGACACGAAACTGTGTTTT |
| COX-2 | TTCCAATCCATGTCAAAACCGT | AGTCCGGGTACAGTCACACTT |
| IL-4 | GGTCTCAACCCCCAGCTAGT | GCCGATGATCTCTCTCAAGTGAT |
| Arg1 | CTCCAAGCCAAAGTCCTTAGAG | GGAGCTGTCATTAGGGACATCA |
| TGF-β1 | CCACCTGCAAGACCATCGAC | CTGGCGAGCCTTAGTTTGGAC |
Disclaimer/Publisher’s Note: The statements, opinions and data contained in all publications are solely those of the individual author(s) and contributor(s) and not of MDPI and/or the editor(s). MDPI and/or the editor(s) disclaim responsibility for any injury to people or property resulting from any ideas, methods, instructions or products referred to in the content. |
© 2025 by the authors. Licensee MDPI, Basel, Switzerland. This article is an open access article distributed under the terms and conditions of the Creative Commons Attribution (CC BY) license (https://creativecommons.org/licenses/by/4.0/).
Share and Cite
Hao, J.; Armel, K.k.W.; Gao, P.; Wang, J.; Zhang, W.; Du, K.; Li, Q.; Gao, H.; Yu, G.; Li, G. Structural and Functional Insights into a Novel Aspergillus ochraceus Polysaccharide from the Weddell Sea: Implications for Melanoma Immunotherapy In Vitro. Mar. Drugs 2025, 23, 246. https://doi.org/10.3390/md23060246
Hao J, Armel KkW, Gao P, Wang J, Zhang W, Du K, Li Q, Gao H, Yu G, Li G. Structural and Functional Insights into a Novel Aspergillus ochraceus Polysaccharide from the Weddell Sea: Implications for Melanoma Immunotherapy In Vitro. Marine Drugs. 2025; 23(6):246. https://doi.org/10.3390/md23060246
Chicago/Turabian StyleHao, Jiale, Kouame kra Wilfred Armel, Pengcheng Gao, Jinglei Wang, Weibin Zhang, Kexin Du, Qi Li, Huishu Gao, Guangli Yu, and Guoyun Li. 2025. "Structural and Functional Insights into a Novel Aspergillus ochraceus Polysaccharide from the Weddell Sea: Implications for Melanoma Immunotherapy In Vitro" Marine Drugs 23, no. 6: 246. https://doi.org/10.3390/md23060246
APA StyleHao, J., Armel, K. k. W., Gao, P., Wang, J., Zhang, W., Du, K., Li, Q., Gao, H., Yu, G., & Li, G. (2025). Structural and Functional Insights into a Novel Aspergillus ochraceus Polysaccharide from the Weddell Sea: Implications for Melanoma Immunotherapy In Vitro. Marine Drugs, 23(6), 246. https://doi.org/10.3390/md23060246