
Aphanizomenon flos-aquae: A Biorefinery for Health and Energy—Unleashing Phycocyanin’s Power and Biogas Potential
 , ,
, ,  , and
, and 
Abstract
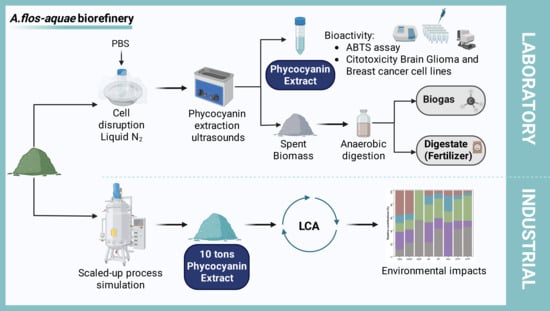
1. Introduction
2. Results
2.1. Aqueous Extraction
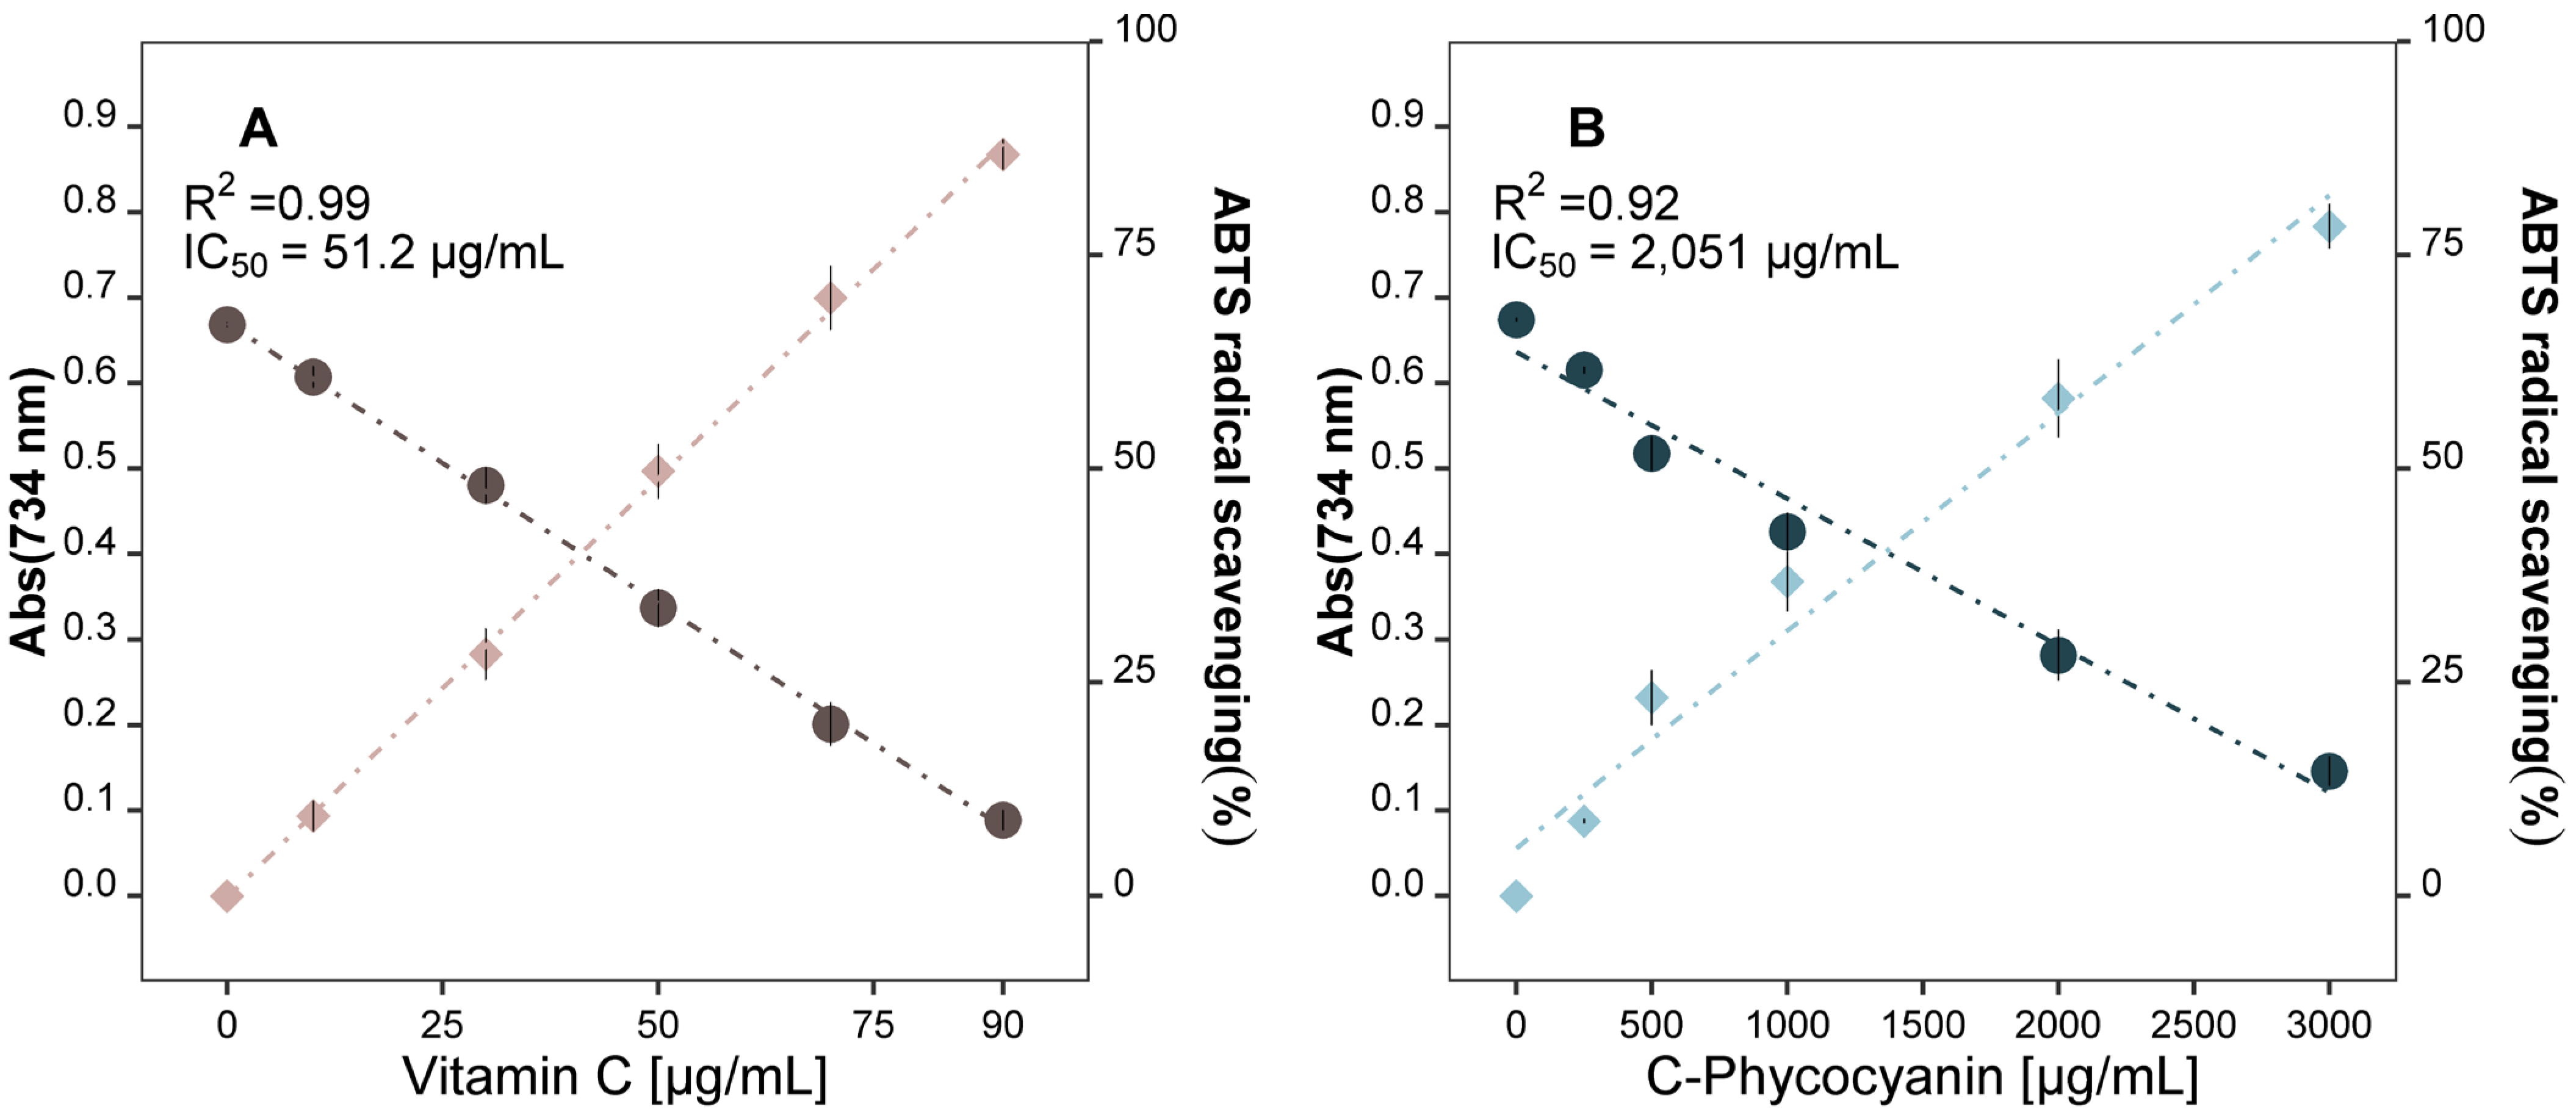
2.1.1. A. flos-aquae Extract Exhibits Antioxidant Properties
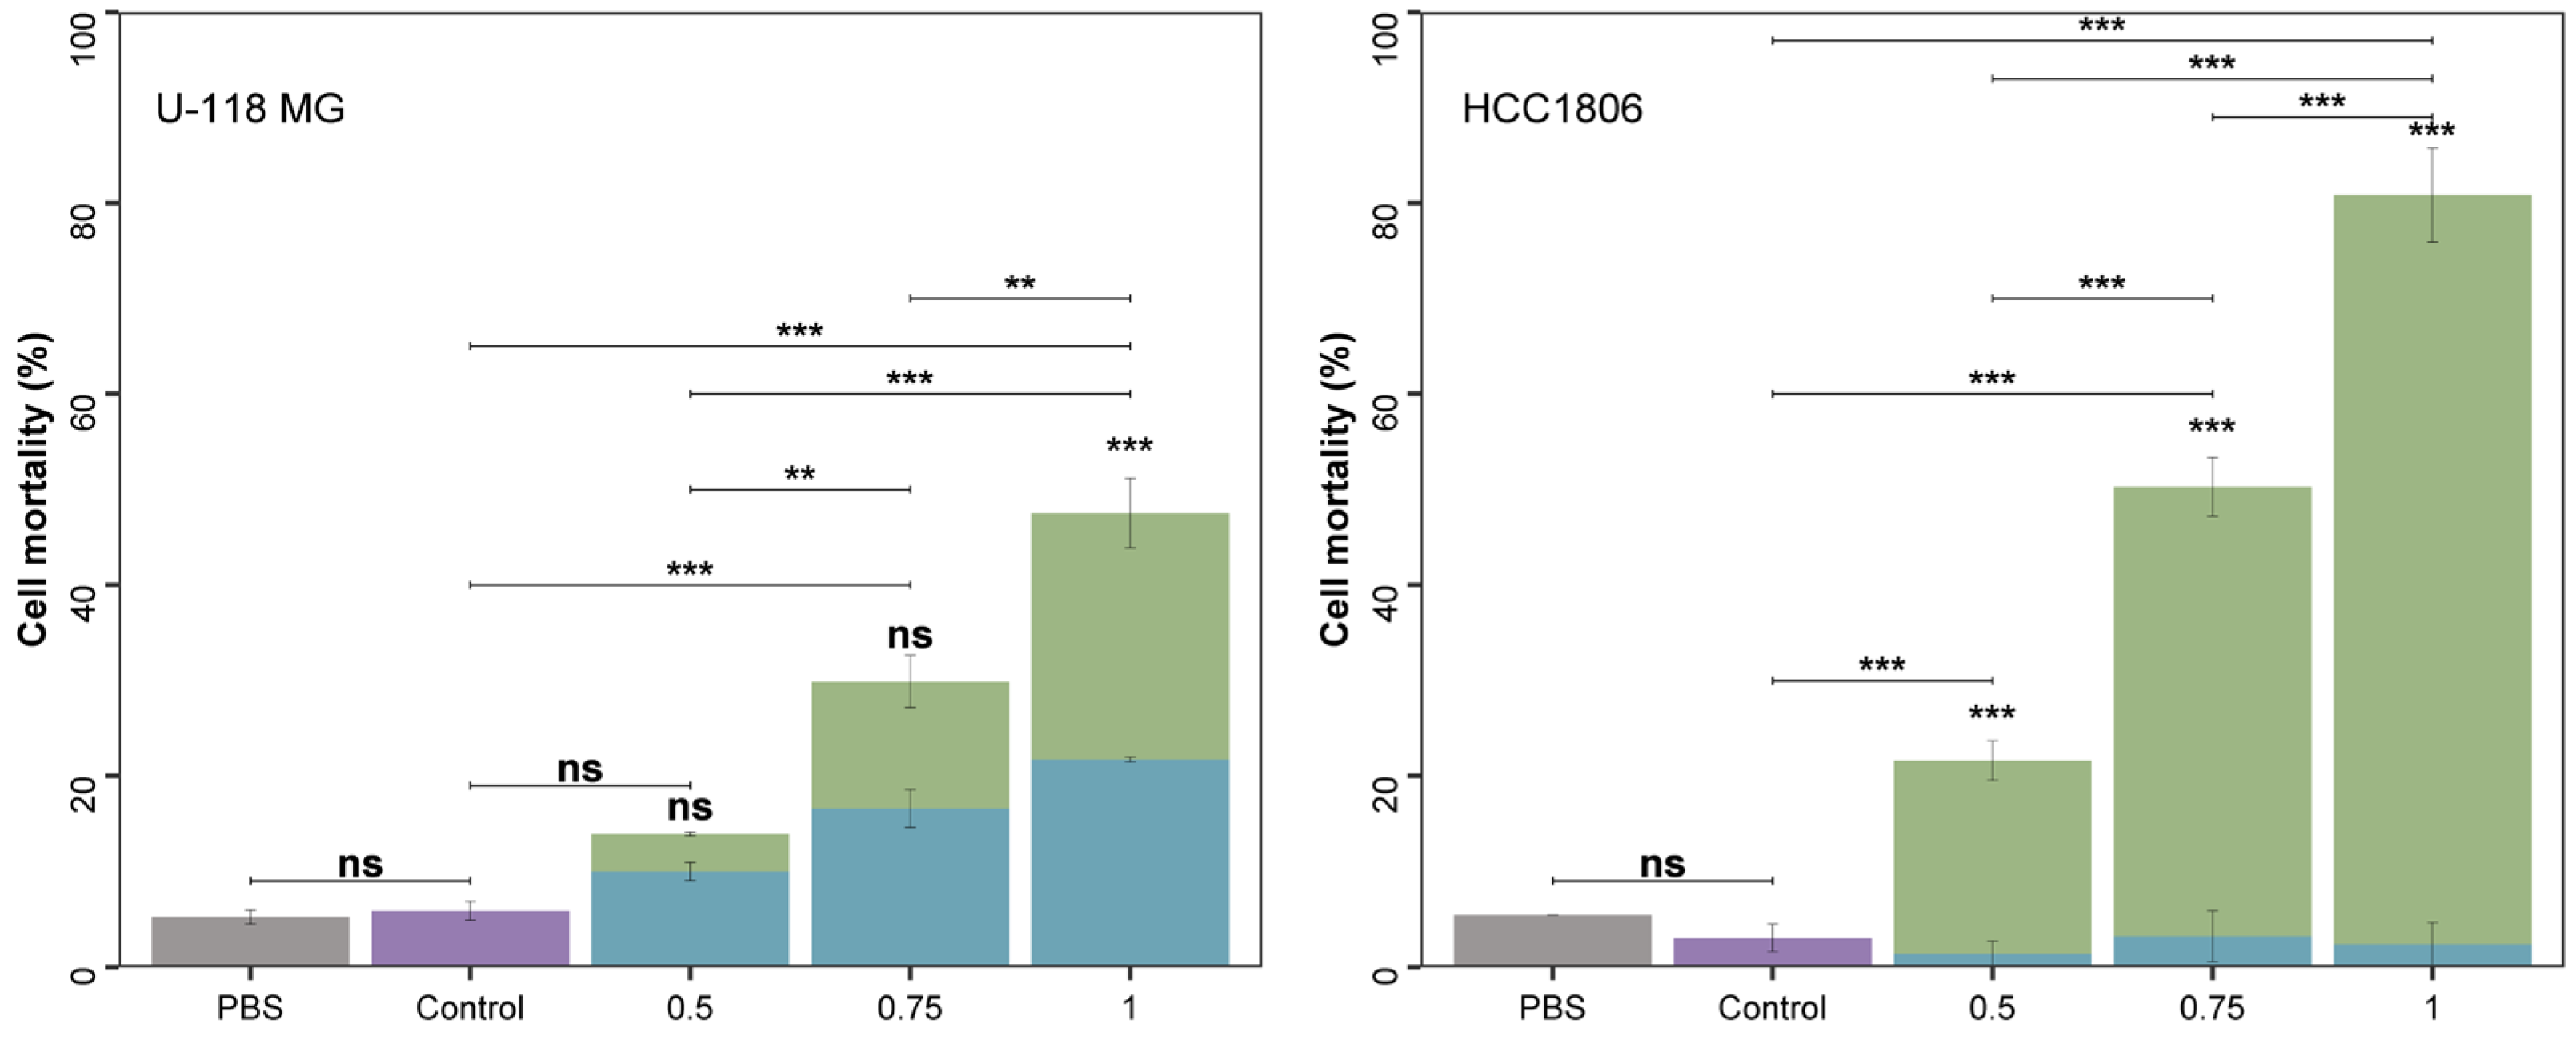
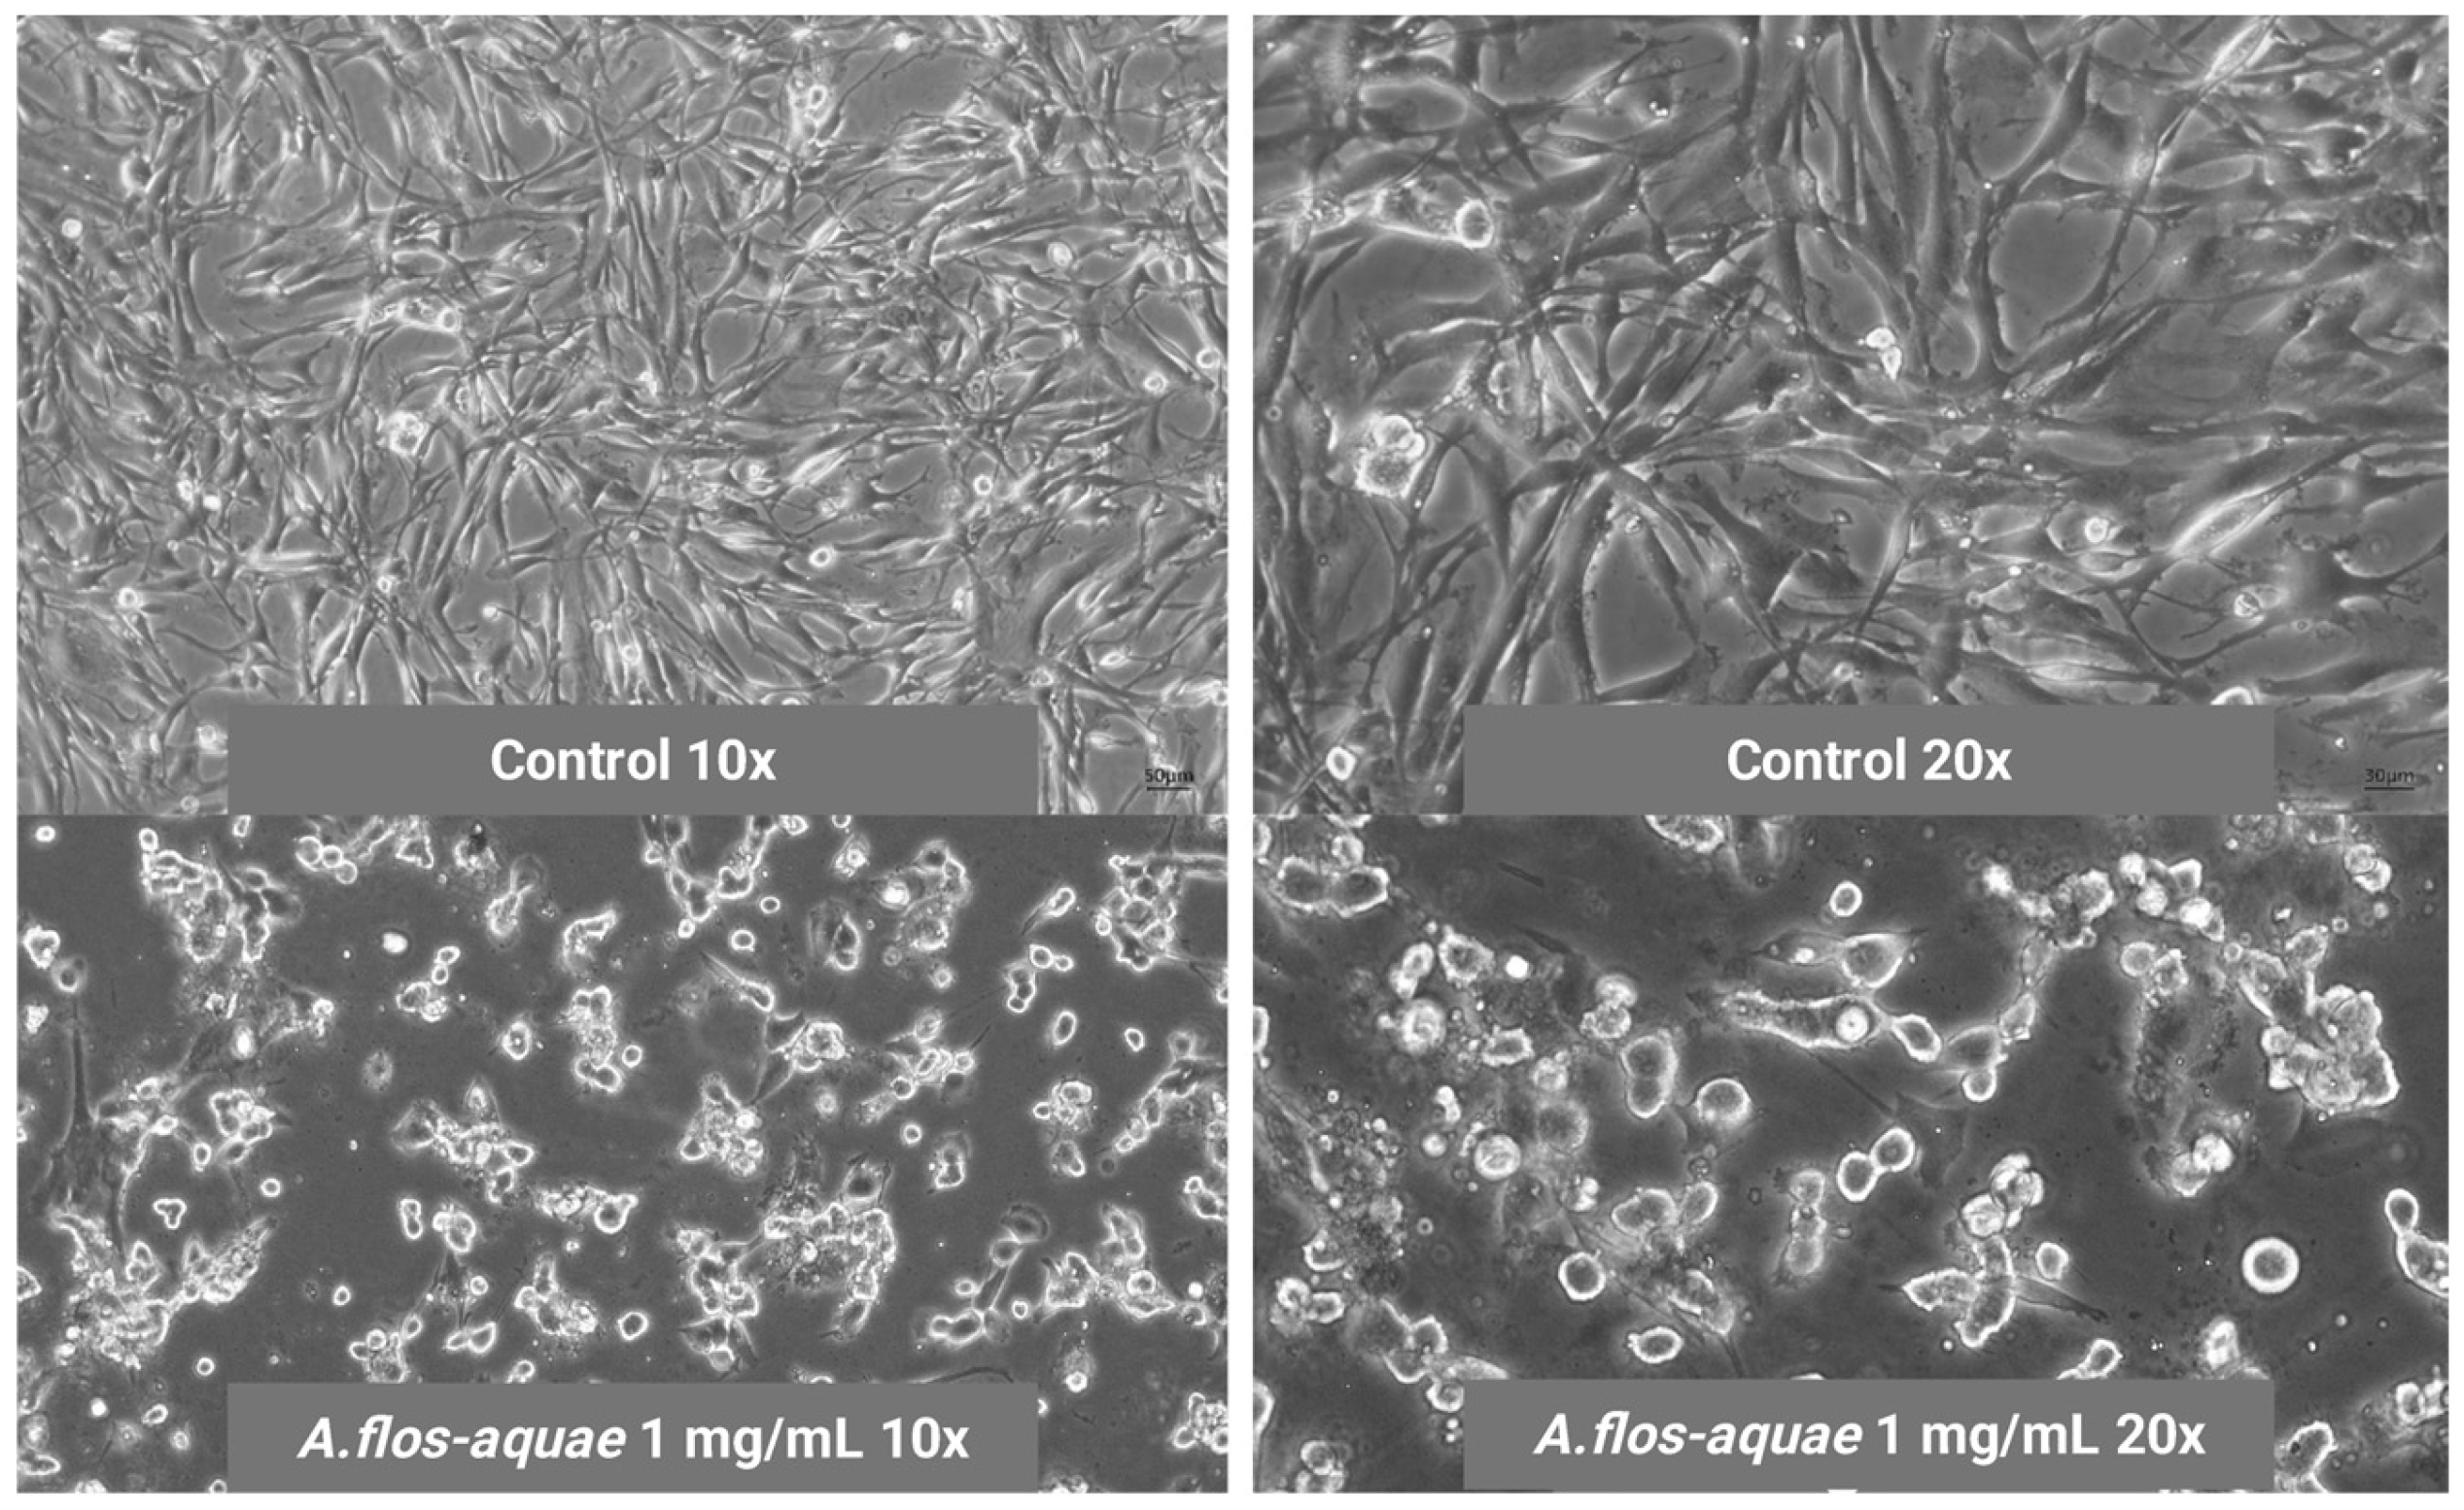
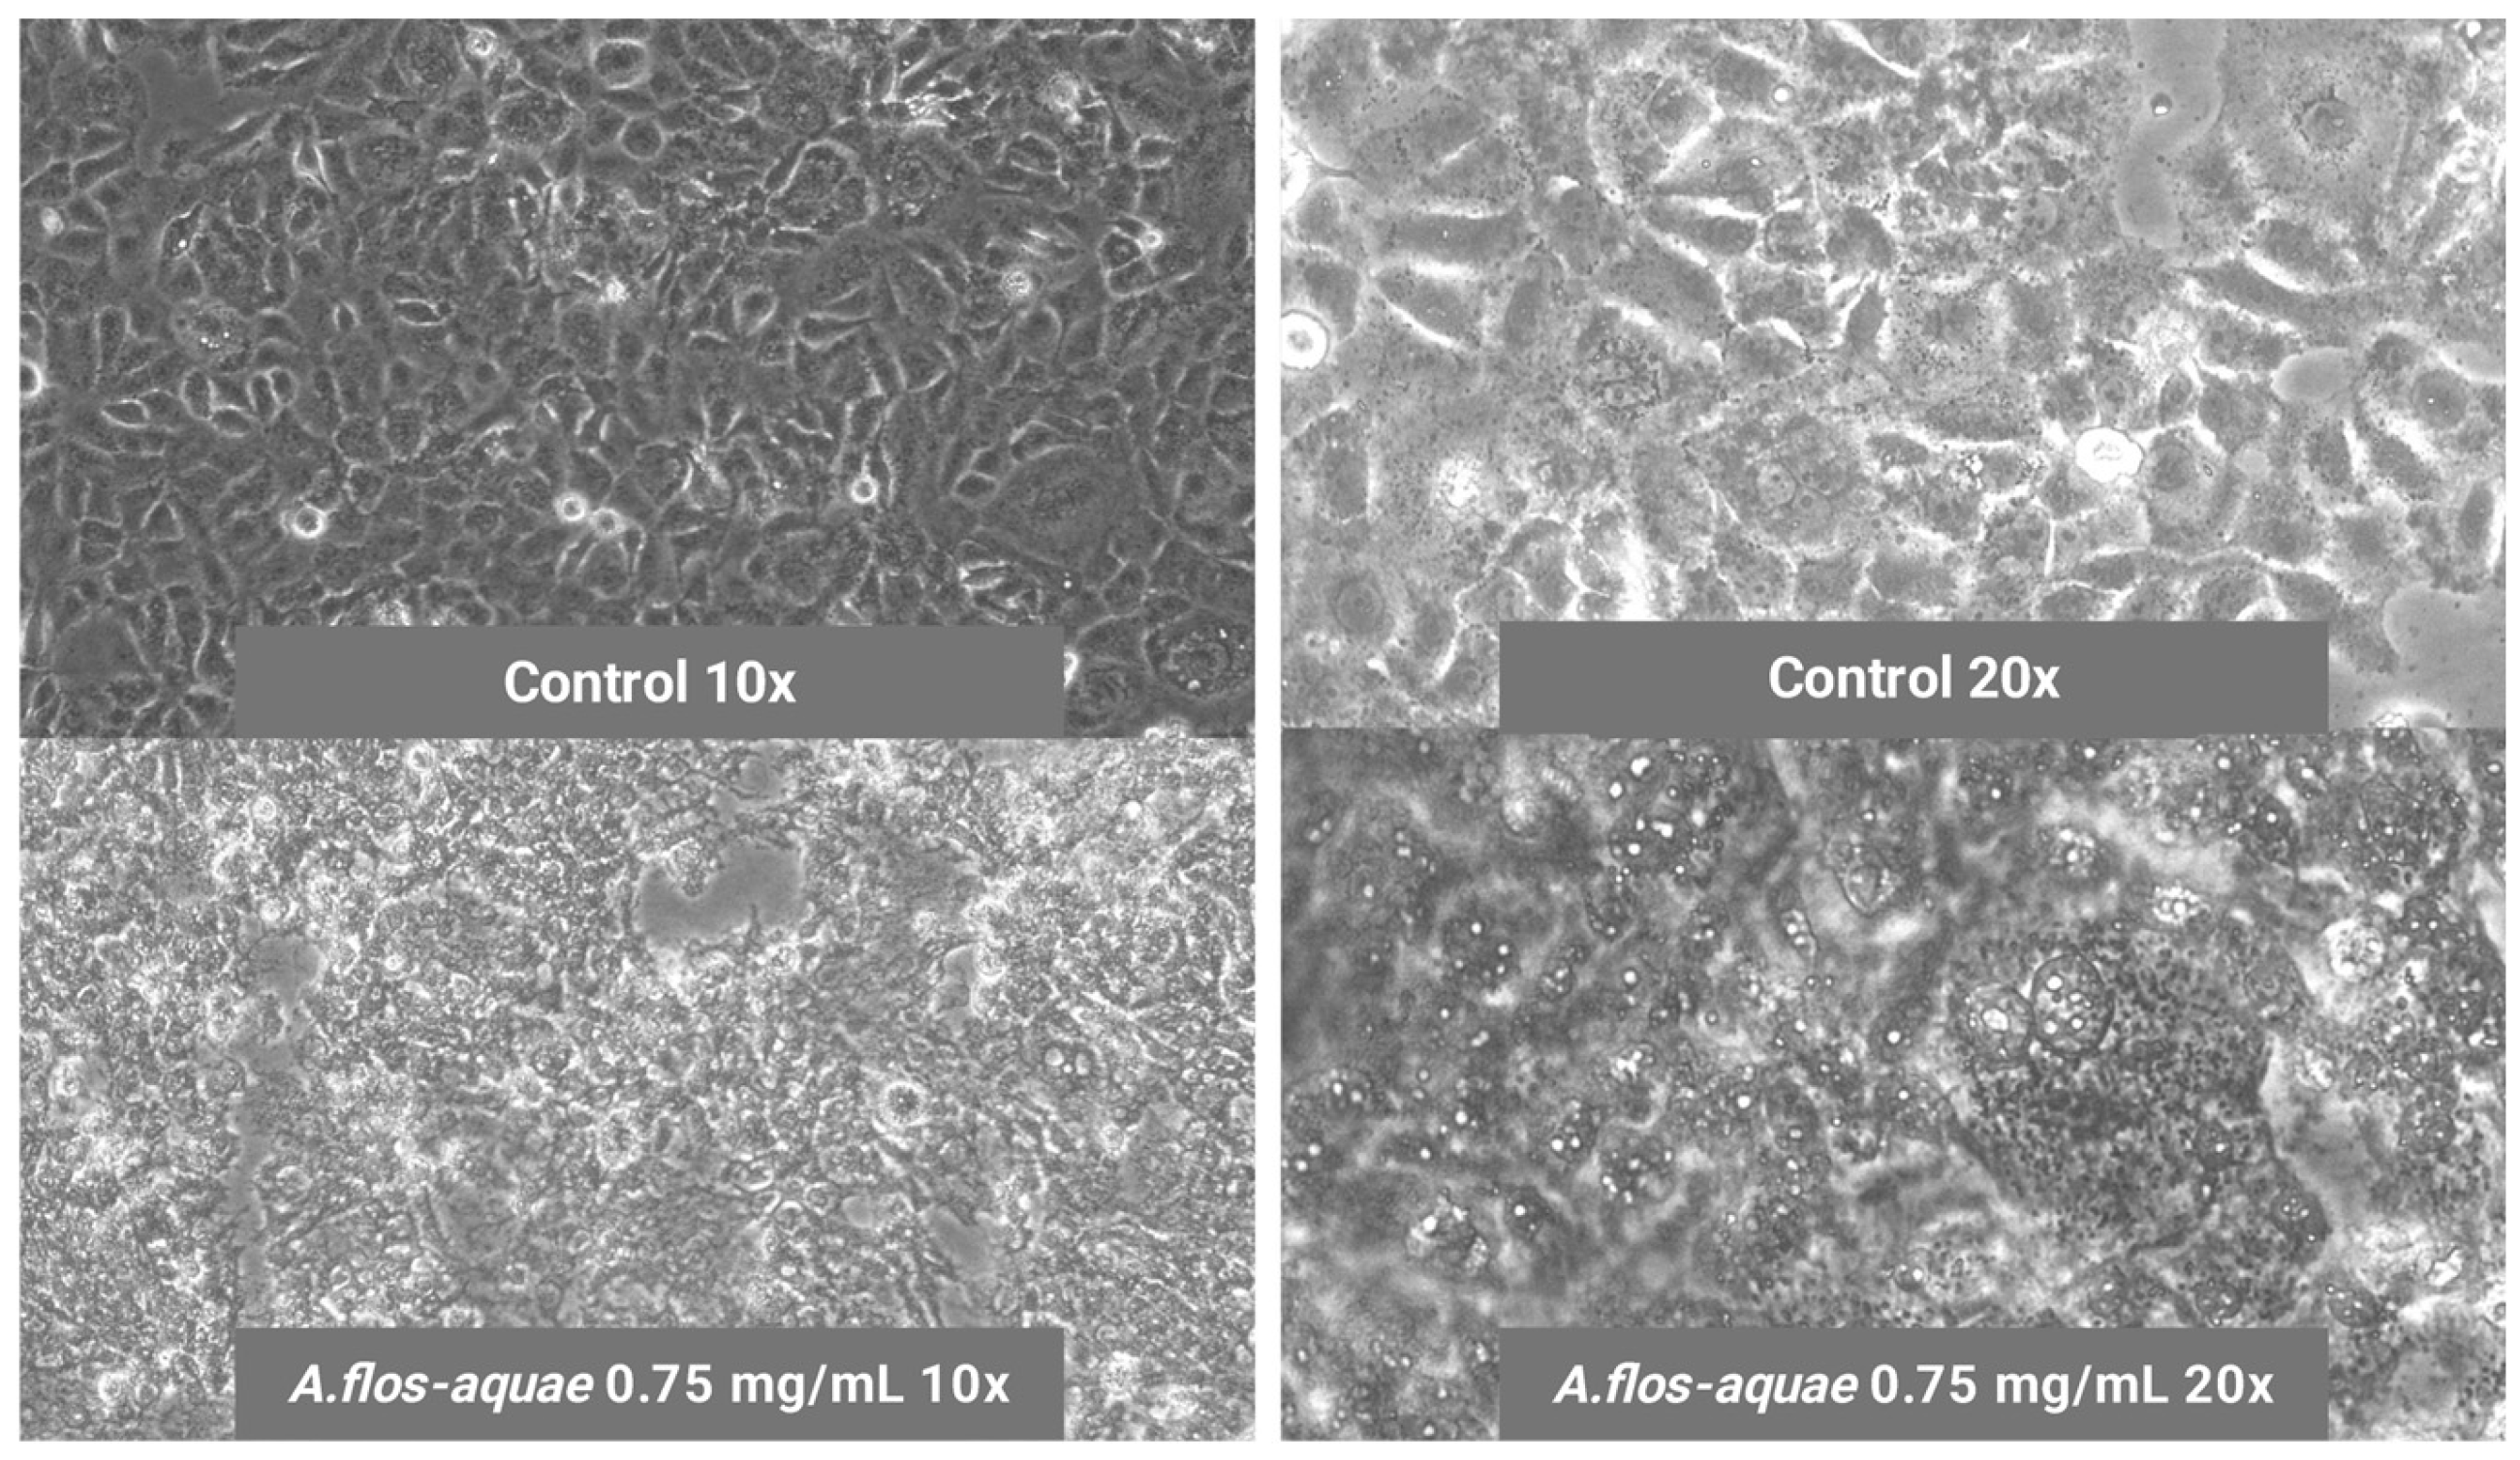
2.1.2. A. flos-aquae Extract Exhibits Cytotoxicity Against U-118 MG and HCC1806 Tumoral Cell Lines
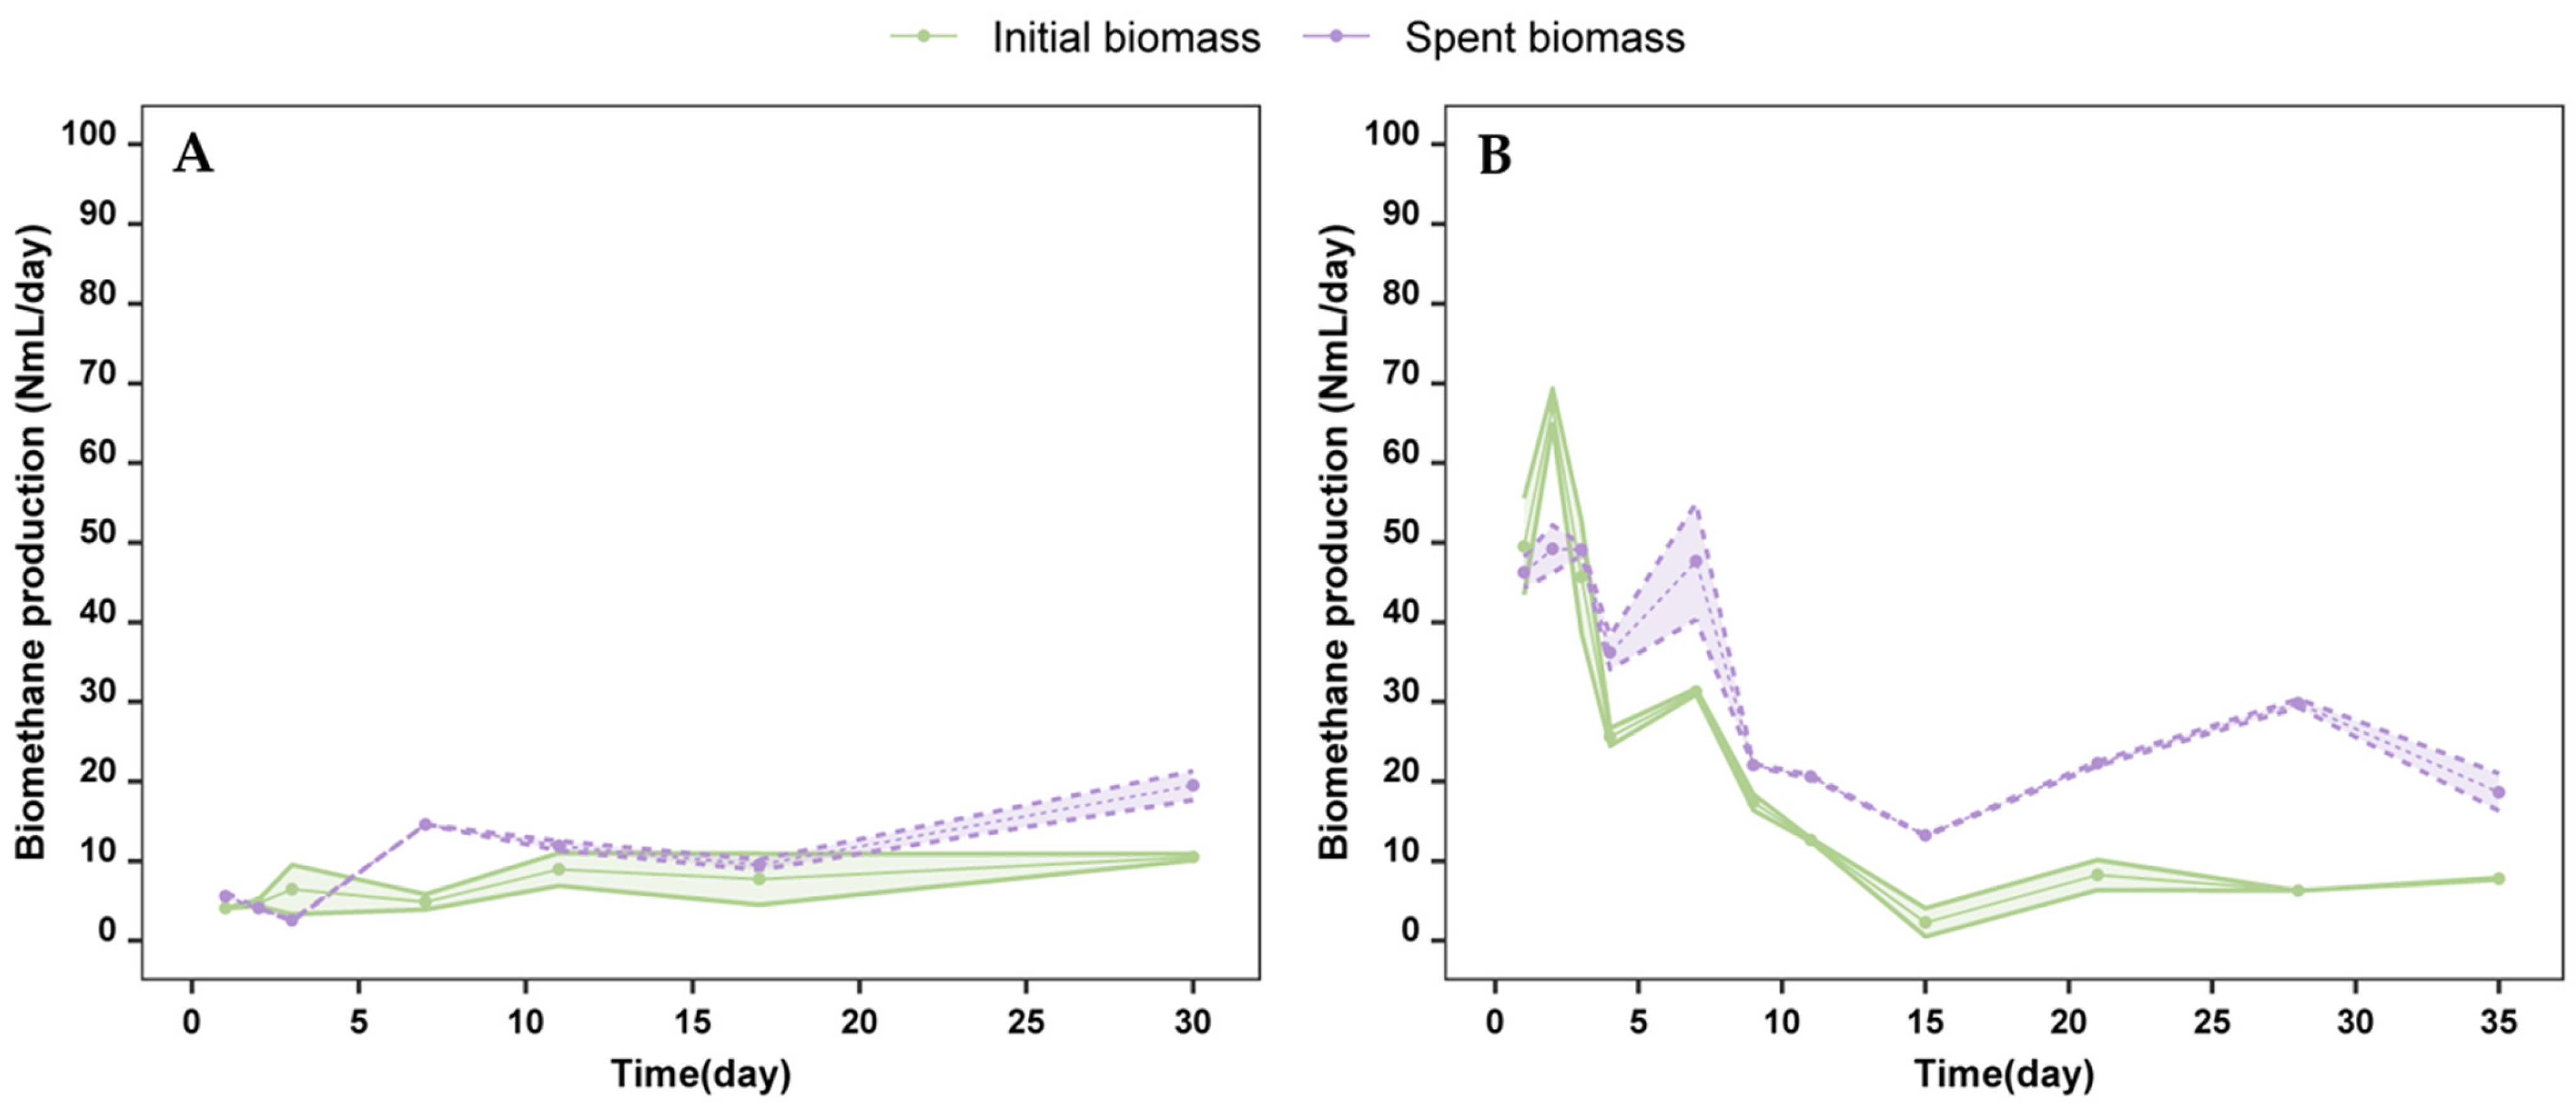
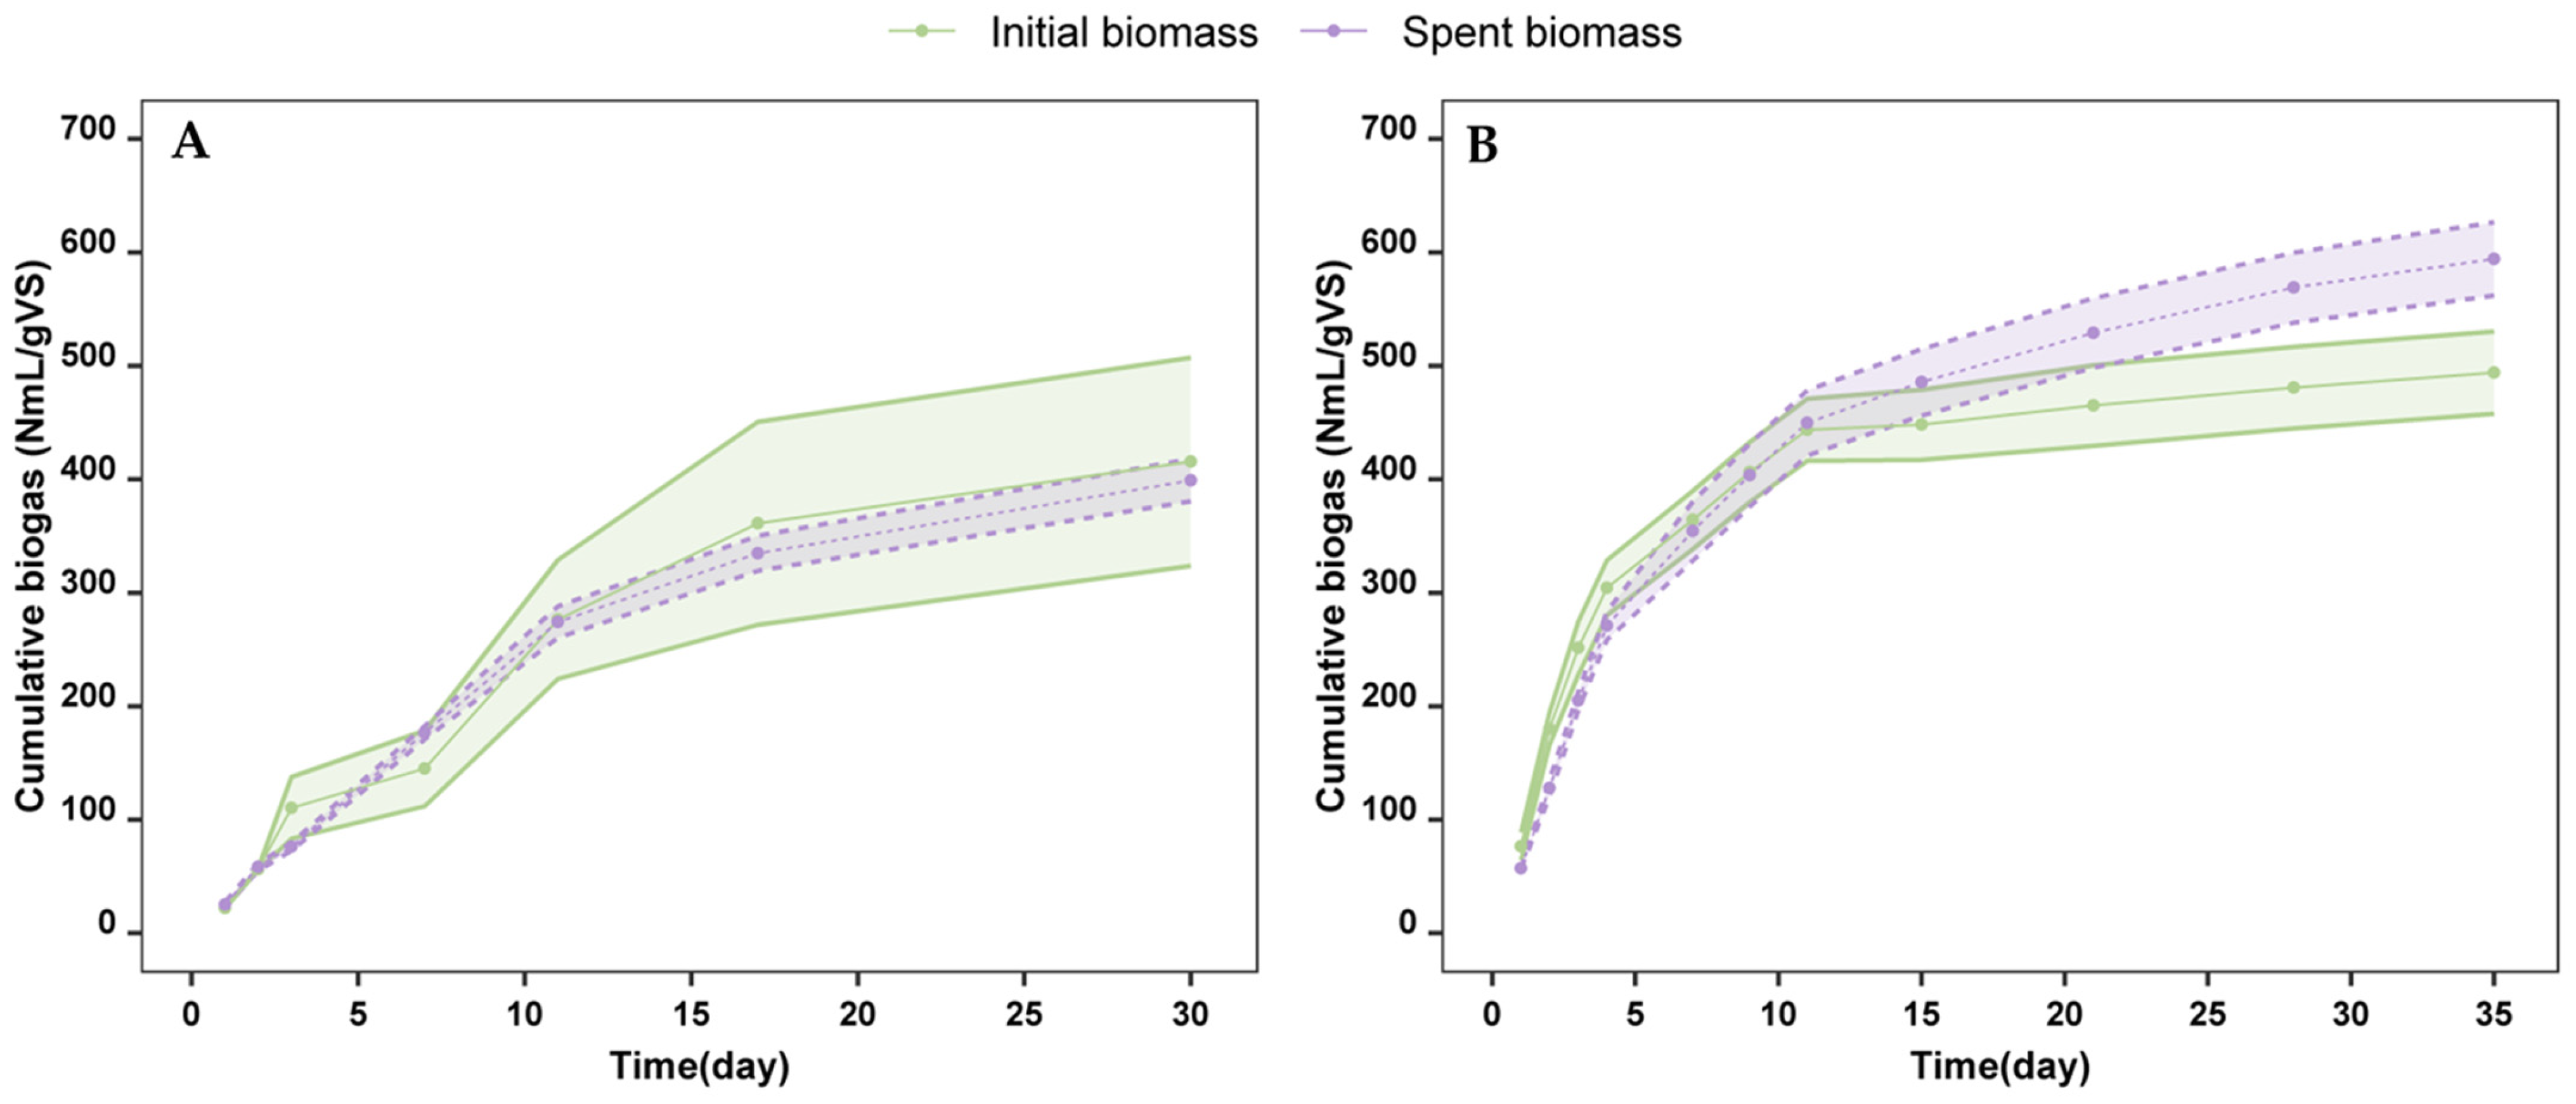
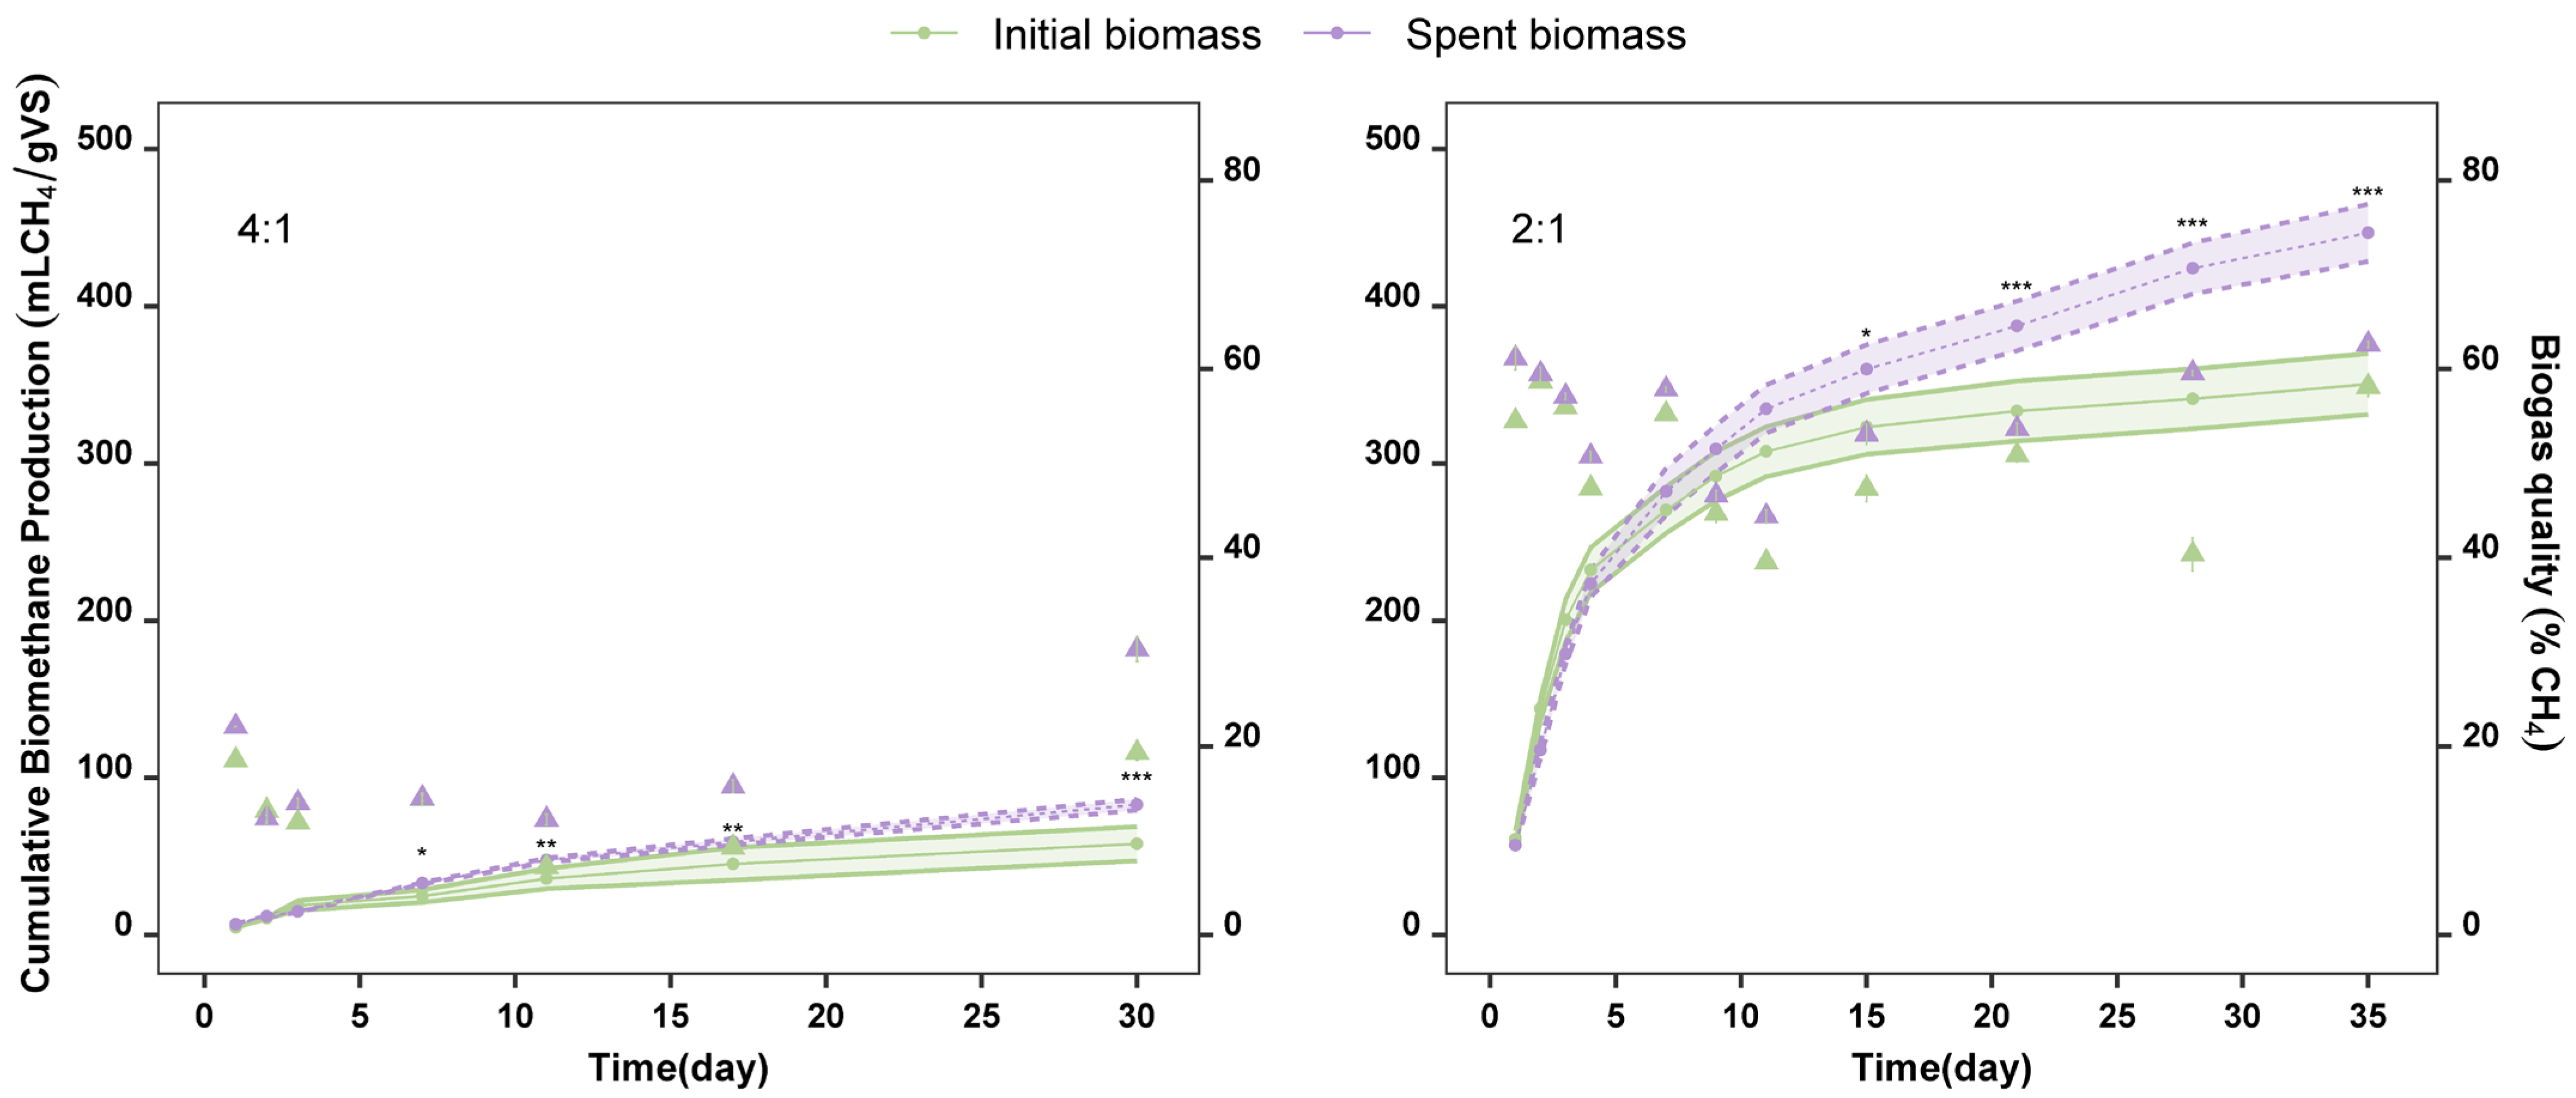
2.2. Production of Biogas from Spent Biomass
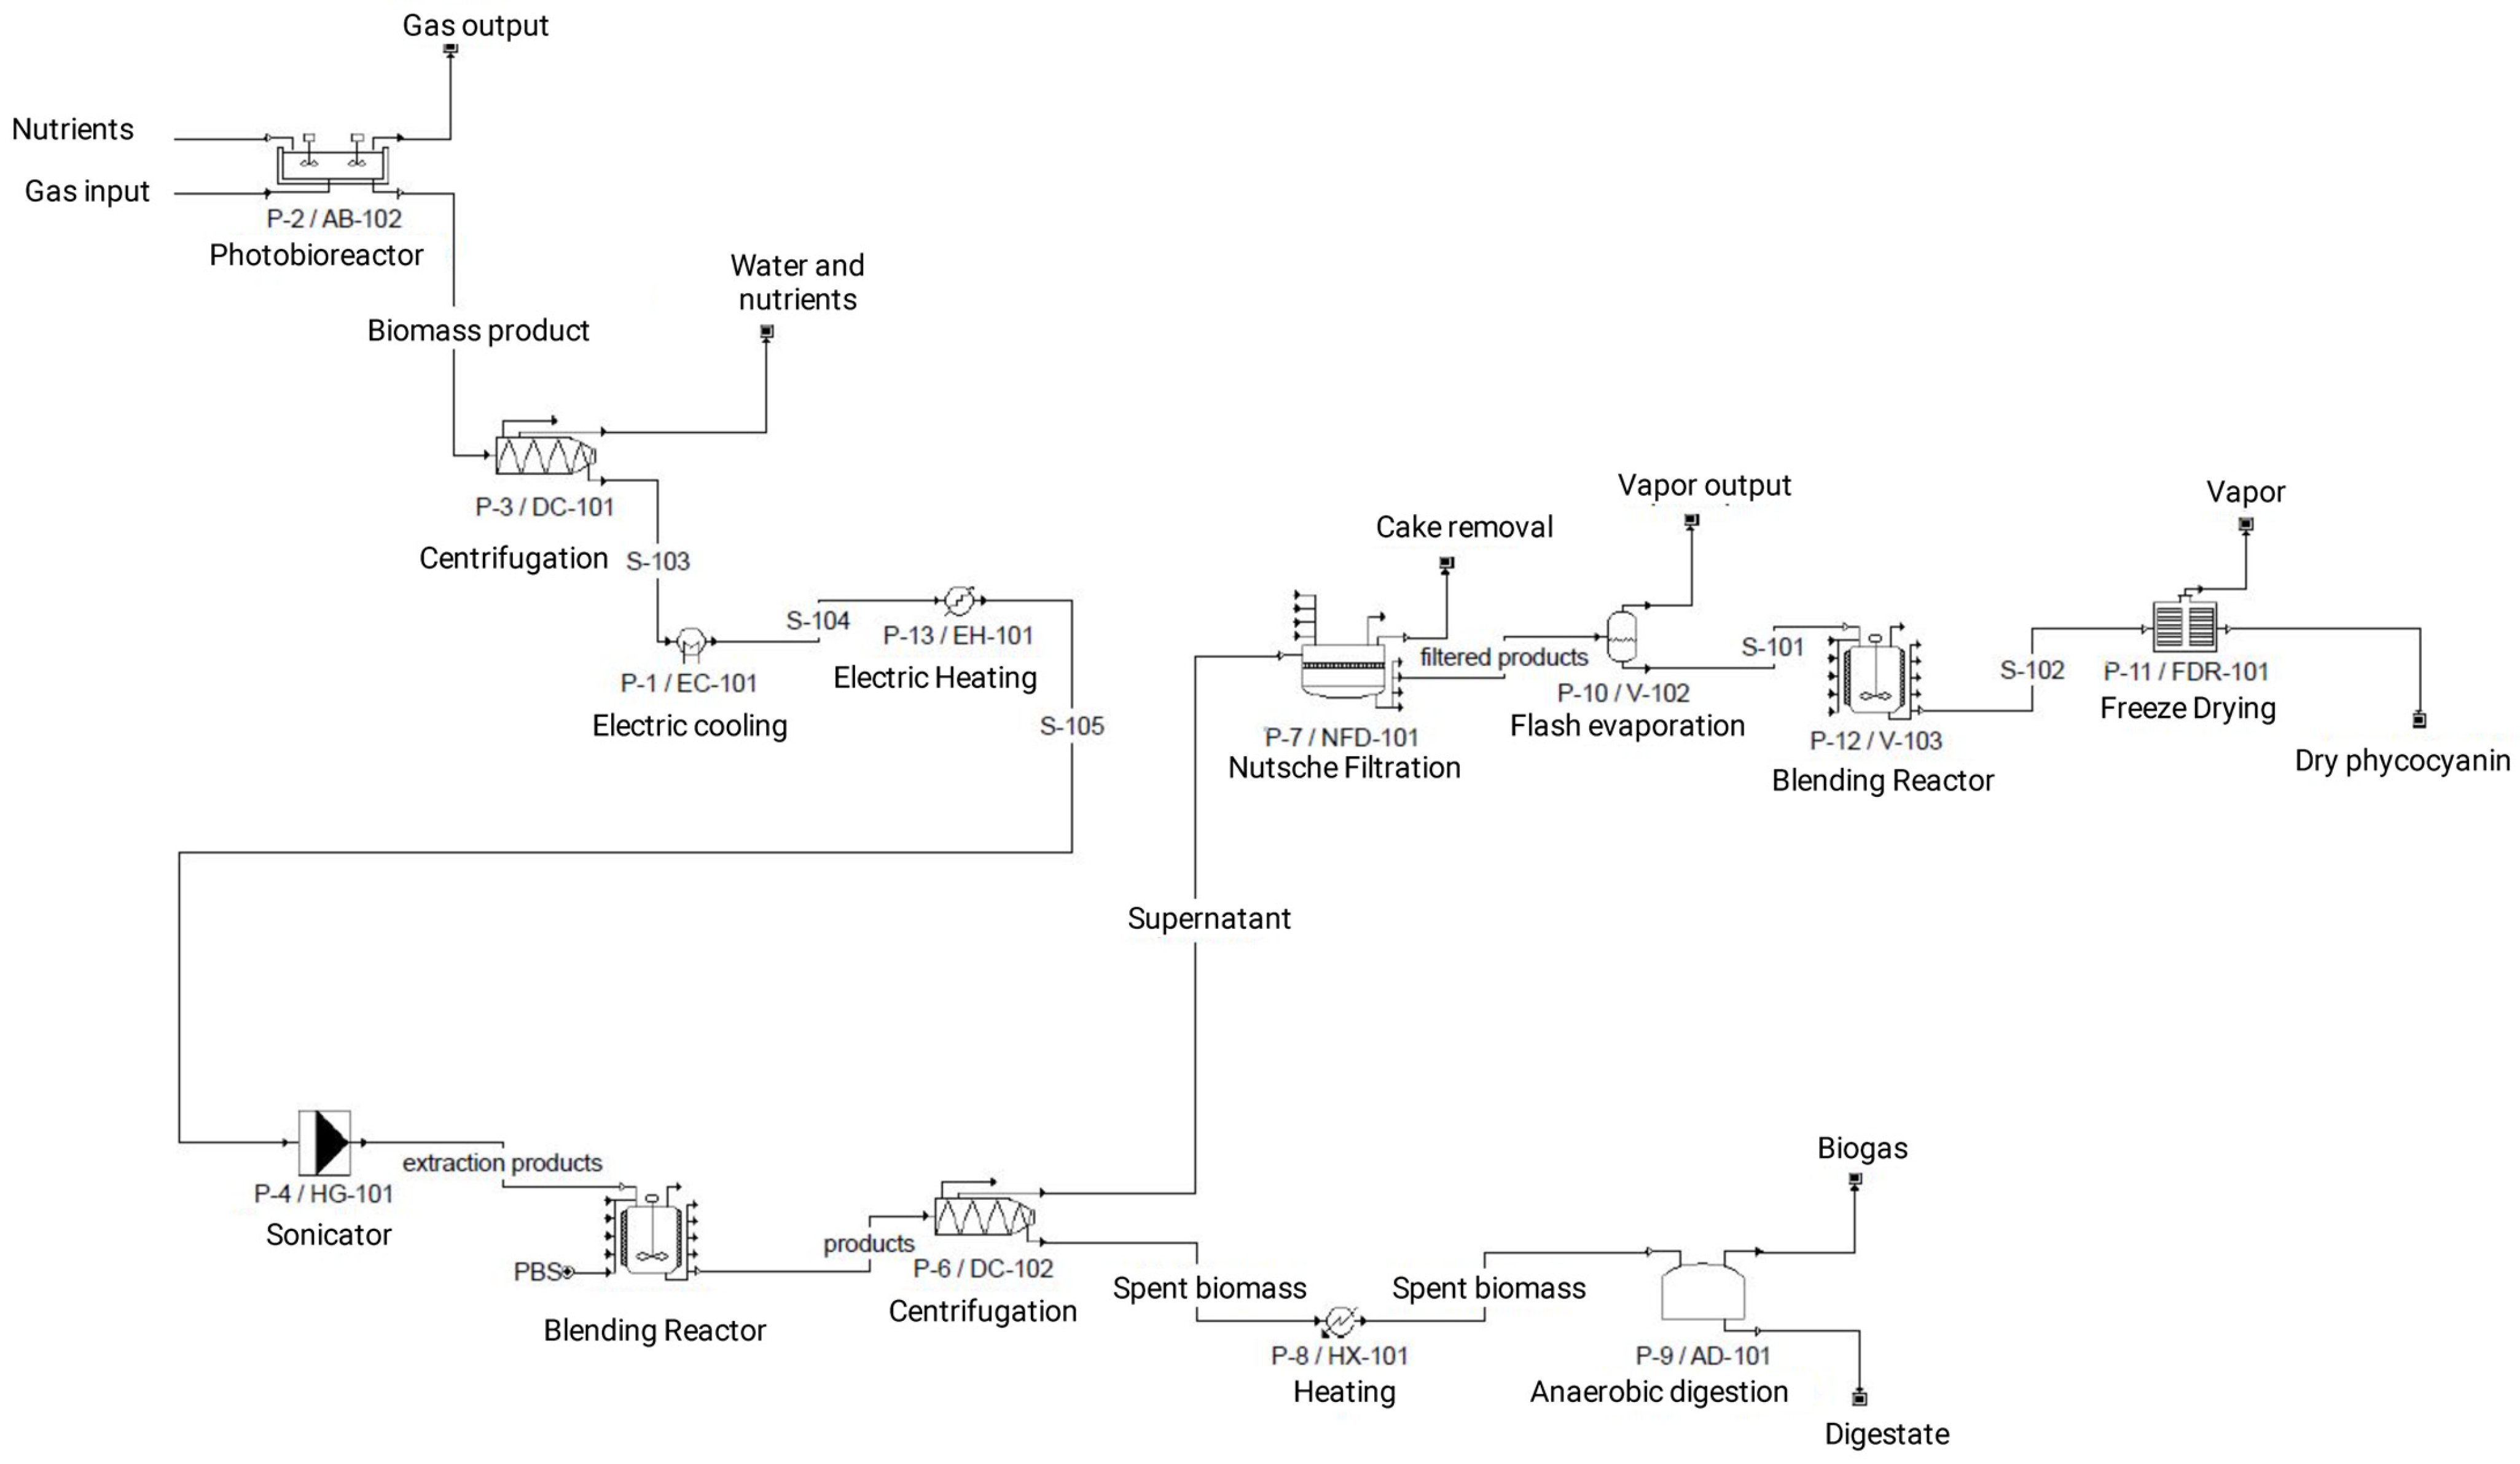
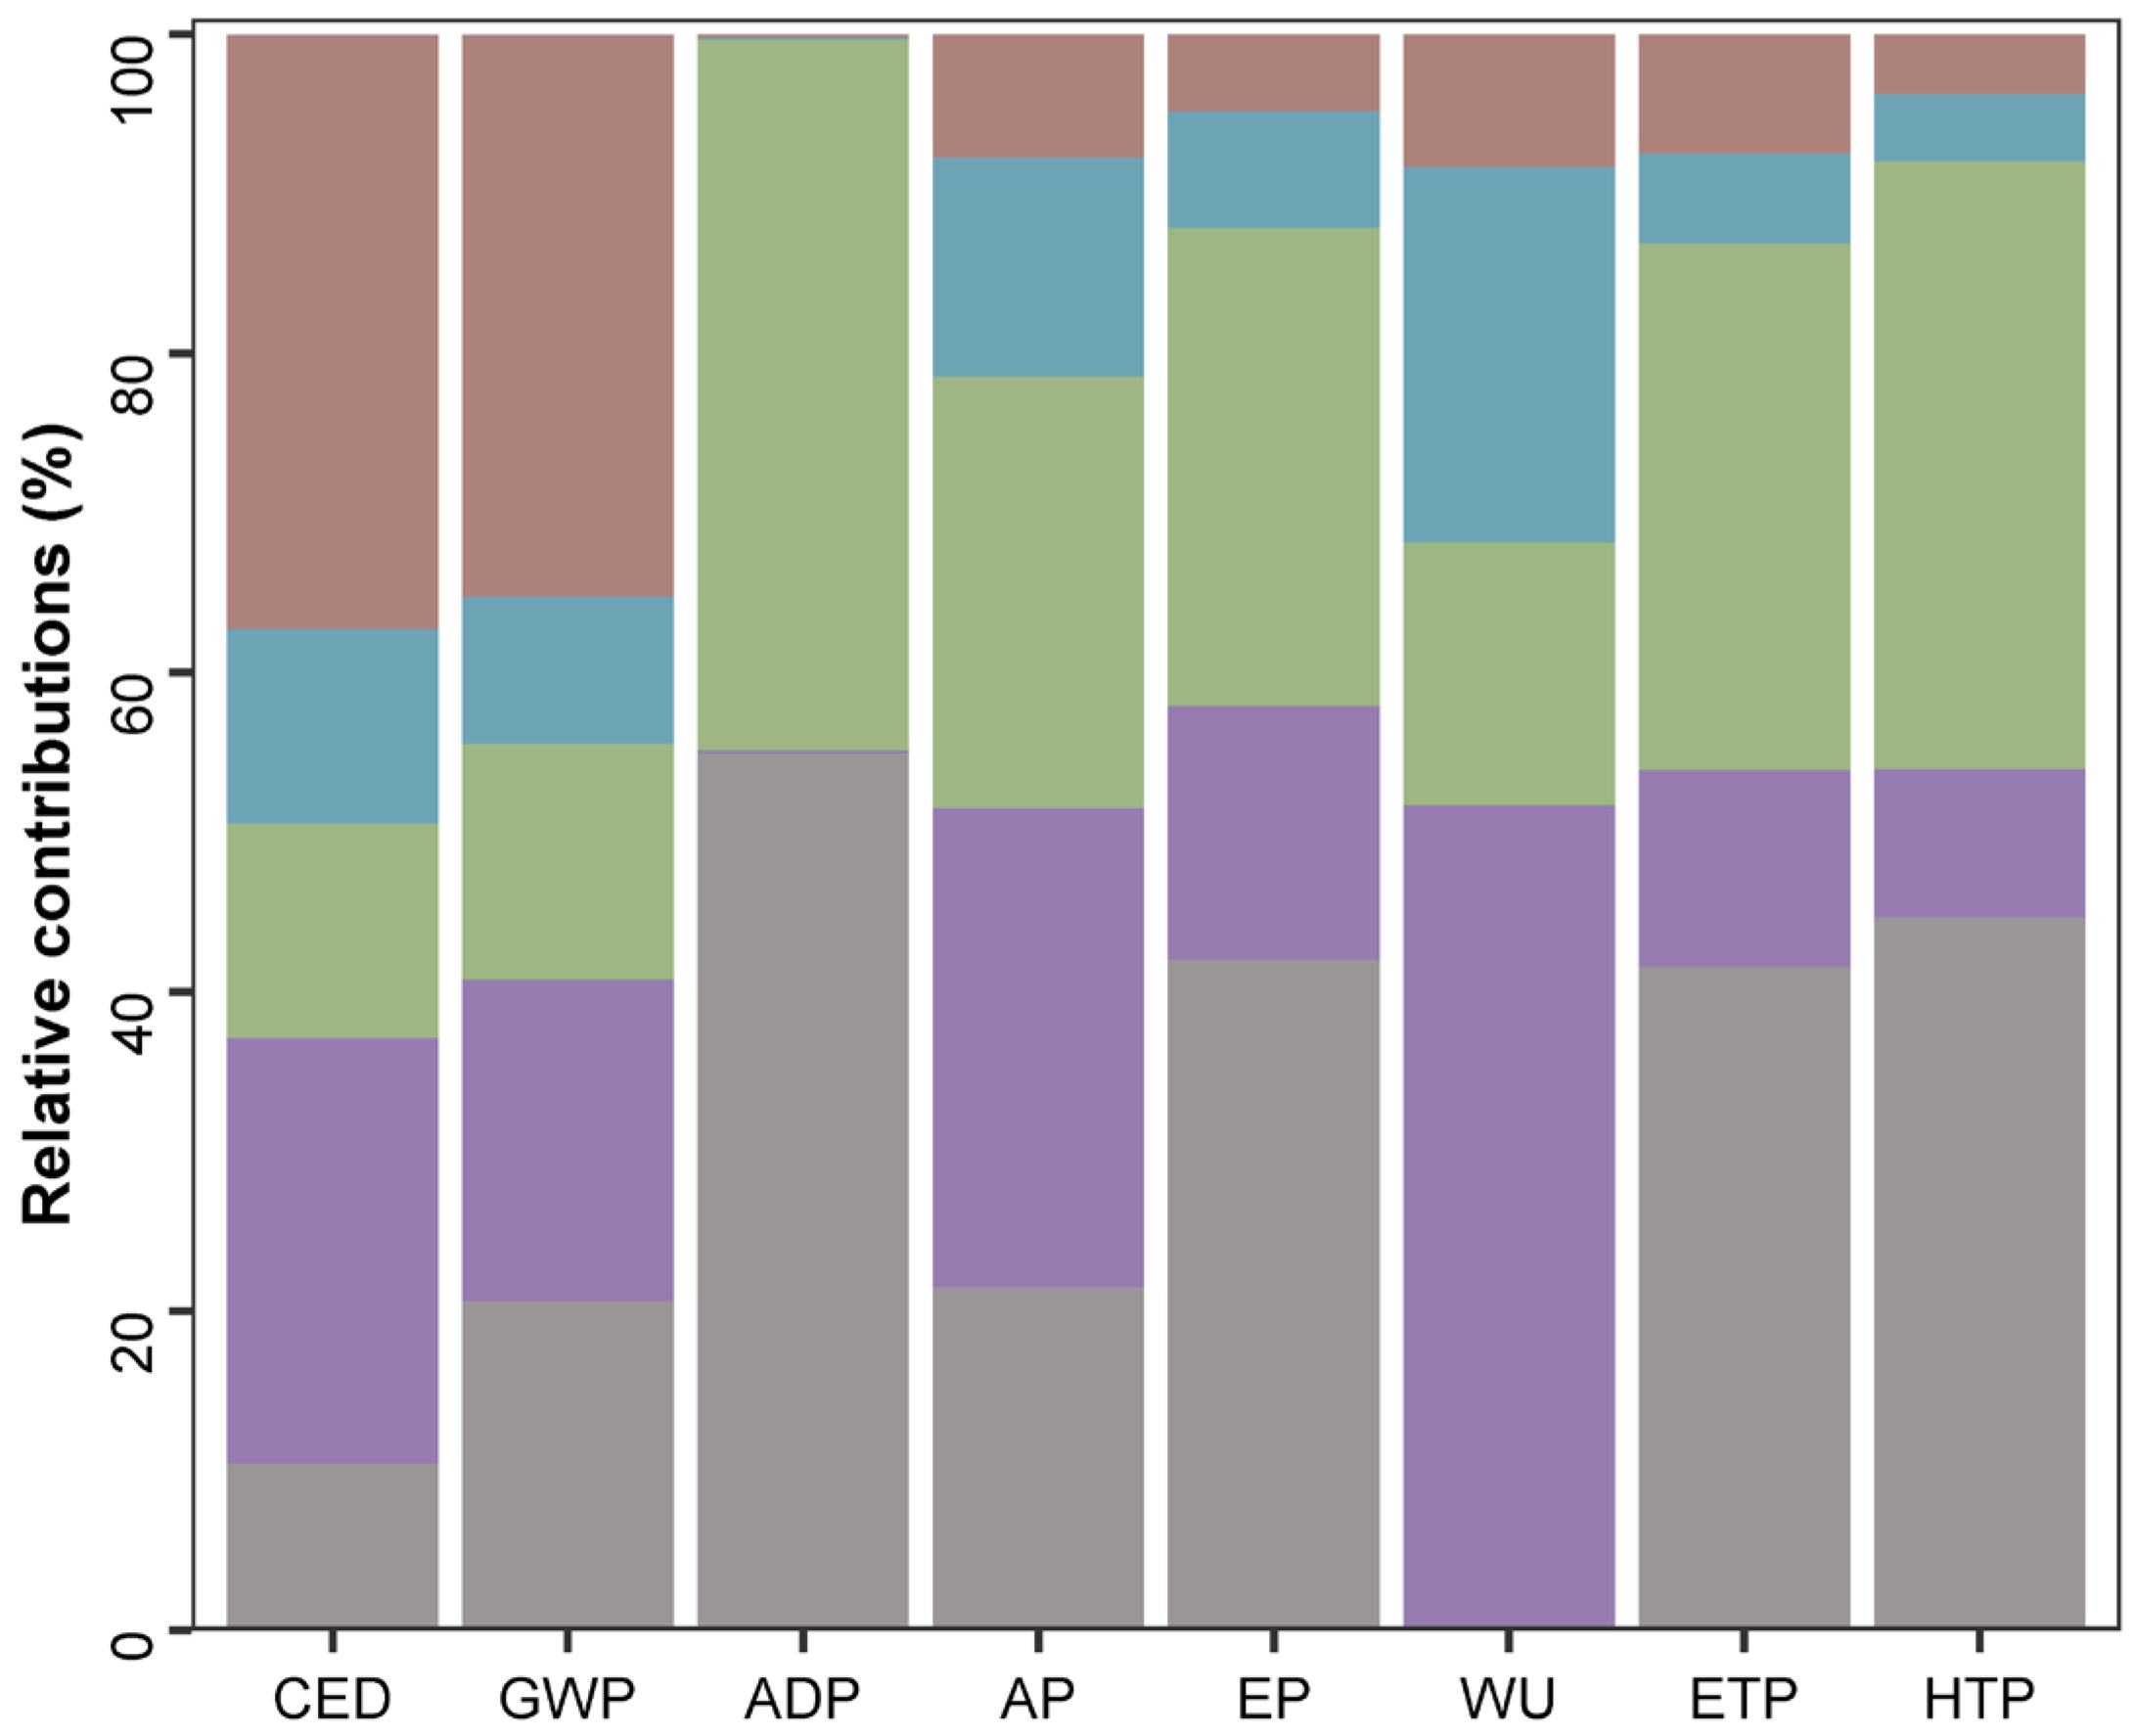
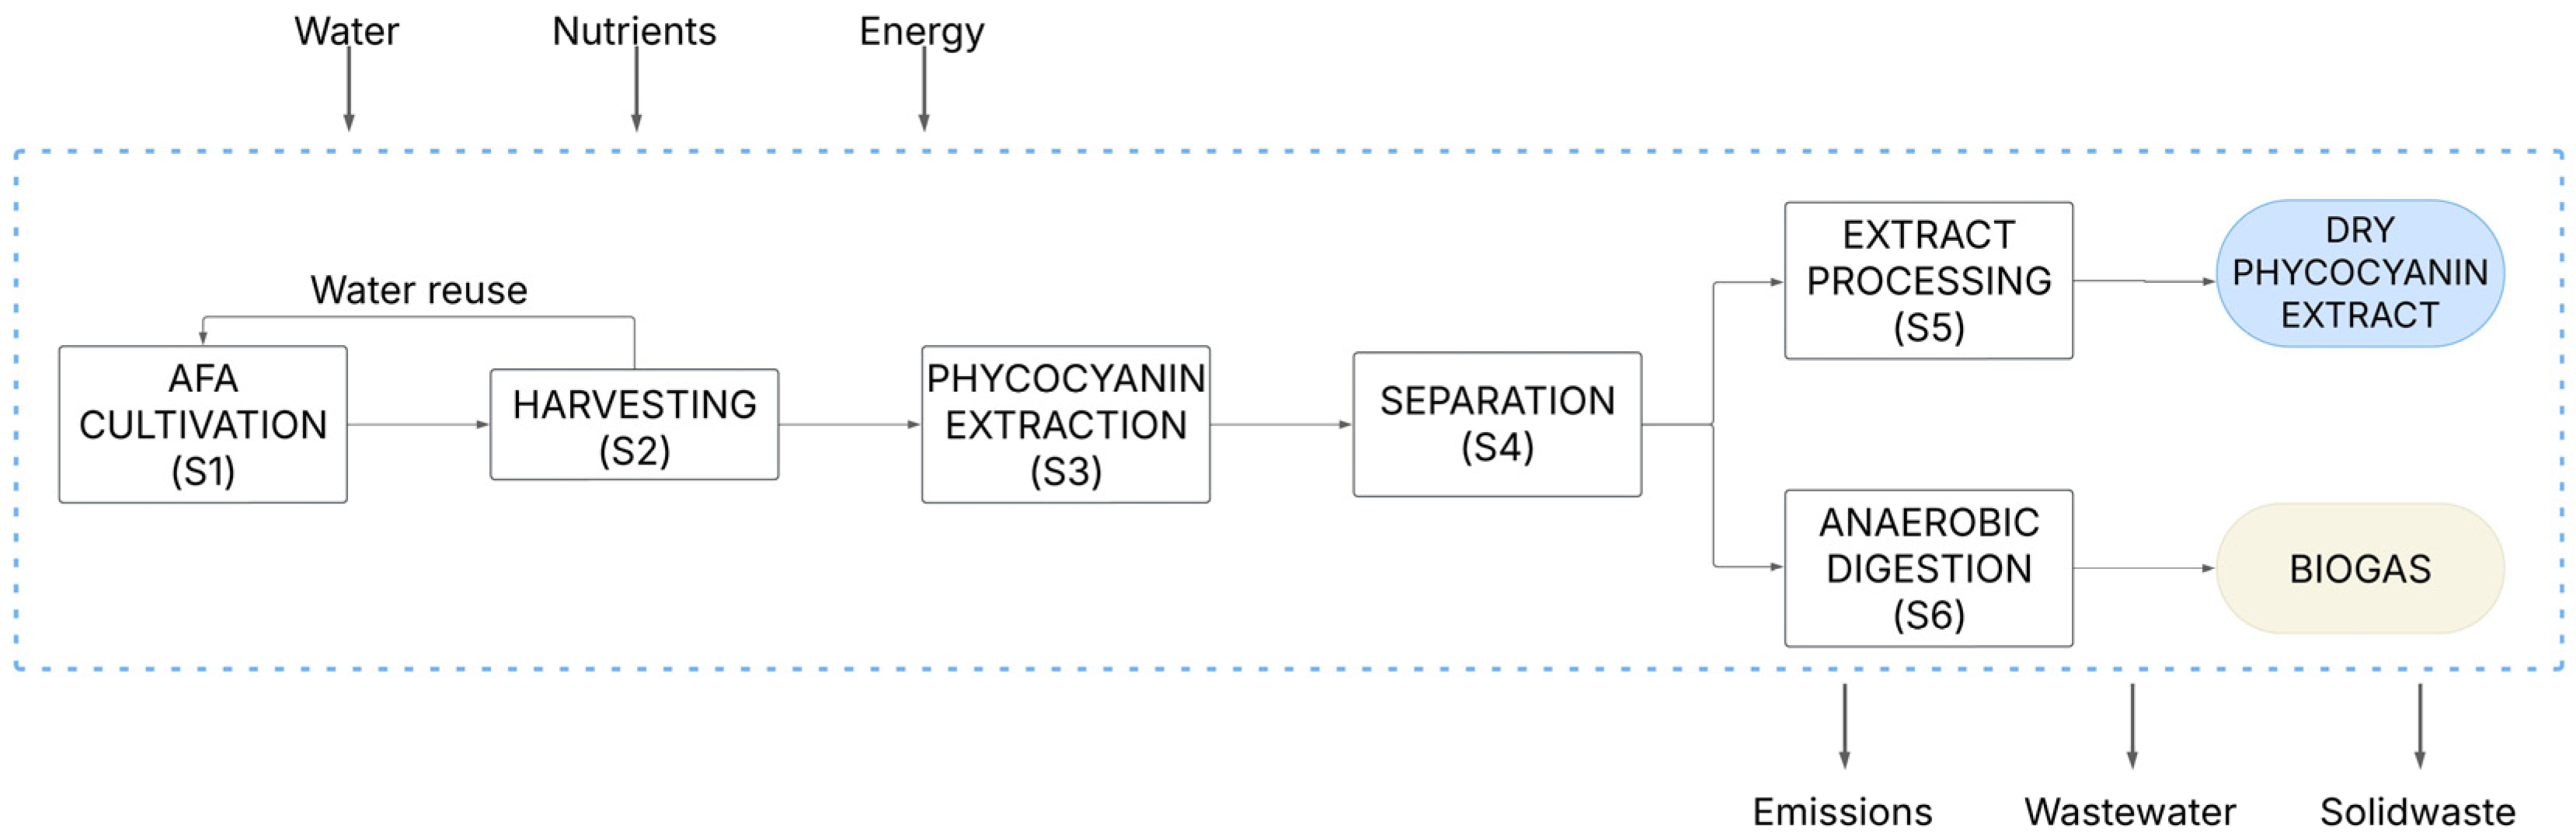
2.3. Life-Cycle Assessment
3. Materials and Methods
3.1. Cyanobacterium
3.2. Phycocyanin Extraction
3.2.1. Analysis of the Phycocyanin Extracts
Antioxidant Power
Cytotoxicity in Two Cancer Cell Lines
3.3. Biogas Production from the Spent Biomass
3.4. Statistical Analysis
3.5. Life Cycle Assessment
4. Conclusions
Author Contributions
Funding
Institutional Review Board Statement
Data Availability Statement
Conflicts of Interest
Abbreviations
| ABTS•+ | 2,2′-azino-bis(3-ethylbenzothiazoline-6-sulfonic acid |
| ADP | Abiotic depletion |
| AP | Acidification potential |
| C-PC Eq | C-phycocyanin equivalents |
| CED | Cumulative energy demand |
| COD | Chemical oxygen demand |
| EP | Eutrophication potential |
| ETP | Eco-toxicity potential |
| FU | Functional unit |
| GWP | Global warming potential |
| HCC1806 | Breast cancer cell line |
| HTP | Human toxicity potential |
| ISR | Inoculum-to-substrate ratio |
| LCA | Life cycle assessment |
| PC | Phycocyanin |
| TS | Total solids |
| U-118 MG | Brain glioma cell line |
| VCEAC | Vitamin C equivalents |
| VS | Volatile solids |
| WU | Water use |
Appendix A

| 4:1 | 2:1 | ||||
|---|---|---|---|---|---|
| Parameter | Substrate | Day 0 | Day n * | Day 0 | Day n * |
| NH4+ (mg/L) | Initial biomass | 297 ± 16 | 1413 ± 11 | 263 ± 6 | 681 ± 35 |
| Spent biomass | 243.3 ± 4 | 1275 ± 29 | 287 ± 2 | 656 ± 22 | |
| COD (mg/L) | Initial biomass | 2652 ± 183 | 6194 ± 83 | 2013 ± 91 | 320 ± 13 |
| Spent biomass | 2329 ± 82 | 4498 ± 216 | 472 ± 1 | 265 ± 3 | |
| Total nitrogen (mg/mL) | Initial biomass | 156 ± 2 | 546 ± 28 | 195 ± 0 | 289 ± 0 |
| Spent biomass | 113 ± 0 | 531 ± 27 | 152 ± 6 | 240 ± 20 | |
| Total phosphate (mg/mL) | Initial biomass | 727 ± 11 | 1400 ± 118 | 266 ± 3 | 228 ± 6 |
| Spent biomass | 605 ± 24 | 1312 ± 70 | 176 ± 4 | 334 ± 12 | |
| pH | Initial biomass | 6.3 ± 2 × 10⁻² | 5.3 ± 2 × 10⁻² | 6.9 ± 3 × 10⁻² | 7.9 ± 5 × 10⁻² |
| Spent biomass | 6.4 ± 0 | 5.3 ± 2 × 10⁻² | 7.0 ± 4 × 10⁻² | 7.9 ± 9 × 10⁻² | |
| ID | Initial Biomass (mg) | Solvent Volume (mL) | A615 | A652 | Dilution | PC (mg/g) |
|---|---|---|---|---|---|---|
| 17 | 501.8 | 28 | 1.172 | 0.733 | 0.2 | 43.08 |
| 18 | 505.9 | 28 | 1.138 | 0.709 | 0.2 | 41.60 |
| 19 | 506.0 | 28 | 1.148 | 0.716 | 0.2 | 41.92 |
| 20 | 503.4 | 28 | 1.116 | 0.694 | 0.2 | 41.02 |
| 21 | 509.7 | 28 | 1.156 | 0.721 | 0.2 | 41.90 |
| 22 | 502.0 | 28 | 1.155 | 0.722 | 0.2 | 42.46 |
| 23 | 500.2 | 28 | 1.123 | 0.700 | 0.2 | 41.47 |
| 24 | 505.1 | 28 | 1.134 | 0.706 | 0.2 | 41.52 |
References
- Hamouda, R.A.; El-Naggar, E.-A. Cyanobacteria-Based Microbial Cell Factories for Production of Industrial Products. In Microbial Cell Factories Engineering for Production of Biomolecules; Singh, V., Ed.; Academic Press: Cambridge, MA, USA, 2021; pp. 277–302. [Google Scholar] [CrossRef]
- Khan, A.Z.; Bilal, M.; Mehmood, S.; Sharma, A.; Iqbal, H.M.N. State-of-the-Art Genetic Modalities to Engineer Cyanobacteria for Sustainable Biosynthesis of Biofuel and Fine-Chemicals to Meet Bio–Economy Challenges. Life 2019, 9, 54. [Google Scholar] [CrossRef] [PubMed]
- Lucato, V.; Sut, S.; Abiusi, F.; Mathys, A.; Dall’Acqua, S.; Sforza, E. From Nitrogen to Protein: Harnessing the Power of Nitrogen-Fixing Cyanobacteria for Protein-Rich Biomass Production. ACS Sustain. Chem. Eng. 2024, 12, 7693–7702. [Google Scholar] [CrossRef]
- Tiwari, A.K.; Tiwari, B.S. Cyanotherapeutics: An Emerging Field for Future Drug Discovery. Appl. Phycol. 2020, 1, 44–57. [Google Scholar] [CrossRef]
- Scoglio, G.D.; Jackson, H.O.; Purton, S. The Commercial Potential of Aphanizomenon flos-aquae, a Nitrogen-Fixing Edible Cyanobacterium. J. Appl. Phycol. 2024, 36, 1593–1617. [Google Scholar] [CrossRef]
- Laamanen, M.J.; Forsström, L.; Sivonen, K. Diversity of Aphanizomenon flos-aquae (Cyanobacterium) Populations Along a Baltic Sea Salinity Gradient. Appl. Environ. Microbiol. 2002, 68, 5296–5303. [Google Scholar] [CrossRef]
- Syrpas, M.; Bukauskaite, J.; Ramanauskiene, K.; Karosiene, J.R.; Majiene, D.; Bašinskiene, L.; Venskutonis, P.R. Ultrasound-Assisted Extraction and Assessment of Biological Activity of Phycobiliprotein-Rich Aqueous Extracts from Wild Cyanobacteria (Aphanizomenon flos-aquae). J. Agric. Food. Chem. 2020, 68, 1896–1909. [Google Scholar] [CrossRef]
- Benedetti, S.; Benvenuti, F.; Pagliarani, S.; Francogli, S.; Scoglio, S.; Canestrari, F. Antioxidant Properties of a Novel Phycocyanin Extract from the Blue-Green Alga Aphanizomenon flos-aquae. Life Sci. 2004, 75, 2353–2362. [Google Scholar] [CrossRef]
- Overlingė, D.; Toruńska-Sitarz, A.; Cegłowska, M.; Szubert, K.; Mazur-Marzec, H. Phylogenetic and Molecular Characteristics of Two Aphanizomenon Strains from the Curonian Lagoon, Southeastern Baltic Sea and Their Biological Activities. Sci. Rep. 2024, 14, 24686. [Google Scholar] [CrossRef]
- Đorđević, N.B.; Vukajlović, J.T.; Milošević-Đorđević, O.; Mihailović, V.B.; Srećković, N.Z.; Rakonjac, A.B.; Simić, S.B. Evaluation of Genotoxic and Hemolytic Effects of Aphanizomenon flos-aquae and Microcystis aeruginosa Biomass Extracts on Human Blood Cells In Vitro. Microorganisms 2024, 12, 2208. [Google Scholar] [CrossRef]
- Lyon-Colbert, A.; Su, S.; Cude, C. A Systematic Literature Review for Evidence of Aphanizomenon flos-aquae Toxigenicity in Recreational Waters and Toxicity of Dietary Supplements: 2000–2017. Toxins 2018, 10, 254. [Google Scholar] [CrossRef]
- Šulčius, S.; Pilkaityte, R.; Mazur-Marzec, H.; KasperovičienE, J.; Ezhova, E.; Błaszczyk, A.; Paškauskas, R. Increased Risk of Exposure to Microcystins in the Scum of the Filamentous Cyanobacterium Aphanizomenon flos-aquae Accumulated on the Western Shoreline of the Curonian Lagoon. Mar. Pollut. Bull. 2015, 99, 264–270. [Google Scholar] [CrossRef] [PubMed]
- Preece, E.P.; Hardy, F.J.; Moore, B.C.; Bryan, M. A Review of Microcystin Detections in Estuarine and Marine Waters: Environmental Implications and Human Health Risk. Harmful Algae 2017, 61, 31–45. [Google Scholar] [CrossRef]
- Benedetti, S.; Rinalducci, S.; Benvenuti, F.; Francogli, S.; Pagliarani, S.; Giorgi, L.; Micheloni, M.; D’Amici, G.M.; Zolla, L.; Canestrari, F. Purification and Characterization of Phycocyanin from the Blue-Green Alga Aphanizomenon flos-aquae. Proc. J. Chromatogr. B Anal. Technol. Biomed. Life Sci. 2006, 833, 12–18. [Google Scholar] [CrossRef] [PubMed]
- Romay, C.; Armesto, J.; Remirez, D.; González, R.; Ledon, N.; García, I. Antioxidant and Anti-Inflammatory Properties of C-Phycocyanin from Blue-Green Algae. Inflamm. Res. 1998, 47, 36–41. [Google Scholar] [CrossRef]
- Ravi, M.; Tentu, S.; Baskar, G.; Rohan Prasad, S.; Raghavan, S.; Jayaprakash, P.; Jeyakanthan, J.; Rayala, S.K.; Venkatraman, G. Molecular Mechanism of Anti-Cancer Activity of Phycocyanin in Triple-Negative Breast Cancer Cells. BMC Cancer 2015, 15, 768. [Google Scholar] [CrossRef]
- Fernández-Rojas, B.; Hernández-Juárez, J.; Pedraza-Chaverri, J. Nutraceutical Properties of Phycocyanin. J. Funct. Foods 2014, 11, 375–392. [Google Scholar] [CrossRef]
- Liu, Q.; Huang, Y.; Zhang, R.; Cai, T.; Cai, Y. Medical Application of Spirulina platensis Derived C-Phycocyanin: Evidence-Based Complementary and Alternative Medicine. Nutrients 2016, 2016, 7803846. [Google Scholar] [CrossRef]
- Citi, V.; Torre, S.; Flori, L.; Usai, L.; Aktay, N.; Dunford, N.T.; Lutzu, G.A.; Nieri, P. Nutraceutical Features of the Phycobiliprotein C-Phycocyanin: Evidence from Arthrospira platensis (Spirulina). Nutrients 2024, 16, 1752. [Google Scholar] [CrossRef]
- Benedetti, S.; Benvenuti, F.; Scoglio, S.; Canestrari, F. Oxygen Radical Absorbance Capacity of Phycocyanin and Phycocyanobilin from the Food Supplement Aphanizomenon flos-aquae. J. Med. Food 2010, 13, 223–227. [Google Scholar] [CrossRef]
- Bechelli, J.; Coppage, M.; Rosell, K.; Liesveld, J. Cytotoxicity of Algae Extracts on Normal and Malignant Cells. Leuk. Res. Treat. 2011, 2011, 373519. [Google Scholar] [CrossRef]
- Obrador, E.; Moreno-Murciano, P.; Oriol-Caballo, M.; López-Blanch, R.; Pineda, B.; Gutiérrez-Arroyo, J.L.; Loras, A.; Gonzalez-Bonet, L.G.; Martinez-Cadenas, C.; Estrela, J.M.; et al. Glioblastoma Therapy: Past, Present and Future. Int. J. Mol. Sci. 2024, 25, 2529. [Google Scholar] [PubMed]
- Loibl, S.; Poortmans, P.; Morrow, M.; Denkert, C.; Curigliano, G. Breast Cancer. Lancet 2021, 397, 1750–1769. [Google Scholar] [CrossRef] [PubMed]
- Monlau, F.; Suarez-Alvarez, S.; Lallement, A.; Vaca-Medina, G.; Giacinti, G.; Munarriz, M.; Urreta, I.; Raynaud, C.; Ferrer, C.; Castañón, S. A Cascade Biorefinery for the Valorization of Microalgal Biomass: Biodiesel, Biogas, Fertilizers and High Valuable Compounds. Algal Res. 2021, 59, 102433. [Google Scholar] [CrossRef]
- Mendoza, Á.; Morales, V.; Sánchez-Bayo, A.; Rodríguez-Escudero, R.; González-Fernández, C.; Bautista, L.F.; Vicente, G. The Effect of the Lipid Extraction Method Used in Biodiesel Production on the Integrated Recovery of Biodiesel and Biogas from Nannochloropsis gaditana, Isochrysis galbana and Arthrospira platensis. Biochem. Eng. J. 2020, 154, 107428. [Google Scholar] [CrossRef]
- Sánchez-Bayo, A.; López-Chicharro, D.; Morales, V.; Espada, J.J.; Puyol, D.; Martínez, F.; Astals, S.; Vicente, G.; Bautista, L.F.; Rodríguez, R. Biodiesel and Biogas Production from Isochrysis galbana Using Dry and Wet Lipid Extraction: A Biorefinery Approach. Renew. Energy 2020, 146, 188–195. [Google Scholar] [CrossRef]
- Águila-Carricondo, P.; García-García, R.; de la Roche, J.P.; Galán, P.L.; Bautista, L.F.; Vicente, G. Can Mild Alkaline Pretreatment Simultaneously Enhance the Antioxidant Capacity of Beta-Carotene Extracts and Biomethane Yields in a Sustainable Dunaliella salina Biorefinery? Biomass Bioenergy 2024, 191, 107474. [Google Scholar] [CrossRef]
- Chen, Q.; Li, S.; Xiong, H.; Zhao, Q. Effect of Different Extraction Methods on Physicochemical Characteristics and Antioxidant Activity of C-Phycocyanin from Dry Biomass of Arthrospira platensis. Foods 2022, 11, 1296. [Google Scholar] [CrossRef]
- Macário, I.P.E.; Veloso, T.; Fernandes, A.P.M.; Martins, M.; Dias, T.R.; Oliveira, H.; Gonçalves, F.J.M.; Ventura, S.P.M.; Pereira, J.L. Blue Is Not Enough: Biological Activities of C-Phycocyanin Extracts from Anabaena cylindrica. J. Chem. Technol. Biotechnol. 2022, 97, 1171–1179. [Google Scholar] [CrossRef]
- Yu, Y.; Hou, X.; Yu, Q.; Huo, Y.; Wang, K.; Wen, X.; Ding, Y.; Li, Y.; Wang, Z. A Novel Two-Stage Culture Strategy to Enhance the C-Phycocyanin Productivity and Purity of Arthrospira platensis. LWT 2023, 184, 115010. [Google Scholar] [CrossRef]
- Sánchez-Laso, J.; Espada, J.J.; Rodríguez, R.; Vicente, G.; Bautista, L.F. Novel Biorefinery Approach for Phycocyanin Extraction and Purification and Biocrude Production from Arthrospira platensis. Ind. Eng. Chem. Res. 2023, 62, 5190–5198. [Google Scholar] [CrossRef]
- Paramanya, A.; Oyesiji Abiodun, A.; Shamsul Ola, M.; Ali, A. Enhancing the Quality and Antioxidant Capacity of Phycocyanin Extracted from Spirulina platensis PCC 7345: A Quality-by-Design Approach. Arab. J. Chem. 2024, 17, 105653. [Google Scholar] [CrossRef]
- Kavut, M.; Ozturk Urek, R. Phycocyanin from Arthrospira platensis M2: Mixotrophic Production, Extraction, Partial Purification, and Investigation of Some Biochemical Properties. J. Food Meas. Charact. 2024, 19, 603–618. [Google Scholar] [CrossRef]
- Bougatef, H.; Hadrich, F.; Gazbar, M.; Sila, A.; Chamkha, M.; Bougatef, A. Development of a Novel Method for the Extraction of Phycocyanin Pigment from Spirulina platensis and Assessment of Its Antioxidant, Antimicrobial, and Anticancer Activities. Biomass Convers. Biorefinery 2024, 15, 8001–8013. [Google Scholar] [CrossRef]
- Alotaiby, S.; Zhao, X.; Boesch, C.; Sergeeva, N.N. Sustainable Approach Towards Isolation of Photosynthetic Pigments from Spirulina and the Assessment of Their Prooxidant and Antioxidant Properties. Food Chem. 2024, 436, 137653. [Google Scholar] [CrossRef]
- Karan, T.; Aydin, A. Anticancer Potential and Cytotoxic Effect of Some Freshwater Cyanobacteria. Trop. J. Pharm. Res. 2018, 17, 2183–2188. [Google Scholar] [CrossRef]
- Sflomos, G.; Dormoy, V.; Metsalu, T.; Jeitziner, R.; Battista, L.; Scabia, V.; Raffoul, W.; Delaloye, J.F.; Treboux, A.; Fiche, M.; et al. A Preclinical Model for ERα-Positive Breast Cancer Points to the Epithelial Microenvironment as Determinant of Luminal Phenotype and Hormone Response. Cancer Cell. 2016, 29, 407–422. [Google Scholar] [CrossRef]
- Li, Y.; Hua, D.; Zhang, J.; Gao, M.; Zhao, Y.; Xu, H.; Liang, X.; Jin, F.; Zhang, X. Influence of Inoculum to Substrate Ratios (ISRs) on the Performance of Anaerobic Digestion of Algal Residues. Ann. Microbiol. 2014, 64, 955–960. [Google Scholar] [CrossRef]
- Mendez, L.; Mahdy, A.; Ballesteros, M.; González-Fernández, C. Chlorella vulgaris vs Cyanobacterial Biomasses: Comparison in Terms of Biomass Productivity and Biogas Yield. Energy Convers. Manag. 2015, 92, 137–142. [Google Scholar] [CrossRef]
- Mussgnug, J.H.; Klassen, V.; Schlüter, A.; Kruse, O. Microalgae as Substrates for Fermentative Biogas Production in a Combined Biorefinery Concept. J. Biotechnol. 2010, 150, 51–56. [Google Scholar] [CrossRef]
- Parimi, N.S.; Singh, M.; Kastner, J.R.; Das, K.C. Biomethane and Biocrude Oil Production from Protein Extracted Residual Spirulina Platensis. Energy 2015, 93, 697–704. [Google Scholar] [CrossRef]
- Sumprasit, N.; Wagle, N.; Glanpracha, N.; Annachhatre, A.P. Biodiesel and Biogas Recovery from Spirulina Platensis. Int. Biodeterior. Biodegrad. 2017, 119, 196–204. [Google Scholar] [CrossRef]
- Bellver, M.; Ruales, E.; Díez-Montero, R.; Escolà Casas, M.; Matamoros, V.; Ferrer, I. Natural Pigments and Biogas Recovery from Cyanobacteria Grown in Treated Wastewater. Fate of Organic Microcontaminants. Water Res. 2025, 273, 123005. [Google Scholar] [CrossRef] [PubMed]
- Rempel, A.; de Souza Sossella, F.; Margarites, A.C.; Astolfi, A.L.; Steinmetz, R.L.R.; Kunz, A.; Treichel, H.; Colla, L.M. Bioethanol from Spirulina platensis Biomass and the Use of Residuals to Produce Biomethane: An Energy Efficient Approach. Bioresour. Technol. 2019, 288, 121588. [Google Scholar] [CrossRef] [PubMed]
- Granhen Tavares, C.R.; Telles Benatti, C.; Prado Dias Filho, B.; Ribeiro Moitinho, M.d.L. Operation of a Slow Rate Anaerobic Digester Treating Municipal Secondary Sludge. Electron. J. Biotechnol. 2002, 5, 9–10. [Google Scholar] [CrossRef]
- Yenigün, O.; Demirel, B. Ammonia Inhibition in Anaerobic Digestion: A Review. Process. Biochem. 2013, 48, 901–911. [Google Scholar] [CrossRef]
- Nadeem Iqbal, M.; Chishti, Z.; Raza, N.; Umair, A.; Abbas, Z.; Riaz Ahmad, H.; Khalid, M.; Hamid, S.; Mehmood Mughal, K.; Haider, I. Exploring the best np ratio for wheat in perspective of present farmers’ budget for fertilizer. Abasyn J. Life Sci. 2021, 4, 100–108. [Google Scholar] [CrossRef]
- Cogo Badan, I.; Jung, S.H.; Singh, R.; Vivekanand, V.; Knappert, J.; Rauh, C.; Lindenberger, C. Life Cycle Assessment of Exopolysaccharides and Phycocyanin Production with Arthrospira platensis. Fermentation 2024, 10, 163. [Google Scholar] [CrossRef]
- Papadaki, S.; Kyriakopoulou, K.; Tzovenis, I.; Krokida, M. Environmental Impact of Phycocyanin Recovery from Spirulina platensis Cyanobacterium. Innov. Food Sci. Emerg. Technol. 2017, 44, 217–223. [Google Scholar] [CrossRef]
- Braud, L.; McDonnell, K.; Murphy, F. Beyond Phycocyanin: Environmental Life Cycle Assessment of a European Pilot Scale Spirulina Biorefinery. Bioresour. Technol. Rep. 2025, 29, 102027. [Google Scholar] [CrossRef]
- Sánchez-Laso, J.; Piera, A.; Vicente, G.; Bautista, L.F.; Rodríguez, R.; Espada, J.J. A Successful Method for Phycocyanin Extraction from Arthrospira platensis Using [Emim] [EtSO4] Ionic Liquid. Biofuels Bioprod. Biorefining 2021, 15, 1638–1649. [Google Scholar] [CrossRef]
- Bennett, A.; Bogorad, L. Complementary Chromatic Adaptation in a Filamentous Blue-Green Alga. J. Cell Biol. 1973, 58, 419–435. [Google Scholar] [CrossRef] [PubMed]
- Re, R.; Pellegrini, N.; Proteggente, A.; Pannala, A.; Yang, M.; Rice-Evans, C. Antioxidant Activity Applying an Improved ABTS Radical Cation Decolorization Assay. Free Radic. Biol. Med. 1999, 26, 1231–1237. [Google Scholar] [CrossRef] [PubMed]
- Águila-Carricondo, P.; de la Roche Cadavid, J.P.; Galán, P.L.; Bautista, L.F.; Vicente, G. New Green Biorefineries from Cyanobacterial-Microalgal Consortia: Production of Chlorophyll-Rich Extracts for the Cosmetic Industry and Sustainable Biogas. J. Clean. Prod. 2023, 429, 139652. [Google Scholar] [CrossRef]
| Biomolecule | Biochemical Characterization (%, Dry Basis) | Biomolecule Recovery (%) | |||
|---|---|---|---|---|---|
| IB | AE | SB | AE | SB | |
| Proteins | 65.7 ± 3.2 | 73.8 ± 4.7 | 77.6 ± 1.4 | 46.7 ± 2.8 | 30.5 ± 0.6 |
| Carbohydrates | 19.0 ± 0.3 | 20.8 ± 1.3 | 9.6 ± 0.6 | 45.6 ± 2.8 | 13.0 ± 0.8 |
| Lipids | 5.9 ± 0.1 | 1.8 ± 0.1 | 3.7 ± 2.7 | 12.6 ± 0.5 | 15.9 ± 2.5 |
| Ashes | 5.5 ± 0.0 | 3.6 ± 0.1 | 9.2 ± 0.4 | 27.0 ± 0.6 | 43.0 ± 0.3 |
| Total | 96.1 ± 3.6 | 100 ± 6.2 | 100.1 ± 5.1 | 43.2 ± 0.3 | 26.9 ± 0.1 |
| Antioxidant Indicator | Value |
|---|---|
| ABTS•+ radicals scavenging (%) | 77.0 ± 0.7% (2.4 mg/mL) |
| VCEAC (µg/mL) | 235 ± 2.1 |
| VCEAC (mmol/g dry extract) | 0.17 ± 1 × 10⁻³ |
| C-PC Eq (µg/mL) | 9971 ± 90 |
| ISR 1 | COD 2 | NH4+ 3 | C/N 4 | |
|---|---|---|---|---|
| Initial biomass | 4:1 | +2.4 | +4.8 | 6.6 ± 0.2 |
| Spent biomass | 4:1 | +1.9 | +5.2 | 6.6 ± 0.3 |
| Sludge | 4:1 | - | - | 7.9 ± 4.5 × 10⁻² |
| Initial biomass | 2:1 | −6.3 | +2.6 | 10.8 ± 0.2 |
| Spent biomass | 2:1 | −1.8 | +2.3 | 9.2 ± 0.3 |
| Sludge | 2:1 | - | - | 11.9 ± 0.3 |
| Biomass Cultivation (S1) | Harvesting (S2) | Extraction (S3) | Separation (S4) | Extract Processing (S5) | Anaerobic Digestion (S6) | Total | |
|---|---|---|---|---|---|---|---|
| CED (MJ) | 5.5 × 10⁵ | 1.4 × 10⁶ | 7.1 × 10⁵ | 6.4 × 10⁵ | 1.9 × 10⁶ | 1.5 × 10³ | 5.3 × 10⁶ |
| GWP (kg CO2 eq.) | 6.3 × 10⁴ | 6.1 × 10⁴ | 4.5 × 10⁴ | 2.8 × 10⁴ | 1.1 × 10⁵ | 8.3 × 10 | 3.1 × 10⁵ |
| ADP (kg Sb eq.) | 2.1 × 10 | 6.8 × 10⁻³ | 1.7 × 10 | 3.1 × 10⁻³ | 9.3 × 10⁻³ | 7.0 × 10⁻⁶ | 3.9 × 10 |
| AP (kg SO2 eq.) | 4.2 × 10² | 5.8 × 10² | 5.3 × 10² | 2.7 × 10² | 1.5 × 10² | 7.5 × 10⁻² | 1.9 × 10³ |
| EP (kg Phosphate eq.) | 3.0 × 10² | 1.1 × 10² | 2.1 × 10² | 5.2 × 10 | 3.5 × 10 | 1.9 × 10⁻² | 7.1 × 10² |
| WU (m3 world equiv.) | 6.6 × 10⁴ | 2.1 × 10⁷ | 6.6 × 10⁶ | 9.5 × 10⁶ | 3.4 × 10⁶ | 1.1 × 10³ | 4.0 × 10⁷ |
| ETP (kg DCB eq.) | 6.2 × 10² | 1.9 × 10² | 5.0 × 10² | 8.5 × 10 | 1.1 × 10² | 7.6 × 10⁻² | 1.5 × 10³ |
| HTP (kg DCB eq.) | 1.9 × 10⁵ | 2.3 × 10⁴ | 9.3 × 10⁴ | 1.0 × 10⁴ | 9.2 × 10³ | 5.6 × 10 | 2.4 × 10⁵ |
| S1: A. flos-aquae cultivation | Closed photobioreactor | Nutrients (NaH2PO4 + NaNO3) | Input | 52.6 × 10³ | kg |
| Water (reused + new input) | Input | 10.2 × 10⁷ | kg | ||
| Gas (air) | Input | 51.3 × 10⁶ | kg | ||
| Gas (CO2) | Input | 19.6 × 10³ | kg | ||
| Gas (air) | Output | 51.3 × 10⁶ | kg | ||
| Gas (CO2) | Output | 2.8 × 10³ | kg | ||
| Biomass | Output | 57.8 × 10³ | kg | ||
| S2: Harvesting | Centrifuge | Biomass | Input/output | 57.8 × 10³ | kg |
| Electricity | Input | 4.3 × 10⁵ | MJ | ||
| S3: Phycocyanin extraction | Electric cooler + electric heater +Sonicator | Biomass | Input | 57.8 × 10³ | kg |
| Extraction products | Output | 57.8 × 10³ | kg | ||
| Blending reactor | Extraction products | Input/output | 57.8 × 10³ | kg | |
| PBS (disodium phosphate + KH2PO4) | Input | 9.3 × 10³ | kg | ||
| Electricity (total S3) | Input | 1.4 × 10⁵ | MJ | ||
| S4: Separation | Centrifuge | Extraction products | Input | 57.8 × 10³ | kg |
| PBS (disodium phosphate + KH2PO4) | Input | 9.3 × 10³ | kg | ||
| Electricity | Input | 2.0 × 10⁵ | MJ | ||
| Supernatant | Output | 55.1 × 10³ | kg | ||
| Spent biomass | Output | 2.8 × 10⁴ | kg | ||
| S5: Extract processing | Nutsche filtration + Flash evaporator + Blending reactor + Freeze dryer | Supernatant | Input | 55.1 × 10³ | kg |
| Heat | Input | 1.3 × 10⁶ | MJ | ||
| Electricity (total S5) | Input | 4.3 × 10⁴ | MJ | ||
| Dry phycocyanin extract | Output | 10 | tons | ||
| S6: Anaerobic digestion | Heating + Anaerobic digestion | Spent biomass | Input | 2.8 × 10⁴ | kg |
| Heat | Input | 1.1 × 10³ | MJ | ||
| Biogas | Output | 3.5 | tons | ||
| CO2 | Output | 2.4 | tons | ||
| CH4 | Output | 1.1 | tons | ||
| Digestate | Output | 24 | tons |
Disclaimer/Publisher’s Note: The statements, opinions and data contained in all publications are solely those of the individual author(s) and contributor(s) and not of MDPI and/or the editor(s). MDPI and/or the editor(s) disclaim responsibility for any injury to people or property resulting from any ideas, methods, instructions or products referred to in the content. |
© 2025 by the authors. Licensee MDPI, Basel, Switzerland. This article is an open access article distributed under the terms and conditions of the Creative Commons Attribution (CC BY) license (https://creativecommons.org/licenses/by/4.0/).
Share and Cite
Águila-Carricondo, P.; García-García, R.; de la Roche, J.P.; Galán, P.L.; Bautista, L.F.; Espada, J.J.; Vicente, G. Aphanizomenon flos-aquae: A Biorefinery for Health and Energy—Unleashing Phycocyanin’s Power and Biogas Potential. Mar. Drugs 2025, 23, 225. https://doi.org/10.3390/md23060225
Águila-Carricondo P, García-García R, de la Roche JP, Galán PL, Bautista LF, Espada JJ, Vicente G. Aphanizomenon flos-aquae: A Biorefinery for Health and Energy—Unleashing Phycocyanin’s Power and Biogas Potential. Marine Drugs. 2025; 23(6):225. https://doi.org/10.3390/md23060225
Chicago/Turabian StyleÁguila-Carricondo, Pilar, Raquel García-García, Juan Pablo de la Roche, Pedro Luis Galán, Luis Fernando Bautista, Juan J. Espada, and Gemma Vicente. 2025. "Aphanizomenon flos-aquae: A Biorefinery for Health and Energy—Unleashing Phycocyanin’s Power and Biogas Potential" Marine Drugs 23, no. 6: 225. https://doi.org/10.3390/md23060225
APA StyleÁguila-Carricondo, P., García-García, R., de la Roche, J. P., Galán, P. L., Bautista, L. F., Espada, J. J., & Vicente, G. (2025). Aphanizomenon flos-aquae: A Biorefinery for Health and Energy—Unleashing Phycocyanin’s Power and Biogas Potential. Marine Drugs, 23(6), 225. https://doi.org/10.3390/md23060225