Article

Heteronemin and Tetrac Induce Anti-Proliferation by Blocking EGFR-Mediated Signaling in Colorectal Cancer Cells

1
Graduate Institute of Cancer Molecular Biology and Drug Discovery, College of Medical Science and Technology, Taipei Medical University and Academia Sinica, Taipei 11031, Taiwan
2
Division of Colorectal Surgery, Department of Surgery, Taipei Medical University Shuang Ho Hospital, Taipei 11031, Taiwan
3
Division of Colorectal Surgery, Department of Surgery, School of Medicine, College of Medicine, Taipei Medical University, Taipei 11031, Taiwan
4
School of Medicine, I-Shou University and Department of Pediatrics, E-DA Hospital, Kaohsiung 82445, Taiwan
5
Core Facility Center, Department of Research Development, Taipei Medical University, Taipei 11031, Taiwan
6
Department of Biochemistry and Molecular Cell Biology, College of Medicine, Taipei Medical University, Taipei 11031, Taiwan
7
Division of Cardiology, Department of Internal Medicine, Cathay General Hospital, Taipei 10630, Taiwan
8
Department of Immunology and Microbial Disease, Albany Medical College, Albany, NY 12208, USA
9
School of Dentistry, College of Oral Medicine, Taipei Medical University, Taipei 11031, Taiwan
10
Graduate Institute of Nanomedicine and Medical Engineering, College of Medical Engineering, Taipei Medical University, Taipei 11031, Taiwan
11
Graduate Institute of Cancer Molecular Biology and Drug Discovery, College of Medical Science and Technology, Taipei Medical University, Taipei 11031, Taiwan
12
TMU Research Center of Cancer Translational Medicine, Taipei Medical University, Taipei 11031, Taiwan
13
Traditional Herbal Medicine Research Center of Taipei Medical University Hospital, Taipei Medical University, Taipei 11031, Taiwan
14
Cancer Center, Wan Fang Hospital, Taipei Medical University, Taipei 11031, Taiwan
15
Pharmaceutical Research Institute, Albany College of Pharmacy and Health Sciences, Albany, NY 12208, USA
16
Department of Medicine, Albany Medical College, Albany, NY 12208, USA
17
Laboratory of Chemical Biology and Medicinal Chemistry, Institute of Chemistry, Academia Sinica, Taipei 10617, Taiwan
18
Doctoral Degree Program in Marine Biotechnology, National Sun Yat-Sen University, Kaohsiung 80424, Taiwan
*
Authors to whom correspondence should be addressed.
Mar. Drugs 2022, 20(8), 482; https://doi.org/10.3390/md20080482
Submission received: 27 June 2022 / Revised: 21 July 2022 / Accepted: 24 July 2022 / Published: 27 July 2022
(This article belongs to the Special Issue Development and Application of Marine-Derived Anti-cancer Agents)

Abstract

:
Overexpressed EGFR and mutant K-Ras play vital roles in therapeutic resistance in colorectal cancer patients. To search for an effective therapeutic protocol is an urgent task. A secondary metabolite in the sponge Hippospongia sp., Heteronemin, has been shown to induce anti-proliferation in several types of cancers. A thyroxine-deaminated analogue, tetrac, binds to integrin αvβ3 to induce anti-proliferation in different cancers. Heteronemin- and in combination with tetrac-induced antiproliferative effects were evaluated. Tetrac enhanced heteronemin-induced anti-proliferation in HT-29 cells (KRAS WT CRC) and HCT-116 cells (KRAS MT CRC). Heteronemin and tetrac arrested cell cycle in different phases. Combined treatment increased the cell accumulation in sub-G1 and S phases. The combined treatment also induced the inactivation of EGFR signaling and downregulated the phosphorylated ERK1/2 protein in both cell lines. Heteronemin and the combination showed the downregulation of the phosphorylated and total PI3K protein in HT-29 cells (KRAS WT CRC). Results by NanoString technology and RT-qPCR revealed that heteronemin and combined treatment suppressed the expression of EGFR and downstream genes in HCT-116 cells (KRAS MT CRC). Heteronemin or combined treatment downregulated genes associated with cancer progression and decreased cell motility. Heteronemin or the combined treatment suppressed PD-L1 expression in both cancer cell lines. However, only tetrac and the combined treatment inhibited PD-L1 protein accumulation in HT-29 cells (KRAS WT CRC) and HCT-116 cells (KRAS MT CRC), respectively. In summary, heteronemin induced anti-proliferation in colorectal cancer cells by blocking the EGFR-dependent signal transduction pathway. The combined treatment further enhanced the anti-proliferative effect via PD-L1 suppression. It can be an alternative strategy to suppress mutant KRAS resistance for anti-EGFR therapy.

1. Introduction

Colorectal cancer (CRC) is the third most widespread cancer globally [1]. KRAS mutations are the most common canonical gain of function mutation in CRC. Oncogenic KRAS mutations are evident in 30~40% of CRC patients [2]. KRAS is a major oncogene that encodes a small guanosine triphosphatase (GTPase) that binds to the protein and functions to activate signal transduction cascades from cell membranes to the nuclei. Wild-type (WT) KRAS proteins are activated by binding to guanosine triphosphate (GTP), which induces activation signals from the epidermal growth factor (EGF) receptor (EGFR) to downstream effector pathways of phosphatidylinositol 3-kinase (PI3K)/Akt and mitogen-activated protein kinase (MAPK) kinase (MEK)/extracellular signal-regulated kinase (ERK) [3,4].
The overexpression of EGFR accounts for 60~80% of CRC patients, and the higher activity of EGFR was inversely associated with the survival rate [5]. In CRC pathogenesis, the EGFR signaling pathway is related to promoting cancer cell proliferation, migration, apoptosis inhibition, angiogenesis [6], and immune evasion [7]. The anti-EGFR monoclonal antibodies, cetuximab, and panitumumab are current targeted therapies for patients diagnosed with KRAS WT metastatic CRC [8]. Anti-EGFR monoclonal antibodies are ineffective in CRC patients with a KRAS mutation due to cancer’s genetic heterogeneity. The KRAS status is a major criterion when considering the use of targeted therapies. Moreover, the activation of the EGFR signaling pathway is related to the host antitumor immunity through programmed death ligand-1 (PD-L1) upregulation [9]. PD-L1 expression more often occurs in metastatic CRC, and its expression in primary CRC might not indicate that cancer cells have spread to distant locations in the body [10]. Therefore, finding new therapeutic strategies that show anticancer efficacy and overcome anti-EGFR therapeutic resistance is an important challenge in KRAS mutant (MT) CRC.
Heteronemin, a marine sesterterpene derived from the sponge Hippospongia sp., is a natural marine product that has various pharmacological effects such as anticancer, anti-inflammatory, antioxidant activities, and apoptotic effects [11,12,13,14]. In preclinical studies, heteronemin was a potent inhibitor of tumors of several cancer types, including oral cancer [14], prostate cancer [15], kidney cancer [11], lung cancer [16], myeloid leukemia [17], cholangiocarcinomas [18], and breast cancer [19]. In human renal carcinoma cells, heteronemin induces antiproliferative activity by suppressing Akt phosphorylation, and ERK1/2 expression, and sequentially inducing cell apoptosis [11]. Furthermore, it was shown to improve the efficacy of cytarabine by inhibiting the farnesylation of the Ras protein. Sequentially, it inhibited the MAPK pathway by inactivating ERK1/2 and c-Myc proteins to prevent tumor cell proliferation [17]. Heteronemin has been shown to bind cell surface integrin αvβ3 receptor [20] and inhibit downstream ERK1/2 and STAT3 in breast cancer [19].
Tetraiodothyroacetic acid (tetrac) is a deaminated analog of the thyroid hormone (T4) that blocks the proangiogenic activity of the thyroid hormone via competing with the cell surface integrin αvβ3 receptor [21]. Tetrac inhibits thyroid hormone-induced angiogenesis and proliferation [21]. Tetrac suppresses the T4-induced activation of ERK1/2 and STAT3 in lung cancer [22]. Additionally, tetrac restricted tumor cell proliferation in a breast cancer xenograft model [23]. Tetrac induces an antiproliferative effect by suppressing ERK1/2 activation in colorectal cancer cell lines with different KRAS statuses [24]. However, the mechanisms of anti-proliferation of heteronemin and tetrac in CRC are still unknown. The purpose of this study is to investigate whether tetrac enhanced the antitumor effect of heteronemin in CRC with different KRAS statuses by blocking EGFR signaling and its downstream signal transduction pathways. In addition, the combined treatment inactivated integrin αvβ3-dependent signaling. The combined treatment modulated gene expressions in HCT-116 cells (KRAS MT CRC) shown by nanostring technology. Sequentially, heteronemin, tetrac, and the combined treatment induced anti-proliferation in both HT-29 cells (KRAS WT CRC) and HCT-116 cells (KRAS MT CRC).

2. Results

2.1. The Combined Treatment of Heteronemin and Tetrac Inhibits Cell Proliferation in Human CRC Cells with Different KRAS Statuses

Heteronemin has been shown to induce antiproliferative properties against various types of cancers [20]. The HT-29 cells (KRAS WT CRC) and HCT-116 cells (KRAS MT CRC) express different gene mutation statuses [25]. Initially, we assessed the inhibitory effects of heteronemin in both CRC cell lines using a CyQUANT® cell proliferation assay after 24 and 72 h of treatment. The results show that treatment with heteronemin effectively inhibited cell proliferation in both CRC cell lines in a concentration- and time-dependent manner (Figure 1A,B). Moreover, HCT-116 cells (KRAS MT CRC) were more sensitive to heteronemin than HT-29 cells (KRAS WT CRC). The 50% inhibitory concentration (IC50) values of heteronemin were 2.4 and 0.8 µM for HT-29 cells (KRAS WT CRC) and 1.2 and 0.4 µM for HCT-116 cells (KRAS MT CRC) at 24 and 72 h, respectively.
Tetrac inhibits tumor growth [24]. It also suppresses the proangiogenic actions of vascular endothelial growth factor (VEGF) [21]. Tetrac also inhibits tumor growth in the HCT-116 (KRAS MT CRC) mouse xenograft model [26]. Tetrac at 10−7 M suppresses the ERK1/2 phosphorylation in HT-29 cells (KRAS WT CRC) and HCT-116 cells (KRAS MT CRC) [24]. We further investigated the inhibitory effects of heteronemin, tetrac, and their combination in both CRC cell lines. Cells were treated with tetrac at 10−6 and 10−7 M, or combined with heteronemin at 0.4 or 0.8 µM (HT-29 cells; KRAS WT CRC) and 0.2 or 0.4 µM (HCT-116 cells; KRAS MT CRC) for 72 h (Figure 1C,D). The results demonstrate that heteronemin and tetrac significantly inhibited cell proliferation, and tetrac further improved the inhibitory effect of heteronemin in both cell lines. Moreover, the combined effect of the two compounds produced a greater reduction in cell proliferation compared to heteronemin alone. A total of 0.8 µM of heteronemin in HT-29 cells (KRAS WT CRC) or 0.4 µM of heteronemin in HCT-116 cells (KRAS MT CRC) and 10−7 M of tetrac were further used to identify whether tetrac enhanced the antitumor effect of heteronemin in human CRC cells with different KRAS statuses.

2.2. The Combination of Heteronemin and Tetrac Alters Cell Cycle Arrest at the Sub-G1 and S Phases in Human CRC Cells with Different KRAS Statuses

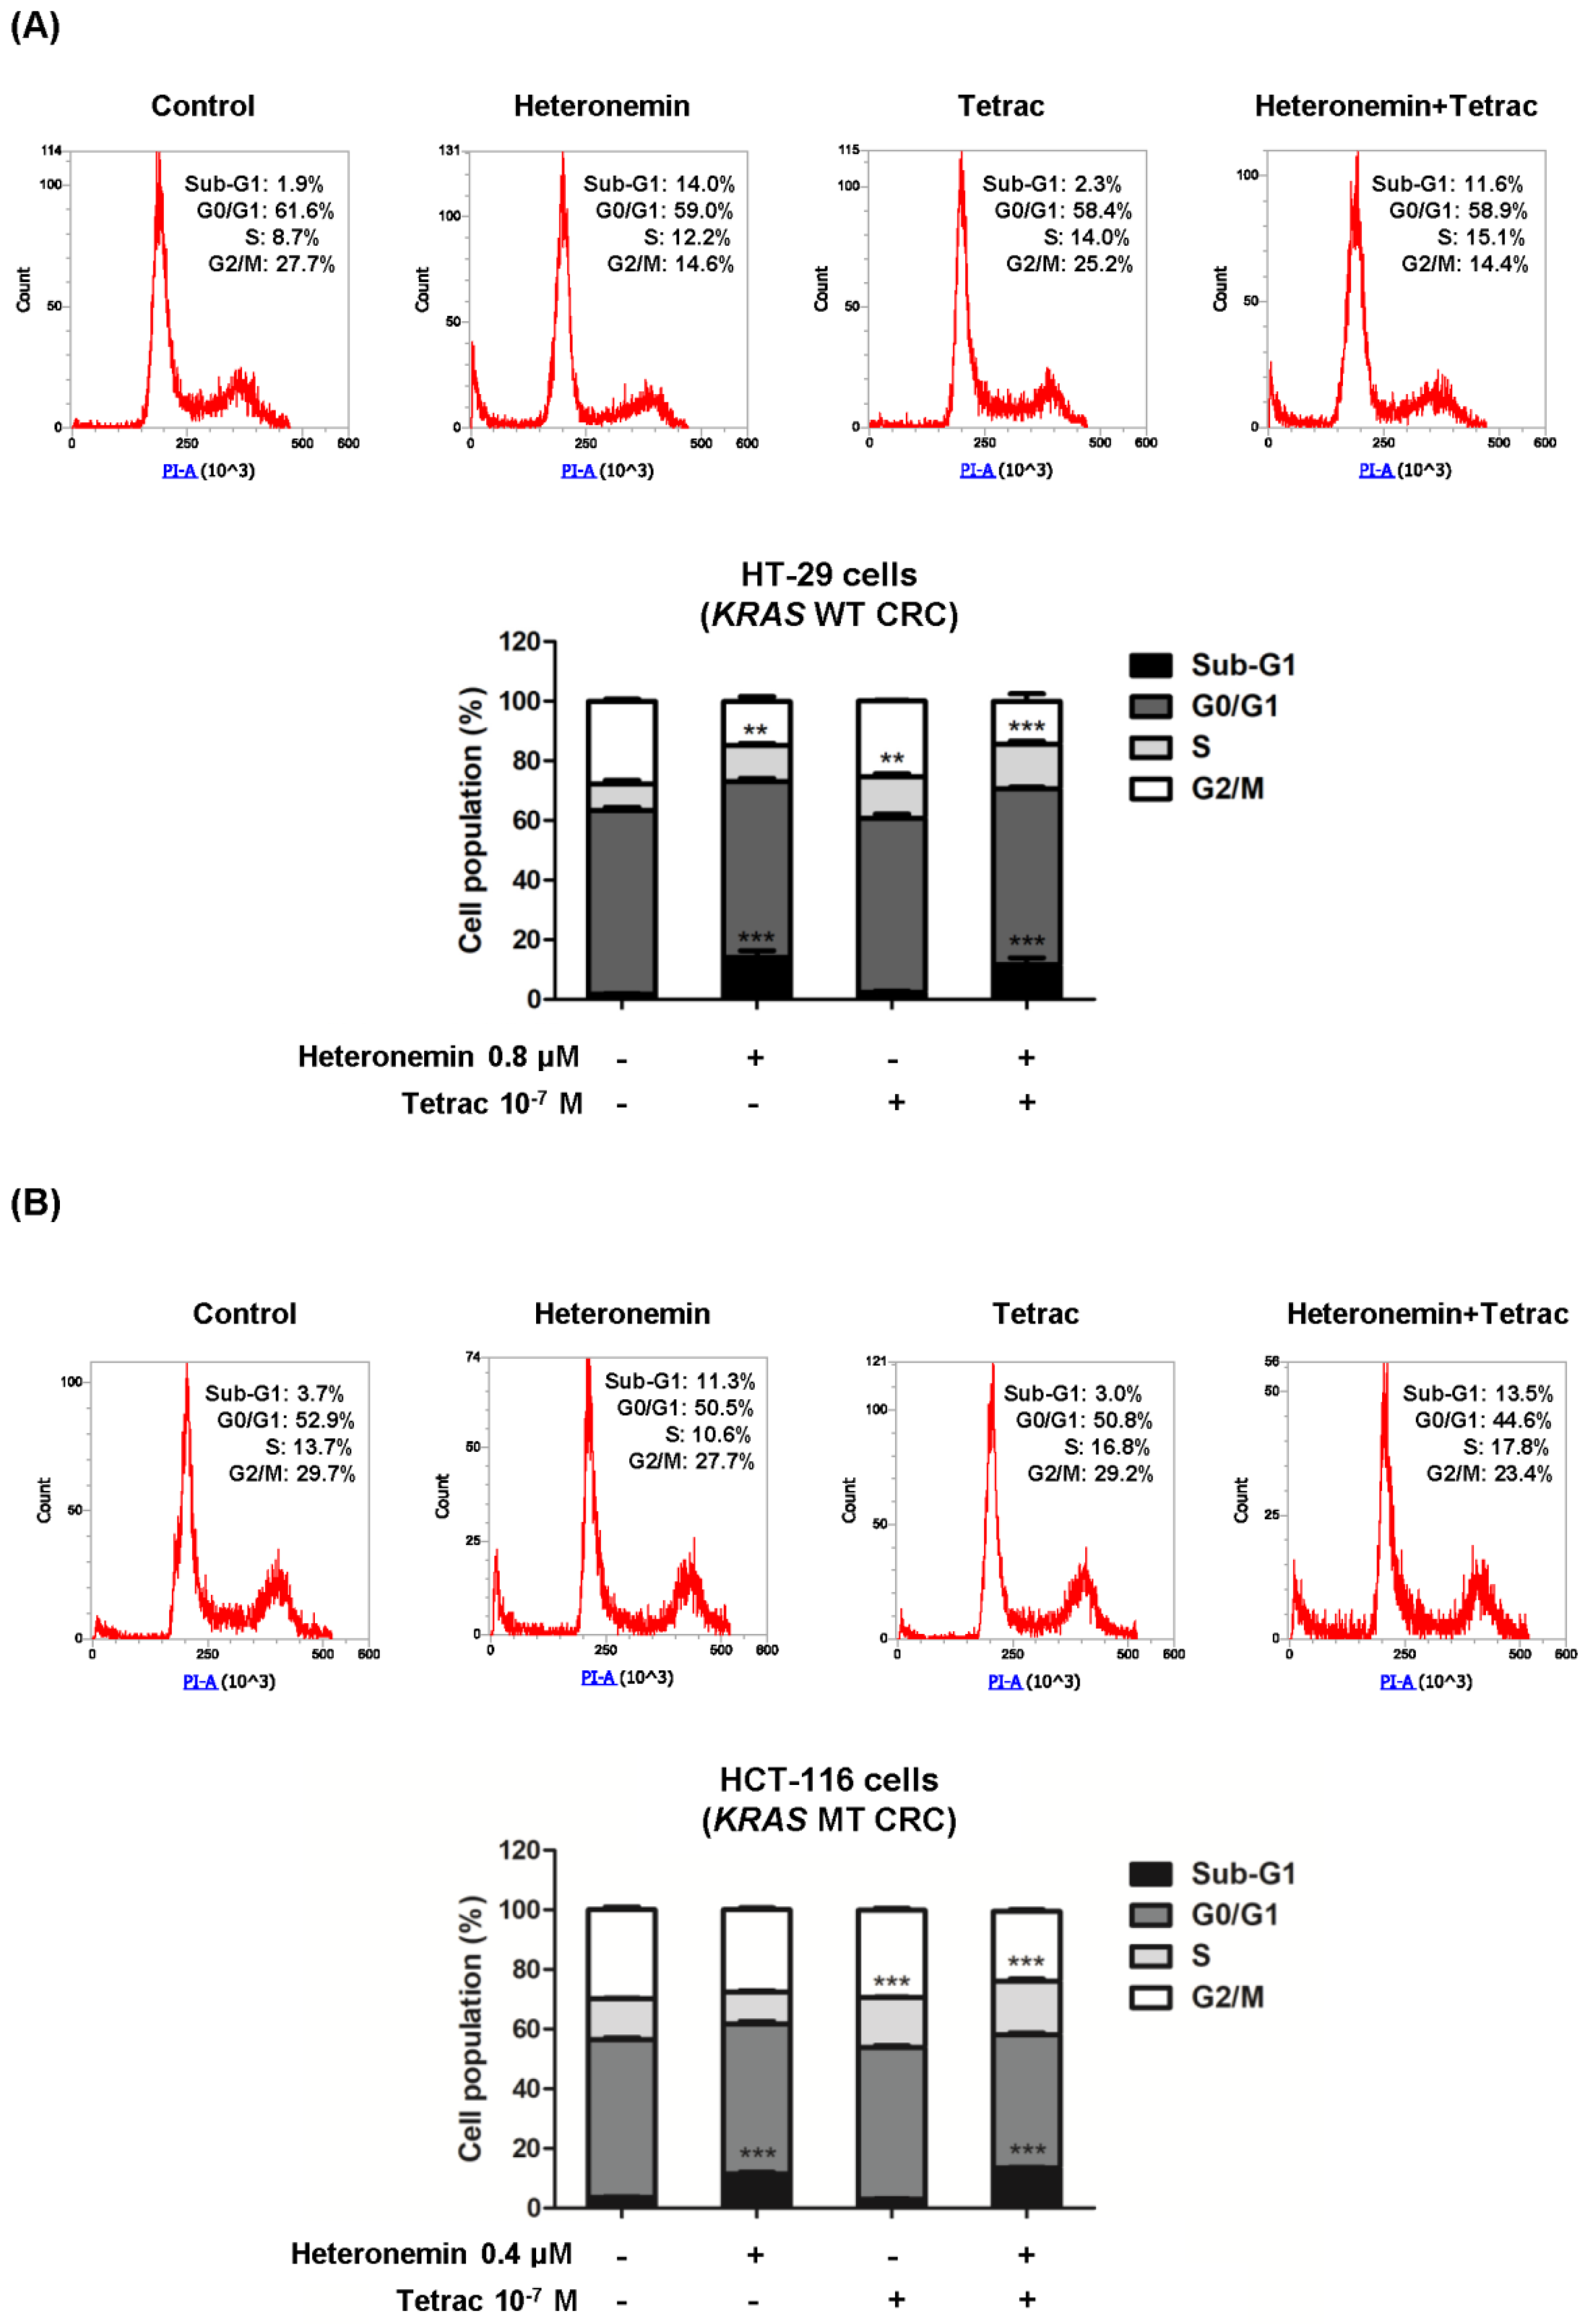
The suppression of tumor cell growth is commonly implicated in cell cycle arrest. To evaluate the combined treatment with heteronemin and tetrac, we further determined the effects of their combination in HT-29 cells (KRAS WT CRC) and HCT-116 cells (KRAS MT CRC) using flow cytometry. As shown in Figure 2, the cell cycle histograms revealed that heteronemin caused a significant accumulation of the cell population in the sub-G1 phase (apoptotic cells) in both cell lines and the S phase in HT-29 cells (KRAS WT CRC). Tetrac at 10−7 M for 24 h led to accumulation in the S phase compared to the control. Interestingly, tetrac treatment significantly increased the S-phase cell population from 8.7% (control) to 14.0% in HT-29 cells (KRAS WT CRC) and from 13.7% (control) to 16.8% in HCT-116 cells (KRAS MT CRC) (Figure 2A,B). The data suggest that S-phase arrest contributes to the antiproliferative effect of tetrac in both cell lines.
Furthermore, we investigated whether tetrac could enhance the therapeutic effect of heteronemin. The cell-cycle profiles of these CRC cell lines showed similar trends in the sub-G1 and S phases after combined treatment compared to their respective controls. The S phase population in HT-29 cells (KRAS WT CRC) and HCT-116 cells (KRAS MT CRC), respectively, rose from 12.2% to 15.1% and from 10.6% to 17.8% compared to treatment with heteronemin alone (Figure 2A,B).

2.3. The Combined Treatment of Heteronemin and Tetrac Suppresses the Phosphorylation of EGFR in Human CRC Cells with Different KRAS Statuses

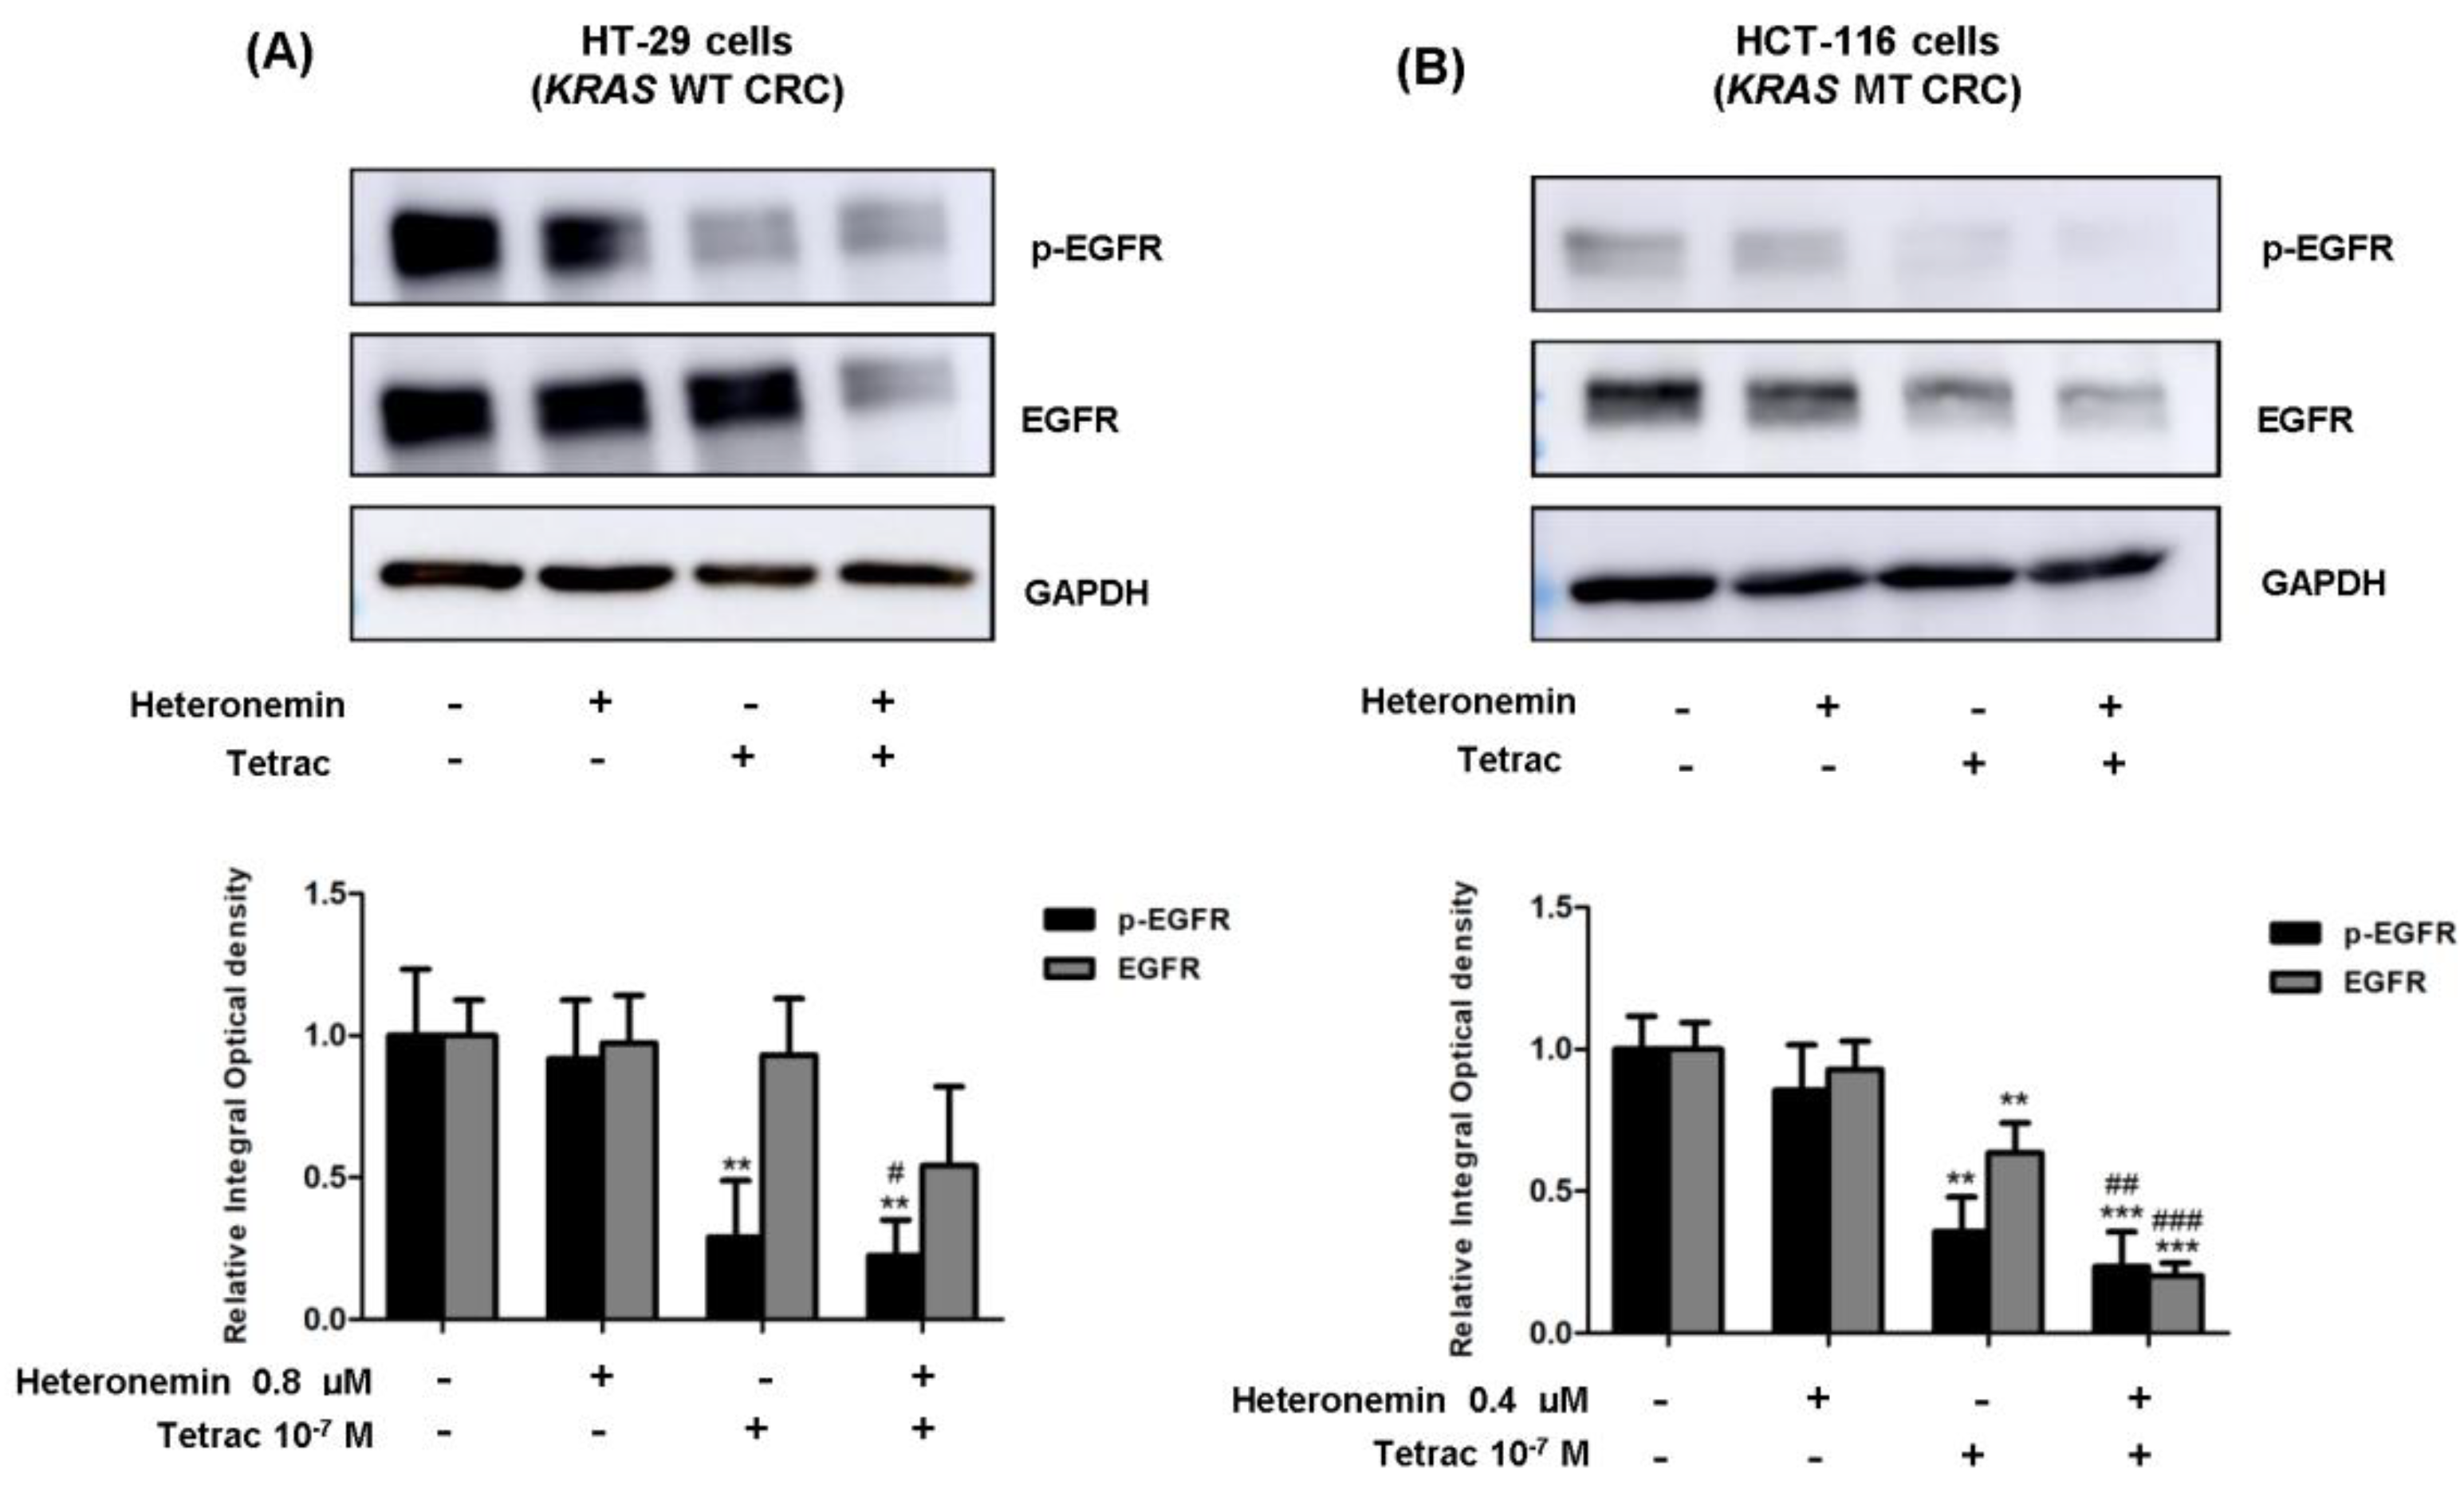
The RAS protein mediates signals from growth factor receptors (such as EGFR) to downstream effector pathways, such as PI3K and ERK1/2. The EGFR pathway played a key role in the pathogenesis, cell proliferation, and immune evasion of cancer [27]. We first assessed the EGFR protein expression levels after treatment with heteronemin, tetrac, or heteronemin in combination with tetrac for 24 h. As illustrated in Figure 3A,B, the phosphorylation of EGFR was significantly downregulated in both cell lines treated with tetrac or combined treatment compared with the control group. In KRAS MT cells, tetrac or combined treatment caused dramatic reductions in the total EGFR levels (Figure 3B). Interestingly, the combined treatment also led to a strong reduction in total and phosphorylated EGFR protein compared to heteronemin alone in HCT-116 cells (KRAS MT CRC). These results demonstrated that combination treatment was more efficient in terms of suppressing EGFR activation and EGFR expression in both CRC cell lines.

2.4. The Combined Treatment of Heteronemin and Tetrac Downregulates ERK1/2 Phosphorylation and ERK1/2 Protein Levels in Human CRC Cells with Different KRAS Statuses

The EGFR regulates two critical components, PI3K/AKT and MAPK/ERK1/2, of intracellular signaling, which have essential functions in cell proliferation. To understand which molecular mechanisms of EGFR downstream effectors were affected by heteronemin combined with tetrac, and it may link to PD-L1 expression in CRC cells with different KRAS statuses. We, therefore, analyzed phosphorylated and total protein levels of PI3K and ERK1/2.
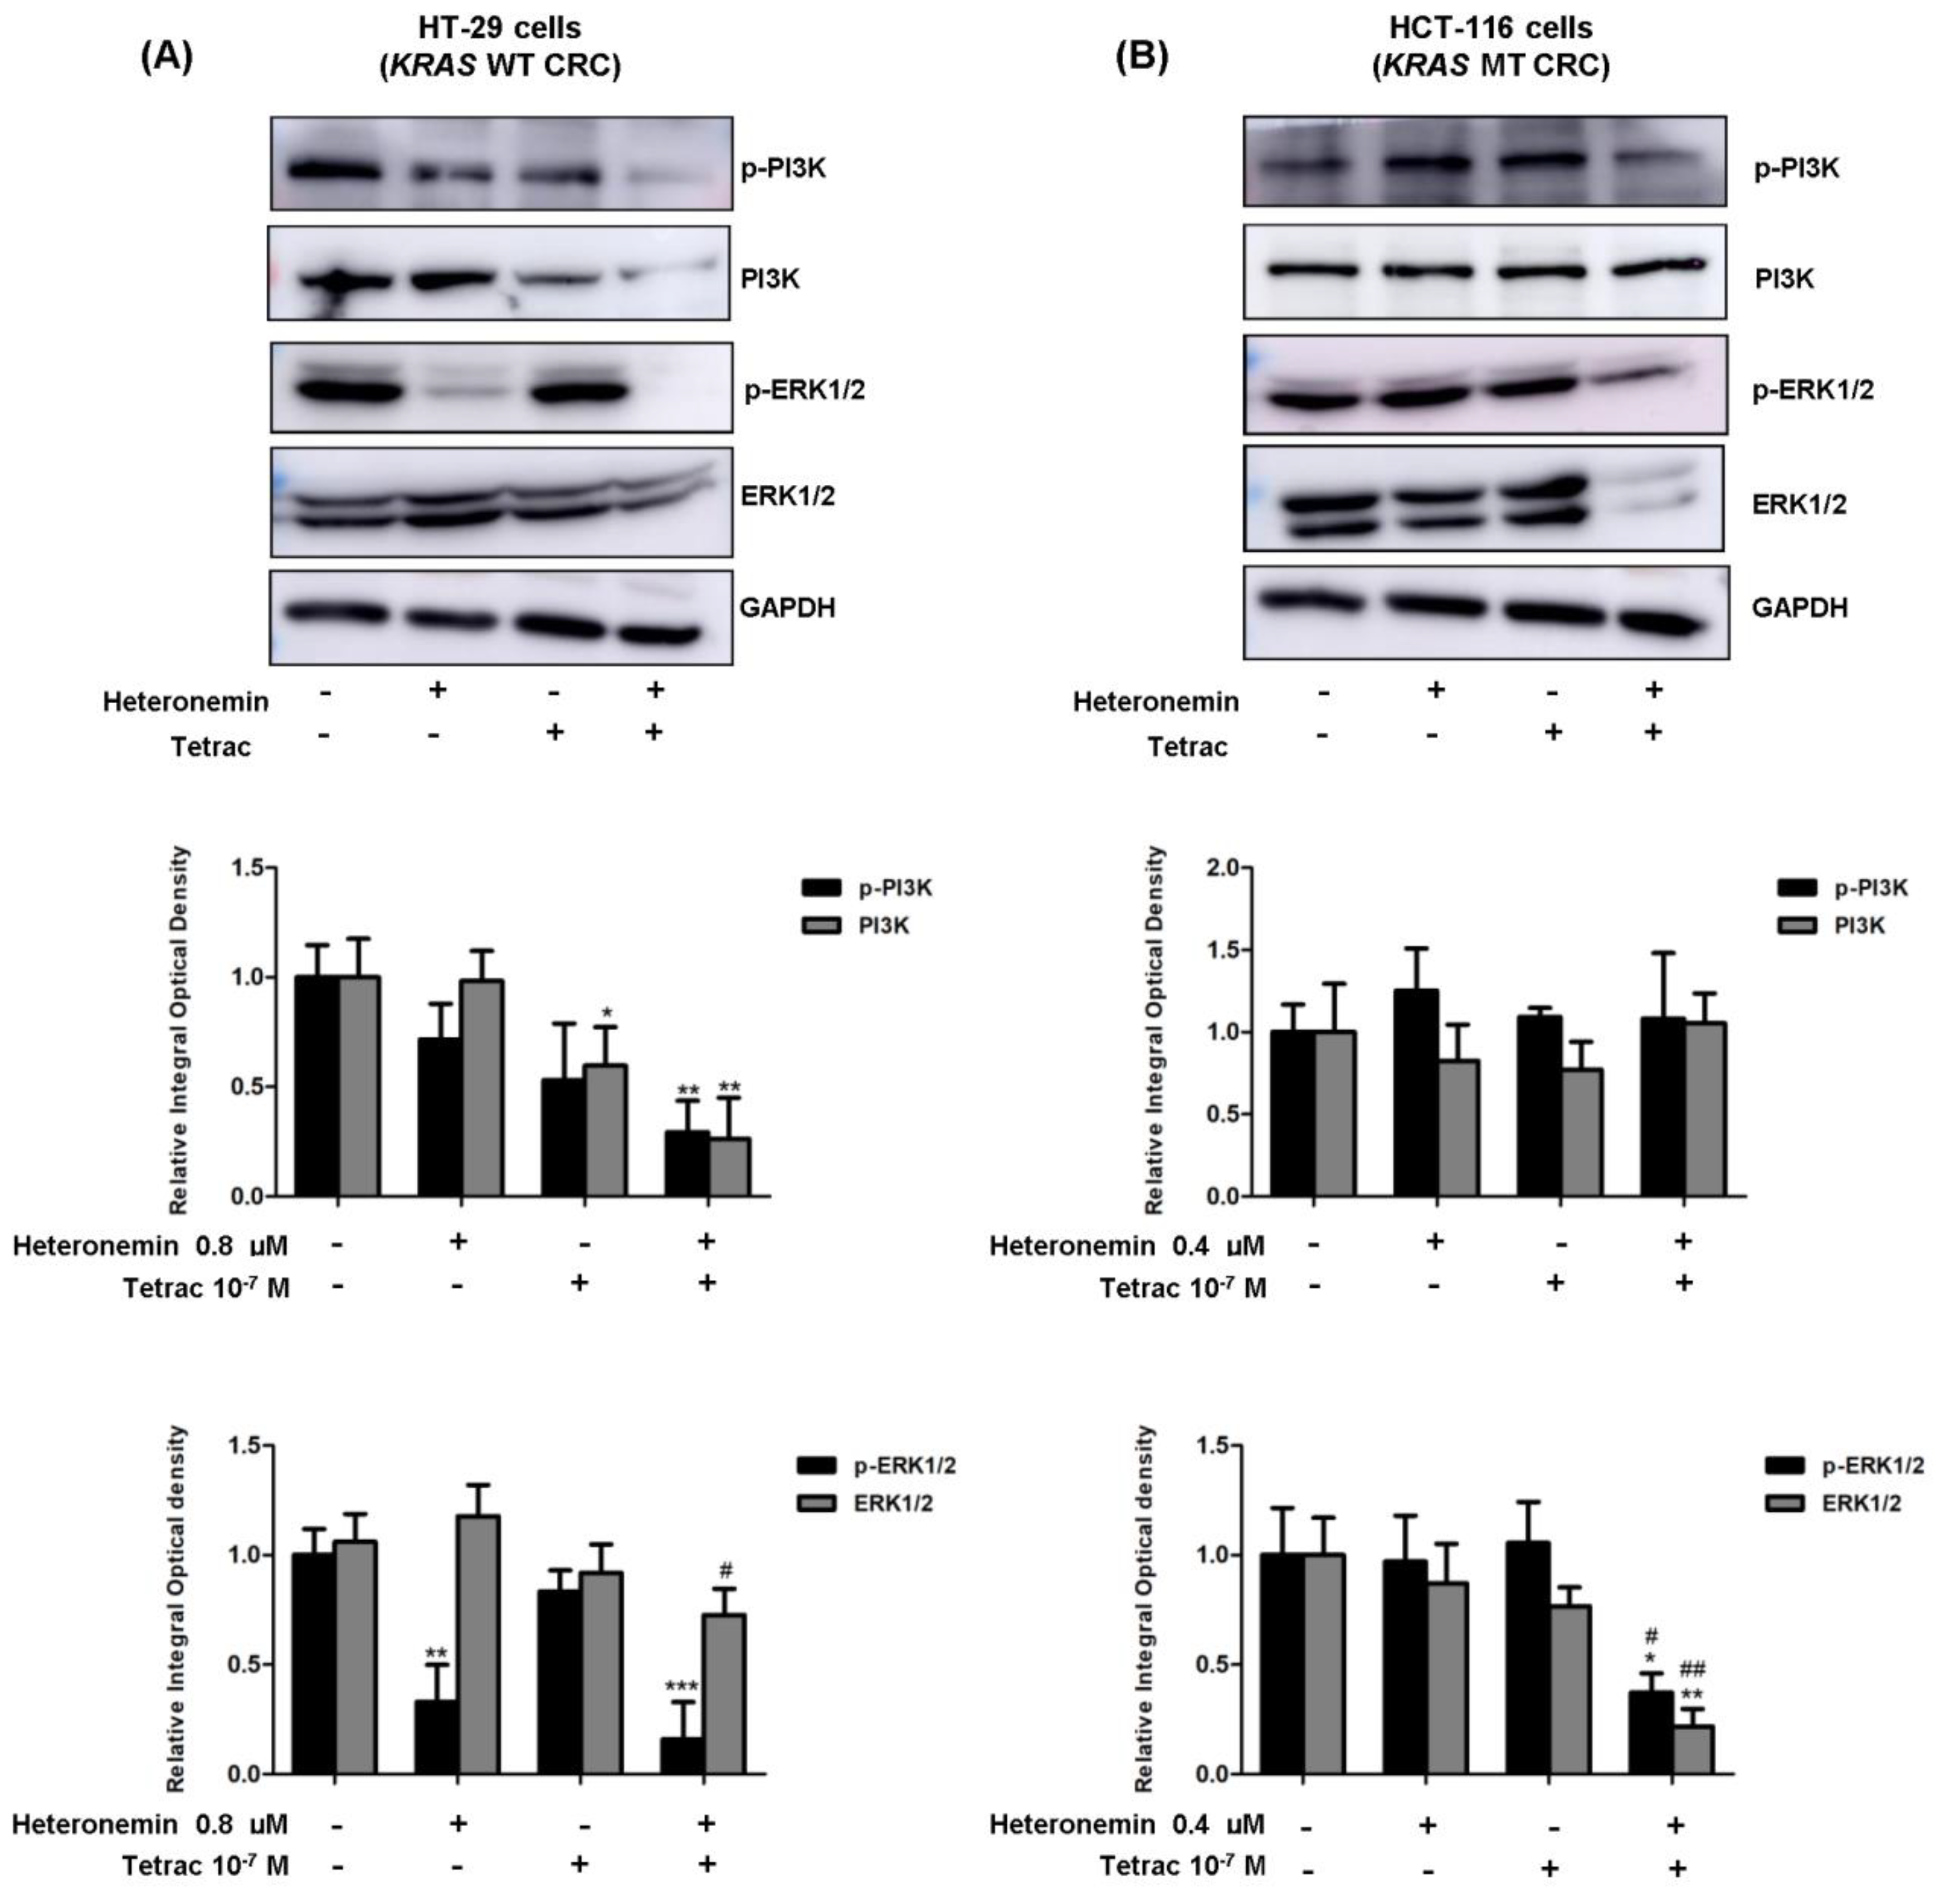
The results show that the phosphorylated and total protein expression levels of PI3K were significantly downregulated in HT-29 cells (KRAS WT CRC) with combination treatment compared to the control for 24 h (Figure 4A), whereas there were unaffected in HCT-116 cells (KRAS MT CRC; Figure 4B). Surprisingly, the expression levels of the phosphorylated and total ERK protein were dramatically suppressed after combined treatments compared to the control in HCT-116 cells. Interestingly, single-agent heteronemin or combined with tetrac showed a significant reduction in phosphorylated ERK1/2 in HT-29 cells (KRAS WT CRC). Collectively, these results suggest that heteronemin combined with tetrac inhibited PI3K and ERK1/2 activation in HT-29 cells (KRAS WT CRC) and ERK1/2 in HCT-116 cells (KRAS MT CRC), which correlated with the suppression of EGFR.

2.5. Heteronemin, Tetrac, and Their Combination Regulate Gene Expression in KRAS Mutant Cells

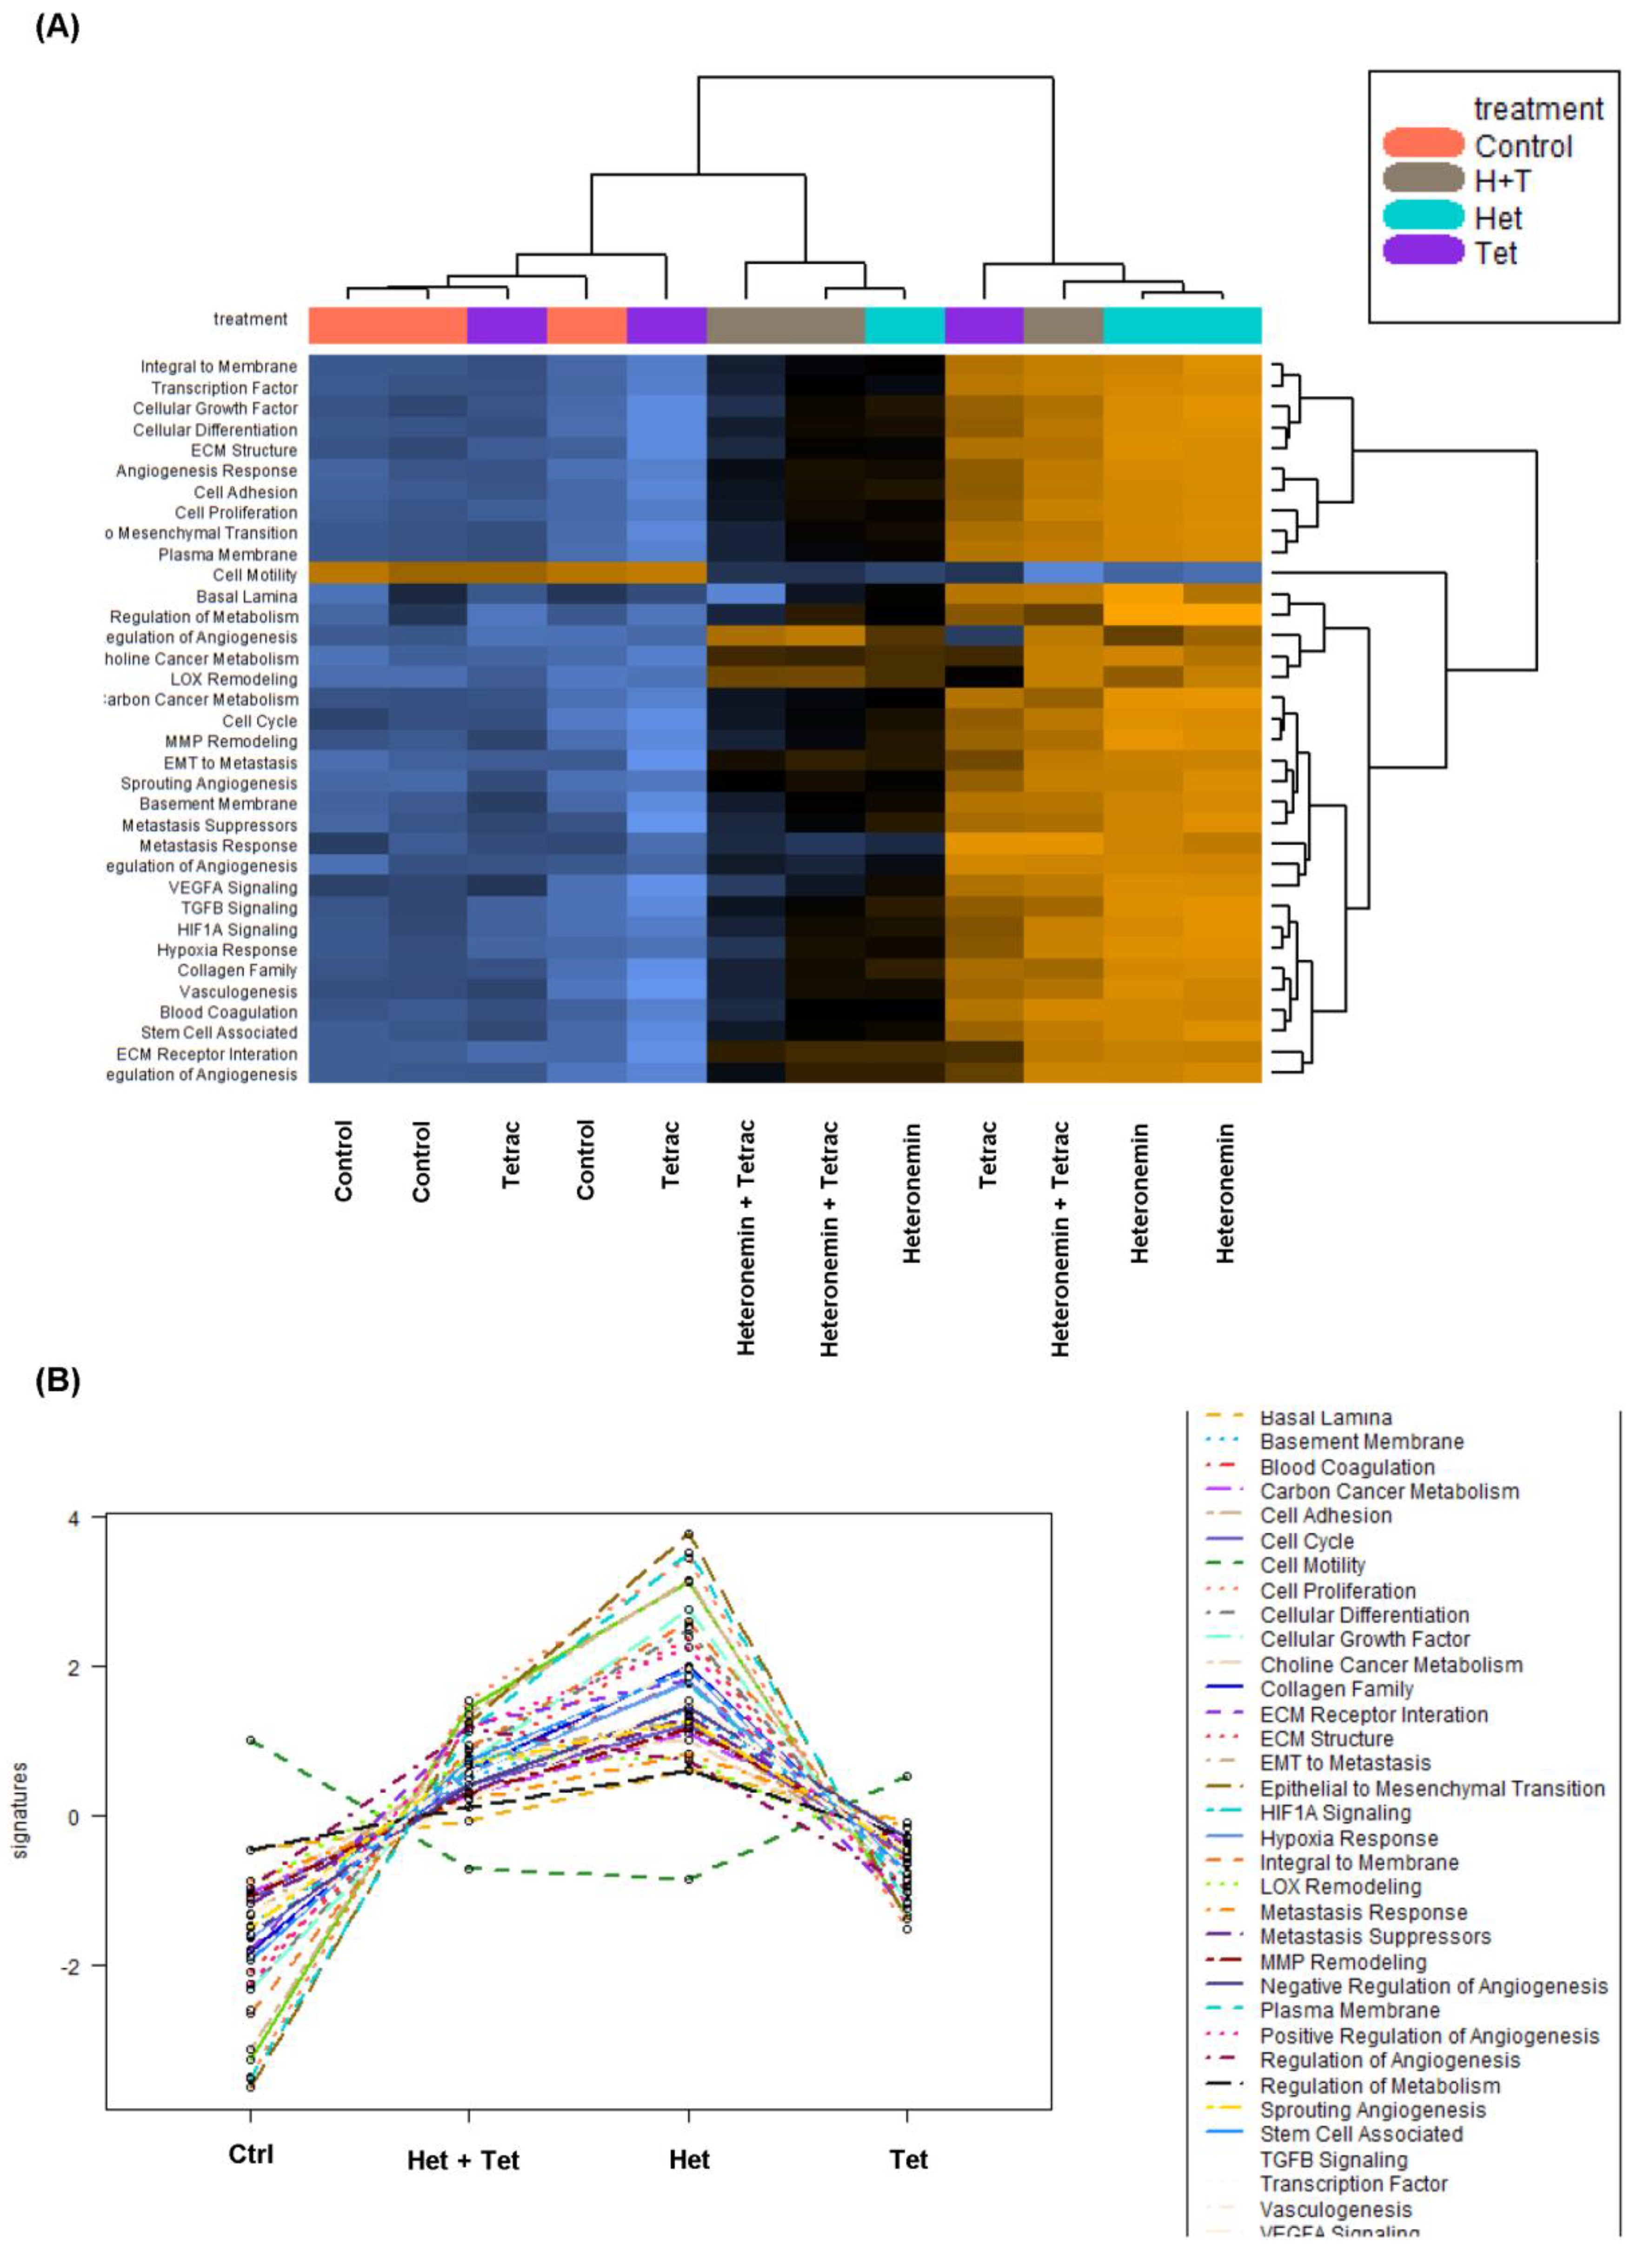
K-Ras play critical roles in therapeutic resistance in CRC patients. To investigate gene expression profiling involved in the anti-proliferative effect induced by tetrac, heteronemin, and the combined treatment in HCT-116 cells (KRAS MT CRC), NanoString nCounter was used for gene expression analyses. It provides a robust, highly reproducible, and sensitive method. In addition, it has the capacity to evaluate the direct digital readout of up to 800 gene targets from a sample in a single sample. It uses fluorescent barcode-labeled hybridization probes without reverse transcription. The results of the gene expression of HCT-116 cells (KRAS MT CRC) by NanoString gene expression analyses are displayed as a heatmap of the directed global significance score that was involved in cancer progression in HCT-116 cells (KRAS MT CRC). Pathway scores were identified by nSolverTM software. Most signal pathways were upregulated by heteronemin or combination treatment. Heteronemin combined with tetrac appeared to reduce the expression level of signal transduction pathways involved in EGFR signaling, which includes cell proliferation, angiogenesis, and epithelial–mesenchymal transition (EMT) in tumor metastasis compared to heteronemin alone. In contrast, cell motility showed an inverse expression pattern of all signal transduction pathways that drive cancer progression (Figure 5A,B).
The activated EGFR signal transduction pathway induces cellular motility [28]. In addition, EMT plays a vital role in tumor metastasis [29,30]. Thus, cell motility is associated with EMT in cancer invasion and metastasis [31]. It was of interest to investigate if heteronemin, tetrac, and the combined treatment modulated gene sets that are involved in cell motility, i.e., EGFR and signal transduction and activator of transcription 3 (STAT3), as two of the gene lists (Figure S1). These observations indicated that heteronemin and combined treatment induced the downregulation of EGFR and STAT3 mRNA expressions.
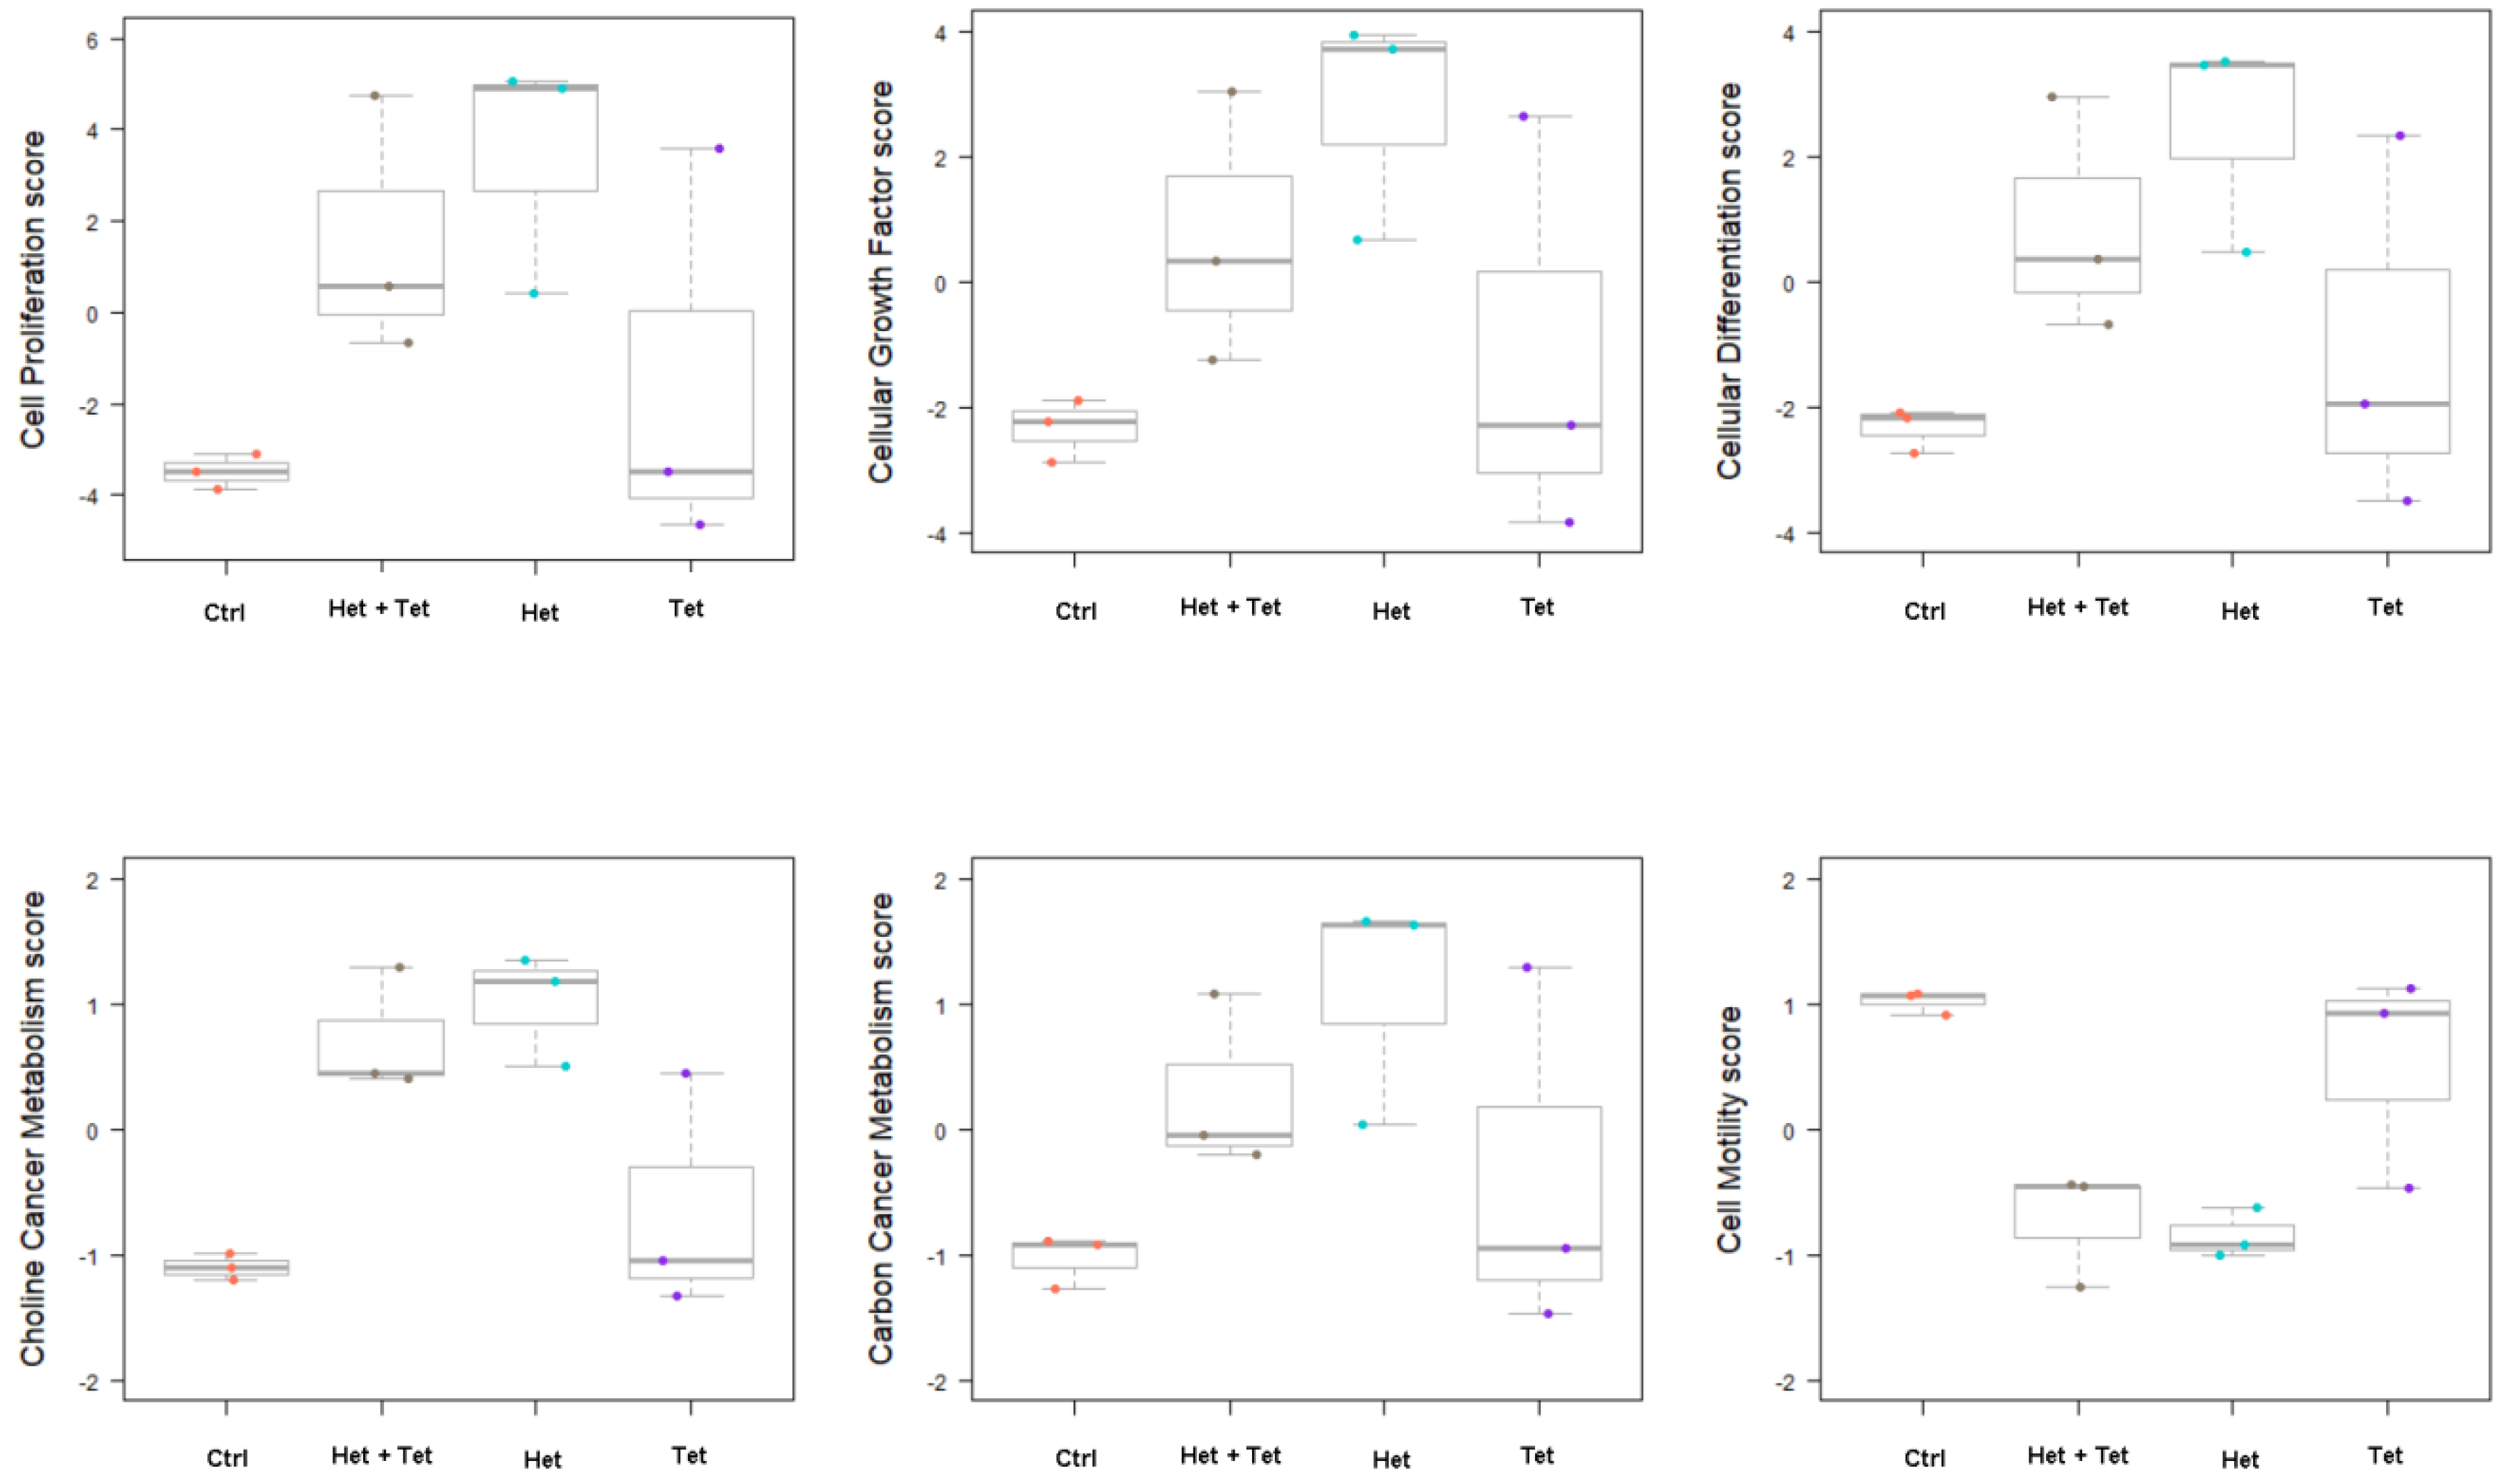
EGFR activation is related to cancer progression. The pathway scores of cell proliferation, cellular growth factor, cellular differentiation, choline cancer metabolism, and carbon cancer metabolism were shown to have functional statuses with the EGFR. Therefore, heteronemin alone and combined with tetrac induced upregulated correlations for all pathway scores of the EGFR in HCT-116 cells (KRAS MT CRC). However, only cell motility showed an inverse correlation among pathway scores of the EGFR after heteronemin or combination treatment (Figure 6).
Additionally, the expressions of a set of genes associated with the cell cycle were investigated. Among differentially expressed genes (DEGs) in the heatmap, those genes were related to the effect of heteronemin or tetrac modulated cell cycle progression in HCT-116 cells (KRAS MT CRC; Figure S2).
We also examined changes in the expressions of genes involved in antiproliferation induced by heteronemin, tetrac, and their combination in HCT-116 cells (KRAS MT CRC) for 24 h. The mRNA levels of 771 genes were analyzed by a Nanospring® nCounter PanCancer Progression Panel (NanoString Technologies, Seattle, WA, USA). Table 1 shows the significant modulation of genes after treatment with heteronemin, tetrac, or their combination. Additionally, the expressions of genes and growth factor pathways associated with CRC progression, such as EGFR, TGFB1, transforming growth factor-β receptor 2 (TGFBR2), and tumor protein 53 (TP53), were significantly reduced by combined treatment (Table 2). Although KRAS expression was not statistically significantly reduced, it showed decreased expressions after different treatments. These studies illustrated that EGFR might be an important target of heteronemin and tetrac.

2.6. The Combined Treatment of Heteronemin and Tetrac Downregulated EGF and EGFR mRNA Expressions in Human CRC Cells with Different KRAS Statuses

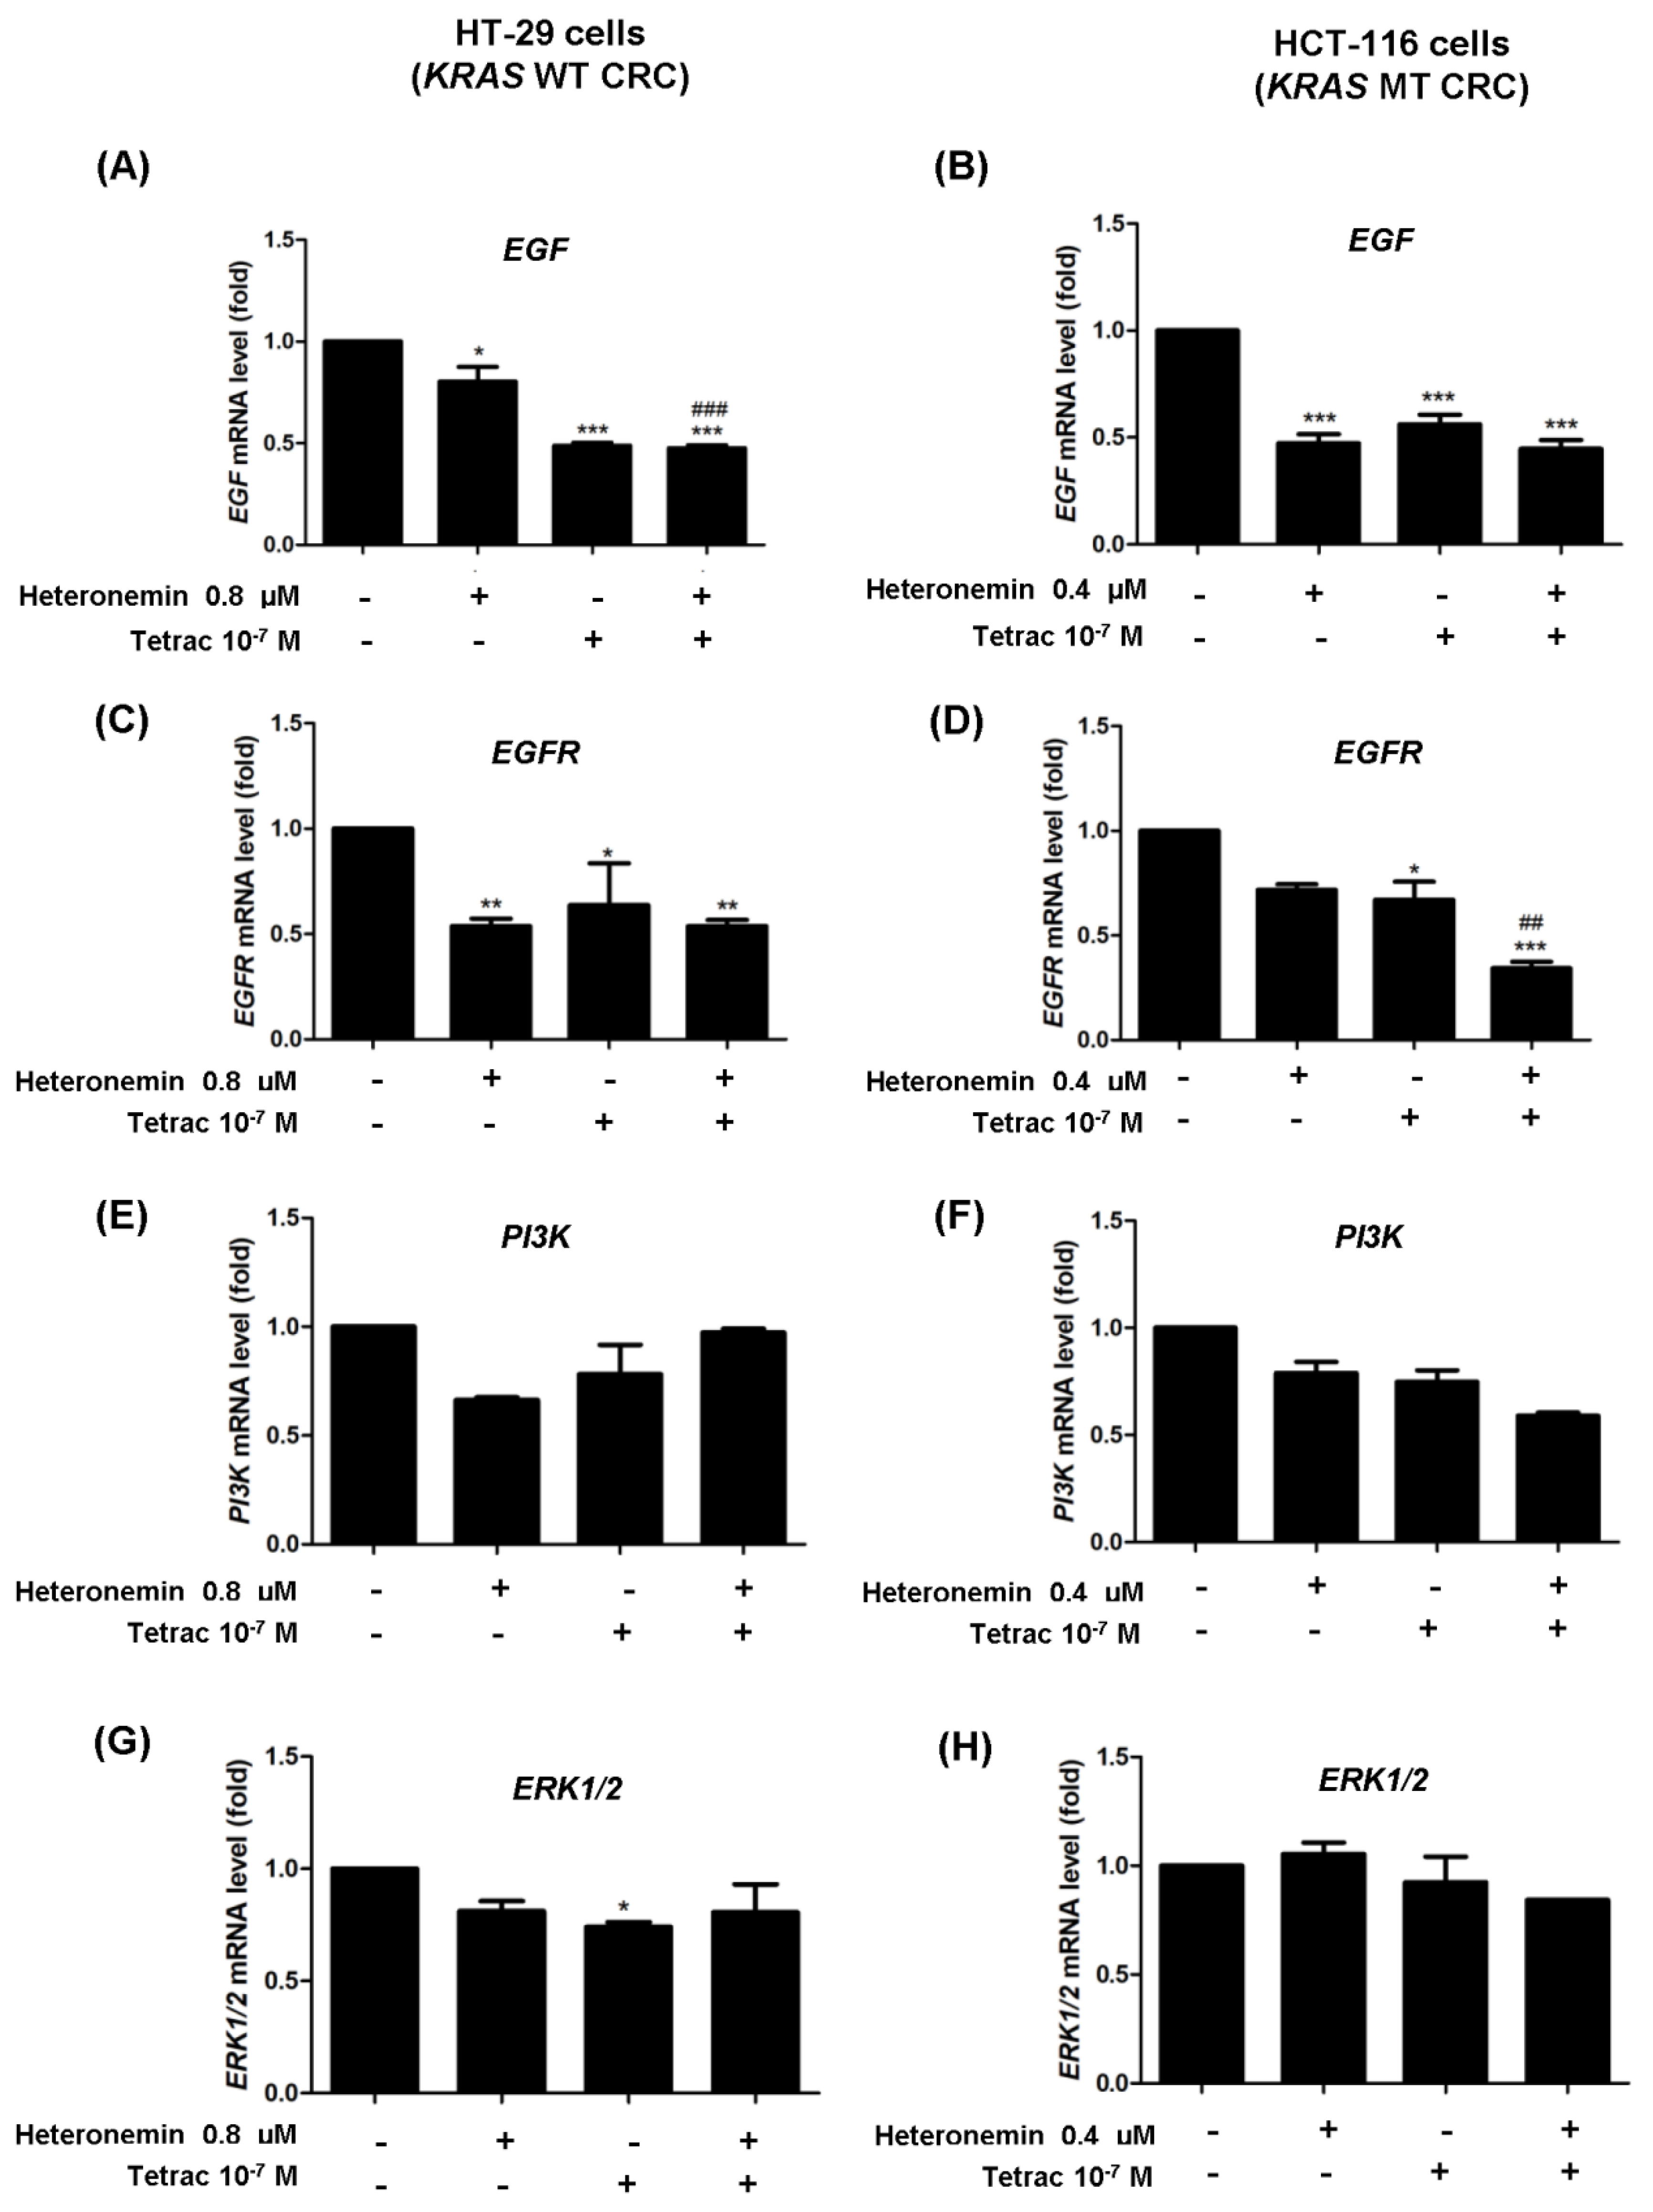
We next assessed the mRNA expressions of the most important EGFR pathways, including EGF, EGFR, ERK1/2, and PI3K. When KRAS WT cells were treated with heteronemin alone, this significantly reduced levels of EGF and EGFR mRNA compared to the control (Figure 7A,C). Single-agent tetrac, with or without heteronemin, caused significant decreases in EGF and EGFR mRNA levels in both cell lines compared to the control (Figure 7A–D). In addition, EGF and EGFR levels dramatically decreased after being treated with the combination compared to single-agent heteronemin in HT-29 cells (KRAS WT CRC) and HCT-116 cells (KRAS MT CRC), respectively (Figure 7A,D). ERK1/2 was found to be decreased after tetrac in HT-29 cells (KRAS WT CRC). Although PI3K mRNA levels did not exhibit any statistically significant difference, a decreasing trend was shown after being treated with heteronemin or tetrac in both cell lines, and by combined treatment in HCT-116 cells (KRAS MT CRC).

2.7. The Combination of Heteronemin and Tetrac Shows Different Regulations of Cell Cycle Regulators in Human CRC Cells with Different KRAS Statuses

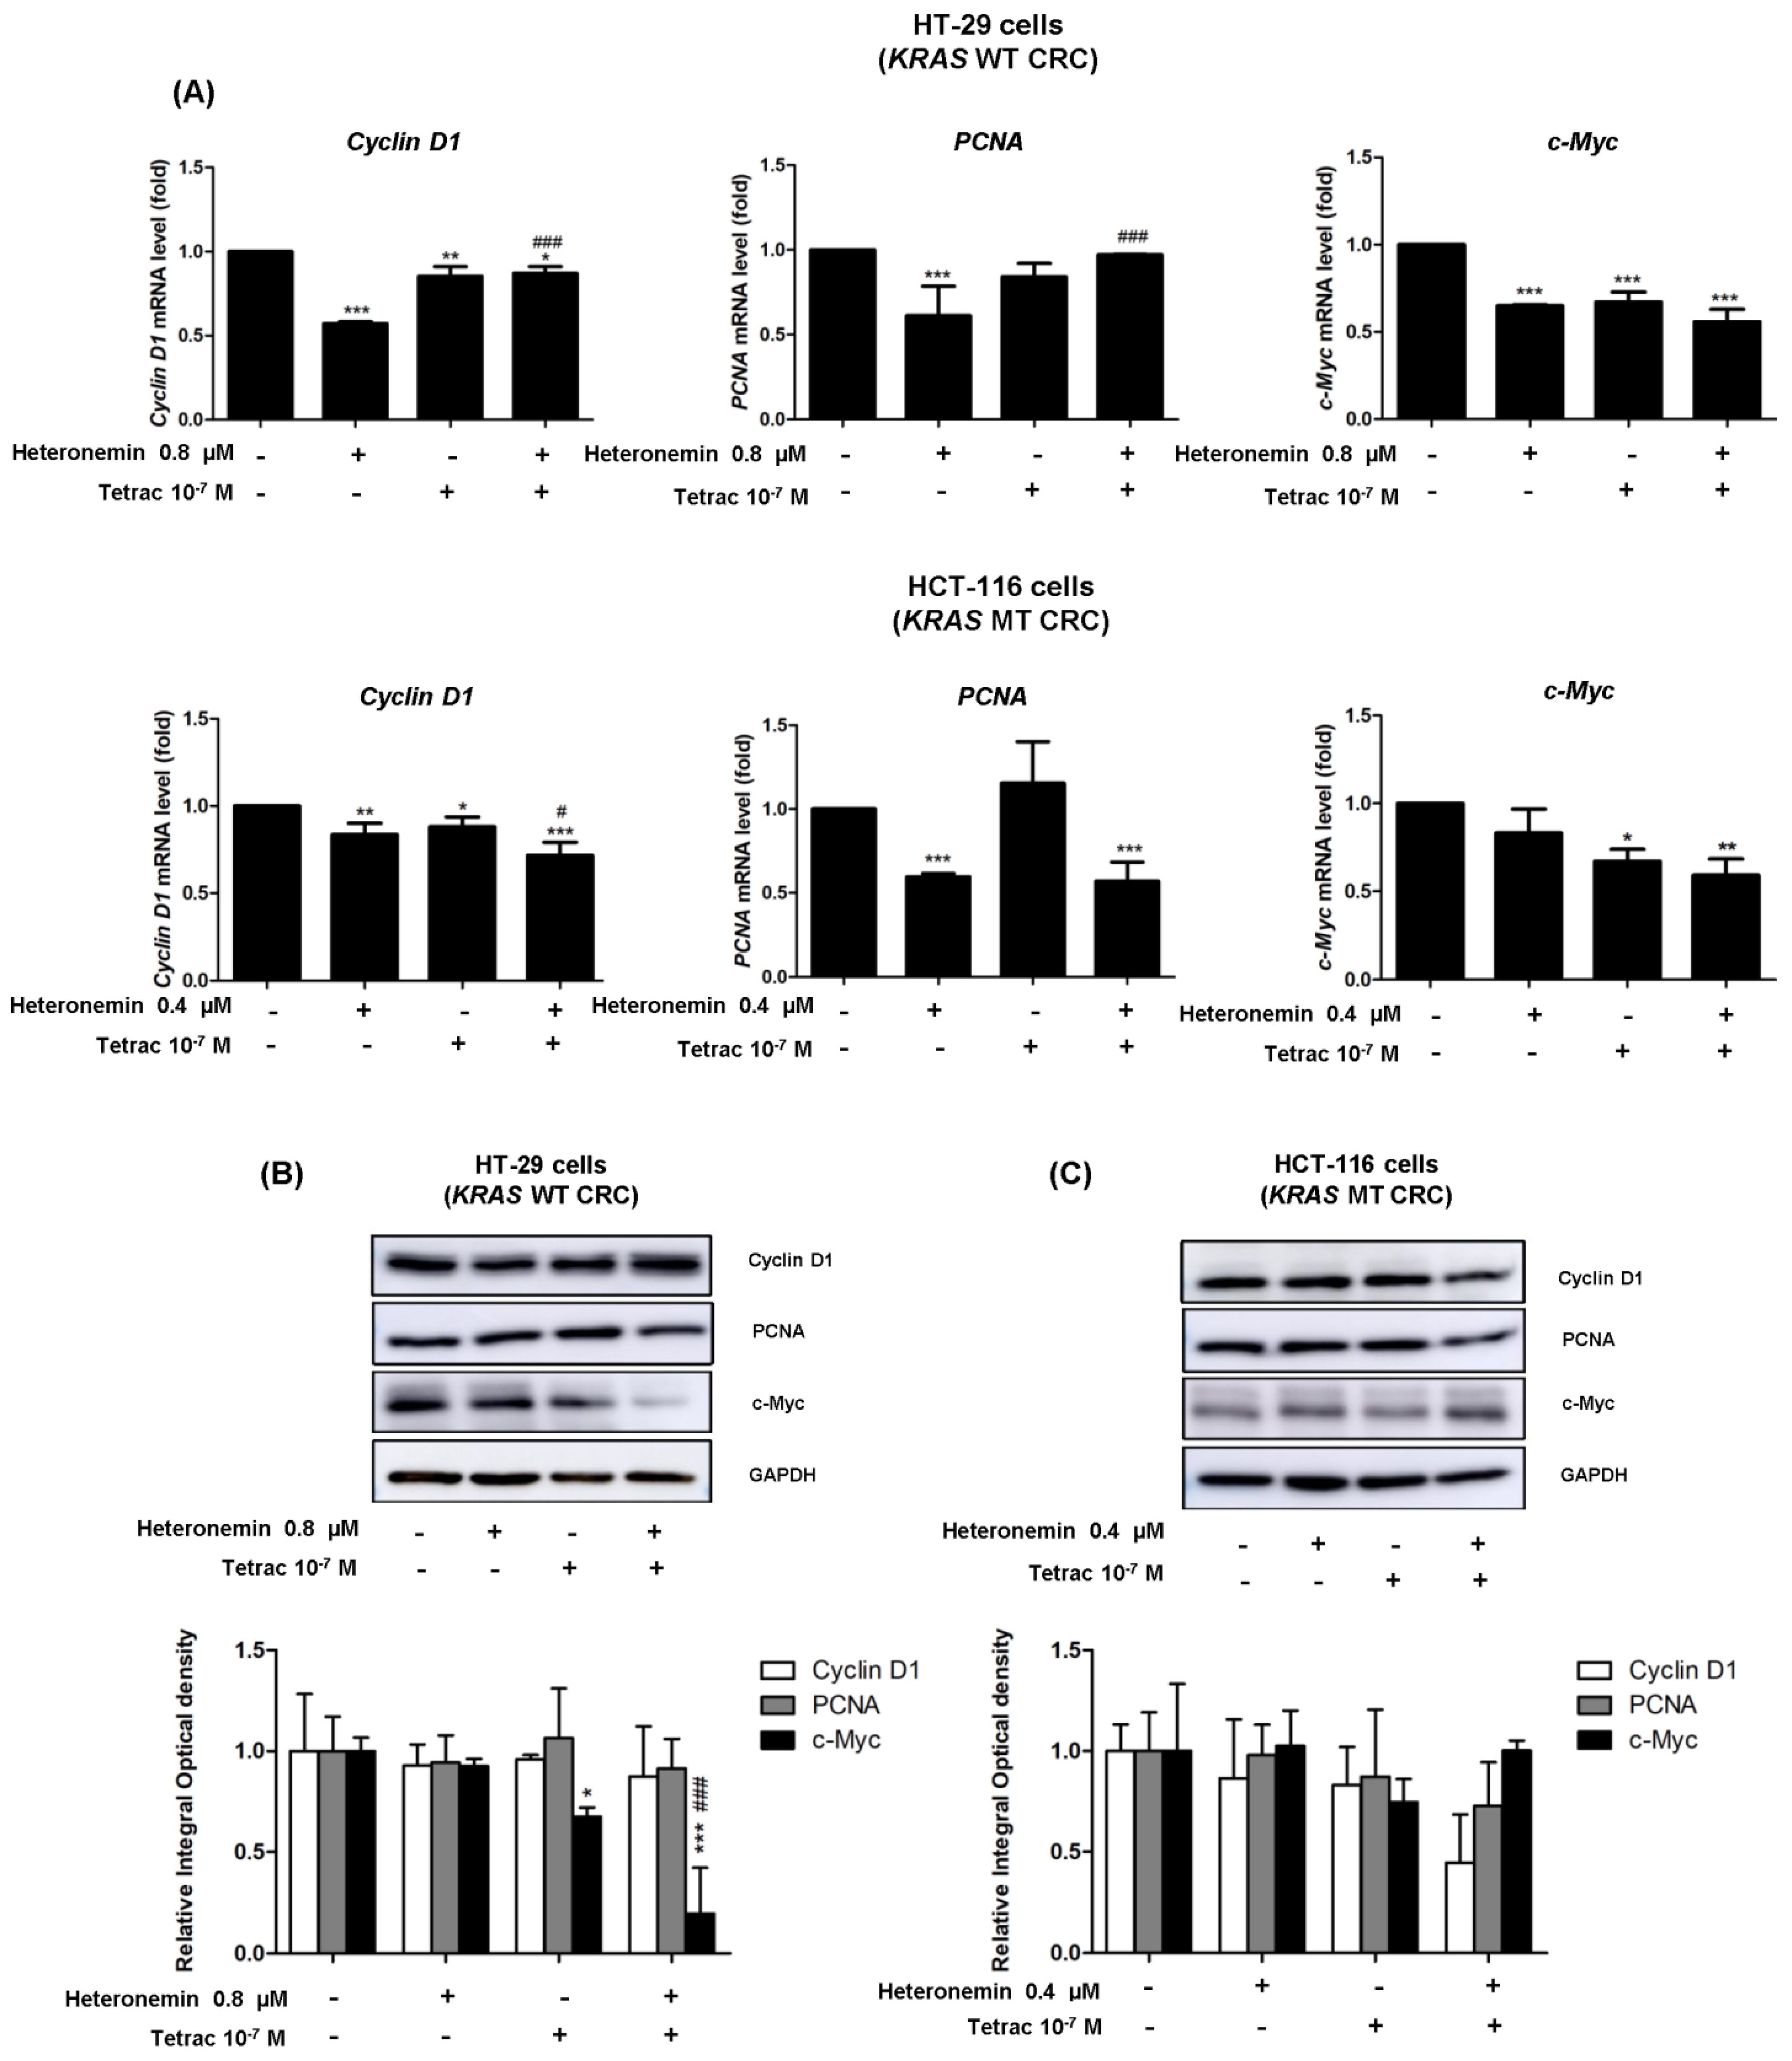
Cyclin D1 and PCNA are specific genes, respectively, active in the G1 and S phases of the cell cycle. These genes are downstream cell cycle regulation targets of c-Myc [32]. We determined the mRNA and protein levels of these genes, which are linked to the inhibition of cell proliferation in HT-29 cells (KRAS WT CRC) and HCT-116 cells (KRAS MT CRC). Treatment with heteronemin, tetrac, or their combination reduced significantly mRNA levels of cyclin D1 in both cell lines (Figure 8A). Heteronemin alone significantly inhibited PCNA expression in both cell lines, and the combination of heteronemin and tetrac also showed a significant reduction in PCNA mRNA in HCT-116 cells (KRAS MT CRC). In addition to RNA expression, levels of the cyclin D1 and PCNA proteins were not significantly altered, but combination treatment produced reductions in their protein expressions in HCT-116 cells (KRAS MT CRC). The amount of c-Myc mRNA was significantly downregulated after treatment with tetrac or its combination with heteronemin in both cell lines compared to the control (Figure 8A). Consequently, Western blot analysis also showed similar results in terms of c-Myc protein expression after tetrac or combined treatment in HT-29 cells (KRAS WT CRC; Figure 8B). These results indicate that heteronemin combined with tetrac blocked cell cycle progression through the inactivation of c-Myc in HT-29 cells (KRAS WT CRC).

2.8. The Combined Treatment of Heteronemin and Tetrac Suppresses the Expression of PD-L1 in Human CRC Cells with Different KRAS Statuses

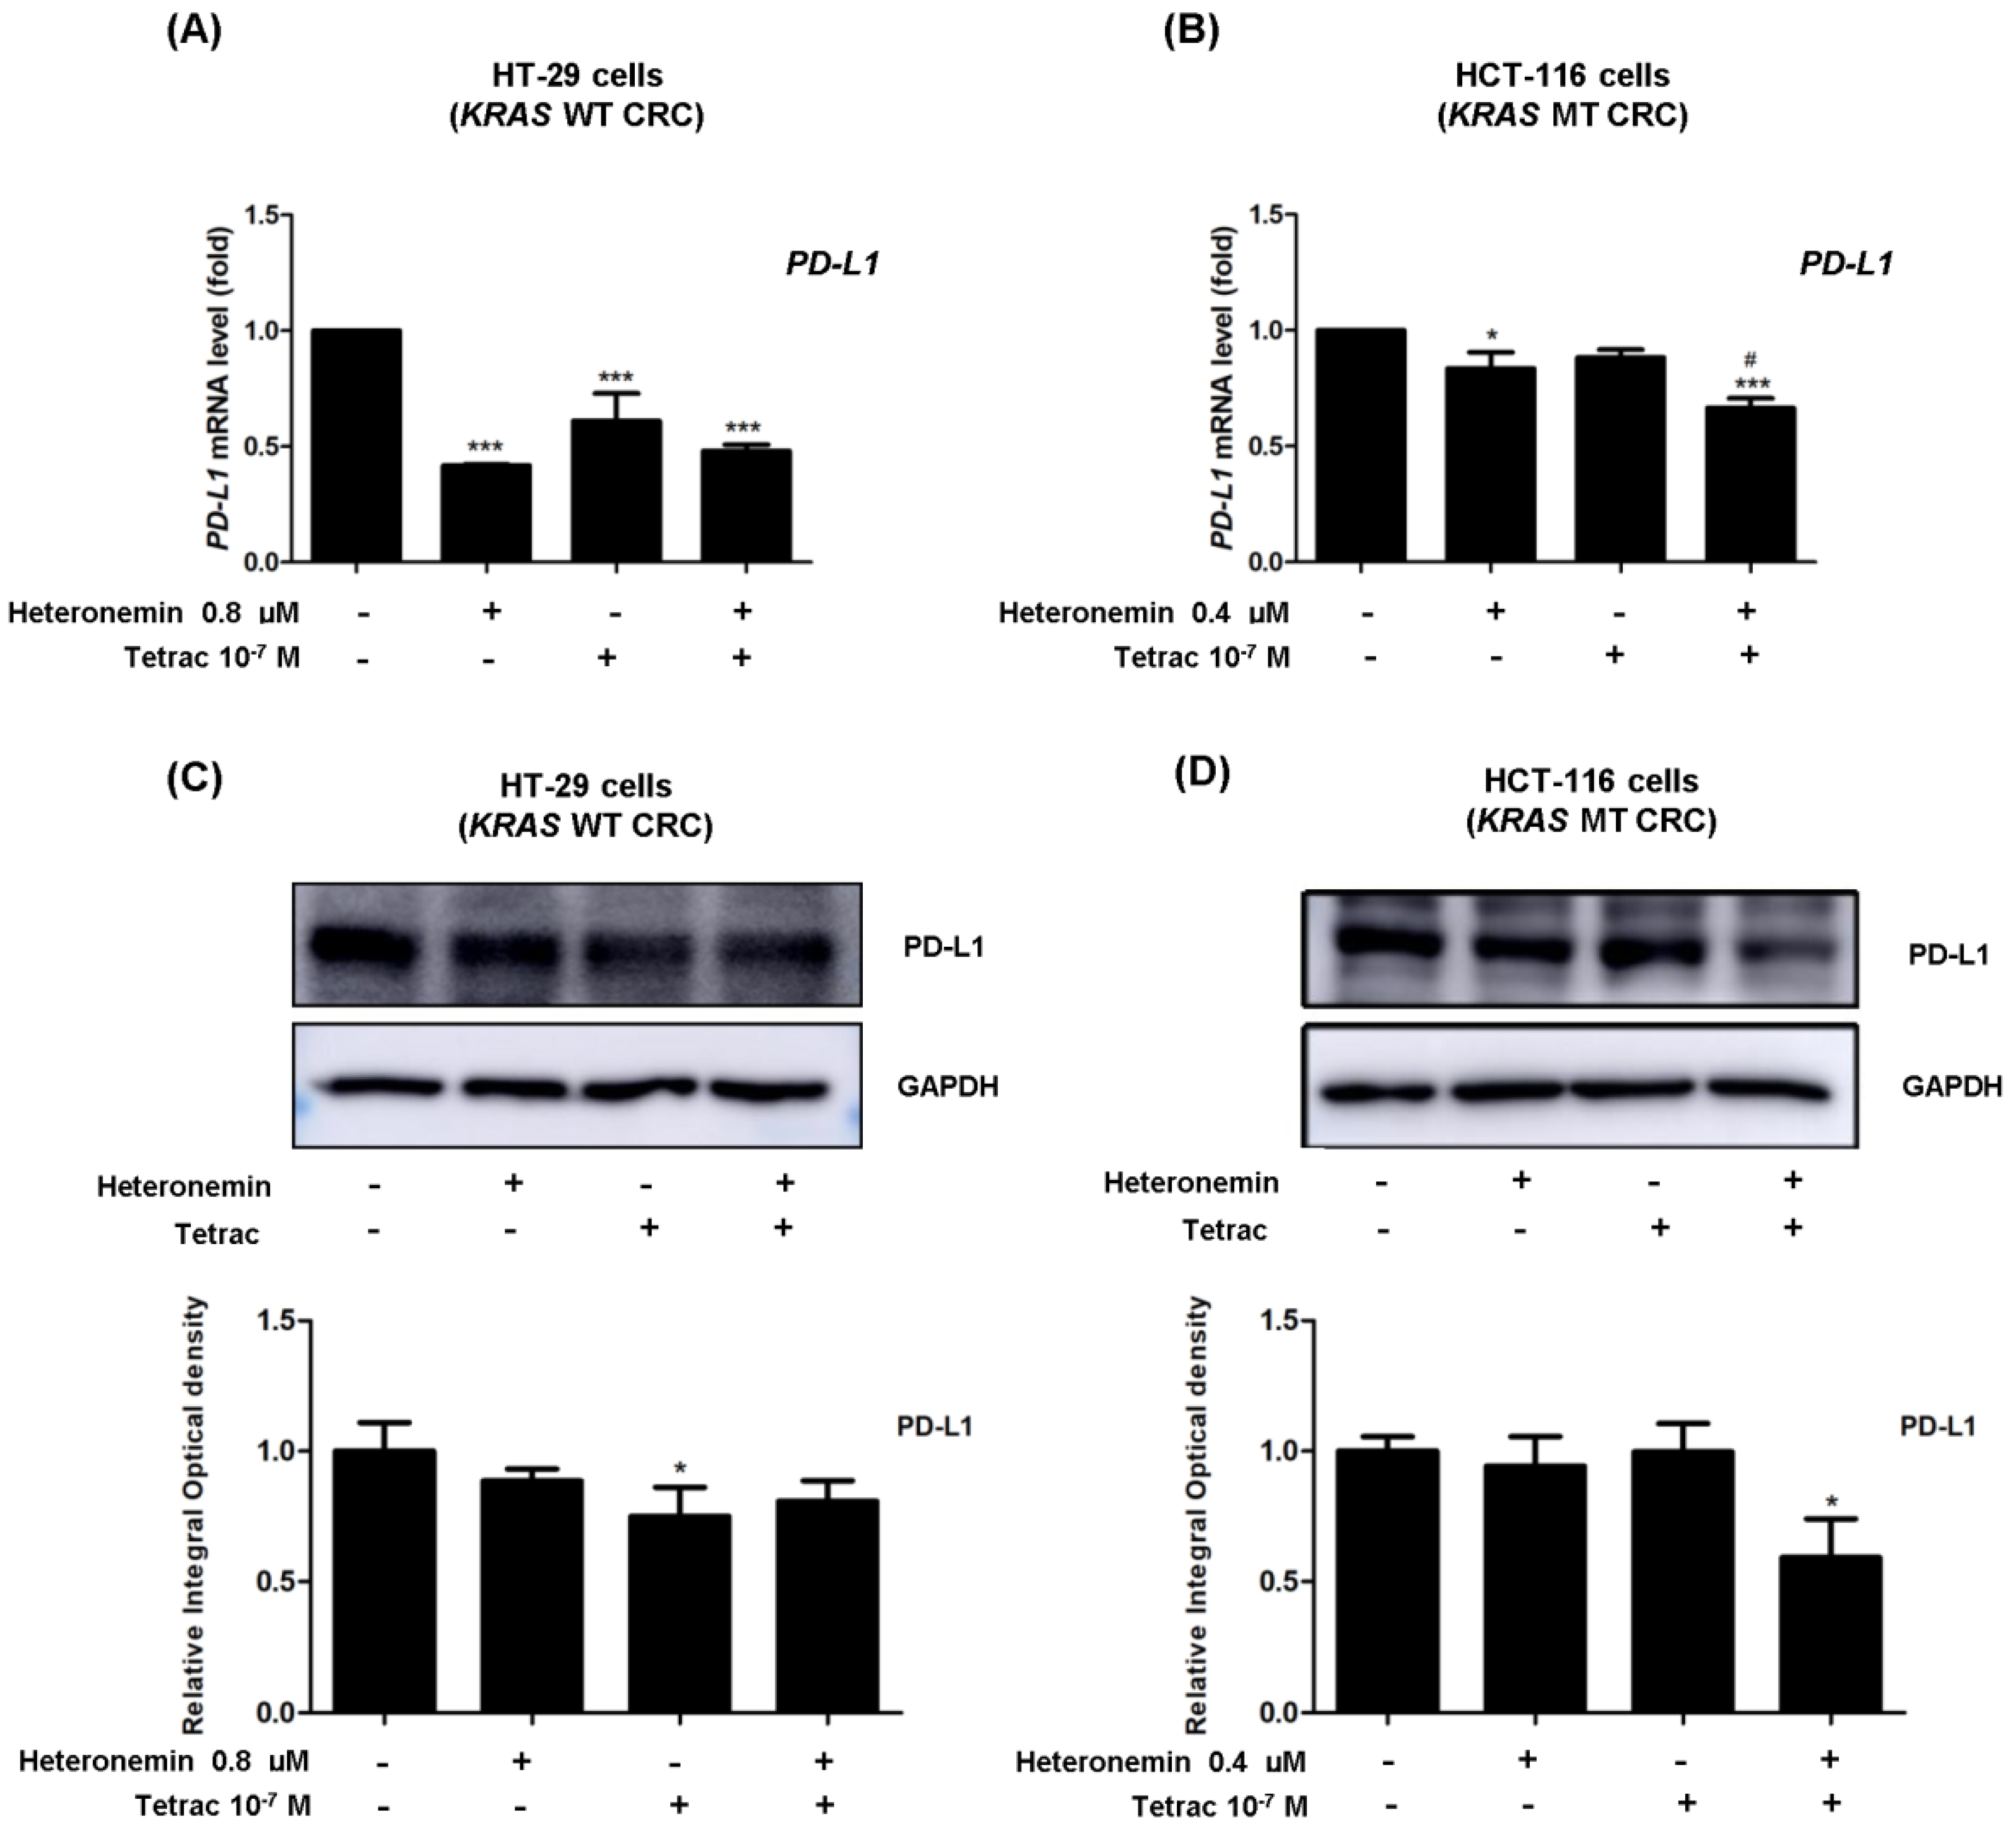
The activation of the EGFR signaling pathway is related to the host antitumor immunity through PD-L1 upregulation [9]. PD-L1 activation is related to the modulation of host immune responses [33]. Modulating EGFR activation also regulates PD-L1 expression [9]. We wondered if the inhibitory effect of heteronemin on PD-L1 expression was enhanced by tetrac link to EGFR signaling in CRC cells. We measured the levels of PD-L1 mRNA and protein for 24 h. Heteronemin or combined with tetrac significantly decreased PD-L1 mRNA levels in both cell lines. Western blot analyses revealed that combined treatment significantly suppressed the PD-L1 protein level in HCT-116 cells (KRAS MT CRC), consistent with the results of the PD-L1 mRNA level (Figure 9B,D). Similarly, there was a significant decrease in PD-L1 mRNA and protein levels after tetrac treatment in HT-29 cells (KRAS WT CRC; Figure 9A,C). These results demonstrate that combination treatment showed a link between EGFR/ERK1/2 signaling and PD-L1 in HCT-116 cells (KRAS MT CRC).

3. Discussion

Anti-EGFR monoclonal antibodies, including cetuximab and panitumumab, are used as targeted therapy for CRC treatment. Additionally, targeted drugs interfere with or inhibit specific proteins that are involved in cancer cell growth. However, these drugs are ineffective in patients with KRAS or BRAF mutations. Their efficacy depends on the genetic profile of CRC patients (WT or MT KRAS and BRAF) [34]. It was reported that heteronemin had an anticancer effect on several types of cancers [11,14,15,16,17,18]. Furthermore, targeting integrin αvβ3 by tetrac and its derivatives displays anticancer effects, such as abrogating angiogenesis and inhibiting tumor growth [11,14,15,16,17,18]. Therefore, the current study aimed to evaluate whether tetrac could improve the antitumor effect of heteronemin in CRC with different KRAS statuses. Our data demonstrated that tetrac enhanced the antitumor effect of heteronemin in HT-29 cells (KRAS WT CRC) and HCT-116 cells (KRAS MT CRC; Figure 1A,B).
The inhibition of tumor cell growth is usually mediated through cell cycle arrest. Previously, 2.5 and 5 µM heteronemin were shown to alter the distribution of apoptotic cells at the sub-G1 stage in HeLa cells [35]. Similar to that study, 0.4 and 0.8 µM heteronemin raised the percentage of the cell population at the sub-G1 phase in CRC cell lines (Figure 2A,B). We recently demonstrated that different concentrations of heteronemin altered different cell cycle stages, and the accumulation of cells in the G1 and G2/M stages increased with heteronemin combined with tetrac in OEC-M1 and SCC-25 cells, respectively [14]. In our study, combined treatment increased HT-29 (KRAS WT CRC) and HCT-116 (KRAS MT CRC) cell accumulation at the sub-G1 and S phases of the cell cycle compared to the control (Figure 2A,B). Although there were similar trends of cell cycle distributions between CRC cells with different KRAS statuses, this combination reduced the accumulation of cells in the sub-G1 phase compared to heteronemin alone in HT-29 cells (KRAS WT CRC).
As for EGFR-mediated signaling in the mutant KRAS, the EGFR/RAS/ERK and EGFR/RAS/PI3K signaling pathways contribute to cell proliferation and angiogenesis [36]. A previous study reported that heteronemin enhanced the antiproliferative activity of cytarabine by blocking farnesylation of the Ras protein leading to the downregulation of MAPK, activator protein (AP)-1, nuclear factor (NF)-κB, and c-Myc activation [17]. Tetrac induced the upregulation of gene expressions of both the antiangiogenic thrombospondin 1 (THBS1) and antiapoptotic XIAP in human breast cancer cells [37]. Thus, our data show that heteronemin, tetrac, and their combination significantly decreased expressions of EGF and EGFR mRNA in both cell lines with different KRAS statuses, except for heteronemin alone in HCT-116 cells (KRAS MT CRC; Figure 7A–D). In contrast, neither ERK1/2 nor PI3K significantly changed following treatment with single or combined agents. As to the detection of protein levels, we found that phosphorylated EGFR expression was significantly downregulated in both cell lines after 24 h of incubation with tetrac or its combination with heteronemin (Figure 3A), while total EGFR protein was significantly downregulated after combined treatment in HCT-116 cells (KRAS MT CRC; Figure 3B). The combined treatment suppressed PI3K activation in HT-29 cells (KRAS WT CRC). In hepatocellular carcinoma cell lines, antiproliferative activity was induced by heteronemin, which downregulated ERK/MAPK expressions and also promoted the formation of reactive oxygen species (ROS) [38]. We have recently shown that heteronemin suppressed ERK1/2 activation in breast cancer cells [19], similar to this study in HT-29 cells (KRAS WT CRC; Figure 4A). Additionally, this combination also reduced the ERK1/2 protein expressions in both CRC cell lines (Figure 4A,B).
NanoString nCounter technology was used to analyze gene expression profiling involved in cancer progression in HCT-116 cells (KRAS MT CRC). Our previous research showed that heteronemin modulated the expression levels of genes associated with signal transduction pathways in cancer progression, including cell motility and angiogenesis in cholangiocarcinoma cell lines (HuccT1 and SSP-25 cells) by NanoString technology [18]. Similar to that study, the downregulation of cell motility and EGFR gene expressions were reduced by heteronemin and combined with tetrac in HCT-116 cells (KRAS MT CRC; Figure 5 and Figure S1, Table 2). EGFR signaling pathways have been shown to regulate a series of important events, such as cell proliferation, angiogenesis, EMT, and tumor metastasis in CRC [6,30]. This study illustrated that tetrac improved the effect of heteronemin through reduction in those signaling pathway expressions compared to heteronemin (Figure 5A,B). Although the expressions of CCD1, PCNA, and c-Myc proteins did not show significant downregulation after treatments in HCT-116 cells (KRAS MT CRC), they might be involved in alterations of the list of genes (Figure S2).
It was observed that PD-L1 expression was more frequent in RAS or TP53 WT CRC than in RAS- or TP53-mutated CRC [39]. Moreover, upregulated PD-L1 was more highly expressed on the cell surface of KRAS mutant CRC. [40]. The thyroid hormone induces PD-L1 expression via ERK1/2 activation [41]. The nanoparticulate analog nano-diamino-tetrac (NDAT) inhibited PD-L1 expression in HCT-116 (KRAS MT CRC) xenograft model [42]. Our results show that the downregulation of PD-L1 expression was modulated by heteronemin combined with tetrac, and its expression was also linked to blockage of the EGFR/ERK1/2 signaling cascade in HCT-116 cells (KRAS MT CRC; Figure 9B). Conversely, the modulation of PD-L1 protein expression was significantly changed after tetrac alone in HT-29 cells (KRAS WT CRC; Figure 9A). Likewise, HCT-116 cells (KRAS MT CRC) were suppressed via the downregulation of the EGFR and ERK1/2 proteins. Combined treatment showed the impact of KRAS mutation status on the EGFR signaling pathway and antitumor immune response. Some gene expressions were not consistent with mRNA and protein expressions, including PI3K and ERK1/2. The differences in correlation between the percentage of mRNA and protein expression are caused by transcription and translation processes.

4. Materials and Methods

4.1. Chemicals

Heteronemin and tetraiodothyroacetic acid (purity >98%) were obtained from Sigma-Aldrich (St. Louis, MO, USA). Other chemicals used were of analytical grade or higher.

4.2. Cell Culture

Human CRC HT-29 cells (KRAS WT CRC) and HCT-116 cells (KRAS MT CRC) were purchased from American Type Culture Collection (ATCC®, Manassas, VA, USA) by the Bioresource Collection and Research Center (BCRC, Hsinchu, Taiwan). Cells were maintained in RPMI 1640 medium (Gibco®, Invitrogen, New York, NY, USA), supplemented with 10% fetal bovine serum, 100 U/mL penicillin, and 100 µg/mL streptomycin, under incubation conditions of 5% CO2 at 37 °C. Cells were placed in a 0.25% hormone-depleted serum-supplemented medium for 24 h of starvation before treatment.

4.3. Cell Proliferation Assay

Cell viability was evaluated by a CyQUANT® cell proliferation assay in which HT-29 cells (KRAS WT CRC) and HCT-116 cells (KRAS MT CRC) were seeded in six-well plates at a density of 105 cells/well. Cells were incubated overnight and then synchronized by 24 h of starvation. Cells were treated with 0.25% serum-stripped medium (vehicle control) or different concentrations of heteronemin, tetrac, or their combination for 24 and 72 h. After treatment, 50 µL of each sample was transferred in triplicate into 96-well plates in three independent experiments. Cells were supplemented with 100 µL of CyQUANT® NF reagent for 1 h at 37 °C. Thereafter, plates were detected using a microplate reader (Varioskan, ThermoFisher Scientific, Waltham, MA, USA), and the absorbance was measured with excitation at 485 nm and emission at 530 nm.

4.4. Cell Cycle Analysis

Cells were plated in six-well plates at a density of 105 cells/well followed by treatment with heteronemin, tetrac, or their combination for 24 h. Cells were harvested by trypsinization, fixed with 70% ethanol at −20 °C, washed with phosphate-buffered saline (PBS), and treated with 1 mL of Triton X-100 containing RNase A for 1 h. A propidium iodide (PI) solution (0.05 mg/mL) was used for cell staining in the dark for 30 min. Cells were analyzed using an Invitrogen Attune™ NxT Acoustic Focusing Cytometer (ThermoFisher Scientific, Waltham, MA, USA). The particular phase of the cell cycle with DNA content in the sub-G1, G1, S, and G2/M phases was estimated by Attune NxT Flow Cytometer software (vers. 4.2).

4.5. Western Blot Analysis

After the treatment period for each experiment, cells were lysed with cold RIPA lysis buffer, containing protease inhibitors (Sigma, St. Louis, MO, USA). Equal concentrations of protein samples (30 µg) were run on sodium dodecylsulfate polyacrylamide gel electrophoresis (SDS-PAGE), and transferred to polyvinylidene fluoride (PVDF) membranes, and blocked with 5% non-fat milk for 1 h. Thereafter, membranes were incubated with primary antibodies overnight at 4 °C. The following primary antibodies were used: rabbit anti-phospho-EGFR (1:1000), rabbit anti-cyclin D (1:1000), rabbit anti-PCNA (1:3000), mouse anti-GAPDH (1:10,000; GeneTex International, Hsinchu City, Taiwan), rabbit anti-EGFR (1:1000), rabbit anti-phospho-ERK1/2 (1:1000), rabbit anti-ERK1/2 (1:1000), rabbit anti-PD-L1(1:1000), rabbit anti-c-Myc (1:1000; Cell Signaling Technology, Beverly, MA, USA), rabbit anti-phospho-PI3K (1:2000; Abcam, Cambridge, MA, USA), and mouse anti-PI3K (1:1000; BD Bioscience, Franklin Lakes, NJ, USA). Membranes were washed in washing buffer and then incubated with a secondary antibody for 1 h. Protein bands were detected using images of Western blots visualized and recorded with an Amersham Imager 600 (GE Healthcare, Chicago, IL, USA). Blots were quantified using ImageJ software (National Institutes of Health, Bethesda, MD, USA).

4.6. NanoString Gene Expression Analysis

HCT-116 cells (KRAS MT CRC) were seeded in six-well plates overnight at a density of 105 cells/well. Cells were then treated with heteronemin, tetrac, or their combination for 24 h. Total RNA was isolated using the TRIzol reagent. For quality assurance, RNA samples with an RNA integrity number (RIN) of >5 were used for the NanoString® analysis. An nCounter PanCancer Progression Panel was used. Technical and biological normalization of the raw counts of each gene was performed using nSolver Software vers. 4.0. For technical normalization, a positive control factor was calculated for each sample. All normalization steps were performed using a Nanostring nCounter software analysis.

4.7. Reverse-Transcription Quantitative Polymerase Chain Reaction (RT-qPCR)

Total RNA was isolated from cultured cells, and an RNAspin Mini RNA Isolation Kit (Macheren-NAGEL, Duren, Germany) was used to remove genomic DNA. RevertAid H Minus First Strand cDNA Synthesis Kit (Thermo Scientific, Vilnius, Lithuania) was used for the synthesis of complementary (c)DNA from total RNA templates, according to the manufacturer’s instruction. cDNA was used as the template for real-time PCRs and analyses. Real-time PCRs were carried out using a QuantiNova™ SYBR® Green PCR Kit (Qiagen, Valencia, CA, USA). The samples had a final volume of 20 µL containing 1X SYBR Green Supermix and 0.7 µM for forward and reverse primer of each target gene. cDNA was run on a CFX Connect™ Real-Time PCR Detection System (Bio-Rad Laboratories, Hercules, CA, USA) with the following cycling conditions: 95 °C for 2 min, followed by 40 cycles of 95 °C for 5 min and 60 °C for 10 s. The messenger (m)RNA level of each target gene was normalized to GAPDH [43]. Specific primers are listed in Table 3.

4.8. Statistical Analysis

Data were analyzed with IBM® SPSS® statistics vers. 23 (SPSS, Armonk, NY, USA). Data are expressed as the mean ± standard deviation (SD). Data were statistically analyzed with a one-way analysis of variance (ANOVA) followed by post hoc Tukey’s honest significant difference (HSD) test for multiple group comparisons. p-values of < 0.05 were considered statistically significant.

5. Conclusions

Tetrac effectively improved the antiproliferative activity of heteronemin through the inactivation of the EGFR/ERK1/2 signaling pathway and induction of antitumor immunity via suppression of PD-L1 expression in HCT-116 cells (KRAS MT CRC). Moreover, ERK1/2 inactivation in HCT-116 cells (KRAS MT CRC) showed crosstalk between EGFR signaling and PD-L1 expressions. In contrast, combination treatment blocked EGFR activation and molecules downstream of the PI3K and ERK1/2 pathways in HT-29 cells (KRAS WT CRC). The different KRAS statuses had an impact on drug efficacy in particular CRC cell lines. The combination of tetrac and heteronemin might potentially be used as an alternative strategy to increase the effectiveness of acquired resistance to anti-EGFR therapy due to KRAS mutations. However, more preclinical and clinical studies need to be performed to determine the safety and effectiveness of this combination.

Supplementary Materials

The following supporting information can be downloaded at: https://www.mdpi.com/article/10.3390/md20080482/s1. Figure S1: Heatmap of cell motility genes that showed significant (p < 0.05) upregulation or downregulation; Figure S2: Heatmap of gene expressions involved in the cell cycle showed significant (p < 0.05) upregulation or downregulation.

Author Contributions

Conception and design, S.U., T.-C.C., W.-S.L. and H.-Y.L.; Development of methodology, S.U., Z.-L.L., C.-H.H. and Y.-N.Y.; Acquisition of data, S.U. and Z.-L.L.; Analysis and interpretation of data, S.U., Z.-L.L. and S.-H.W.; Writing, review, and revision of the manuscript, S.U., D.R.C., P.J.D. and H.-Y.L.; Technical support and advice, H.-M.H.; Study supervision, H.-Y.L., W.-S.L., J.W.-P. and K.W. All authors have read and agreed to the published version of the manuscript.

Funding

This research was supported in part by research grants (EDPJ108087, EDPJ109080 and EDAHS111028 to Y.-N. Yang). Additionally, the research was also supported in part by the Chair Professor Research Fund to K. Wang and J. Whang-Peng, by TMU Research Center of Cancer Translational Medicine from The Featured Areas Research Center Program within the framework of the Higher Education Sprout Project by the Ministry of Education (MOE) in Taiwan, by grants from the Ministry of Science and Technology, Taiwan (MOST110-2314-B-038-114 to J. Whang-Peng; MOST110-2314-B-038-119 to K. Wang and MOST110-2314-B-038-115 to H.-Y. Lin).

Institutional Review Board Statement

Not applicable.

Informed Consent Statement

Not applicable.

Data Availability Statement

The original contributions presented in the study are included in the article; further inquiries can be directed to the corresponding author.

Conflicts of Interest

The authors declare that the research was conducted in the absence of any commercial or financial relationships that could be construed as a potential conflict of interest.

References

  1. Mattiuzzi, C.; Sanchis-Gomar, F.; Lippi, G. Concise update on colorectal cancer epidemiology. Ann. Transl. Med. 2019, 7, 609. [Google Scholar] [CrossRef] [PubMed]
  2. Oh, J.E.; Kim, M.J.; Lee, J.; Hur, B.Y.; Kim, B.; Kim, D.Y.; Baek, J.Y.; Chang, H.J.; Park, S.C.; Oh, J.H.; et al. Magnetic resonance-based texture analysis differentiating kras mutation status in rectal cancer. Cancer Res. Treat. Off. J. Korean Cancer Assoc. 2020, 52, 51–59. [Google Scholar] [CrossRef] [PubMed] [Green Version]
  3. Jancík, S.; Drábek, J.; Radzioch, D.; Hajdúch, M. Clinical relevance of kras in human cancers. J. Biomed. Biotechnol. 2010, 2010, 150960. [Google Scholar] [CrossRef] [PubMed] [Green Version]
  4. Tabernero, J. The role of vegf and egfr inhibition: Implications for combining anti-vegf and anti-egfr agents. Mol. Cancer Res. MCR 2007, 5, 203–220. [Google Scholar] [CrossRef] [PubMed] [Green Version]
  5. Cohen, R.B. Epidermal growth factor receptor as a therapeutic target in colorectal cancer. Clin. Colorectal Cancer 2003, 2, 246–251. [Google Scholar] [CrossRef] [PubMed]
  6. Hubbard, J.M.; Alberts, S.R. Alternate dosing of cetuximab for patients with metastatic colorectal cancer. Gastrointest. Cancer Res. GCR 2013, 6, 47–55. [Google Scholar] [PubMed]
  7. Dong, Z.; Zhang, L.; Xu, W.; Zhang, G. Egfr may participate in immune evasion through regulation of b7-h5 expression in non-small cell lung carcinoma. Mol. Med. Rep. 2018, 18, 3769–3779. [Google Scholar] [CrossRef]
  8. Karapetis, C.S.; Khambata-Ford, S.; Jonker, D.J.; O’Callaghan, C.J.; Tu, D.; Tebbutt, N.C.; Simes, R.J.; Chalchal, H.; Shapiro, J.D.; Robitaille, S.; et al. K-ras mutations and benefit from cetuximab in advanced colorectal cancer. N. Engl. J. Med. 2008, 359, 1757–1765. [Google Scholar] [CrossRef] [Green Version]
  9. Chen, N.; Fang, W.; Zhan, J.; Hong, S.; Tang, Y.; Kang, S.; Zhang, Y.; He, X.; Zhou, T.; Qin, T.; et al. Upregulation of PD-L1 by egfr activation mediates the immune escape in egfr-driven nsclc: Implication for optional immune targeted therapy for nsclc patients with egfr mutation. J. Thorac. Oncol. Off. Publ. Int. Assoc. Study Lung Cancer 2015, 10, 910–923. [Google Scholar] [CrossRef] [PubMed] [Green Version]
  10. Wang, H.B.; Yao, H.; Li, C.S.; Liang, L.X.; Zhang, Y.; Chen, Y.X.; Fang, J.Y.; Xu, J. Rise of PD-L1 expression during metastasis of colorectal cancer: Implications for immunotherapy. J. Dig. Dis. 2017, 18, 574–581. [Google Scholar] [CrossRef]
  11. Wu, S.Y.; Sung, P.J.; Chang, Y.L.; Pan, S.L.; Teng, C.M. Heteronemin, a spongean sesterterpene, induces cell apoptosis and autophagy in human renal carcinoma cells. BioMed Res. Int. 2015, 2015, 738241. [Google Scholar] [CrossRef] [PubMed]
  12. Kamel, H.N.; Kim, Y.B.; Rimoldi, J.M.; Fronczek, F.R.; Ferreira, D.; Slattery, M. Scalarane sesterterpenoids: Semisynthesis and biological activity. J. Nat. Prod. 2009, 72, 1492–1496. [Google Scholar] [CrossRef] [PubMed]
  13. Chen, Y.C.; Lu, M.C.; El-Shazly, M.; Lai, K.H.; Wu, T.Y.; Hsu, Y.M.; Lee, Y.L.; Liu, Y.C. Breaking down leukemia walls: Heteronemin, a sesterterpene derivative, induces apoptosis in leukemia molt4 cells through oxidative stress, mitochondrial dysfunction and induction of talin expression. Mar. Drugs 2018, 16, 212. [Google Scholar] [CrossRef] [Green Version]
  14. Huang, C.H.; Huang, T.Y.; Chang, W.J.; Pan, Y.S.; Chu, H.R.; Li, Z.L.; Unson, S.; Chin, Y.T.; Lin, C.Y.; Huang, H.M.; et al. Combined treatment of heteronemin and tetrac induces antiproliferation in oral cancer cells. Mar. Drugs 2020, 18, 348. [Google Scholar] [CrossRef] [PubMed]
  15. Lee, M.G.; Liu, Y.C.; Lee, Y.L.; El-Shazly, M.; Lai, K.H.; Shih, S.P.; Ke, S.C.; Hong, M.C.; Du, Y.C.; Yang, J.C.; et al. Heteronemin, a marine sesterterpenoid-type metabolite, induces apoptosis in prostate lncap cells via oxidative and er stress combined with the inhibition of topoisomerase ii and hsp90. Mar. Drugs 2018, 16, 204. [Google Scholar] [CrossRef] [Green Version]
  16. Cheng, M.H.; Huang, H.L.; Lin, Y.Y.; Tsui, K.H.; Chen, P.C.; Cheng, S.Y.; Chong, I.W.; Sung, P.J.; Tai, M.H.; Wen, Z.H.; et al. Ba6 induces apoptosis via stimulation of reactive oxygen species and inhibition of oxidative phosphorylation in human lung cancer cells. Oxidative Med. Cell. Longev. 2019, 2019, 6342104. [Google Scholar] [CrossRef]
  17. Saikia, M.; Retnakumari, A.P.; Anwar, S.; Anto, N.P.; Mittal, R.; Shah, S.; Pillai, K.S.; Balachandran, V.S.; Peter, V.; Thomas, R.; et al. Heteronemin, a marine natural product, sensitizes acute myeloid leukemia cells towards cytarabine chemotherapy by regulating farnesylation of ras. Oncotarget 2018, 9, 18115–18127. [Google Scholar] [CrossRef] [Green Version]
  18. Lin, H.Y.; Tey, S.L.; Ho, Y.; Chin, Y.T.; Wang, K.; Whang-Peng, J.; Shih, Y.J.; Chen, Y.R.; Yang, Y.N.; Chen, Y.C.; et al. Heteronemin induces anti-proliferation in cholangiocarcinoma cells via inhibiting tgf-β pathway. Mar. Drugs 2018, 16, 489. [Google Scholar] [CrossRef] [PubMed] [Green Version]
  19. Yang, Y.S.H.; Li, Z.L.; Huang, T.Y.; Su, K.W.; Lin, C.Y.; Huang, C.H.; Chen, H.Y.; Lu, M.C.; Huang, H.M.; Lee, S.Y.; et al. Effect of estrogen on heteronemin-induced anti-proliferative effect in breast cancer cells with different estrogen receptor status. Front. Cell Dev. Biol. 2021, 9, 688607. [Google Scholar] [CrossRef]
  20. Wang, K.; Chen, Y.F.; Yang, Y.S.H.; Huang, H.M.; Lee, S.Y.; Shih, Y.J.; Li, Z.L.; Whang-Peng, J.; Lin, H.Y.; Davis, P.J. The power of heteronemin in cancers. J. Biomed. Sci. 2022, 29, 41. [Google Scholar] [CrossRef] [PubMed]
  21. Schmohl, K.A.; Nelson, P.J.; Spitzweg, C. Tetrac as an anti-angiogenic agent in cancer. Endocr. Relat. Cancer 2019, 26, R287–R304. [Google Scholar] [PubMed] [Green Version]
  22. Chung, C.C.; Huang, T.Y.; Chu, H.R.; De Luca, R.; Candelotti, E.; Huang, C.H.; Yang, Y.S.H.; Incerpi, S.; Pedersen, J.Z.; Lin, C.Y.; et al. Heteronemin and tetrac derivatives suppress non-small cell lung cancer growth via erk1/2 inhibition. Food Chem. Toxicol. An Int. J. Publ. Br. Ind. Biol. Res. Assoc. 2022, 161, 112850. [Google Scholar] [CrossRef] [PubMed]
  23. Rebbaa, A.; Chu, F.; Davis, F.B.; Davis, P.J.; Mousa, S.A. Novel function of the thyroid hormone analog tetraiodothyroacetic acid: A cancer chemosensitizing and anti-cancer agent. Angiogenesis 2008, 11, 269–276. [Google Scholar] [CrossRef] [PubMed]
  24. Chin, Y.T.; He, Z.R.; Chen, C.L.; Chu, H.C.; Ho, Y.; Su, P.Y.; Yang, Y.S.H.; Wang, K.; Shih, Y.J.; Chen, Y.R.; et al. Tetrac and ndat induce anti-proliferation via integrin αvβ3 in colorectal cancers with different k-ras status. Front. Endocrinol. 2019, 10, 130. [Google Scholar] [CrossRef] [Green Version]
  25. Ahmed, D.; Eide, P.W.; Eilertsen, I.A.; Danielsen, S.A.; Eknæs, M.; Hektoen, M.; Lind, G.E.; Lothe, R.A. Epigenetic and genetic features of 24 colon cancer cell lines. Oncogenesis 2013, 2, e71. [Google Scholar] [CrossRef] [PubMed]
  26. Nana, A.W.; Chin, Y.T.; Lin, C.Y.; Ho, Y.; Bennett, J.A.; Shih, Y.J.; Chen, Y.R.; Changou, C.A.; Pedersen, J.Z.; Incerpi, S.; et al. Tetrac downregulates β-catenin and hmga2 to promote the effect of resveratrol in colon cancer. Endocr. Relat. Cancer 2018, 25, 279–293. [Google Scholar] [CrossRef] [Green Version]
  27. Troiani, T.; Napolitano, S.; Della Corte, C.M.; Martini, G.; Martinelli, E.; Morgillo, F.; Ciardiello, F. Therapeutic value of egfr inhibition in crc and nsclc: 15 years of clinical evidence. ESMO Open 2016, 1, e000088. [Google Scholar] [CrossRef] [PubMed]
  28. Garcia, R.; Franklin, R.A.; McCubrey, J.A. Egf induces cell motility and multi-drug resistance gene expression in breast cancer cells. Cell Cycle 2006, 5, 2820–2826. [Google Scholar] [CrossRef] [PubMed] [Green Version]
  29. Choudhary, K.S.; Rohatgi, N.; Halldorsson, S.; Briem, E.; Gudjonsson, T.; Gudmundsson, S.; Rolfsson, O. Egfr signal-network reconstruction demonstrates metabolic crosstalk in emt. PLoS Comput. Biol. 2016, 12, e1004924. [Google Scholar] [CrossRef] [Green Version]
  30. Patnaik, S.; George, S.P.; Pham, E.; Roy, S.; Singh, K.; Mariadason, J.M.; Khurana, S. By moonlighting in the nucleus, villin regulates epithelial plasticity. Mol. Biol. Cell 2016, 27, 535–548. [Google Scholar] [CrossRef]
  31. Thiery, J.P.; Acloque, H.; Huang, R.Y.; Nieto, M.A. Epithelial-mesenchymal transitions in development and disease. Cell 2009, 139, 871–890. [Google Scholar] [CrossRef] [PubMed]
  32. Zhou, L.; Wu, F.; Jin, W.; Yan, B.; Chen, X.; He, Y.; Yang, W.; Du, W.; Zhang, Q.; Guo, Y.; et al. Theabrownin inhibits cell cycle progression and tumor growth of lung carcinoma through c-myc-related mechanism. Front. Pharmacol. 2017, 8, 75. [Google Scholar] [CrossRef] [PubMed]
  33. Han, Y.; Liu, D.; Li, L. Pd-1/pd-l1 pathway: Current researches in cancer. Am. J. Cancer Res. 2020, 10, 727–742. [Google Scholar] [PubMed]
  34. Martinelli, E.; Ciardiello, D.; Martini, G.; Troiani, T.; Cardone, C.; Vitiello, P.P.; Normanno, N.; Rachiglio, A.M.; Maiello, E.; Latiano, T.; et al. Implementing anti-epidermal growth factor receptor (egfr) therapy in metastatic colorectal cancer: Challenges and future perspectives. Ann. Oncol. Off. J. Eur. Soc. Med. Oncol. 2020, 31, 30–40. [Google Scholar] [CrossRef] [PubMed] [Green Version]
  35. Kittiwisut, S.; Rohena, C.C.; Yuenyongsawad, S.; Mooberry, S.L.; Plubrukarn, A. Antiproliferative effects of 12-oxoheteronemin vs heteronemin. Nat. Prod. Commun. 2014, 9, 359–360. [Google Scholar] [CrossRef] [PubMed] [Green Version]
  36. An, Z.; Aksoy, O.; Zheng, T.; Fan, Q.W.; Weiss, W.A. Epidermal growth factor receptor and egfrviii in glioblastoma: Signaling pathways and targeted therapies. Oncogene 2018, 37, 1561–1575. [Google Scholar] [CrossRef]
  37. Glinskii, A.B.; Glinsky, G.V.; Lin, H.Y.; Tang, H.Y.; Sun, M.; Davis, F.B.; Luidens, M.K.; Mousa, S.A.; Hercbergs, A.H.; Davis, P.J. Modification of survival pathway gene expression in human breast cancer cells by tetraiodothyroacetic acid (tetrac). Cell Cycle 2009, 8, 3562–3570. [Google Scholar] [CrossRef] [Green Version]
  38. Chang, W.T.; Bow, Y.D.; Fu, P.J.; Li, C.Y.; Wu, C.Y.; Chang, Y.H.; Teng, Y.N.; Li, R.N.; Lu, M.C.; Liu, Y.C.; et al. A marine terpenoid, heteronemin, induces both the apoptosis and ferroptosis of hepatocellular carcinoma cells and involves the ros and mapk pathways. Oxidative Med. Cell. Longev. 2021, 2021, 7689045. [Google Scholar] [CrossRef]
  39. Albitar, M.; Sudarsanam, S.; Ma, W.; Jiang, S.; Chen, W.; Funari, V.A.; Agersborg, S. Expression of PD-L1 in colorectal cancer that lack mutations in ras or tp53 genes. J. Clin. Oncol. 2017, 35, e14500. [Google Scholar] [CrossRef]
  40. Napolitano, S.; Matrone, N.; Muddassir, A.L.; Martini, G.; Sorokin, A.; De Falco, V.; Giunta, E.F.; Ciardiello, D.; Martinelli, E.; Belli, V.; et al. Triple blockade of egfr, mek and PD-L1 has antitumor activity in colorectal cancer models with constitutive activation of mapk signaling and PD-L1 overexpression. J. Exp. Clin. Cancer Res. CR 2019, 38, 492. [Google Scholar] [CrossRef] [Green Version]
  41. Lin, H.Y.; Chin, Y.T.; Nana, A.W.; Shih, Y.J.; Lai, H.Y.; Tang, H.Y.; Leinung, M.; Mousa, S.A.; Davis, P.J. Actions of l-thyroxine and nano-diamino-tetrac (nanotetrac) on PD-L1 in cancer cells. Steroids 2016, 114, 59–67. [Google Scholar] [CrossRef] [PubMed] [Green Version]
  42. Huang, T.Y.; Chang, T.C.; Chin, Y.T.; Pan, Y.S.; Chang, W.J.; Liu, F.C.; Hastuti, E.D.; Chiu, S.J.; Wang, S.H.; Changou, C.A.; et al. Ndat targets pi3k-mediated PD-L1 upregulation to reduce proliferation in gefitinib-resistant colorectal cancer. Cells 2020, 9, 1830. [Google Scholar] [CrossRef] [PubMed]
  43. Berehu, H.M.; Khan, M.I.; Chakraborty, R.; Lavudi, K.; Penchalaneni, J.; Mohapatra, B.; Mishra, A.; Patnaik, S. Cytotoxic potential of biogenic zinc oxide nanoparticles synthesized from swertia chirayita leaf extract on colorectal cancer cells. Front. Bioeng. Biotechnol. 2021, 9, 1276. [Google Scholar] [CrossRef]
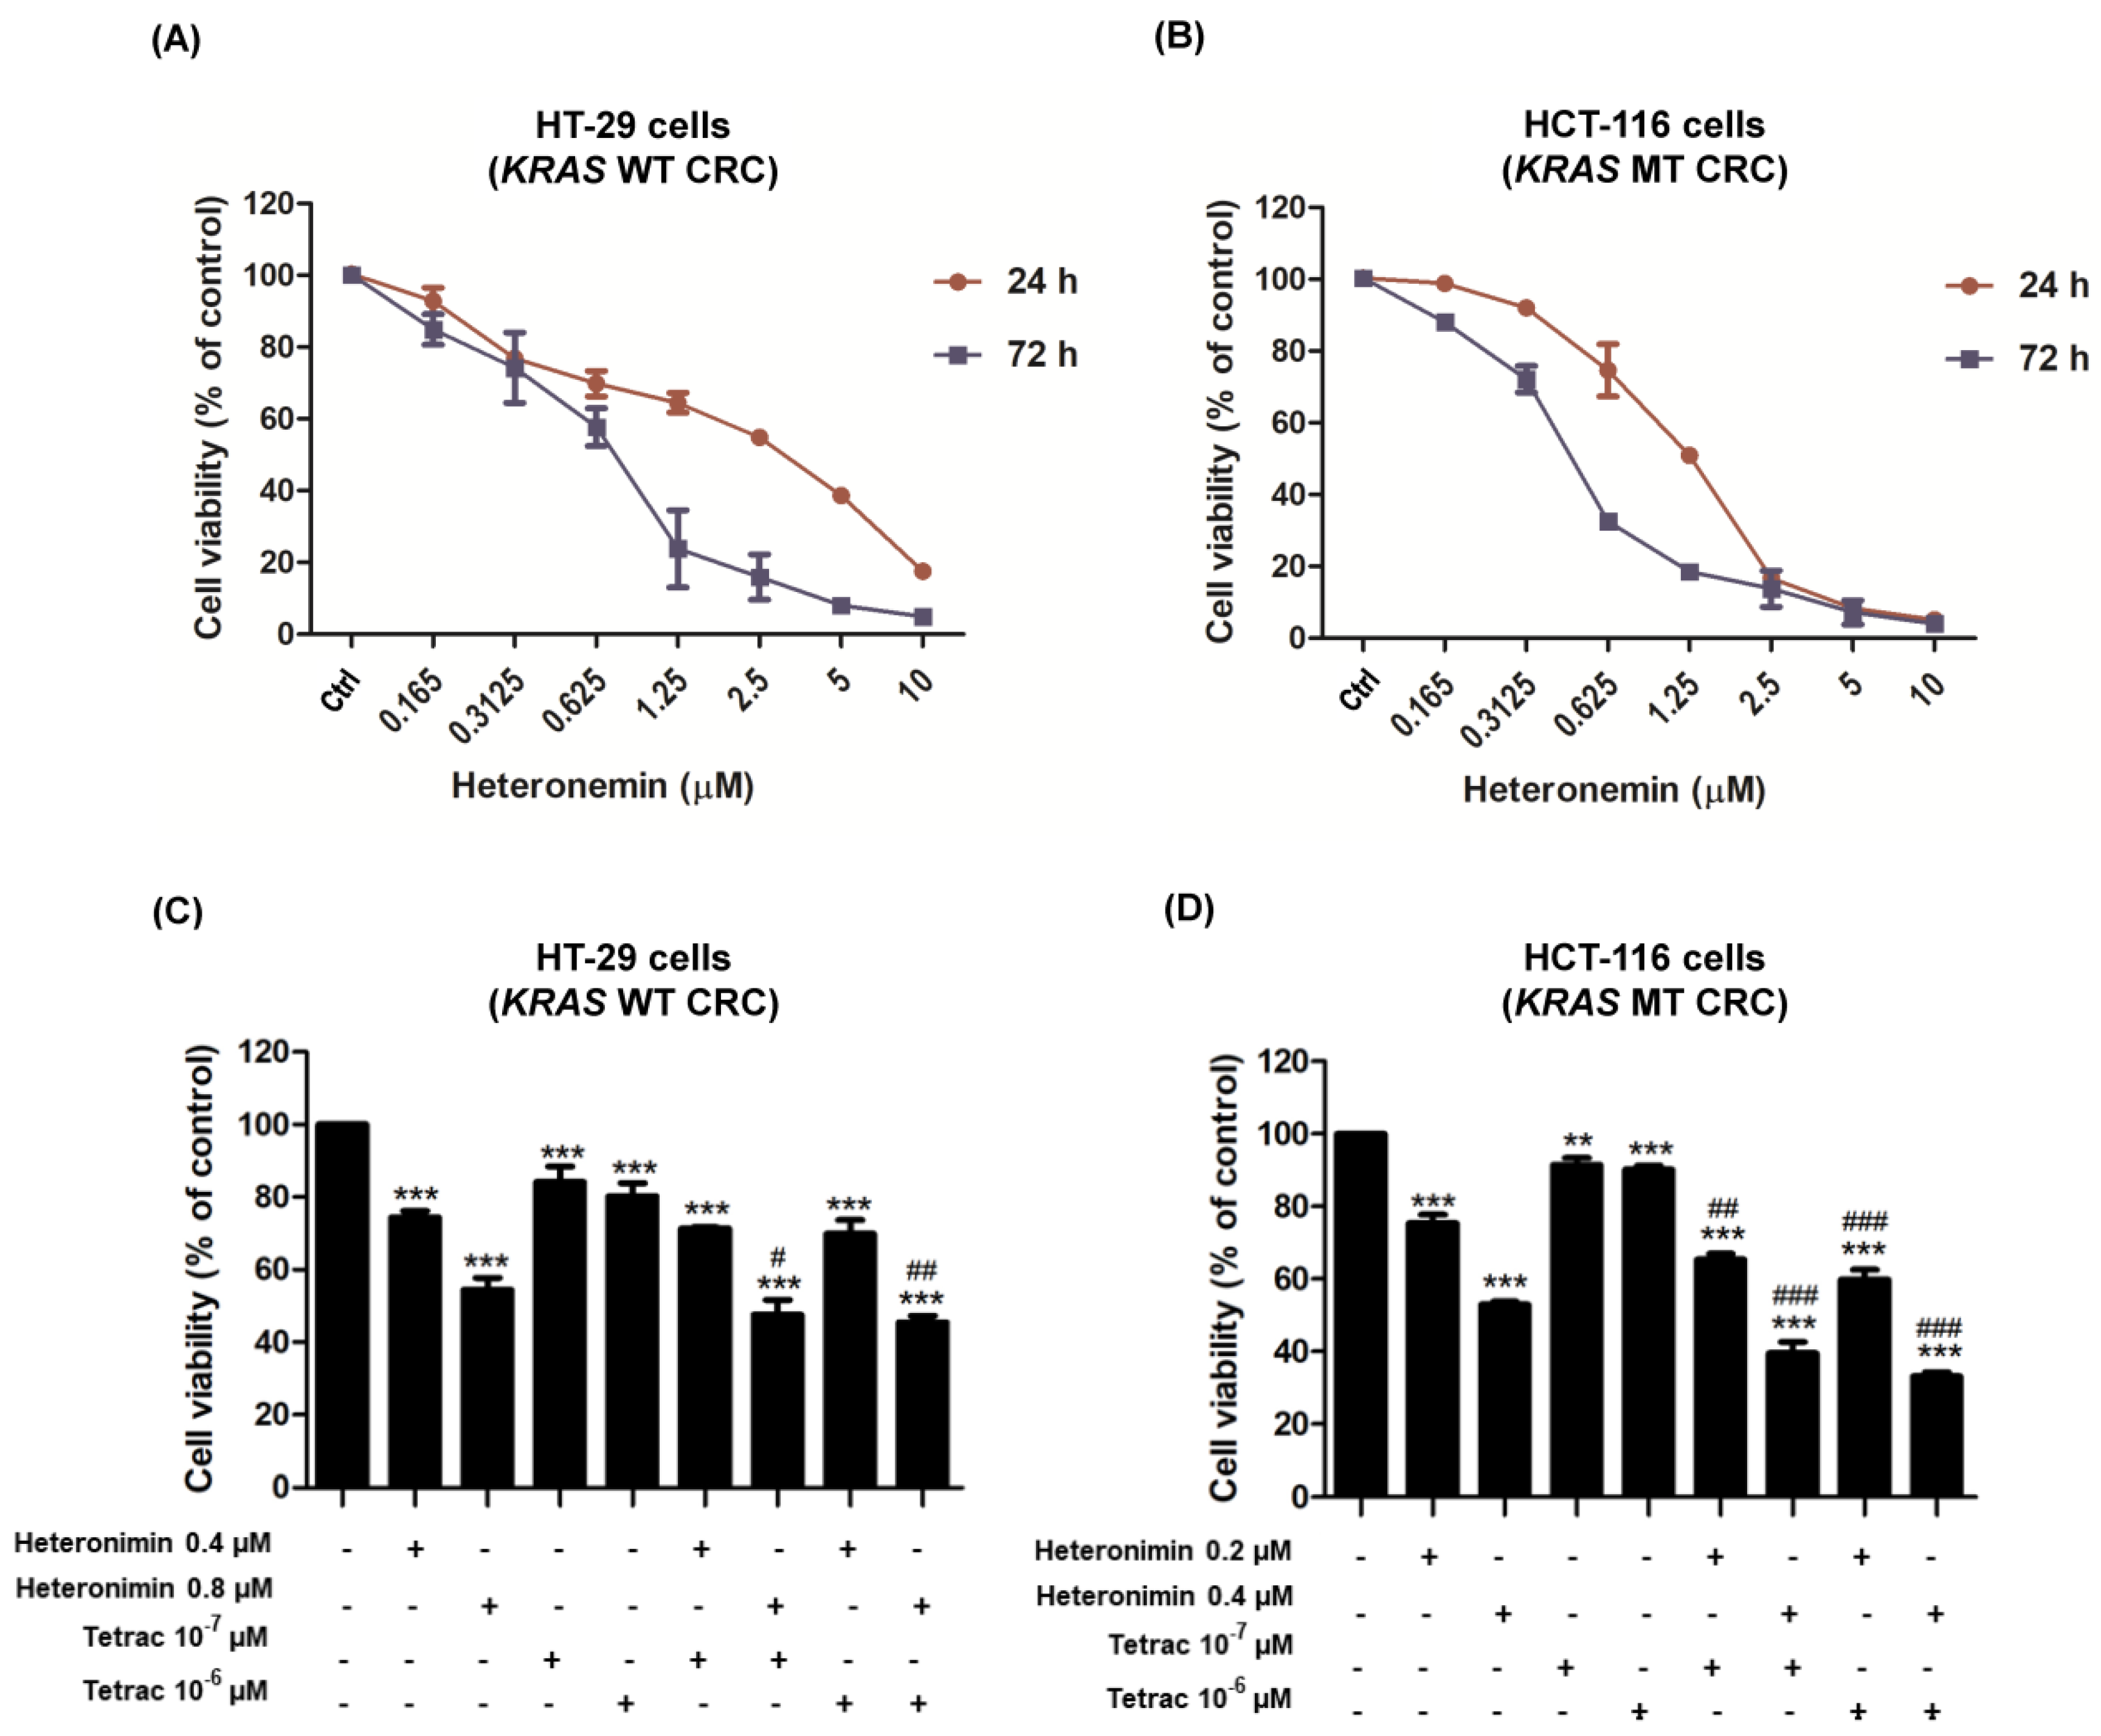
Figure 1. Tetrac enhances heteronemin-induced cytotoxicity in HT-29 cells (KRAS WT CRC) and HCT-116 cells (KRAS MT CRC). HT-29 cells (A) and HCT-116 cells (B) were treated with different concentrations of heteronemin for 24 and 72 h. IC50 values were calculated using GraphPad Prism V5.0. Cells were treated with heteronemin at IC50 concentrations, tetrac, or their combination for 72 h (C,D). The viabilities of HT-29 and HCT-116 cell lines were evaluated with a CyQUANT® cell proliferation assay. Data are presented as the mean ± SD of two or three independent experiments performed in triplicate. ** p < 0.01, and *** p < 0.001 compared with untreated control; # p < 0.05, ## p < 0.01 and ### p < 0.001 compared with heteronemin.
Marinedrugs 20 00482 g001
Figure 2. Combined treatment of heteronemin and tetrac alters the cell cycle in HT-29 cells (KRAS WT CRC) and HCT-116 cells (KRAS MT CRC). HT-29 cells (A) and HCT-116 cells (B) were treated with heteronemin, tetrac, or their combination for 24 h. Cells were harvested for cell cycle analysis by flow cytometry. Sub-G1, apoptosis phase; G0/G1, pre-DNA synthetic phase, and stationary phase; S, DNA synthesis phase; G2/M, post-DNA synthetic phase, and mitotic phase. Data are presented as the mean ± SD (n = 3). ** p < 0.01 and *** p < 0.001 compared with untreated control.
Marinedrugs 20 00482 g002
Figure 3. Combined treatment of heteronemin and tetrac alters the expression levels of EGFR. Western blot analyses showed changes in phosphorylated and total protein levels for 24 h in HT-29 cells (KRAS WT CRC) (A) and HCT-116 cells (KRAS MT CRC) (B). GAPDH was used as a loading control for protein normalization. Data are presented as the mean ± SD of three independent experiments. ** p < 0.01 and *** p < 0.001 compared with the untreated control; # p < 0.05, ## p < 0.01 and ### p < 0.01 compared with heteronemin.
Marinedrugs 20 00482 g003
Figure 4. Combined treatment of heteronemin and tetrac modulates protein levels of PI3K and ERK1/2. Western blot analyses showed changes in phosphorylated and total protein levels for 24 h in HT-29 cells (KRAS WT CRC) (A) and HCT-116 cells (KRAS MT CRC) (B). GAPDH was used as a loading control for protein normalization. Data are presented as the mean ± SD of three independent experiments. * p < 0.05, ** p < 0.01 and *** p < 0.001 compared with the untreated control; # p < 0.05 and ## p < 0.01 compared with heteronemin.
Marinedrugs 20 00482 g004
Figure 5. Heatmap of signal transduction pathways that showed significant (p < 0.05) upregulation or downregulation. The yellow region of the heatmap indicates upregulation, the blue region indicates downregulation, and the black indicates medial expression (A). The differential expression in each gene set represents the treatment compared with the control group. Correlations between signaling pathways in HCT-116 cells (KRAS MT CRC) after 24 h of treatment (B). The lower panel represents the mean of each treatment in the upper heatmap.
Marinedrugs 20 00482 g005
Figure 6. Pathway scores showed functional statuses of EGFR in HCT-116 cells (KRAS MT CRC). Pathway scores were analyzed by nSolverTM software for comparisons between the treated and control groups.
Marinedrugs 20 00482 g006
Figure 7. The combined treatment of heteronemin and tetrac regulates gene expressions. The levels of epidermal growth factor (EGF) (A,B), EGF receptor (EGFR) (C,D), phosphatidylinositol 3-kinase (PI3K) (E,F), and extracellular signal-regulated kinase 1/2 (ERK1/2) (G,H) in HT-29 cells (KRAS WT CRC) and HCT-116 cells (KRAS MT CRC) according to a qPCR. Data are presented as the mean ± SD for two or three independent experiments performed in triplicate. * p < 0.05, ** p < 0.01 and *** p < 0.001 compared with the untreated control; ## p < 0.01 ### p < 0.001 compared with heteronemin.
Marinedrugs 20 00482 g007
Figure 8. The combined treatment of heteronemin and tetrac alters the mRNA and protein expression of cell cycle regulators. Cells were treated with heteronemin, tetrac, and the combination for 24 h. Cells were harvested and total RNA was extracted for qPCR analyses of cyclin D1, proliferating cell nuclear antigen (PCNA), and c-Myc (A). HT-29 cells (KRAS WT CRC; upper panel) and HCT-116 cells (KRAS MT CRC; lower panel). Meanwhile, total proteins were extracted and Western blot analyses were conducted in HT-29 cells (B) and HCT-116 cells (C). Data are presented as the mean ± SD of three independent experiments. * p < 0.05, ** p < 0.01, and *** p < 0.001 compared with the untreated control; # p < 0.05 and ### p < 0.001 compared with heteronemin.
Marinedrugs 20 00482 g008
Figure 9. Tetrac with or without heteronemin alters the expression levels of PD-L1. RT-qPCR and Western blot analyses showed changes in mRNA levels (A,B) and protein levels (C,D) for 24 h in HT-29 cells (KRAS WT CRC) and HCT-116 cells (KRAS MT CRC). GAPDH was used as a loading control for RNA and protein normalization. Data are presented as the mean ± SD of three independent experiments. * p < 0.05 and *** p < 0.001 compared with the untreated control; # p < 0.05 compared with heteronemin.
Marinedrugs 20 00482 g009
Table 1. Significant modulation of genes induced by heteronemin, tetrac, and their combination versus the control in HCT -116 cells (KRAS MT CRC).
Gene NameHet vs. CtrlGene NameHet vs. CtrlGene NameTet vs. CtrlGene NameHet + Tet vs. CtrlGene NameHet + Tet vs. Ctrl
ACVR1C2.48ADAM9−1.40AP1M2−1.15ADAM171.55AGGF1−1.20
ACVRL11.81AKAP2−1.10DPYSL3−1.12ADM22.02AKT1−1.37
ADAM171.32AKT1−1.45LAMA5−1.10ANGPTL21.56AP1M2−1.40
ADM21.97AKT2−1.32MAPK3−1.23ANGPTL43.19ARAP2−1.58
AMH1.71AP1M2−1.50OCLN−1.13BTG11.63ATPIF1−1.34
ANGPTL42.16ARAP2−1.57 CCDC802.17BMP4−2.50
ANPEP2.54ATPIF1−1.39 CHRNA71.76BMP7−1.27
ARHGDIB2.42BMP4−2.30 CLDN71.31BMPR2−1.77
CADM12.47BMP7−1.45 CLU2.01CALD1−1.51
CCDC802.61BMPR2−1.51 COL7A12.10CAMK2D−1.54
CCL112.49CALD1−1.47 CTSL1.91CAV1−1.91
CD342.38CAMK2D−1.59 CXCL813.62CD2AP−1.24
CEACAM62.45CAV1−2.04 CYB5611.13CD44−1.19
CHRNA71.70CD24−1.49 F31.38CD46−1.45
CKMT1A2.70CD2AP−1.25 FGF21.64CDC42−1.27
CLDN31.32CD46−1.59 FUT31.54CEP170−1.34
CLU1.59CDC42−1.34 GDF151.98CEP295−1.17
COL1A12.15CDH1−1.36 HAS11.37COL18A1−1.52
COL5A21.89CDKN1A−1.37 HKDC13.16COL6A1−1.38
COL7A12.17CEP295−1.36 HMOX12.50COL6A2−1.08
COMP2.41CREBBP−1.21 JUN4.77CREBBP−1.25
CSPG41.57CRIP2−1.39 KRT71.78CRIP2−1.52
CTSK1.65CTNNB1−1.46 LAMA32.48CTNNB1−1.43
CXCL88.16CTNND1−1.49 LAMA51.12CTSH−2.07
DPT2.73CTSH−2.21 LAMB33.57DAG1−1.40
ELK31.23DAG1−1.35 LAMC22.07DICER1−1.17
EPN31.73DICER1−1.18 LLGL21.14DPYSL3−1.41
FUT32.03DPYSL3−1.40 MCAM1.26DST−1.26
GJA52.35DSC2−1.35 MISP1.65EGFR−1.24
HAS12.14DST−1.34 MYCL2.88EIF4E2−1.21
HKDC13.34EGFR−1.30 NDRG11.93ENPEP−1.32
HMOX12.14EIF4E2−1.18 NRP13.52ETV4−1.39
ICAM11.54ENPEP−1.35 PDGFA1.34EVPL−1.50
IL151.91EP300−1.19 PLAUR1.43FBLN1−1.52
IL1A1.61ETV4−1.28 POPDC33.04FGF9−1.57
IL1B2.57F11R−1.31 PTPRM1.92FGFR3−1.40
JUN3.51FN1−1.41 RAC21.17FN1−1.41
KRT72.46GALNT7−1.54 SERPINE11.81FSTL1−1.3
LAMA32.51GSN−1.67 SH2B31.14GALNT7−1.52
LAMB32.12GTF2I−1.59 SH2D3A1.45GPI−1.28
LAMC21.79HIF1A−1.28 SNAI12.93GSN−1.90
LLGL21.10HIPK2−1.15 SPP13.78GTF2I−1.62
LOXL21.99HSD17B12−1.32 THBS11.53ID1−1.55
MISP1.63ID1−1.60 VEGFA1.67ID2−2.37
MYCL3.23ID2−2.18 ITGA2−1.32
NDRG11.50ITGA1−1.40 ITGB4−1.67
NR4A31.58ITGA2−1.59 JAG1−2.36
NRP13.26ITGA5−1.21 KDM1A−1.54
OVOL21.80ITGB4−1.60 KIAA1462−1.69
PCOLCE2.49ITGB8−1.50 LDHA−1.53
PDGFA1.37JAG1−2.45 LGALS1−1.34
PFKFB11.52KDM1A−1.63 LTBP4−1.26
POPDC32.51KIAA1462−1.54 MAPK3−1.71
PRSS82.00LDHA−1.52 MTA1−1.18
PTGS22.55LGALS1−1.46 MTBP−1.22
PTK2B1.41MAP3K7−1.16 MYO1D−1.31
PTK62.12MAPK3−1.72 NFAT5−1.66
PTPRM1.67MMP14−1.52 NME1−1.39
PTRF1.88MTA1−1.30 NME4−1.48
SDC41.17MTOR−1.12 PDGFC−1.22
SERPINE11.33MYO1D−1.26 PIK3R2−1.37
SH2D3A1.35NFAT5−1.55 PLCG1−1.33
SHB1.79NME1−1.48 PLS1−1.24
SLC37A11.83NME4−1.22 PNPLA6−1.13
SLPI2.03P3H1−1.34 PTTG1−1.56
SNAI12.31PGK1−1.49 RAMP1−1.50
SPDEF2.11PIK3CA−1.25 RB1−1.30
SPP13.77POPDC32.51 RBL1−1.46
SRPX21.62PPP2R1A−1.45 RBX1−1.30
TACSTD22.45PRKCZ−1.12 RGCC−1.93
TBXA2R1.95PTEN−1.32 ROCK2−1.52
THBS11.49PTTG1−1.68 SACS−1.16
THY12.06PXDN−1.63 SCNN1A−1.51
TNFSF131.67RB1−1.27 SET−1.28
TYMP1.46RBL1−1.76 SMAD1−1.32
WARS1.55RBL2−1.20 SMAD2−1.30
RGCC−1.55 SMC3−1.27
ROCK2−1.50 SNRPF−1.25
RPS6KB1−1.18 SOD1−1.23
SACS−1.29 SOX9−1.51
SCNN1A−1.74 ST14−1.56
SERINC5−1.37 STAT1−1.18
SET−1.23 SYK−1.48
SLC2A1−1.19 TFDP1−1.46
SMAD1−1.39 TGFB1−1.31
SMAD4−1.14 TGFBR2−1.21
SMC3−1.37 TJP3−1.43
SMURF2−1.34 TMC6−1.40
SNAI12.31 TSPAN1−1.63
SOD1−1.12 VAMP8−1.34
SOD1−1.12 VCAN−1.68
SORD−1.27 WWTR1−1.20
SOX9−1.48
ST14−1.55
STAT3−1.28
TCF20−1.29
TFDP1−1.48
TGFBR2−1.29
TIMP1−1.45
TJP3−1.13
TMC6−1.49
TNFSF12−1.28
TP53−1.47
TSPAN1−1.53
VAMP8−1.59
WARS1.55
WWTR1−1.20
Table 2. Genes and growth factor pathways that drive multistep colorectal cancer progression.
Gene NameHet vs. Ctrlp-Value of Het vs. CtrlTet vs. Ctrlp-Value of Het vs. CtrlHet + Tet vs. Ctrlp-Value of Het vs. Ctrl
APC1.030.801.050.68−1.050.58
CTNND1−1.490.06−1.230.37−1.360.13
EGFR−1.300.04−1.080.29−1.240.01
IGF11.790.191.160.421.210.42
KRAS−1.200.08−1.110.37−1.110.10
PIK3CA (PI3K)−1.250.03−1.070.42−1.150.08
PTEN−1.320.02−1.110.48−1.170.06
SMAD4−1.140.04−1.090.25−1.110.11
TGFB1 (TGF-β)−1.110.06−1.040.30−1.310.02
TGFB2 (TGF-β)−1.110.06−1.090.42−1.090.42
TGFBR2−1.090.431.070.54−1.210.04
TP53−1.470.04−1.100.46−1.390.01
VEGFA1.430.061.010.891.670.01
VEGFB−1.140.44−1.070.40−1.280.18
Table 3. Gene primer sequences in this study.
Primer NameForward Primer (5′-3′)Reverse Primer (5′-3′)
EGFTTCTGTGGGAGCAGTGTGACCTCACCACCACAGGTTTCT
EGFRAATTTACAGGAAATCCTGCATGGCGATGCTCTCCACGTTGCACA
ERK1/2GCAGCTGAGCAATGACCATATTGCTTGCAATGTTCTCCTG
PI3KCCTGATCTTCCTCGTGCTGCTCATGCCAATGGACAGTGTTCCTCTT
PD-L1GTTGAAGGACCAGCTCTCCCACCCCTGCATCCTGCAATTT
CCD1CAAGGCCTGAACCTGAGGAGGATCACTCTGGAGAGGAAGCG
PCNATCTGAGGGCTTCGACACCTATCATTGCCGGCGCATTTTAG
c-MycTTCGGGTACTGGAAAACCAGCAGCAGCTCGAATTTCTTCC
GAPDHAGGGCTGCTTTTAACTCTGGTCCCCACTTGATTTTGGAGGGA
Publisher’s Note: MDPI stays neutral with regard to jurisdictional claims in published maps and institutional affiliations.