Article

S-Assimilation Influences in Carrageenan Biosynthesis Genes during Ethylene-Induced Carposporogenesis in Red Seaweed Grateloupia imbricata

by
Diana del Rosario-Santana
,
Rafael R. Robaina
and
Pilar Garcia-Jimenez
*
Departamento de Biologia, Facultad de Ciencias del Mar, Instituto de Estudios Ambientales y Recursos Naturales, Universidad de Las Palmas de Gran Canaria, E-35017 Las Palmas de Gran Canaria, Canary Islands, Spain
*
Author to whom correspondence should be addressed.
Mar. Drugs 2022, 20(7), 436; https://doi.org/10.3390/md20070436
Submission received: 24 May 2022 / Revised: 23 June 2022 / Accepted: 28 June 2022 / Published: 29 June 2022
(This article belongs to the Special Issue Marine Drugs Research in Spain)

Abstract

:
The synthesis of cell-wall sulfated galactans proceeds through UDP galactose, a major nucleotide sugar in red seaweed, whilst sulfate is transported through S-transporters into algae. Moreover, synthesis of ethylene, a volatile plant growth regulator that plays an important role in red seaweed reproduction, occurs through S-adenosyl methionine. This means that sulfur metabolism is involved in reproduction events as well as sulfated galactan synthesis of red seaweed. In this work we study the effects of methionine and MgSO4 on gene expression of polygalactan synthesis through phosphoglucomutase (PGM) and galactose 1 phosphate uridyltransferase (GALT) and of sulfate assimilation (S-transporter and sulfate adenylyltransferase, SAT) using treatment of ethylene for 15 min, which elicited cystocarp development in Grateloupia imbricata. Also, expressions of carbohydrate sulfotransferase and galactose-6-sulfurylase in charge of the addition and removal of sulfate groups to galactans backbone were examined. Outstanding results occurred in the presence of methionine, which provoked an increment in transcript number of genes encoding S-transporter and assimilation compared to controls regardless of the development stage of thalli. Otherwise, methionine diminished the transcript levels of PGM and GALT and expressions are associated with the fertilization stage of thalli of G. imbricata. As opposite, methionine and MgSO4 did not affect the transcript number of carbohydrate sulfotransferase and galactose-6-sulfurylase. Nonetheless, differential expression was obtained for sulfurylases according to the development stages of thalli of G. imbricata.

1. Introduction

Seaweeds are rich in sulfated galactans, accounting for over 60% of the carrageenan dry weight in red seaweed. Carrageenans are made of a backbone with linear chains of repeating D-galactose sugars and 3,6-anhydrogalactose units, with a different number and location of the sulfate groups attached. Sulfation and desulfation generate different carrageenan types such as κ-, ι-, and λ-carrageenan, which may even be found in different phases of the life cycle, albeit seaweeds can also contain hybrid carrageenans [1]. Sulfation takes place by the action of carbohydrate sulfotransferase and desulfation by galactose-6-sulfurylase (Figure 1), although its role is not fully clarified [2]. Galactose-6-sulfurylase catalyzes the conversion of μ-carrageenan into κ-carrageenan, but λ-carrageenan does not seem to be susceptible to its action [3,4]. Carrageenan type and the degree of sulfation render the thallus flexible, and differences in the strengths of carrageenans are related to algal development stage. Genes encoding carbohydrate sulfotransferase and galactose-6-sulfurylase have been associated at different development stages of red seaweed Grateloupia imbricata with the seasonal period [5].
Synthesis of cell-wall-sulfated galactans proceeds through UDP galactose, a major nucleotide sugar in red seaweed [6]. Sulfate is transported into algae through S-transporter and then activated by Sulfate adenylyltransferase (SAT). These reactions yield adenosine-5′-phosphosulfate (APS) that is phosphorylated to 3′phosphoadenosine-5′-phosphosulfate (PAPS); both are the source of sulfation of UDP galactose. Although little is known about what happens inside algae, UDP galactose can also be obtained reversibly from UDP-glucose and glucose 1-P by means of galactose 1 phosphate uridyltransferase (GALT). Phosphoglucomutase (PGM), on the other hand, operates in the conversion of glucose 6-P to glucose 1-P (Figure 1; [7]). Furthermore, biosynthesis of the hexose-phosphate pool addresses the polysaccharides synthesis as it occurs in the brown seaweed Saccharina japonica [8] and in the unicellular red alga Galdieria sulphuraria [7].
Moreover, a central and important role in sulfur metabolism in algae and plants is played by S-adenosylmethionine (SAM; [9]), which has as its precursor as the sulfur-containing amino acid methionine. SAM is, in turn, the precursor of ethylene, a plant growth regulator with conspicuous functions in red seaweed reproduction. In particular, a treatment of ethylene for 15 min elicited cystocarps in an early stage of development in the carragenophytic red seaweed Grateloupia imbricata (cystocarp disclosure; [10,11,12,13]).
It was hypothesized that carrageenan synthesis could be affected by S-compounds, namely, sulfate and methionine, in ethylene-induced stages of development. Thus, under a working model with the carragenophytic G. imbricata and a set time period to elicit cystocarp disclosure by supplying exogenous ethylene (Figure 2), our aim was to analyze the expressions of genes involved in processes of S-transport and assimilation, and in synthesis of UDP-galactose as a precursor of carrageenan synthesis through PGM and GALT. Furthermore, genes responsible for sulfation (carbohydrate sulfotransferase) and desulfation (galactose-6-sulfurylase I, II) of galactan backbone of cell-wall polysaccharides were analyzed. Monitoring of cystocarp disclosure is carried out with the marker gene of reproduction of red seaweed, ornithine decarboxylase (ODC; [14])

2. Results

A candidate gene of reproduction in red seaweed, ornithine decarboxylase (ODC), showed differential expression for infertile thalli (2.75 ± 2.1 × 10⁻² copies μL−1) compared to that for thalli within early-stage cystocarp development (1.3 ± 1.8 × 10⁻² copies μL−1), as expected [10].

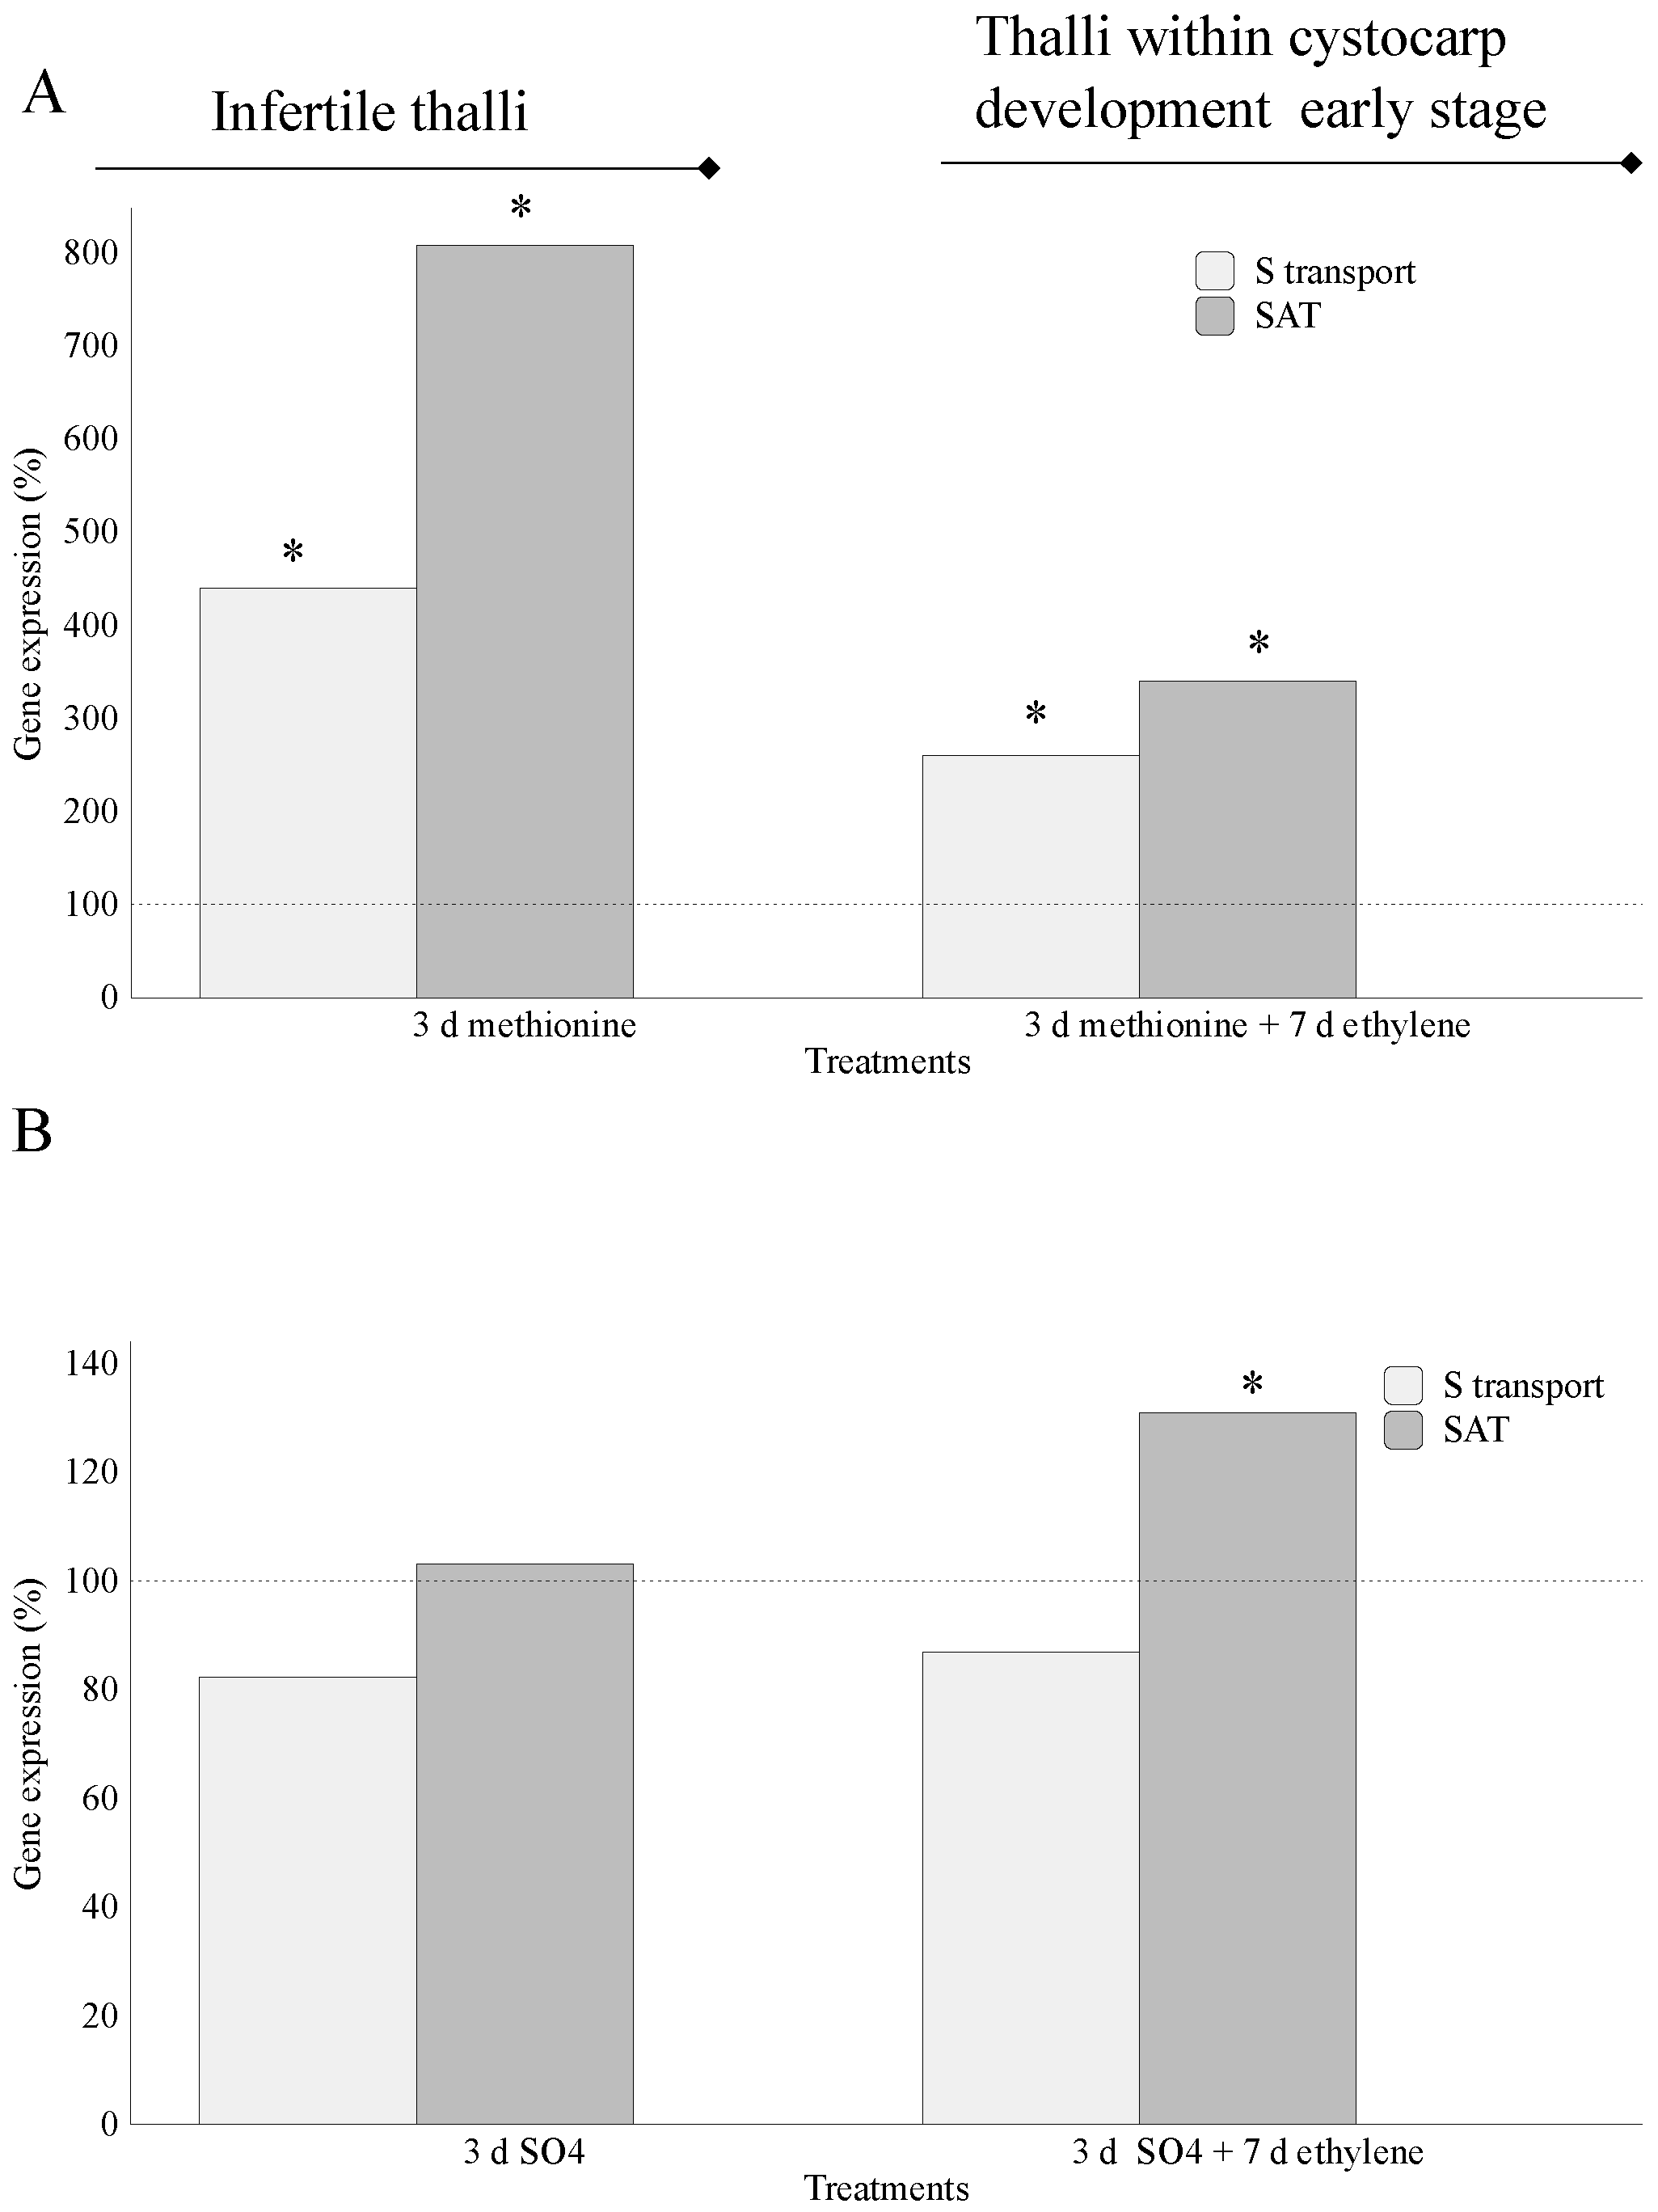
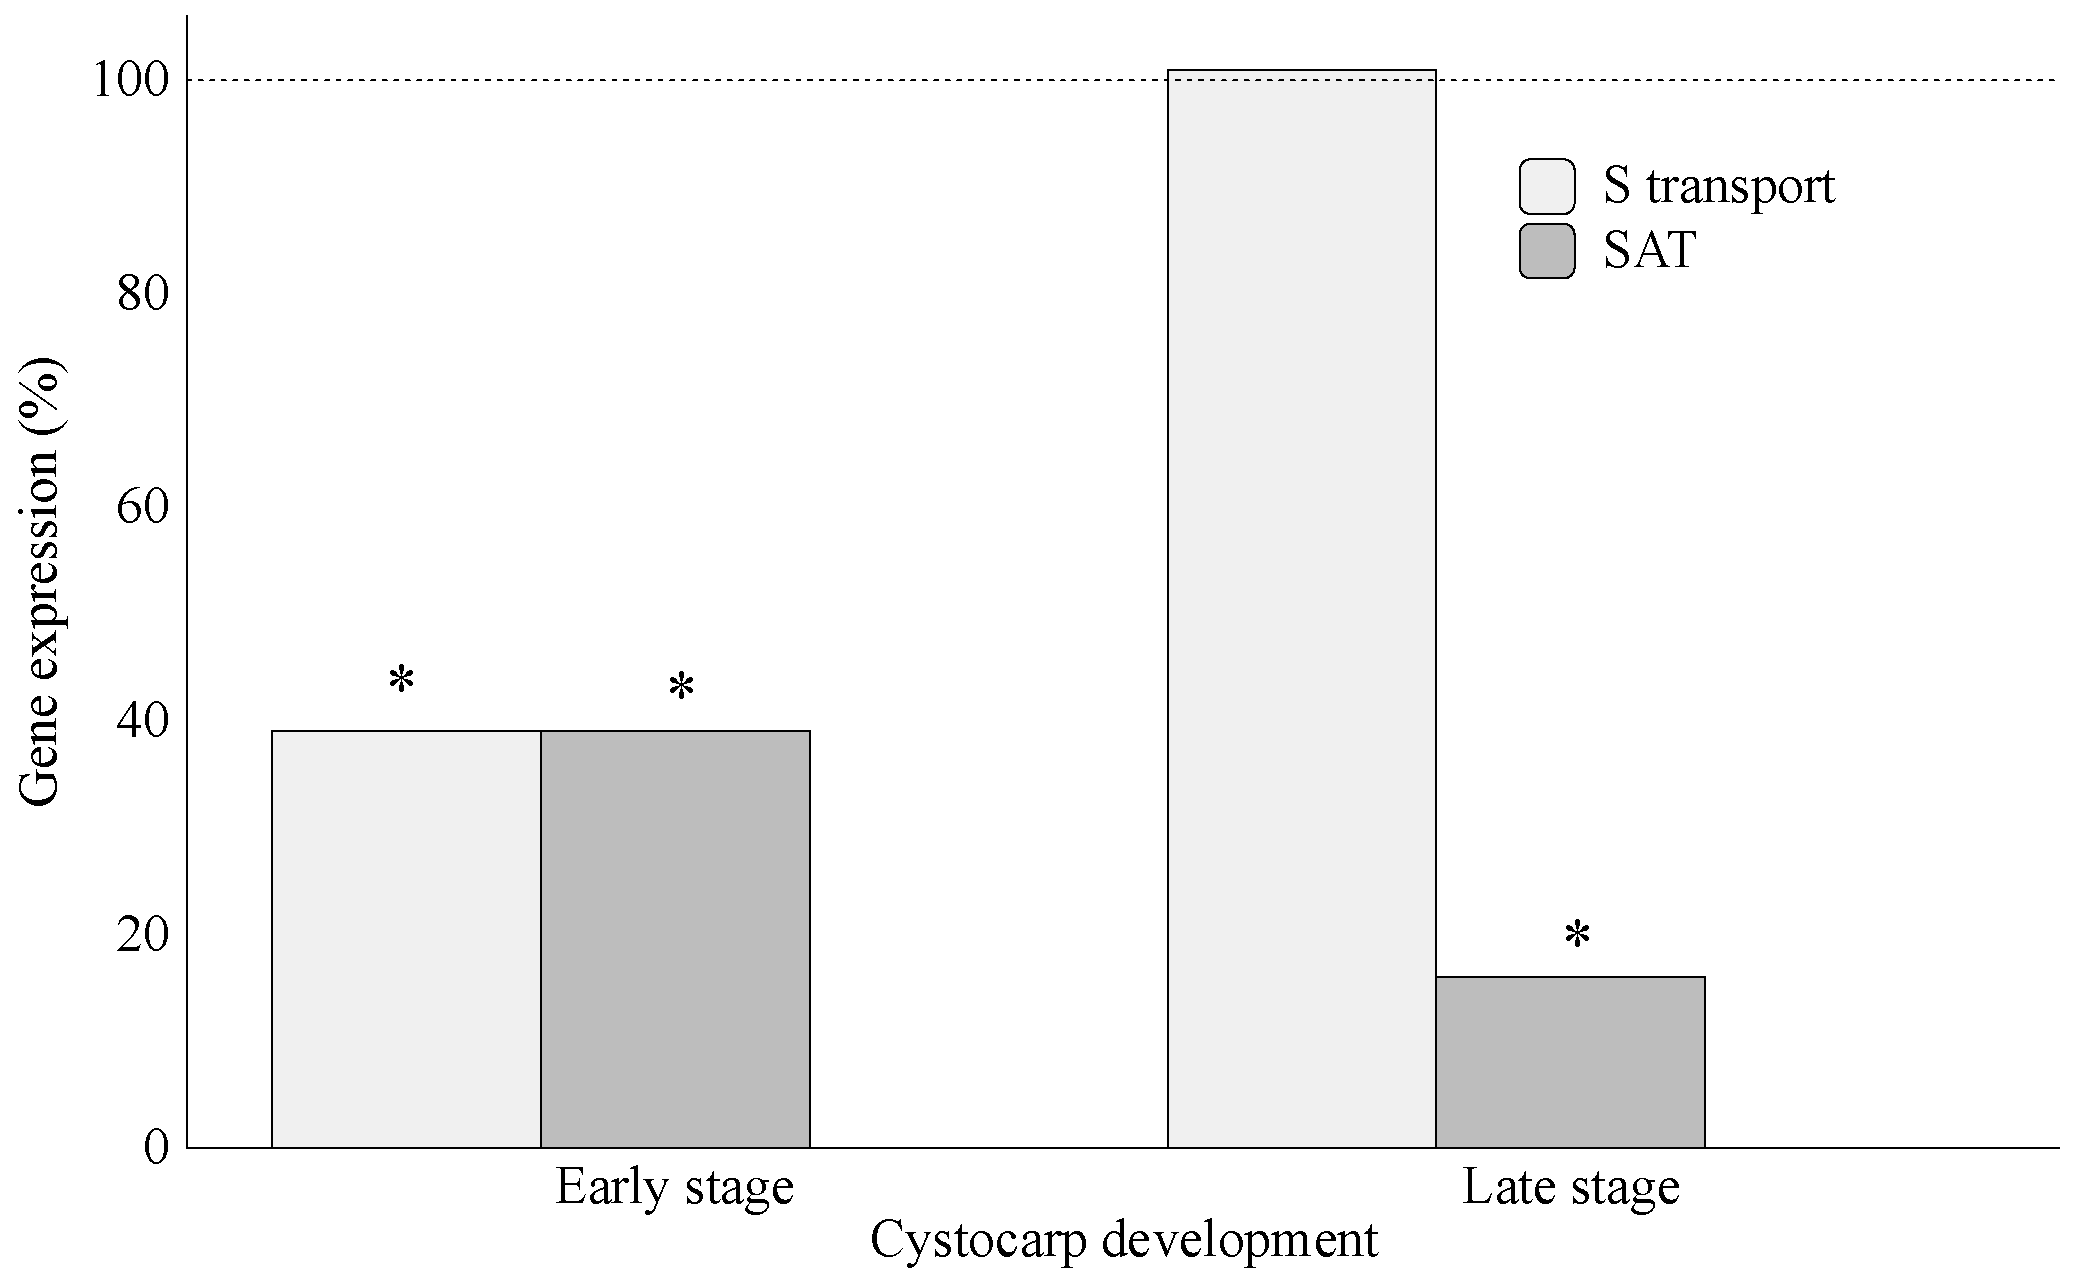
2.1. Assimilation of S-Source

Thalli previously treated with methionine, as an external S-source, showed significant differences for gene-encoding S-transporter and SAT compared to their controls. Furthermore, S-transporter (440%) and SAT (807.7%) gene expressions were higher in infertile thalli compared to those in thalli within early-stage cystocarp-development (260% for S-transporter and 340% for SAT; Figure 3A). No significant differences were observed in thalli treated with MgSO4, with the exception of SAT expression in thalli within early-stage cystocarp development (131%; Figure 3B).

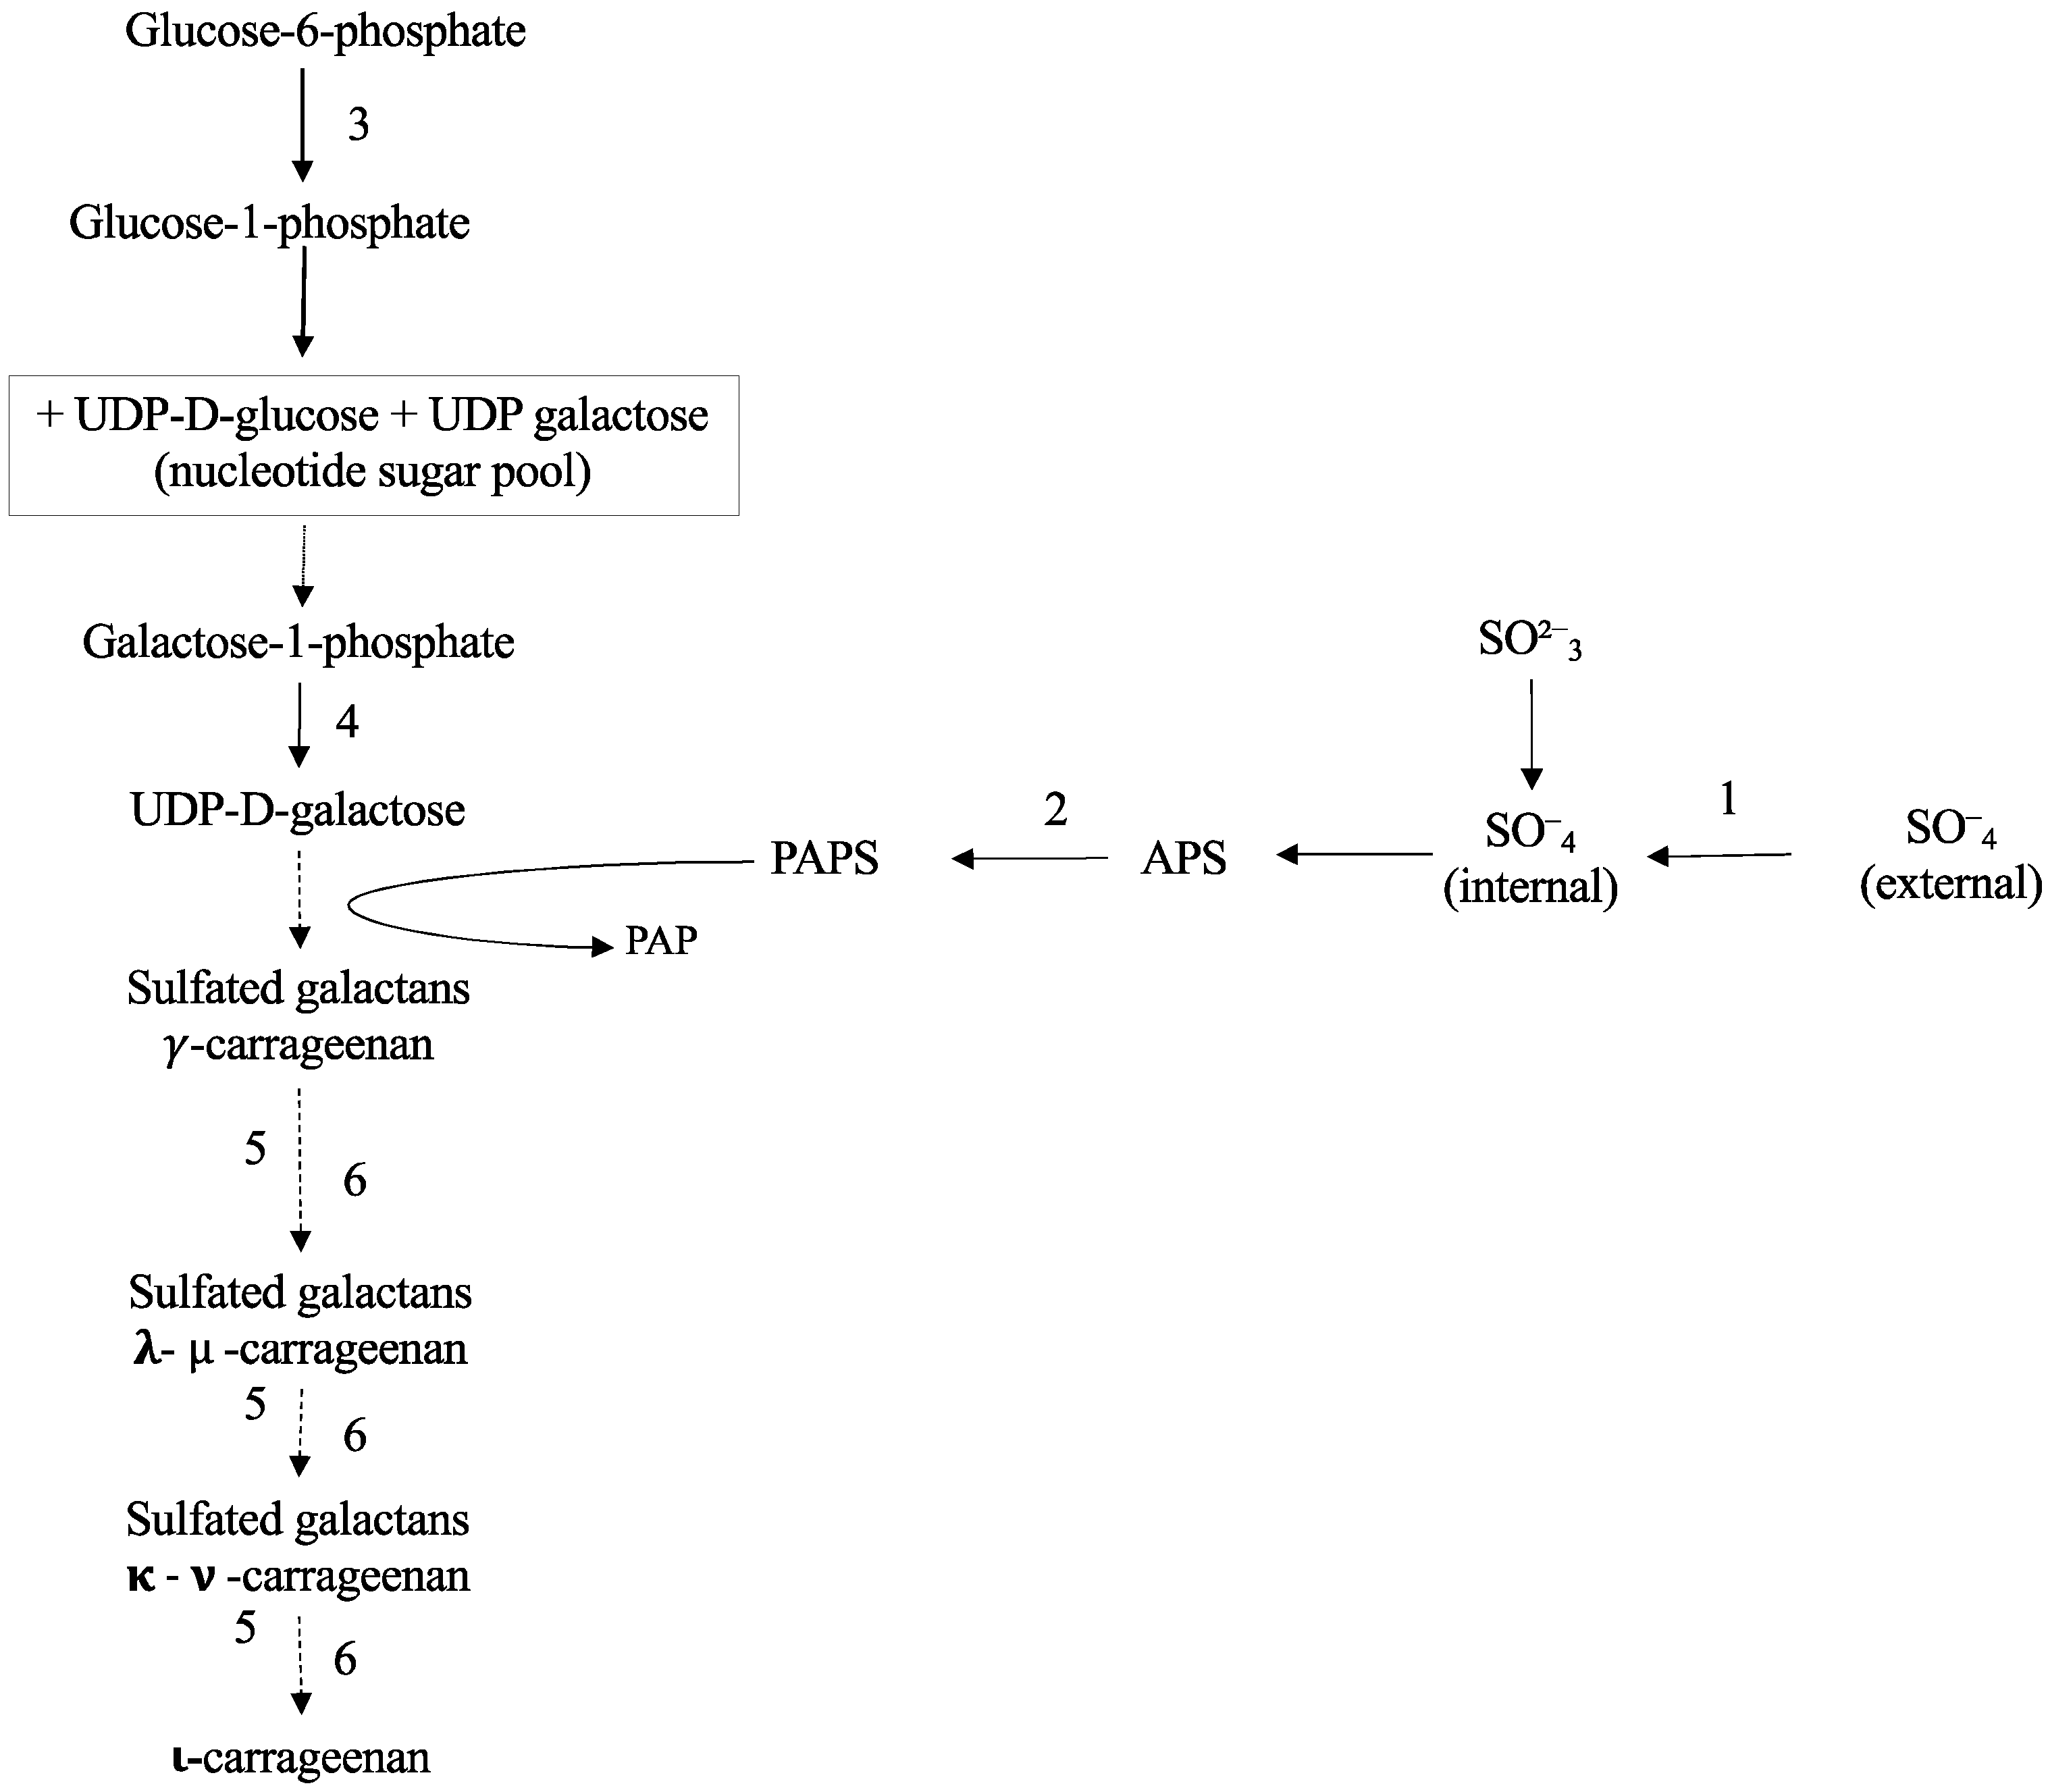
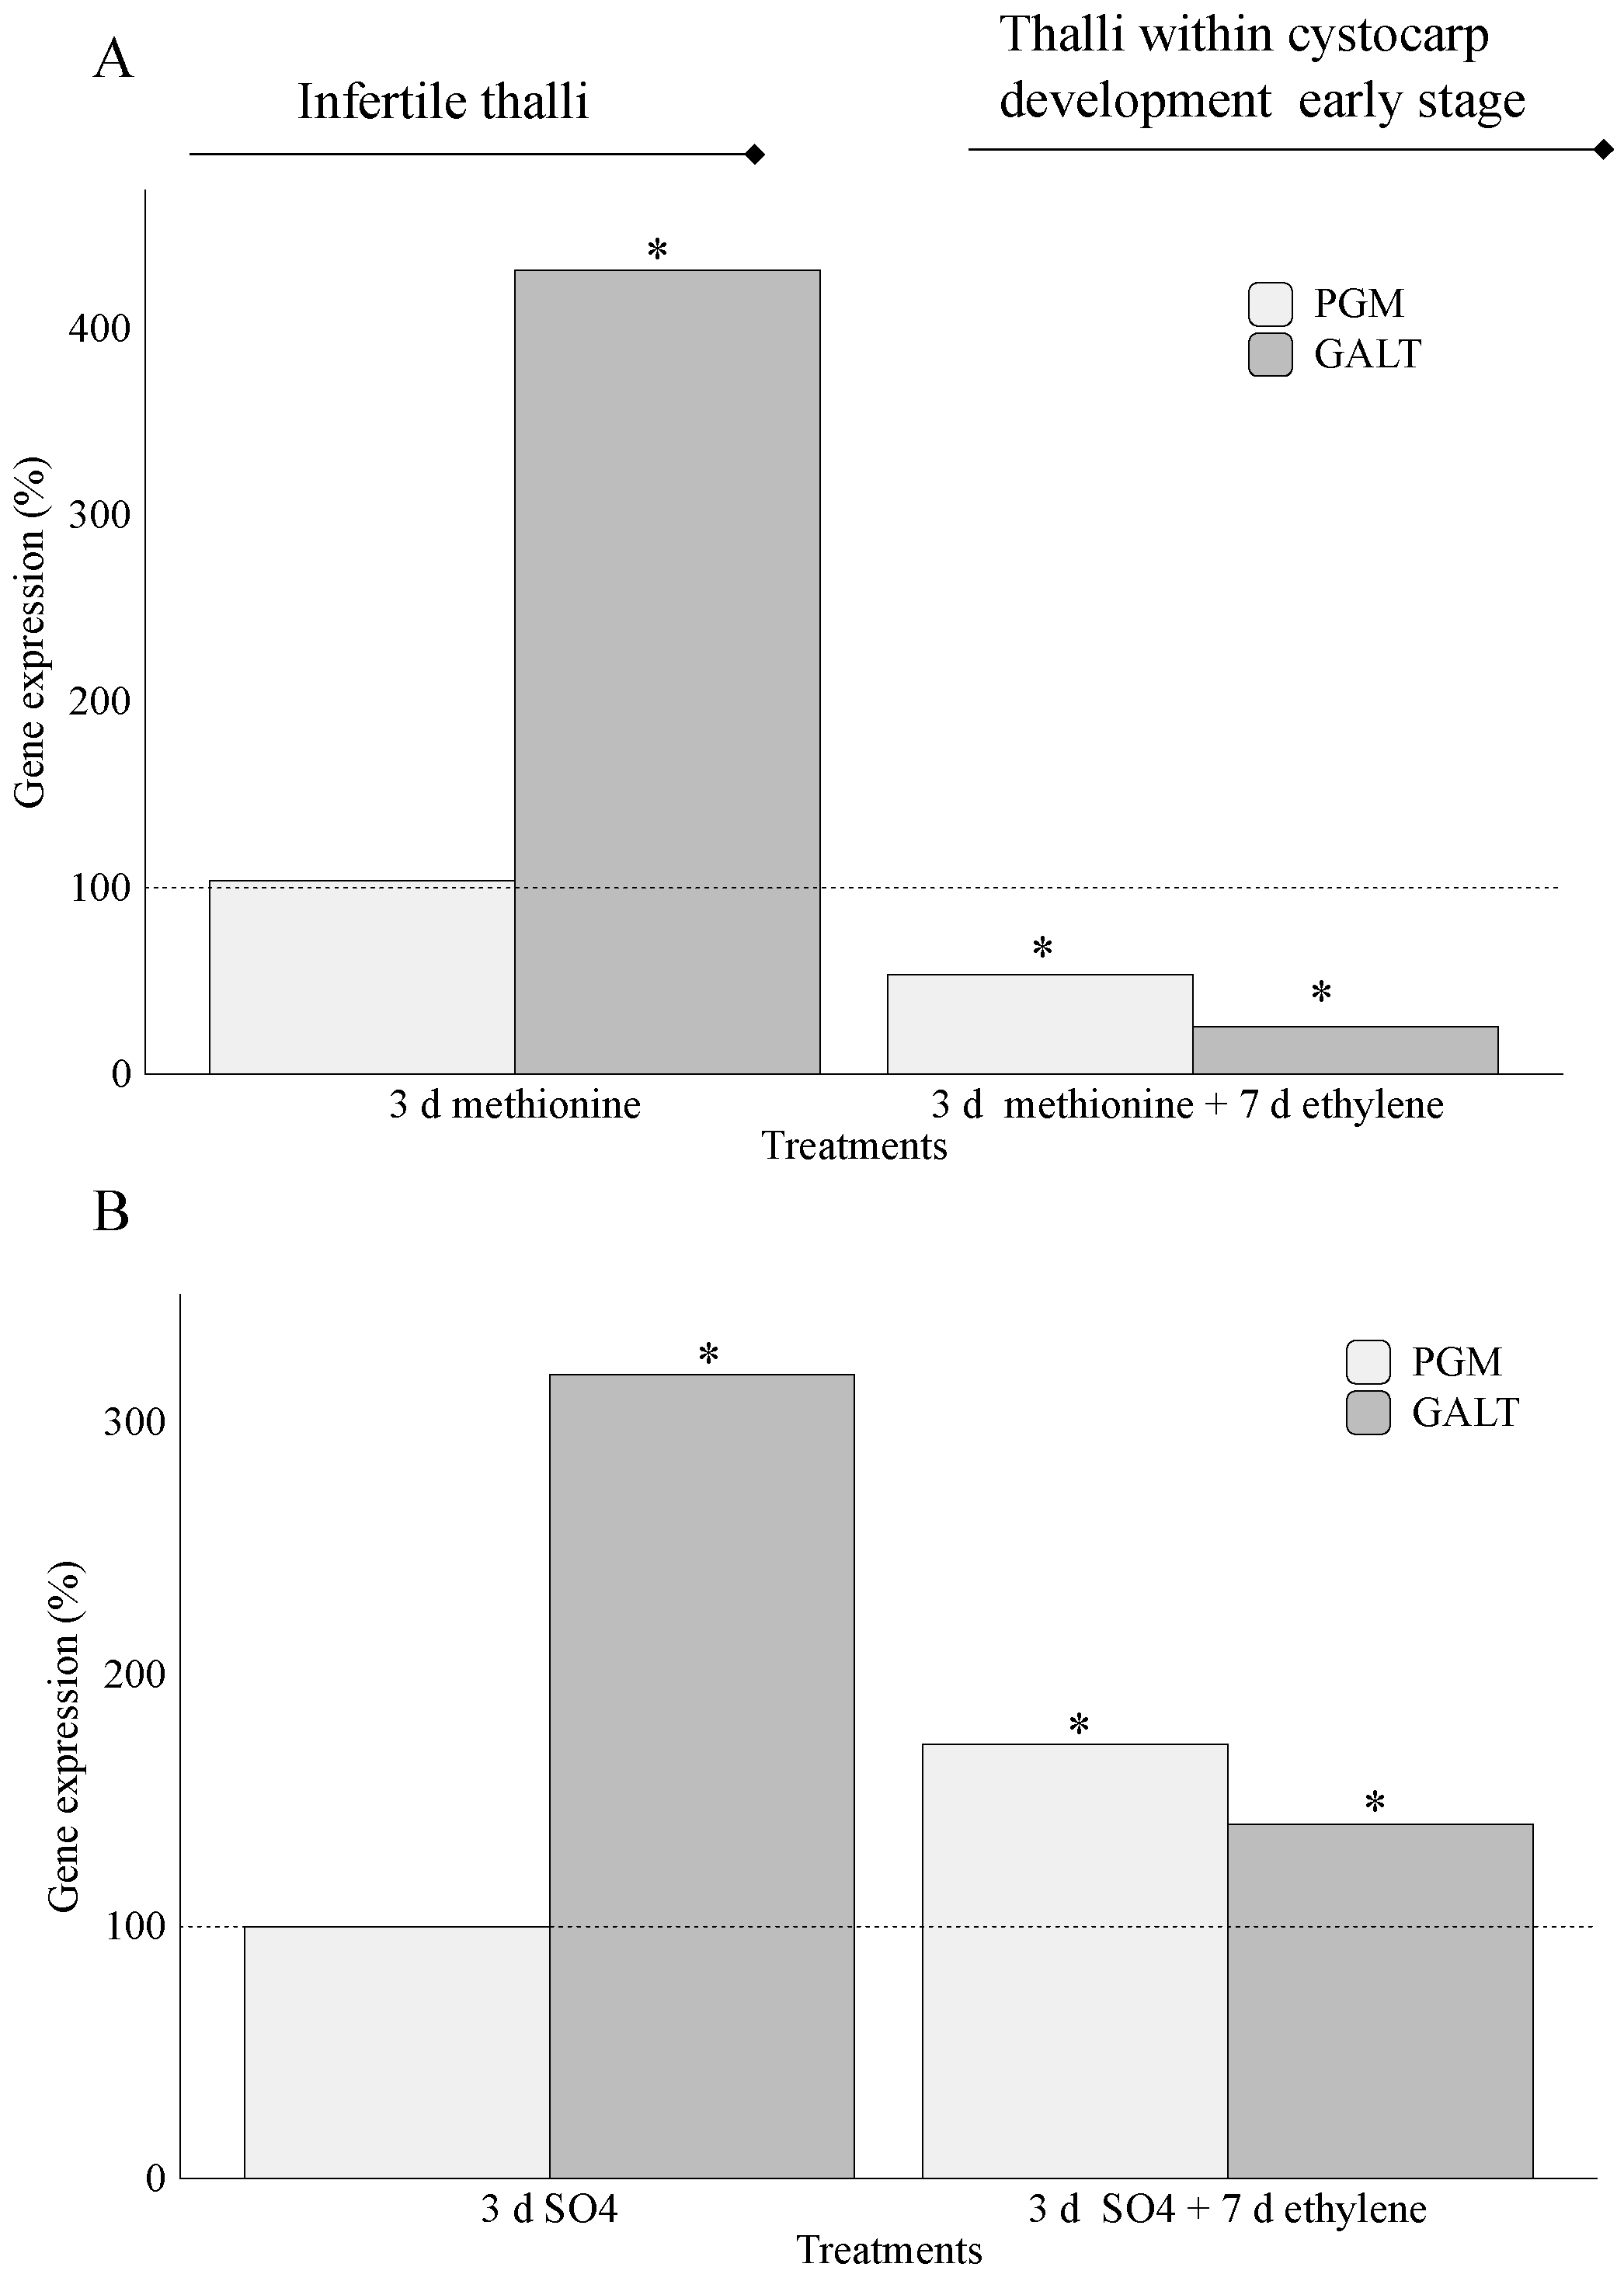
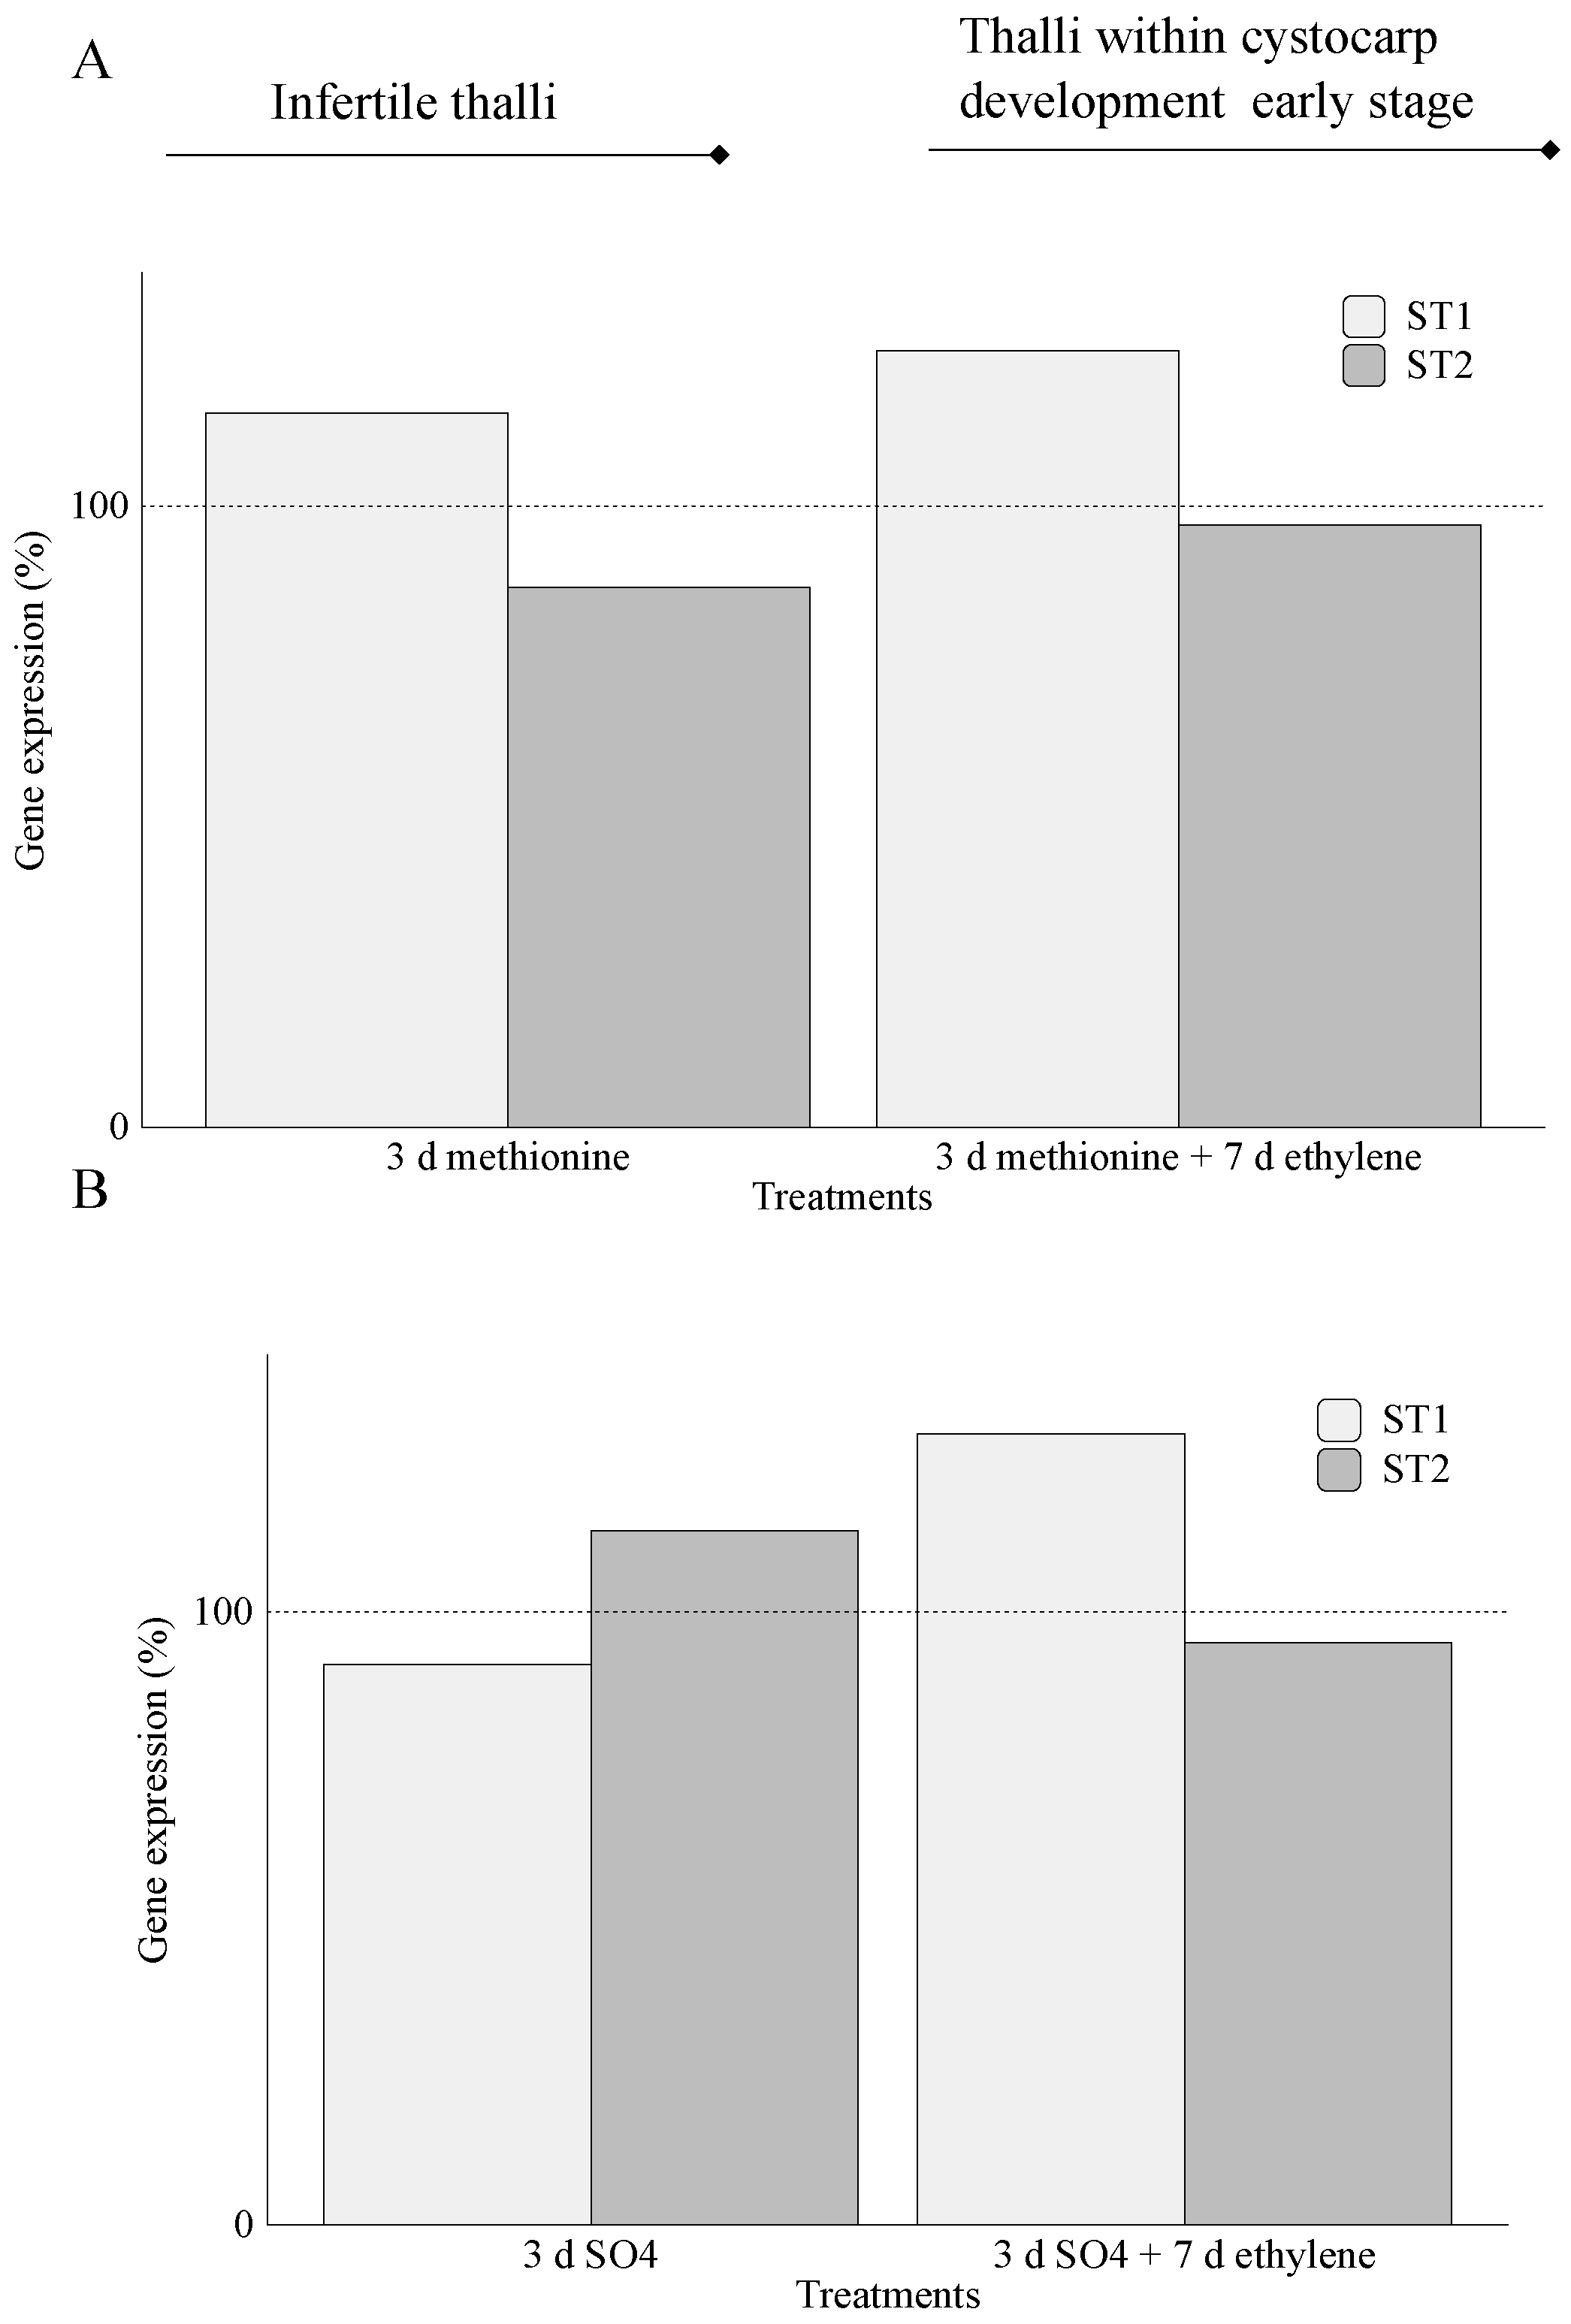
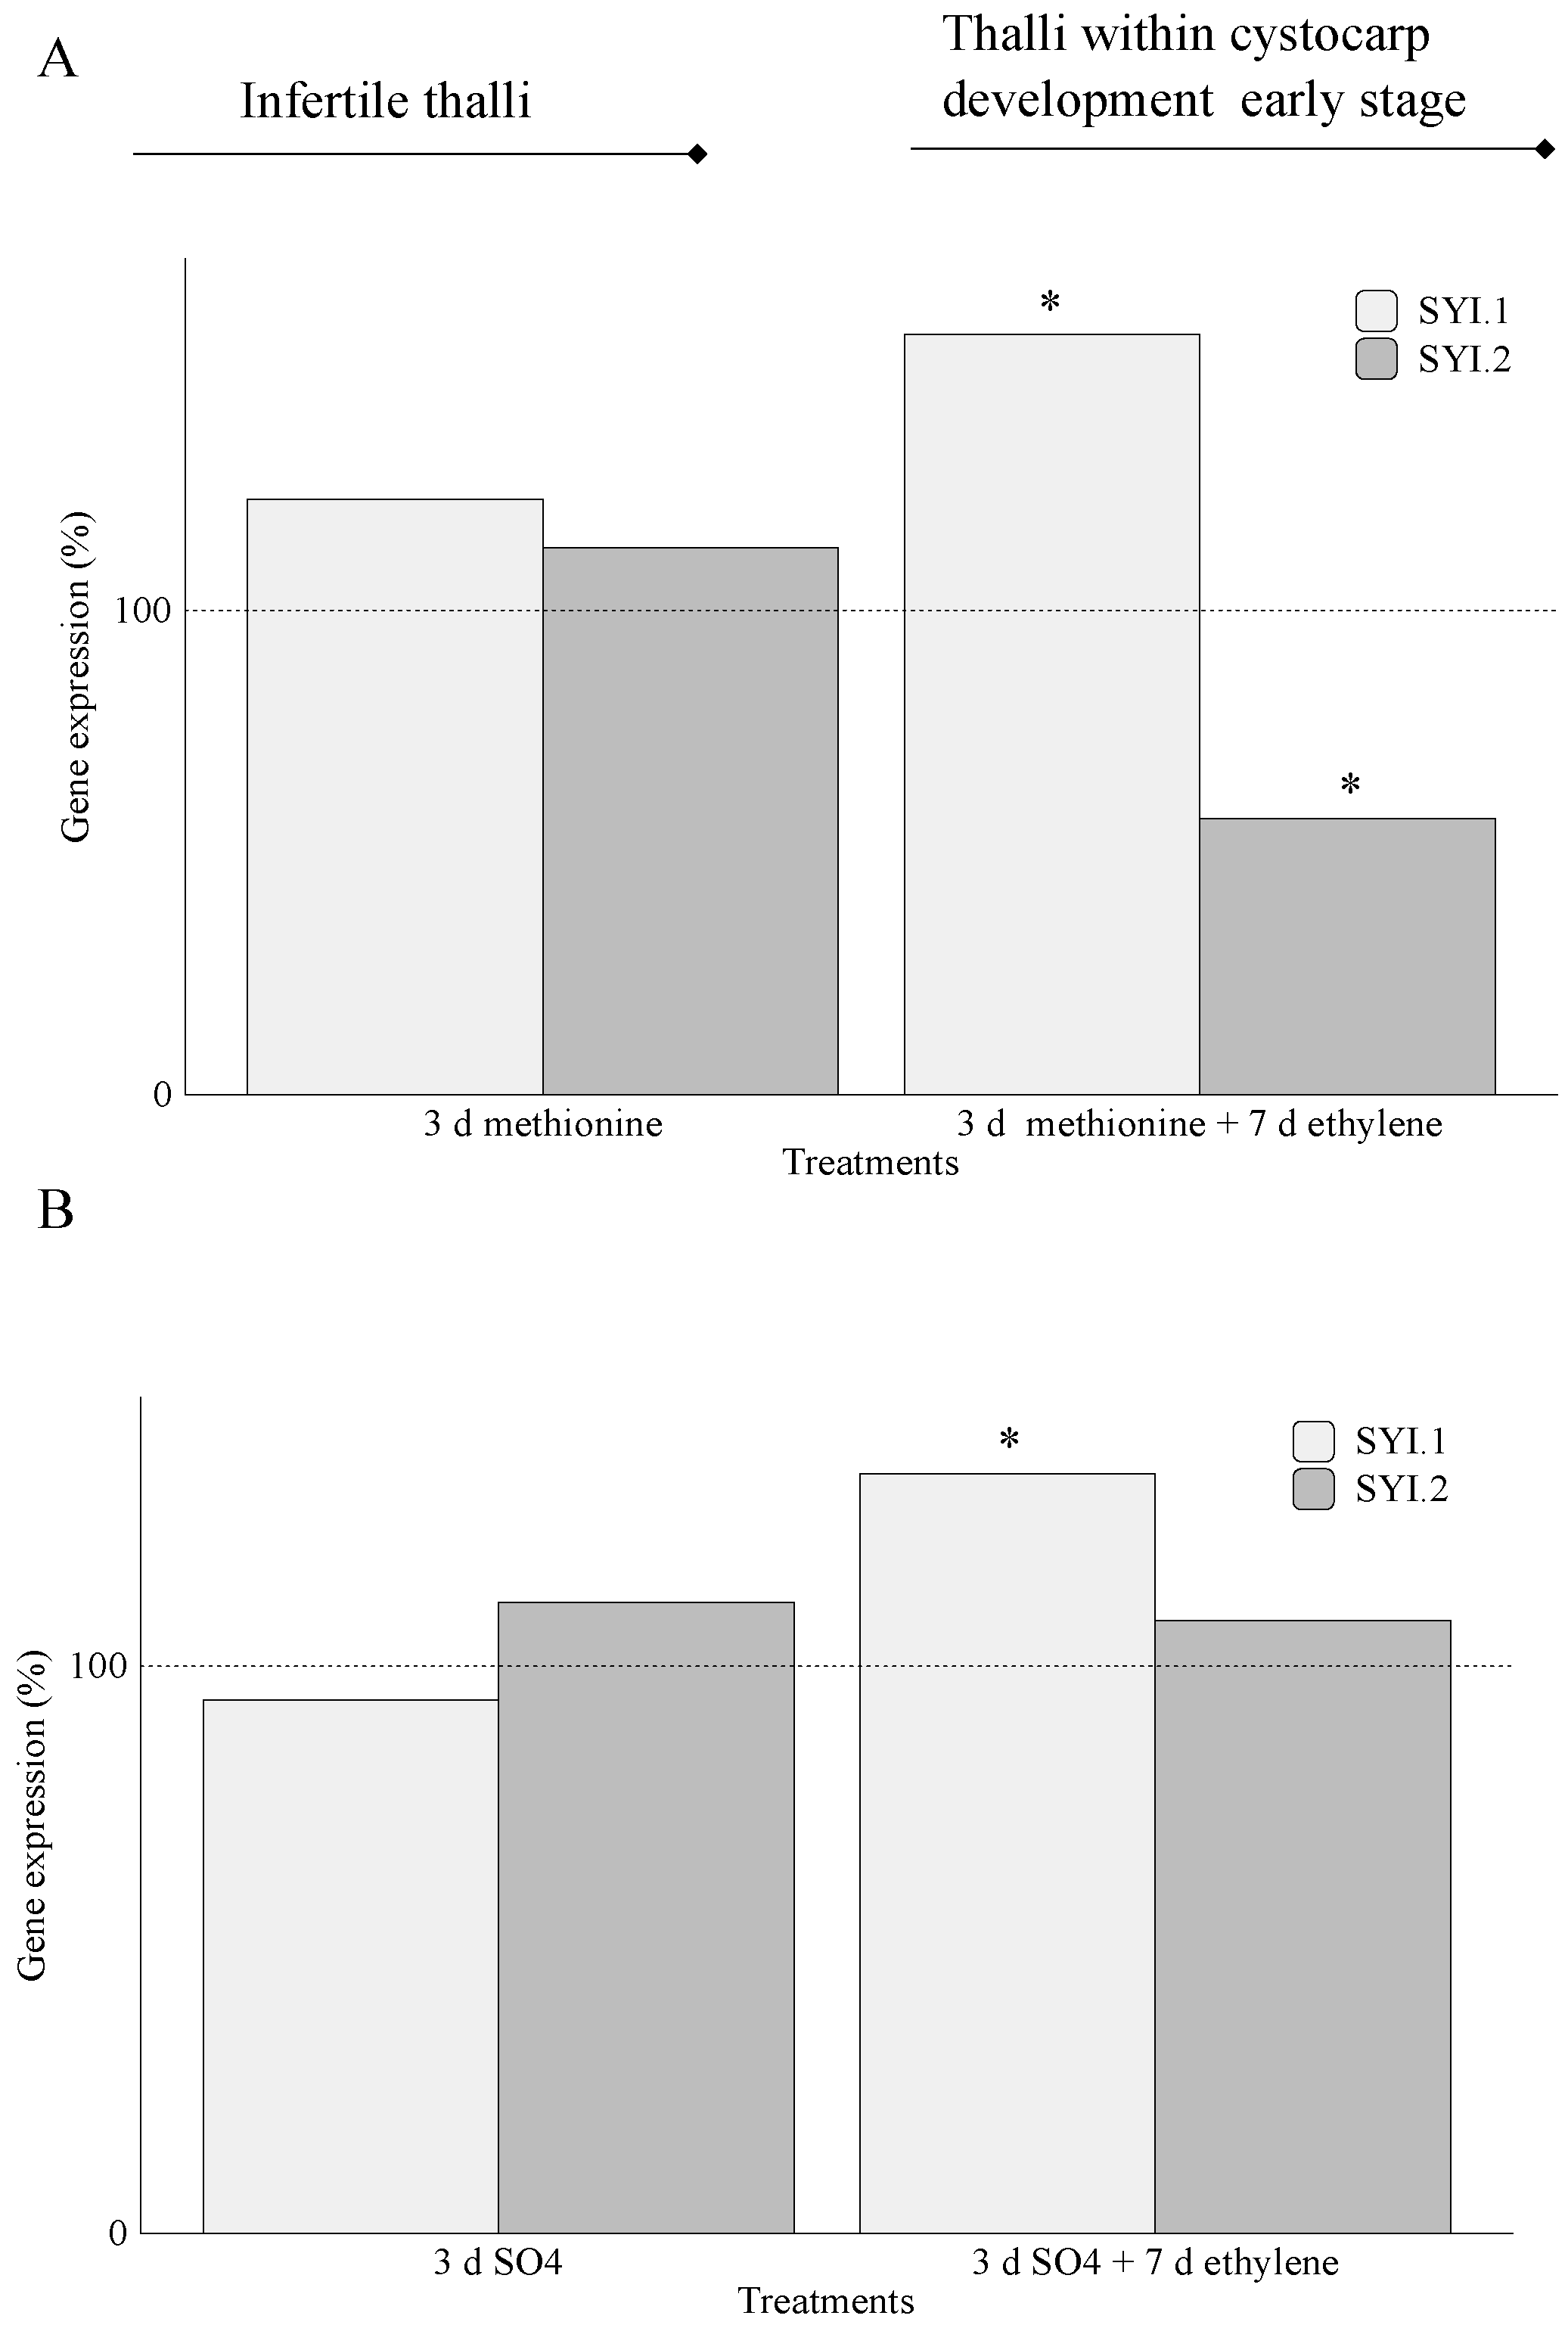
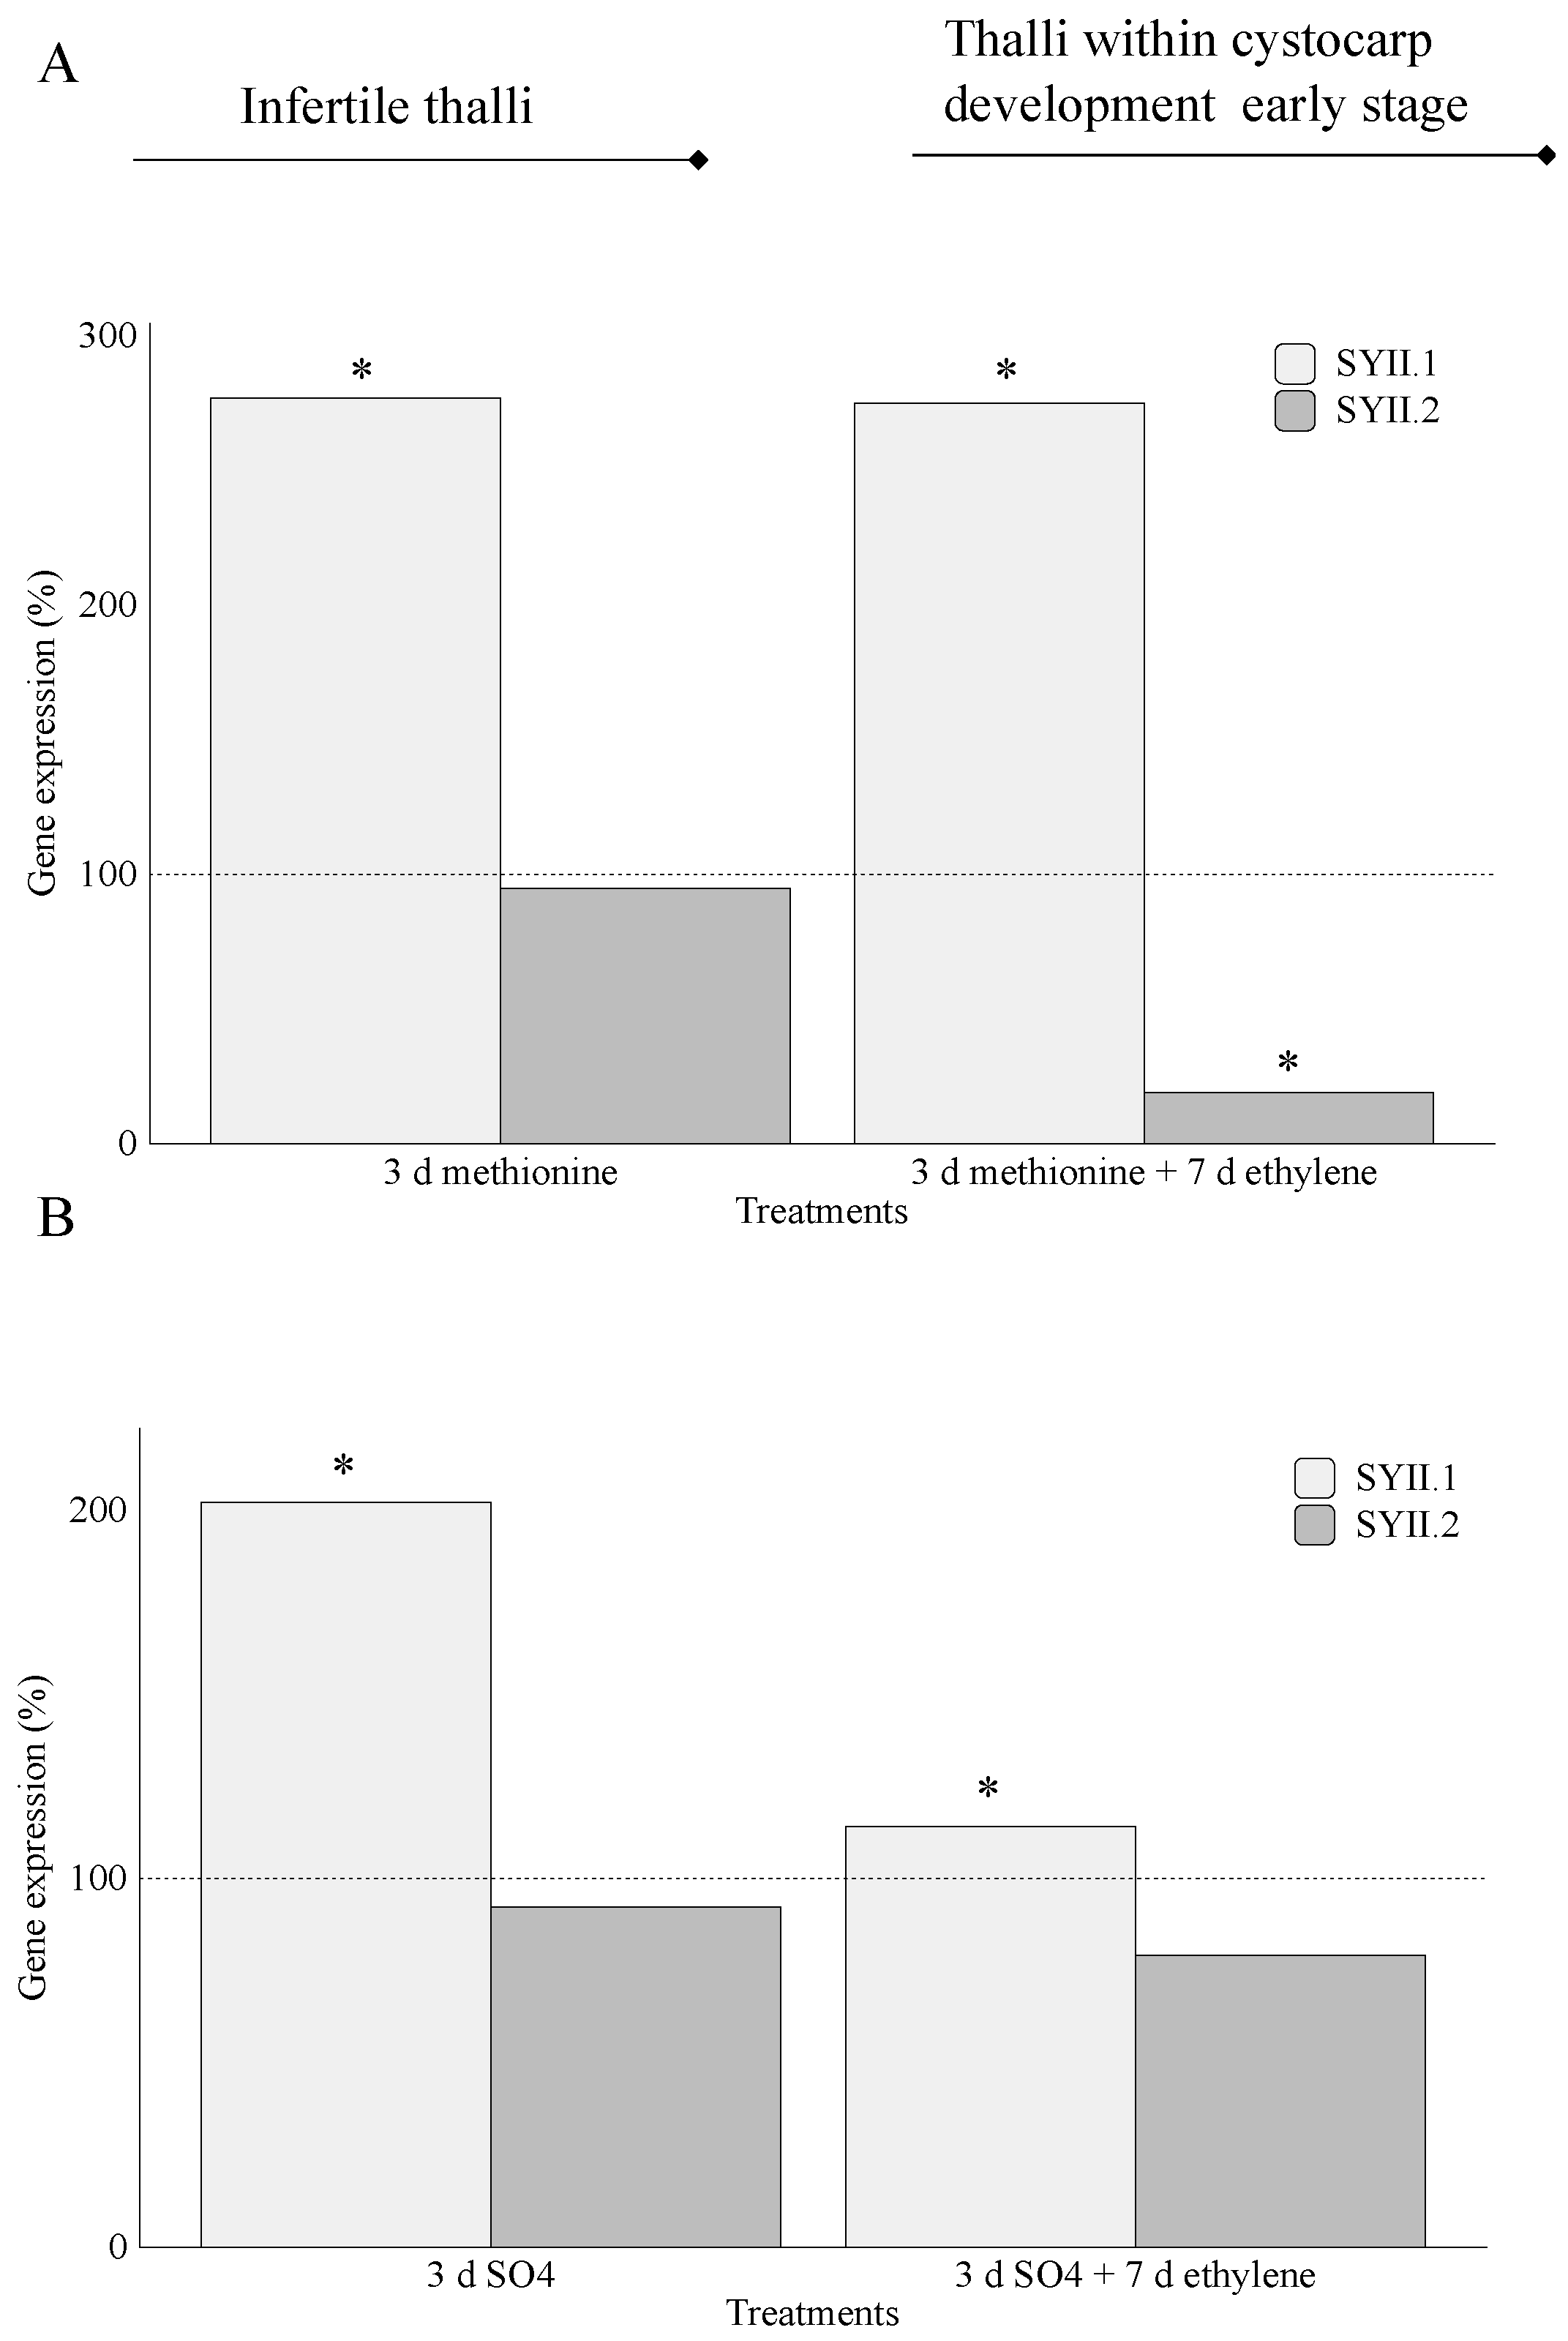
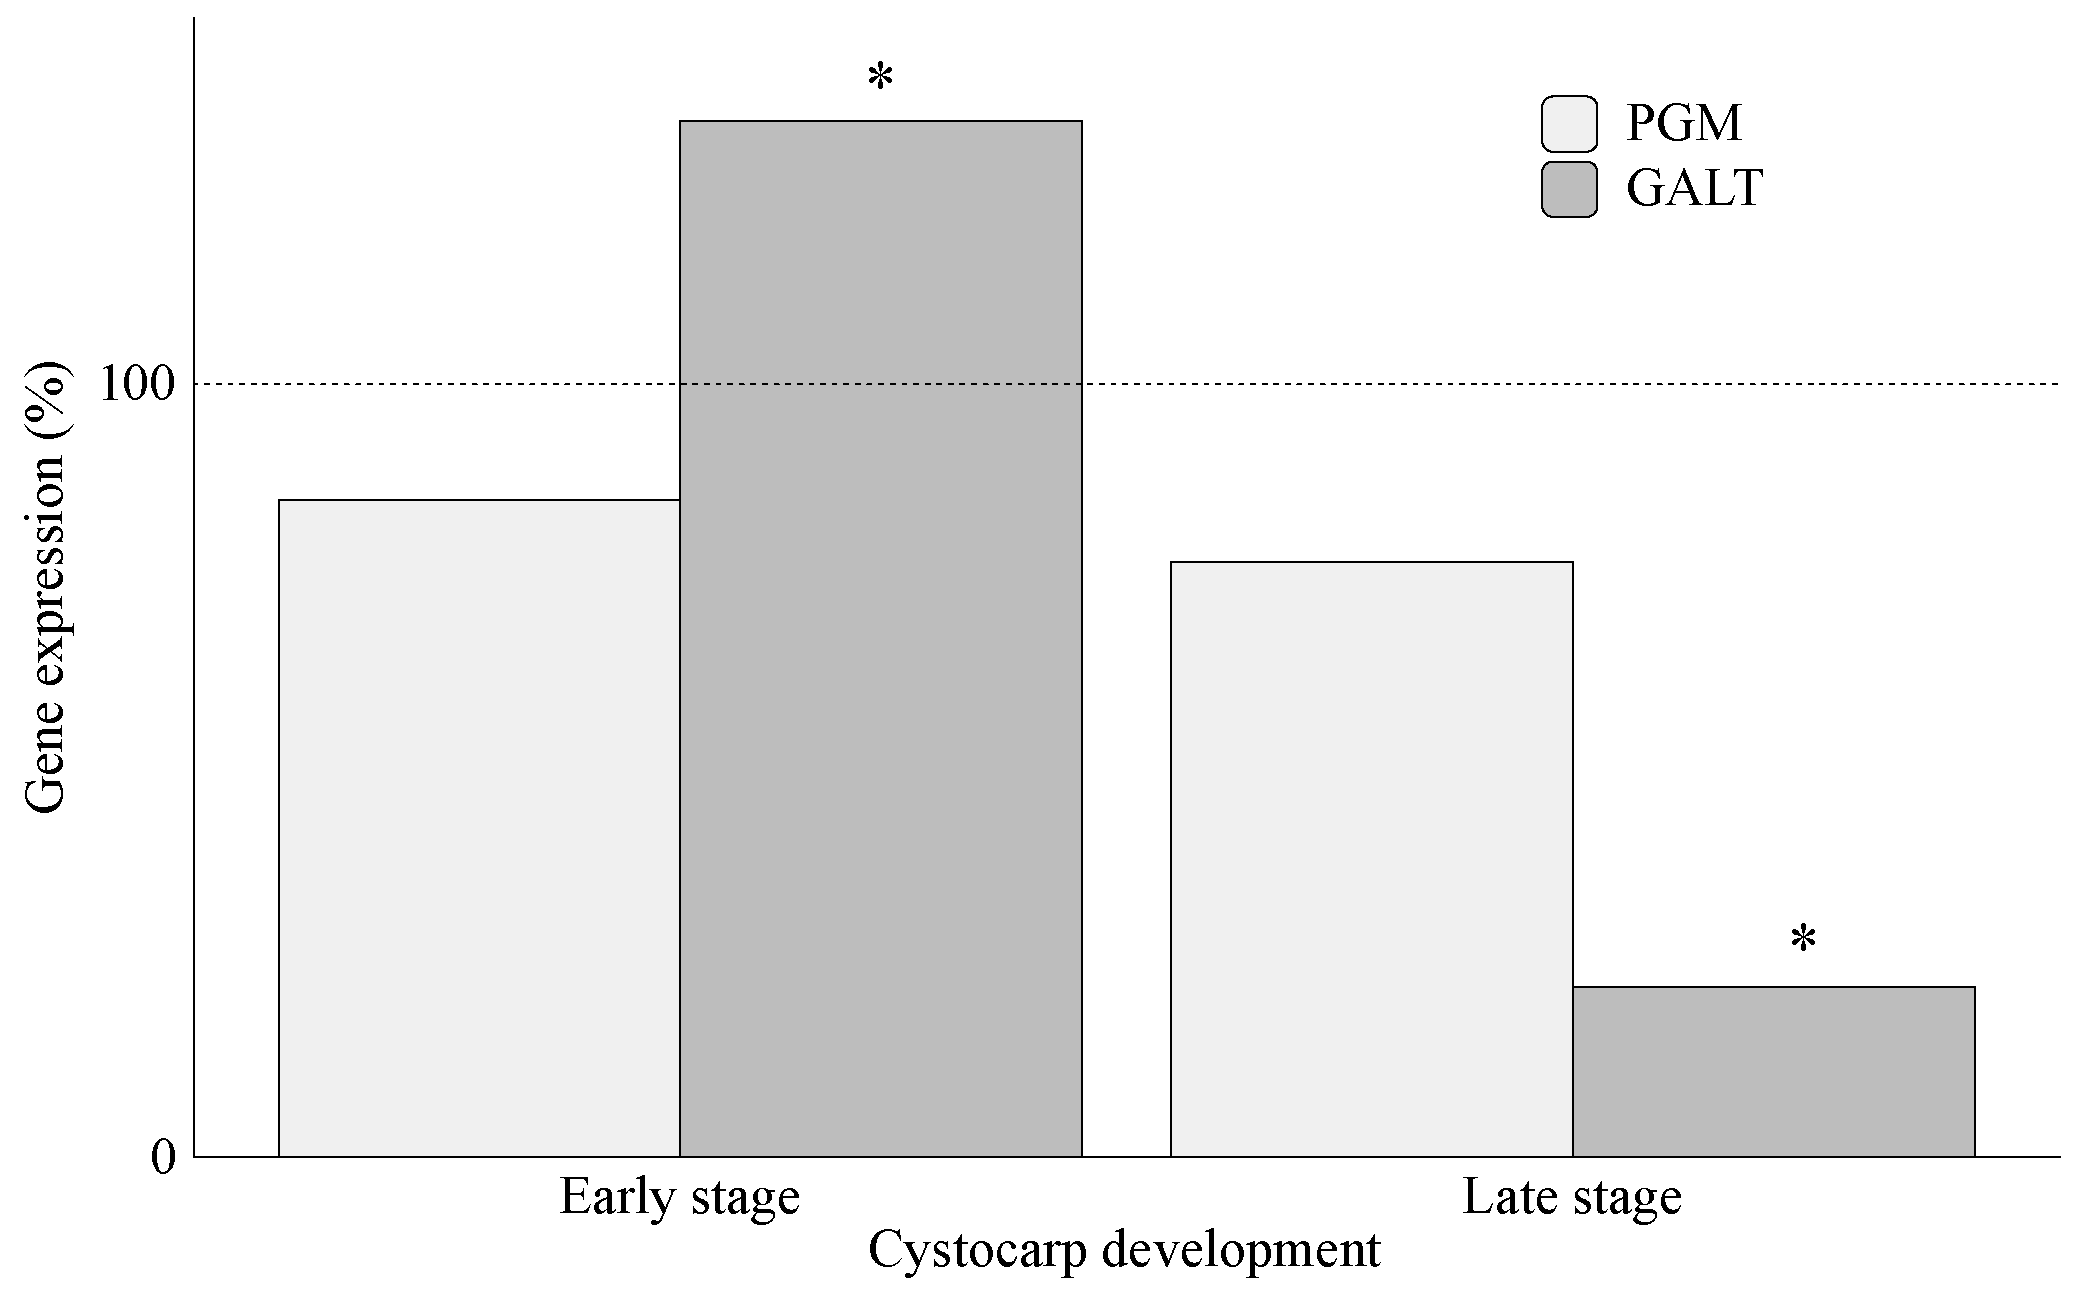
2.2. Carrageenan Synthesis

An evaluation of the expression levels of precursors of carrageenan synthesis showed that galactose 1 phosphate uridyltransferase (GALT) was significantly overexpressed in infertile thalli cultivated in the presence of methionine (431.3%) and SO42− (319%; Figure 4A,B). In thalli that reached early-stage cystocarp development, overexpression of GALT was only reported in the SO42− treatment (140.6%; Figure 4B). By contrast, non-significant expression for phosphoglucomutase (PGM) transcripts occurred in infertile thalli cultivated in the presence of methionine (Figure 4A) and SO42− (Figure 4B) and in thalli cultivated with methionine and fluxed with ethylene (Figure 4A).
The transcript expression levels of each of two gene sequences encoding carbohydrate sulfotransferase (ST1 and ST2) exhibited similar behavior for thalli treated with methionine (115% and 80% for ST1 and ST2, respectively) and those in methionine plus ethylene (125% for ST1 and 97% for ST2; Figure 5A). Furthermore, non-significant differences were observed in thalli treated with SO42− regardless of stage of development, i.e., 91.4% and 129% for ST1 in infertile thalli and thalli at early-stage cystocarp development, respectively, and 113.3% and 95% for ST2 for the same stages (Figure 5B).
In infertile thalli, two gene sequences encoding galactose-6-sulfurylase type I (SYI.1 and SYI.2) showed non-significant expression differences when transcript levels of SYI.1 and SYI.2 were compared to their controls (Figure 6A,B). In thalli within early-stage cystocarp development, expression levels of SYI.1 showed significant differences regardless of whether thalli were treated with methionine (Figure 6A) or with MgSO4 (Figure 6B). In particular, SYI.1 expression was higher than SYI.2 in thalli treated with methionine plus ethylene (Figure 6A) and in thalli treated with MgSO4 plus ethylene (Figure 6B).
Furthermore, SYII.1 was overexpressed compared to SYII.2, both in thalli treated with methionine (Figure 7A) and in those treated with MgSO4 (Figure 7B), regardless of development stage (Figure 7A,B). Remarkably, drastic down expression of SYII.2 (19%) occurred in thalli within early-stage cystocarp development in the presence of methionine (Figure 7A). Moreover, in thalli treated with MgSO4, high levels of SYII.1 appeared in infertile thalli (202%) when compared to thalli in early-stage cystocarp development (114%; Figure 7B).

3. Discussion

The exploitation of raw material from seaweed, such as carrageenan, greatly depends on the quality of sulfated galactans (SG). According to sulfation degrees, different types of carrageenans can be synthetized, which then shape gel networks. Moreover, the sulfation and desulfation degree of galactan backbone of SG is associated with alterations in thalli development and cystocarp maturation in red seaweeds [5]. Given that carposporogenesis in G. imbricata is an asynchronous process, in which the developmental stage of cystocarps is difficult to determine accurately, the pursuit of the ODC gene confirmed a down expression as development and maturation of reproductive structures (cystocarps) occurred [12,13,15]. In addition, the expression for each of the genes in thalli treated with an S-source and those also fluxed with ethylene was compared to corresponding untreated thalli at each time point (i.e., 3 and 10 days) to avoid bias (Figure 2A).
The transport, activation, and assimilation of sulfate require fine control through different genes that are regulated according to external signals; sulfur availability; and balanced interactions between the N, C, and S pathways in higher plants [16]. Sulfate uptake is controlled through demand-driven regulation such as sulfate transporter, which can be repressed when an amount of reduced sulfur is available for plants [17], which seems not to be the case in G. imbricata. In this study, exogenous addition of methionine, a reduced source of S, provoked an increment in the transcript number (in copies μL−1) of genes encoding S-transporter and assimilation (S-transporter and SAT) (Figure 3A). Furthermore, although expressions were lower in ethylene-induced fertile thalli than in those from infertile thalli, S-transporter and SAT were always overexpressed compared to controls (Figure 3A). Certainly, increments in basal levels of transcripts allow us to infer that methionine may be stored and further favor overexpression of transcripts for S-transporter and assimilation into S-compounds differentially from gene expressions led by MgSO4. Otherwise, MgSO4 might make transport and assimilation systems insensitive as there are non-limiting levels of sulfate in the seawater (Figure 3B; [18]).
Experimentation with two S sources, methionine and MgSO4, in the study model system of G. imbricata allows greater insight into the involvement of S in algal metabolism. Indeed, metabolism is shaped by genes, but metabolic machinery is affected by changes in the concentration of metabolites, which, in turn, can act as substrates and cofactors for post-translational modifications. Although recognized, this fact could be exemplified with the pool of methyl donor S-methyl methionine (SMM) and S-adenosyl methionine (SAM), synthetized from methionine, as SAM/SMM can fluctuate in concentration, limit activity of methyltransferases, and influence regulation of gene expression in several organisms [19,20]. Our results open a door to study whether genes in charge of transport and assimilation can be regulated by a pool of sulfur organic compounds in algae.
Outstandingly, the expression of genes encoding proteins in charge of S-transport was uncorrelated with that for S-assimilation. Little is known about the type of S-transporters, their cell location, and enzyme isomorphs in algae [21]. Sulfate transporters can be expressed in different parts of a plant [22] and could potentially work in the transport of different reduced forms of sulfur [23]. In addition, many other transporters and forms of organic sulfur can be used by organisms, as these S-forms are also products of the assimilation pathway. In thalli of G. imbricata, transcript levels of the gene-encoding S-transporter showed lower expressions than those of the SAT gene. Remarkably, these expressions displayed maximum differences in infertile thalli cultured in methionine for 3 days (440% for S-transporter and 808% for SAT above their respective controls; Figure 3A). Likewise, thalli within early-stage cystocarp development induced by ethylene showed transcript expression for S-transporter of 260% and 340% for SAT (Figure 3A). Unlike genes that have the same trend in methionine and MgSO4, these results seem to reaffirm a conspicuous regulation of these genes with respect to methionine (Figure 3A) compared to that in the presence of MgSO4 (Figure 3B).
It is known that the synthesis of S-containing amino acids and intermediates requires sulfide, which favors cysteine and methionine synthesis [24,25]. In particular, methionine is a precursor of ethylene synthesis [26], and the latter has been described as improving S acquisition [27]. Furthermore, methionine is used to synthetize S-methyl methionine (SMM) and S-adenosyl methionine (SAM; [28]). Otherwise, the SAM level is controlled by SMM, whereas SAM is the precursor for the biosynthesis pathway of ethylene, which has a main role in red seaweed reproduction [13]. Therefore, it would be reasonable to infer that SAM and SMM availability might increase the demand for supplying reduced S, thus favoring over-expression of gene-encoding S-assimilation in infertile thalli (808% SAT) and in thalli within early cystocarp development stages (340% SAT) (Figure 3A). It would remain to be solved whether diminished gene expressions (in percentage) of S-transporter and assimilation in thalli within early-stage cystocarp development (i.e., thalli cultured in methionine plus ethylene) compared to infertile thalli (cultured only with methionine) are due to S availability, as methionine is being supplied exogenously, or due to changes in reproductive stages elicited by ethylene. Thus, trying to solve this issue, a new assay (Figure 2B) revealed that gene expression of SAT decreased drastically (16% SAT expression) in G. imbricata thalli within cystocarp development late stages (ethylene-induced cystocarp maturation), while S-transporter maintained basal level (approx. 100% for S-transporter; Figure 8). Broadly, these results show that (i) S-transporter expression tends to sustain alongside transition from infertile to fertilization, and different stages occur as methionine may be stored in the S-organic pool; and (ii) S-assimilation, to convert methionine to SAM-activated form, does not seem to be demanded in late stages of ethylene-induced cystocarp development (Figure 8). Moreover, up-expression of SAT in infertile and early-stage cystocarps indicate that S-source could be stored for further assimilation in a specific zone of thalli where S-source is needed, and assimilation will take place specifically. Thus, in thalli within early-stage cystocarp development, i.e., in the presence of ethylene plus methionine (Figure 3A), the overexpression of SAT could be required to sufficiently activate sulfate for generating reduced forms of S and further to induce cystocarp development (Figure 3A,B). Once induced, SAT diminishes as it occurs in late early stages (Figure 8). Evidence of high transcript levels of SAT have been reported in higher plants according to different tissues such as growing leaves and root tips of Arabidopsis [29,30]. Furthermore, despite thalli simplicity in red seaweeds, differential gene expressions could be conceived as they have been previously reported according to both the reproductive stage and the apical and basal zone of thalli in G. imbricata (e.g., ODC reproduction marker gene [31,32]). With our framework of well-defined cystocarp development stages, this study opens a network to gain clearer and more accurate insight into the metabolism of S in seaweed reproduction, the role of ethylene as a trigger of algal reproduction and its involvement in SAM regulation as an activated form of methionine, and into the biosynthesis of cell-wall sulfate polysaccharides in seaweeds. Modifications of development stages of thalli were always verified through changes in transcript levels of the reproduction marker gene in red seaweeds, ODC, which decreased alongside cystocarp development (copies μL−1 for ODC in infertile thalli, 2.75 ± 2.1 × 10⁻²; within early-stage cystocarp development, 1.3 ± 1.8 × 10⁻²; and within cystocarp development late stage, 0.99 ± 1.0 × 10⁻³).
Once the sulfur is assimilated, the resulting product PAPS is used for the sulfation of UDP galactose. Additionally, UDP galactose can be also obtained through the conversion of galactose by means of galactose 1 phosphate uridyltransferase (GALT), while phosphoglucomutase (PGM) is in charge of conversion of glucose 6-P to 1-P (Figure 1). Although PGM’s role in algae has been neglected, it has been reported that this enzyme can be activated by bivalent cations such as Mg2+ in the brown seaweed Saccharina japonica [8]. In this way, high levels of transcripts of PGM could be expected in thalli of G. imbricata cultivated in the presence of MgSO4. Nonetheless, PGM overexpression only occurs in thalli within early-stage cystocarp development (172%; Figure 4B). This could be explained as hexose pool would increase because they are used as glucose 1-P is a precursor for polysaccharide synthesis, i.e., mucilage synthesis for spores protecting. Although no evidence has been reported in algae, conversion of glucose from 6-P to 1-P by PGM has been described as crucial for sporophyte and gametophyte development of Arabidopsis [33]. It is striking what occurs in thalli cultured in the presence of methionine (Figure 4A). A down expression of PGM (nearly 53% PGM expression compared to its control; Figure 4A) might indicate a reduction to mobilize hexoses, avoiding polysaccharide synthesis in the early stage of cystocarp development. This result would be in accordance with PGM expression that compares early (elicitation) and late (maturation) stages of cystocarp development (Figure 2B and Figure 9). In this case, PGM expression was unaltered in G. imbricata thalli within the early (percentage of gene expression, 85%) and late (percentage of gene expression, 77%) stages of cystocarp development as shown in Figure 9.
Furthermore, glucose 1-P is used to render nucleotide sugars, such as UDP glucose. These nucleotide sugars are substrates of cell-wall synthesis and depend on the growth stage of the tissue [34]. The GALT gene-encoding protein responsible for one of the biochemical steps that produces these precursors has been described in the red seaweed Gracilaria changii, where an abundance of transcripts of GALT has been correlated to synthesis of sulfated polysaccharides [35]. Therefore, GALT expression could be associated with the fertilization stage of thalli of G. imbricata. Thus, in G. imbricata, reduced expression of GALT, reported in the early stage of development compared to infertile thalli, seems to show fluctuations in the composition of wall-galactans to locate reproductive structures in thalli within early stage cystocarp development (Figure 4A,B). Indeed, GALT was significantly reduced in the late-development stages (mature cystocarps; Figure 9), which confirms alterations in biosynthesis of different wall-galactans.
Although biosynthetic pathways for carrageenan have not been completely elucidated in red seaweeds, UDP-galactose is deemed a precursor for cell-wall sulfated galactans biosynthesis through the addition and removal of sulfate groups from C-backbone [36,37]. The G. imbricata expression of two annotated carbohydrate sulfotransferases (ST1 and ST2) seems to be constitutive for G. imbricata, as non-significant differences between transcript levels of ST1 and ST2 were encountered compared to those from the control and considering both S source (methionine vs. MgSO4) and cystocarp development stage of thalli (infertile thalli without cystocarp vs. thalli within early-stage cystocarp development; Figure 5A,B). Moreover, it can be assumed that ST gene expressions, which encode proteins in charge of adding sulfate groups to cell-wall galactan, might be a consequence of carrageenan synthesis and also neutral polysaccharides, which are a constituent of mucilage in red algae [38]. No changes in ST expression were observed in G. imbricata when through field sampling; ST1 and ST2 were also unaltered in infertile, fertilized (well-developed cystocarps), and fertile (fully developed cystocarps) thalli [5].
The transcript levels of two annotated galactose-6-sulfurylase type I (SYI.1 and SYI.2) showed a time-regulated behavior as SYI.1 expression was higher in early-stage cystocarp development than those in infertile thalli in the presence of both exogenous methionine and MgSO4 (Figure 6A,B). Likewise, our data show that SYI.1 also displays a fertilization-specific expression, as differences were encountered for SYI.1 compared to SYI.2 for these early stages (Figure 6A,B). This differential behavior of SYI.1 and SYI.2 was also reported when SYI transcript levels were analyzed in fertilized thalli of G. imbricata from field sampling [5]. Hence, it is worthwhile to suggest that, firstly, a time-gene regulation of two galactose-6-sulfurylase type I could be possible through the synthesis of specific transcription factors of SYI.1 and SYI.2. Secondly, these genes, encoding proteins in charge of removing sulfate groups from sulfated galactans, would be working to soften and further support reproductive structures (cystocarps) in thalli, as occurred in those fertilized and fertile thalli of G. imbricata [5].
Considering galactose-6-sulfurylase type II, the SYII.1 expression does not seem to be related to the development stage, as SYII.1 was overexpressed in both infertile thalli and thalli within early-stage cystocarp development and regardless of S-source (Figure 7A,B). SYII.1 gene expression was higher than that for SYII.2 (Figure 7A,B). Overall, the data suggest a differential role for two sulfurylases type II. Thus, it is tempting to guess that if SYII.1 is dependent on the reproductive stage, the alteration of expressions of SYII.1, and presumably of SYII.2, could be because genes are encoding different proteins that remove sulfate groups on multiple intermediates of sulfated-polysaccharide biosynthesis. Interestingly, Grateloupia sp. have been reported as mainly containing hybrid carrageenan at different rates, where κ- is the more prominent and ι- would be present to a lesser extent [39]. Thus, different expressions of SYII (1 and 2) could be associated with conversion from μ- to κ-carrageenans and to that from κ- to ι-carrageenans. Taking into account that maximum expression corresponds to SYII.1 and the prevailing fraction is made of κ-carrageenans in Grateloupia, SYII.1 may act in the conversion from μ- to κ-carrageenans and SYII.2 from κ- to ι-carrageenans. The occurrence of carrageenan types and differential gene expression for SYII suggests the hypothesis that there could also be development stage-specific roles for these sulfurylases. This opens a path to study whether galactose-6-sulfurylase annotated in G. imbricata transcriptome works on multiple intermediates of sulfated-polysaccharide biosynthesis as proposed.
In summary, the results showed an increment in transcript number of genes encoding S-transporter and assimilation compared to controls regardless of the development stage of thalli in the presence of methionine. Otherwise, methionine diminished transcript levels of PGM and GALT but gene expressions are associated with the fertilization stage of thalli of G. imbricata. As opposite, methionine and MgSO4 did not affect the transcript number of carbohydrate sulfotransferase and galactose-6-sulfurylase (i.e., when UDP galactose is rendered, Figure 1). Nonetheless, differential expression was obtained for sulfurylases according to the development stages of thalli of G. imbricata.

4. Materials and Methods

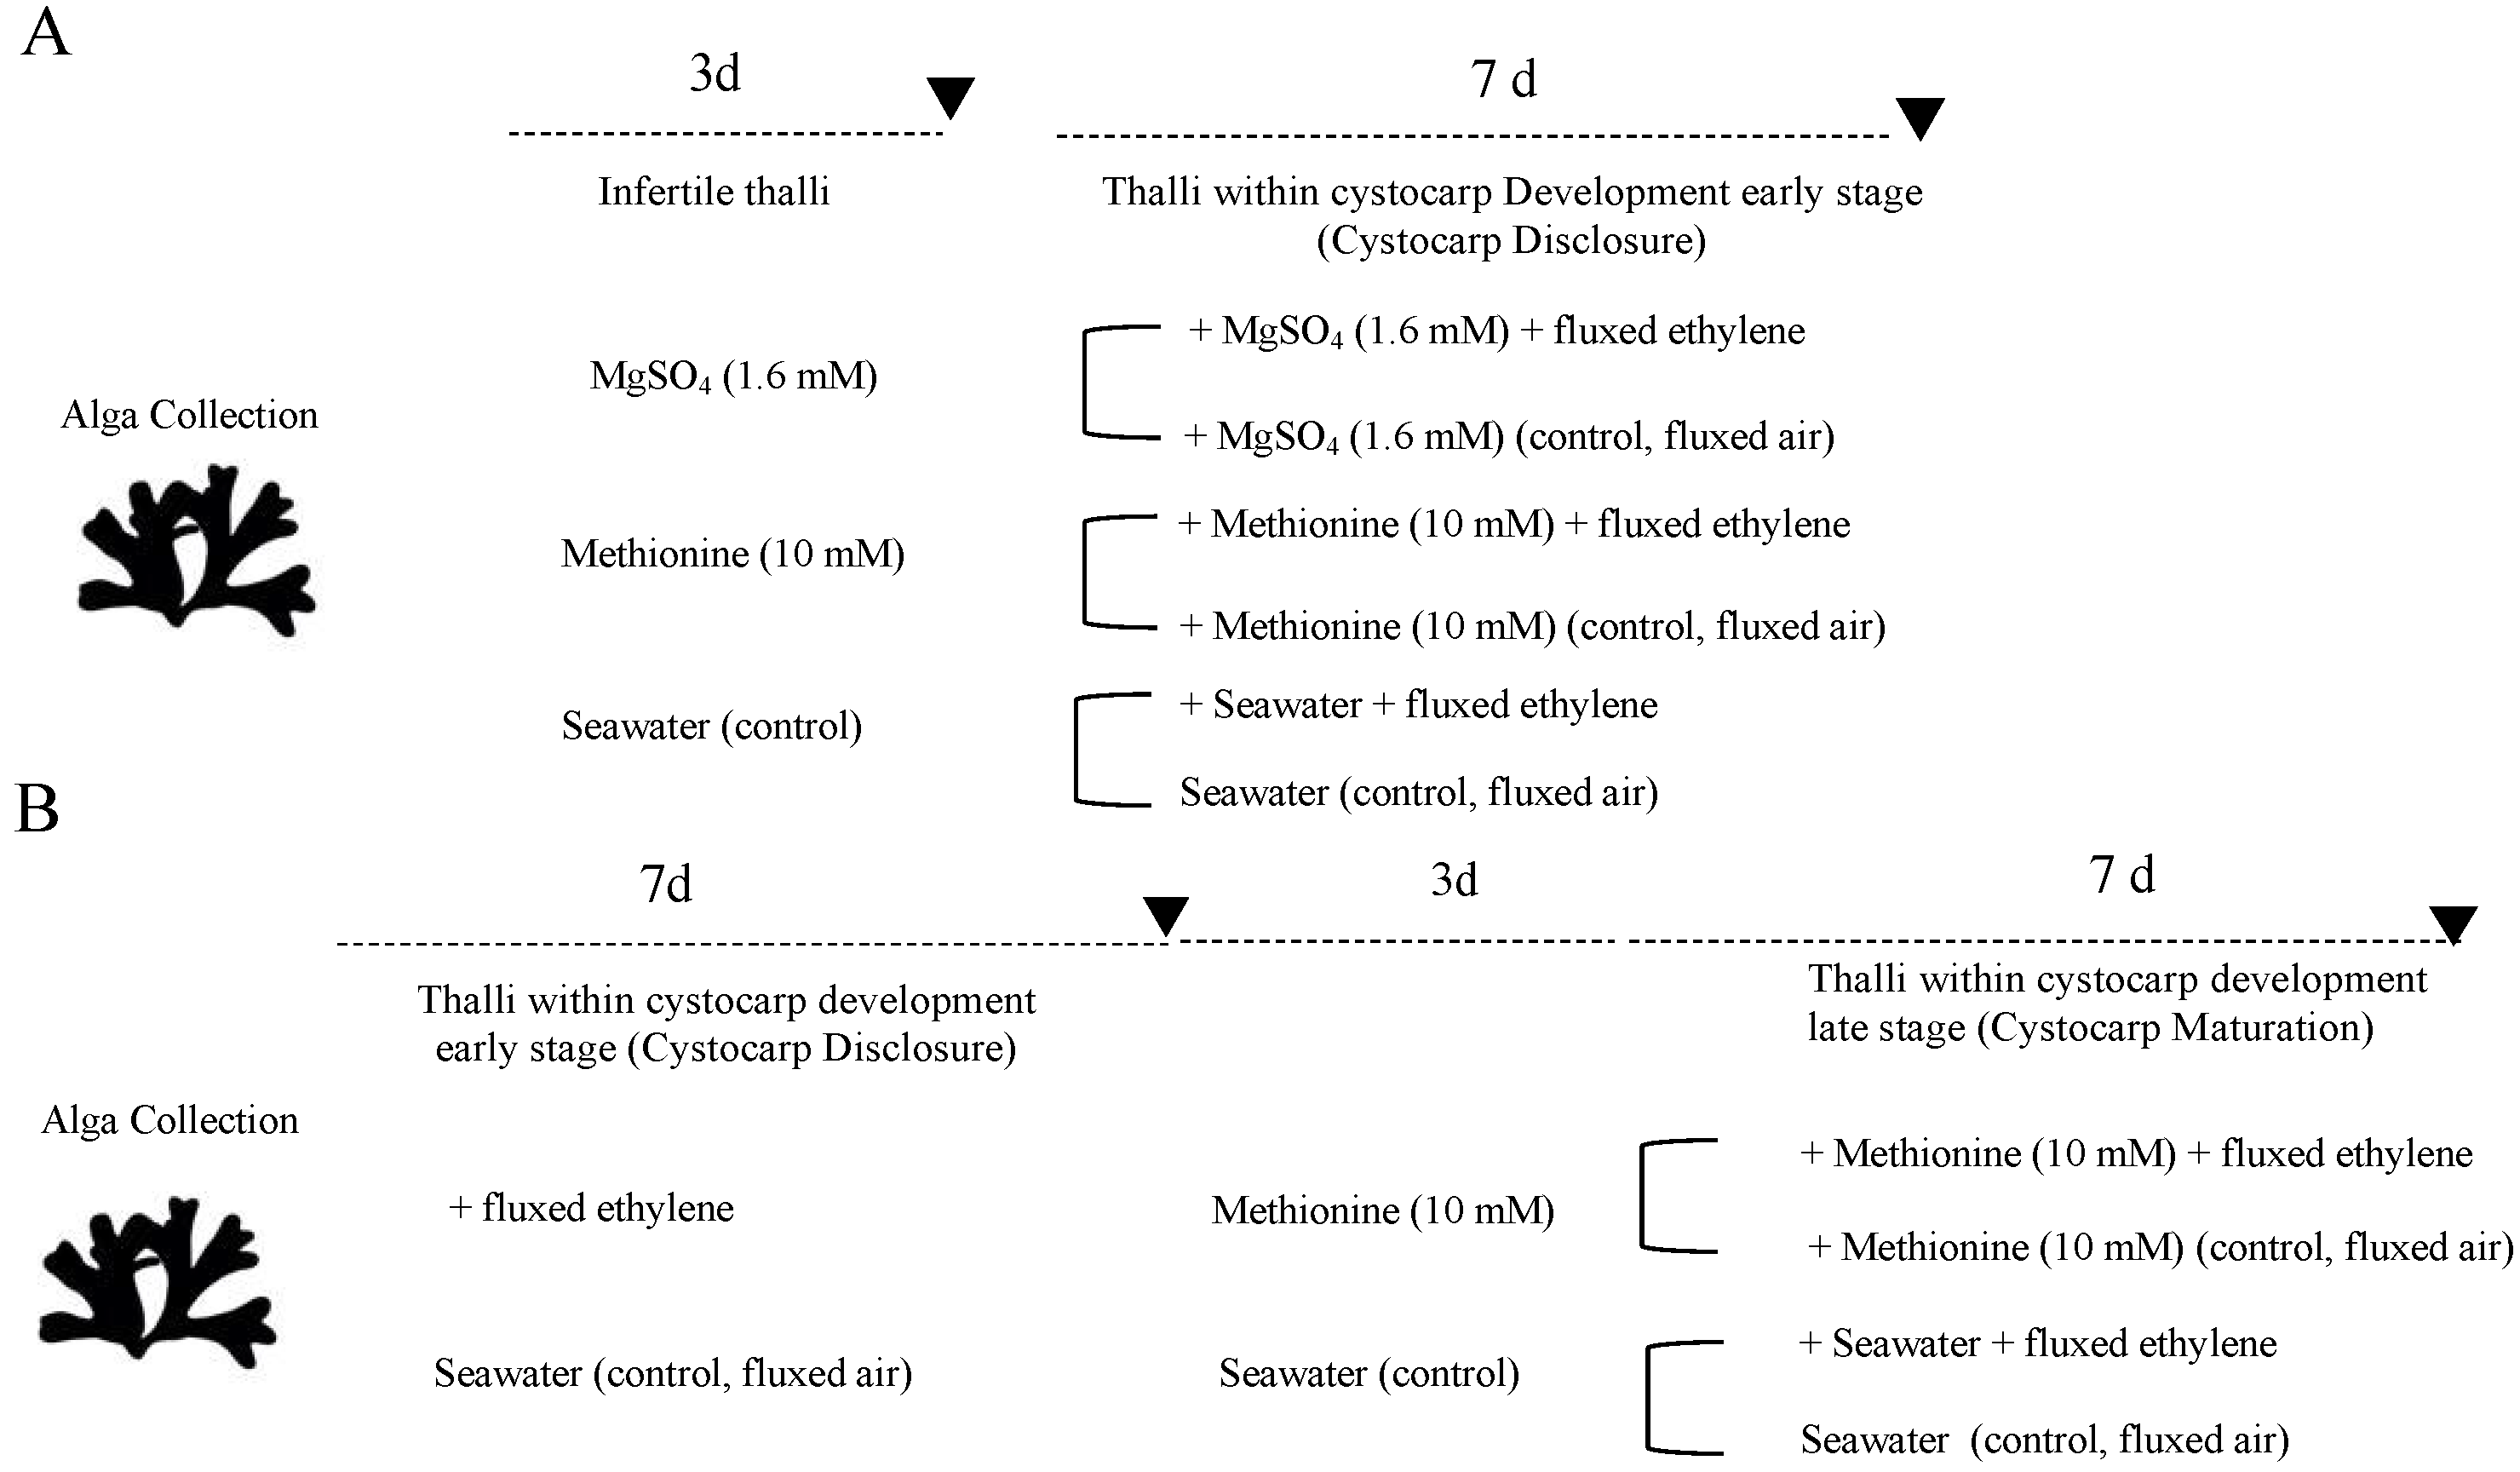
4.1. Plant Material and Culture Conditions

Infertile thalli from the carragenophytic G. imbricata were collected along the northeast coast of Gran Canaria in the Canary Islands. Thalli were placed in 500 mL vessels (3 g per vessel) and cultivated separately with two S-sources, methionine (10 mM) and magnesium sulfate (1.6 mM; MgSO4), for 3 days (Figure 2A). When proceeding, cystocarp development was elicited with ethylene ([10]; 99.9% purity, Carburos Metálicos SA, Barcelona, Spain), which was applied to the 500 mL sealed vessels for 15 min at a flow rate of 0.5 l min−1. Thalli continued to be cultivated for 7 days. Infertile thalli fluxed with ethylene reached early-stage cystocarp development as expected (day 10; [10]; Figure 2A). Thalli were maintained at 20 ± 2 °C under an 18 h light (30 µmol photons m−2·s−1): 6 h dark photoperiod in a growth chamber.

4.2. Changes in Gene Expression According to S-Source and to Elicitation of Cystocarps by Ethylene

The effect of type of sulfur source on assimilation of S-source and carrageenan synthesis was evaluated in G. imbricata thalli on the 3rd and 10th day as detailed above. Gene expression of the S-assimilation pathway i.e., sulfate transporter (S-transporter) and Sulfate adenylyltransferase (SAT) was determined (Figure 1). For carrageenan synthesis, genes such as phosphoglucomutase (PGM) and galactose 1 phosphate uridyltransferase (GALT), two contigs annotated as galactose-6-sulfurylase type I (SYI.1 and SYI.2), two contigs of galactose-6-sulfurylase type II (SYII.1 and SYII. 2), and two contigs of carbohydrate sulfotransferase (ST1 and ST2) were examined (Figure 1). Ornithine decarboxylase expression (ODC; [14]) as a marker gene of reproduction of red seaweed was also analyzed.
Thalli exposed to air flux instead of ethylene under the same experimental conditions were used as controls. Control (untreated) samples were cultured and processed in parallel. All samples were assayed in triplicate with two independent replicates for each experiment. At the end of the periods, samples of the thalli were frozen at −80 °C until the isolation of RNA.

4.3. RNA Extraction

The total RNA was separately extracted from the upper half regions (100 mg) of thalli using 1 mL Tri-Reagent (Sigma, St. Louis, MO, USA) according to the manufacturer’s instructions. The isolated RNA samples were individually suspended in 20 μL of 1 M Tris-HCl (pH 8), 0.5 M EDTA, and treated with DNase (1 U. mg−1, Promega, Madison, WI, USA) to destroy contaminating DNA. Total RNA was quantified using a TrayCell cuvette and Beckman Coulter DU 530 spectrophotometer. Next, extracted RNA from each sample (~1 μg) was reverse transcribed in the presence of oligo (dT) and primers with randomLy generated sequences from an iScript cDNA synthesis kit (Bio-Rad, Hercules, CA, USA). The reverse transcription procedure was carried out at 25 °C for 5 min, 42 °C for 30 min, and 85 °C for 5 min. The integrity of the cDNA was validated using a NanoDrop spectrophotometer (Thermo Fisher Scientific, Waltham, MA, USA). The products were kept at 4 °C until used.

4.4. Droplet Digital PCR (ddPCR) Primers and Protocol Implementation

For quantification of each target transcript by ddPCR, QX200 ddPCR EvaGreen Supermix (Bio-Rad) was used according to the manufacturer’s instructions. Briefly, for each sample, a PCR reaction mix (final volume, 20 μL) was prepared containing 1.5 μL of cDNA, 10 μL of QX200 ddPCR EvaGreen Supermix, and 0.22 μL of each primer (10 μM), and then was loaded into a cartridge. Then, an oil droplet (70 μL) was loaded into each cartridge, and the cartridge was covered with a gasket. Each cartridge was individually introduced into the droplet generator, and finally droplets of ~40 μL were transferred to the amplification plate. For each gene, three replicates were analyzed for each ethylene-treated sample and air-treated sample (control).
Primers for ddPCR were designed from cDNA sequences of the G. imbricata transcriptome (Table 1). PCR amplification was performed with a C1000 Touch Thermal Cycler (Bio-Rad) using the following conditions: an initial step at 95 °C for 5 min; followed by 40 cycles of 95 °C for 30 s, an experimentally determined annealing temperature (Table 1) for each gene for 1 min, 72 °C for 45 s; a single step at 4 °C for 5 min; and a temperature ramping from 4 °C to 90 °C at a rate of 2 °C s−1 for 5 min. After amplification, each sample was quantified using QuantaSoft v1.7.4 software (Bio-Rad). Data from merged wells (corresponding to each group of replicates) were retrieved, and the concentration of each group is given as the average number of transcript copies per μL.

4.5. Data Analysis

Gene expression (transcript copies per microliter) is reported herein as the mean ± standard deviation (SD). Statistical comparisons of concentrations were performed using R software (https://www.r-project.org; accesed on 20 May 2022). A one-way ANOVA followed by the post hoc tests Tukey HSD and Dunnett T3 was used to detect significant differences (p ≤ 0.01) between infertile thalli (at day 3) and thalli within early-stage cystocarp development (at day 10) with their respective controls.

Author Contributions

P.G.-J. conceived, designed, and wrote the manuscript. D.d.R.-S. conducted the experiments. P.G.-J. and R.R.R. discussed the manuscript. Authors read and approved the manuscript. All authors have read and agreed to the published version of the manuscript.

Funding

General funding from Universidad de Las Palmas de Gran Canaria.

Conflicts of Interest

The authors declare no conflict of interest.

References

  1. Ghanbarzadeh, M.; Golmoradizadeh, A.; Homaei, A. Carrageenans and carrageenases: Versatile polysaccharides and promising marine enzymes. Phytochem. Rev. 2018, 17, 535–571. [Google Scholar] [CrossRef]
  2. Shao, Z.; Duan, D. The Cell Wall Polysaccharides Biosynthesis in Seaweeds: A Molecular Perspective. Front. Plant Sci. 2022, 13, 902823. [Google Scholar] [CrossRef] [PubMed]
  3. Qin, X.; Ma, C.; Lou, Z.; Wang, A.; Wang, H. Purification and characterization of d-Gal-6-sulfurylase from Eucheuma striatum. Carbohydr. Polym. 2013, 96, 9–14. [Google Scholar] [CrossRef]
  4. La Barre, S.; Bates, S.S. Blue Biotechnology. Carrageenans: New Tools for New Applications. In Blue Biotechnology: Production and Use of Marine Molecules; Wiley-VCH Verlag GmbH & Co. KGaA: Weinheim, Germany, 2018; Volume 1, pp. 371–416. [Google Scholar] [CrossRef]
  5. Garcia-Jimenez, P.; Mantesa, S.R.; Robaina, R.R. Expression of Genes Related to Carrageenan Synthesis during Carposporogenesis of the Red Seaweed Grateloupia imbricata. Mar. Drugs 2020, 18, 432. [Google Scholar] [CrossRef] [PubMed]
  6. Ciancia, M.; Matulewicz, M.C.; Tuvikene, R. Structural Diversity in Galactans from Red Seaweeds and Its Influence on Rheological Properties. Front. Plant Sci. 2020, 11, 559986. [Google Scholar] [CrossRef] [PubMed]
  7. Oesterhelt, C.; Schnarrenberger, C.; Gross, W. Phosphomannomutase and phosphoglucomutase in the red alga Galdieria sulphuraria. Plant Sci. 1996, 121, 19–27. [Google Scholar] [CrossRef]
  8. Zhang, P.; Shao, Z.; Li, L.; Liu, S.; Yao, J.; Duan, D. Molecular characterisation and biochemical properties of phosphomannomutase/phosphoglucomutase (PMM/PGM) in the brown seaweed Saccharina japonica. J. Appl. Phycol. 2018, 30, 2687–2696. [Google Scholar] [CrossRef]
  9. McQueney, M.S.; Anderson, K.S.; Markham, G.D. Energetics of S-Adenosylmethionine Synthetase Catalysis. Biochemistry 2000, 39, 4443–4454. [Google Scholar] [CrossRef]
  10. Garcia-Jimenez, P.; Robaina, R.R. Effects of Ethylene on Tetrasporogenesis in Pterocladiella Capillacea (Rhodophyta). J. Phycol. 2012, 48, 710–715. [Google Scholar] [CrossRef] [PubMed]
  11. Garcia-Jimenez, P.; Robaina, R.R. On reproduction in red algae: Further research needed at the molecular level. Front. Plant Sci. 2015, 6, 93. [Google Scholar] [CrossRef] [PubMed] [Green Version]
  12. Garcia-Jimenez, P.; Robaina, R.R.; Montero-Fernández, M. Molecular mechanisms underlying Grateloupia imbricata (Rhodophyta) carposporogenesis induced by methyl jasmonate. J. Phycol. 2017, 53, 1340–1344. [Google Scholar] [CrossRef]
  13. Garcia-Jimenez, P.; Montero-Fernández, M.; Robaina, R.R. Analysis of ethylene-induced gene regulation during carposporogenesis in the red seaweed Grateloupia imbricata (Rhodophyta). J. Phycol. 2018, 54, 681–689. [Google Scholar] [CrossRef] [PubMed]
  14. Garcia-Jimenez, P.; Robaina, R.R. Volatiles in the Aquatic Marine Ecosystem: Ethylene and Related Plant Hormones and Sporulation in Red Seaweeds. In Systems Biology of Marine Ecosystems; Springer: Cham, Switzerland, 2017; pp. 99–116. [Google Scholar]
  15. Garcia-Jimenez, P.; Brito-Romano, O.; Robaina, R.R. Occurrence of jasmonates during cystocarp development in the red alga Grateloupia imbricata. J. Phycol. 2016, 52, 1085–1093. [Google Scholar] [CrossRef]
  16. Gojon, A.; Nacry, P.; Davidian, J.-C. Root uptake regulation: A central process for NPS homeostasis in plants. Curr. Opin. Plant Biol. 2009, 12, 328–338. [Google Scholar] [CrossRef] [PubMed]
  17. Davidian, J.-C.; Kopriva, S. Regulation of Sulfate Uptake and Assimilation—The Same or Not the Same? Mol. Plant 2010, 3, 314–325. [Google Scholar] [CrossRef] [PubMed]
  18. Algeo, T.J.; Luo, G.M.; Song, H.Y.; Lyons, T.W.; Canfield, D.E. Reconstruction of secular variation in seawater sulfate concentrations. Biogeosciences 2015, 12, 2131–2151. [Google Scholar] [CrossRef] [Green Version]
  19. Dai, Z.; Mentch, S.J.; Gao, X.; Nichenametla, S.N.; Locasale, J.W. Methionine metabolism influences genomic architecture and gene expression through H3K4me3 peak width. Nat. Commun. 2018, 9, 1955. [Google Scholar] [CrossRef]
  20. Whitcomb, S.; Rakpenthai, A.; Brückner, F.; Fischer, A.; Parmar, S.; Erban, A.; Kopka, J.; Hawkesford, M.; Hoefgen, R. Cysteine and Methionine Biosynthetic Enzymes Have Distinct Effects on Seed Nutritional Quality and on Molecular Phenotypes Associated with Accumulation of a Methionine-Rich Seed Storage Protein in Rice. Front. Plant Sci. 2020, 11, 1118. [Google Scholar] [CrossRef]
  21. Prioretti, L.; Gontero, B.; Hell, R.; Giordano, M. Diversity and regulation of ATP sulfurylase in photosynthetic organisms. Front. Plant Sci. 2014, 5, 597. [Google Scholar] [CrossRef] [Green Version]
  22. Takahashi, H.; Watanabe-Takahashi, A.; Smith, F.W.; Blake-Kalff, M.; Hawkesford, M.J.; Saito, K. The roles of three functional sulphate transporters involved in uptake and translocation of sulphate in Arabidopsis thaliana. Plant J. 2000, 23, 171–182. [Google Scholar] [CrossRef] [PubMed] [Green Version]
  23. Leustek, T. Sulfate Metabolism. Arab. Book 2002, 1, e0017. [Google Scholar] [CrossRef]
  24. Giordano, M.; Raven, J.A. Nitrogen and sulfur assimilation in plants and algae. Aquat. Bot. 2014, 118, 45–61. [Google Scholar] [CrossRef]
  25. Hopkins, L.; Parmar, S.; Błaszczyk, A.; Hesse, H.; Hoefgen, R.; Hawkesford, M.J. O-Acetylserine and the Regulation of Expression of Genes Encoding Components for Sulfate Uptake and Assimilation in Potato. Plant Physiol. 2005, 138, 433–440. [Google Scholar] [CrossRef] [Green Version]
  26. Wawrzynska, A.; Moniuszko, G.; Sirko, A. Links Between Ethylene and Sulfur Nutrition—A Regulatory Interplay or Just Metabolite Association? Front. Plant Sci. 2015, 6, 1053. [Google Scholar] [CrossRef] [Green Version]
  27. Al Murad, M.; Razi, K.; Benjamin, L.; Lee, J.H.; Kim, T.H.; Muneer, S. Ethylene regulates sulfur acquisition by regulating the expression of sulfate transporter genes in oilseed rape. Physiol. Plant. 2021, 171, 533–545. [Google Scholar] [CrossRef] [PubMed]
  28. Ratti, S.; Giordano, M. Allocation of Sulfur to Sulfonium Compounds in Microalgae. In Sulfur Assimilation and Abiotic Stress in Plants; Springer: Berlin/Heidelberg, Germany, 2008; pp. 317–333. [Google Scholar] [CrossRef]
  29. Rotte, C.; Leustek, T. Differential Subcellular Localization and Expression of ATP Sulfurylase and 5′-Adenylylsulfate Reductase during Ontogenesis of Arabidopsis Leaves Indicates That Cytosolic and Plastid Forms of ATP Sulfurylase May Have Specialized Functions. Plant Physiol. 2000, 124, 715–724. [Google Scholar] [CrossRef] [Green Version]
  30. Klonus, D.; Hofgen, R.; Willmitzer, L.; Riesmeier, J.W. Isolation and characterization of two cDNA clones encoding ATP-sulfurylases from potato by complementation of a yeast mutant. Plant J. 1994, 6, 105–112. [Google Scholar] [CrossRef] [PubMed]
  31. Garcia-Jimenez, P.; Robaina, R.R. Insight into the Mechanism of Red Alga Reproduction. What Else Is Beyond Cystocarps Development? In Systems Biology; IntechOpen: London, UK, 2019. [Google Scholar]
  32. Garcia-Jimenez, P.; Garcia-Maroto, F.; Garrido-Cárdenas, J.A.; Ferrandiz, C.; Robaina, R.R. Differential expression of the ornithine decarboxylase gene during carposporogenesis in the thallus of the red seaweed Grateloupia imbricata (Halymeniaceae). J. Plant Physiol. 2009, 166, 1745–1754. [Google Scholar] [CrossRef]
  33. Egli, B.; Kölling, K.; Köhler, C.; Zeeman, S.C.; Streb, S. Loss of Cytosolic Phosphoglucomutase Compromises Gametophyte Development in Arabidopsis. Plant Physiol. 2010, 154, 1659–1671. [Google Scholar] [CrossRef] [Green Version]
  34. Koch, K. Sucrose metabolism: Regulatory mechanisms and pivotal roles in sugar sensing and plant development. Curr. Opin. Plant Biol. 2004, 7, 235–246. [Google Scholar] [CrossRef]
  35. Siow, R.-S.; Teo, S.-S.; Ho, W.-Y.; Shukor, M.Y.A.; Phang, S.-M.; Ho, C.-L. Molecular Cloning and Biochemical Characterization of Galactose-1-Phosphate URI-Dylyltransferase from Gracilaria Changii (Rhodophyta). J. Phycol. 2021, 48, 155–162. [Google Scholar] [CrossRef]
  36. Lee, W.K.; Lim, Y.Y.; Leow, A.T.C.; Namasivayam, P.; Ong Abdullah, J.; Ho, C.L. Biosynthesis of agar in red seaweeds: A review. Carbohydr. Polym. 2017, 164, 23–30. [Google Scholar] [CrossRef]
  37. Li, S.-Y.; Shabtai, Y.; Arad, S. Floridoside as a Carbon Precursor for the Synthesis of Cell-Wall Polysaccharide in the Red Microalga Porphyridium SP. (Rhodophyta). J. Phycol. 2002, 38, 931–938. [Google Scholar] [CrossRef]
  38. Percival, E. The polysaccharides of green, red and brown seaweeds: Their basic structure, biosynthesis and function. Br. Phycol. J. 1979, 14, 103–117. [Google Scholar] [CrossRef]
  39. Cole, K.M.; Sheath, R.G. Biology of the Red Algae; Cambridge University Press: Cambridge, UK, 1990; p. 517. [Google Scholar]
Figure 1. Schematic biosynthetic pathway for sulfate assimilation and synthesis of carrageenan with indication of enzymes studied in this work. PAPS, 3′phosphoadenosine-5′phosphosulfate; APS adenosine 5′-phosphosulfate; (1) S transporter; (2) sulfate adenylyltransferase; (3) phosphoglucomutase; (4) galactose 1 phosphate uridyltransferase; (5) carbohydrate sulfotransferase; (6), galactose-6-sulfurylase I, II.
Marinedrugs 20 00436 g001
Figure 2. Scheme showing timeline for determination of gene expression (bold arrowhead) in Grateloupia imbricata: (A) in infertile thalli treated with methionine and MgSO4 for 3 days, and when early stages of cystocarp development were elicited after a 15 min ethylene treatment (end time: 10 days); (B) in thalli within early stages of cystocarp development after 15 min ethylene treatment at 7 days, and when thalli reached late stages of cystocarp development after addition of methionine and fluxed ethylene (endtime 17 days). Note that different controls are indicated.
Marinedrugs 20 00436 g002
Figure 3. Expression of genes that encode sulfate transporter (S-transporter) and sulfate adenylyltransferase (SAT) at day 3 (addition of S-source) and day 10 (S-source plus fluxed ethylene) in thalli of Grateloupia imbricata (as in experiment A in Figure 2). Expression was analyzed in (A) infertile thalli after addition of exogenous methionine and in thalli that reached early-stage cystocarp development after methionine plus ethylene; and (B) infertile thalli after addition of exogenous MgSO4 and in thalli that reached early-stage cystocarp development after MgSO4 plus ethylene. Expression (copies μL−1) is shown as a percentage relative to expression in untreated thalli at day 3 and day 10 for methionine and MgSO4, respectively (100%, dashed horizontal line). For methionine, infertile thalli gene expression (i.e., 100%), S-transporter = 1.55 ± 3.35 × 10⁻³ and SAT = 1.3 ± 2.15 × 10⁻³. In thalli within early-stage cystocarp development (10 days) gene expression (i.e., 100%), S-transporter = 4.0 ± 6 × 10⁻⁴ and SAT = 2.1 ± 7 × 10⁻⁴. For MgSO4, S-transporter = 1.55 ± 5 × 10⁻⁵ and SAT = 1.3 ± 5.5 × 10⁻⁵ in infertile thalli. In thalli within early-stage cystocarp development, S-transporter = 1.7 ± 5 × 10⁻⁵ and SAT = 1.9 ± 1.05 × 10⁻⁴. * means significant difference (p < 0.01) between infertile thalli and its respective control at day 3 and between thalli within early-stage cystocarp development and its control at day 10.
Marinedrugs 20 00436 g003
Figure 4. Expression of genes that encode phosphoglucomutase (PGM) and galactose 1 phosphate uridyltransferase (GALT) at day 3 (addition of S-source) and day 10 (S-source plus fluxed ethylene) in thalli of Grateloupia imbricata (as in experiment A in Figure 2). Expression was analyzed in: (A) infertile thalli after addition of exogenous methionine and in thalli that reached early-stage cystocarp development after methionine plus ethylene, and (B) infertile thalli after addition of exogenous MgSO4 and in thalli that reached early-stage cystocarp development after MgSO4 plus ethylene. Expression (copies μL−1) is shown as a percentage relative to expression in untreated thalli at day 3 and day 10 for methionine and MgSO4, respectively (100%, dashed horizontal line). For methionine, infertile thalli gene expression (i.e., 100%) is PGM = 1.25 ± 1.65 × 10⁻³ and GALT = 1.6 ± 5 × 10⁻⁵. In thalli within early-stage cystocarp development, gene expression (i.e., 100%) is PGM = 2.25 ± 1.7 × 10⁻³ and GALT = 25 ± 6.35 × 10⁻³. For MgSO4, PGM = 1.25 ± 1.7 × 10⁻³, and GALT = 1.6 ± 1.45 × 10⁻³. In thalli within early-stage cystocarp development, PGM = 0.725 ± 2.05 × 10⁻³ and GALT = 1.6 ± 1.45 × 10⁻³. * means significant difference (p < 0.01) between infertile thalli and its respective control at day 3 and between thalli within cystocarp development early stage and its control at day 10.
Marinedrugs 20 00436 g004
Figure 5. Expression of genes that encode carbohydrate sulfotransferase (ST1 and ST2) at day 3 (addition of S-source) and day 10 (S-source plus fluxed ethylene) in thalli of Grateloupia imbricata (as in experiment A in Figure 2). Expression was analyzed in (A) infertile thalli after addition of exogenous methionine and in thalli that reached early-stage cystocarp development after methionine plus ethylene, and (B) infertile thalli after addition of exogenous MgSO4 and in thalli that reached early-stage cystocarp development after MgSO4 plus ethylene. Expression (copies μL−1) is shown as a percentage relative to expression in untreated thalli at day 3 and day 10 for methionine and MgSO4, respectively (100%, dashed horizontal line). For methionine, infertile thalli gene expression (i.e., 100%) is ST1 = 1.75 ± 1.45 × 10⁻³ and ST2 = 1.5 ± 5 × 10⁻⁴. In thalli within early-stage cystocarp development, gene expression (i.e., 100%) is ST1 = 6.4 ± 1.1 × 10⁻⁴ and ST2 = 4.9 ± 4.5 × 10⁻⁴. For MgSO4, ST1 = 1.75 ± 1.0 × 10⁻² and ST2 = 1.5 ± 5 × 10⁻⁵. In thalli within early-stage cystocarp development, ST1 = 0.8 ± 5 × 10⁻⁵ and ST2 = 1.7 ± 5 × 10⁻⁵.
Marinedrugs 20 00436 g005
Figure 6. Expression of genes that encode galactose-6-sulfurylase type I (SYI.1 and SYI.2) at day 3 (addition of S-source) and day 10 (S-source plus fluxed ethylene) in thalli of Grateloupia imbricata (as in experiment A in Figure 2). Expression was analyzed in (A) infertile thalli after addition of exogenous methionine and in thalli that reached early-stage cystocarp development after methionine plus ethylene, and in (B) infertile thalli after addition of exogenous MgSO4 and in thalli that reached early-stage cystocarp development after MgSO4 plus ethylene. Expression (copies μL−1) is shown as a percentage relative to expression in untreated thalli at day 3 and day 10 for methionine and MgSO4, respectively (100%, dashed horizontal line). For methionine, infertile thalli gene expression (i.e., 100%) is SYI.1 = 1.0 ± 1.1 × 10⁻⁴ and SYI.2 = 2 ± 1.05 × 10⁻³. In thalli within early-stage cystocarp development, gene expression (i.e., 100%) is SYI.1 = 2 ± 6.0 × 10⁻⁴ and SYI.2 = 1.9 ± 1.15 × 10⁻⁴. For MgSO4, SYI.1 = 1.0 ± 5.5 × 10⁻⁴ and SYI.2 = 20 ± 1.85 × 10⁻³. In thalli within early-stage cystocarp development, SYI.1 = 2.0 ± 1.55 × 10⁻³ and SYI.2 = 1.9 ± 5 × 10⁻⁵. * means significant difference (p < 0.01) between infertile thalli and its respective control at day 3 and between thalli within cystocarp development early stage and its control at day 10.
Marinedrugs 20 00436 g006
Figure 7. Expression of genes that encode galactose-6-sulfurylase type II (SYII.1 and SYII.2) at day 3(addition of S-source) and day 10 (S-source plus fluxed ethylene) in thalli of Grateloupia imbricata (as in experiment A in Figure 2). Expression was analyzed in (A) infertile thalli after addition of exogenous methionine and in thalli that reached early-stage cystocarp development after methionine plus ethylene, and (B) infertile thalli after addition of exogenous MgSO4 and in thalli that reached early-stage cystocarp development after MgSO4 plus ethylene. Expression (copies μL−1) is shown as a percentage relative to expression in untreated thalli at days 3 and 10 for methionine and MgSO4, respectively (100%, dashed horizontal line). For methionine, infertile thalli gene expression (i.e., 100%) is SYII.1 = 0.9 ± 5.0 × 10⁻⁵ and SYII.2 = 1.95 ± 9.0 × 10⁻³. In thalli within early-stage cystocarp development, gene expression (i.e., 100%) is SYII.1 = 2.5 ± 1.05 × 10⁻³ and SYII.2 = 1.85 ± 9.5 × 10⁻⁶. For MgSO4, SYII.1 = 0.9 ± 5.0 × 10⁻⁵ and SYII.2 = 1.95 ± 4.5 × 10⁻⁵. In thalli within early-stage cystocarp development, SYII.1 = 2.5 ± 4.35 × 10⁻⁶ and SYII.2 = 1.85 ± 5.5 × 10⁻⁴. * means significant difference (p < 0.01) between infertile thalli and its respective control at day 3 and between thalli within early-stage cystocarp development and its control at day 10.
Marinedrugs 20 00436 g007
Figure 8. Expression of genes that encode sulfate transporter (S-transporter) and sulfate adenylyltransferase (SAT) after an ethylene flux in thalli of Grateloupia imbricata (Experiment B in Figure 2). Expression was analyzed in thalli within early-stage cystocarp development at day 7 (in the left), and in thalli within cystocarp development late stage at day 17 (in the right). Expression (copies μL−1) is shown as a percentage relative to expression in untreated thalli at day 7 and 17 (100%, dashed horizontal line). In thalli within early-stage cystocarp development (day 7), gene expression (i.e., 100%) is S-transporter = 3.05 ± 6 × 10⁻⁴ and SAT = 1.8 ± 7 × 10⁻⁴. In thalli within late-stage cystocarp-development (17 day), S-transporter = 2.02 ± 6 × 10⁻⁴ and SAT = 0.98 ± 1.1 × 10⁻⁵. * means significant difference (p < 0.01) between thalli within early-stage cystocarp development and its respective control at day 7 and between thalli within late-stage cystocarp development and its control at day 17.
Marinedrugs 20 00436 g008
Figure 9. Expression of genes that encode proteins phosphoglucomutase (PGM) and galactose-1-phosphate uridyltransferase (GALT) after ethylene flux in thalli of Grateloupia imbricata (Experiment B in Figure 2). Expression was analyzed in thalli within early-stage cystocarp development at day 7 (in the left), and in thalli within cystocarp development late stage at day 17 (in the right). Expression (copies μL−1) is shown as a percentage relative to expression in untreated thalli at day 7 and day 17 (100%, dashed horizontal line). In thalli within early-stage cystocarp development (7 d), gene expression (i.e., 100%) is PGM = 1.25 ± 1.1 × 10⁻³ and GALT = 8.9 ± 2.13 × 10⁻⁴. In thalli within late-stage cystocarp development (14 d), PGM = 1.19 ± 0.89 × 10⁻⁴ and GALT =1.85 ± 1.1 × 10⁻⁴. * means significant difference (p < 0.01) between thalli within early-stage cystocarp development and its respective control at day 7 and between thalli within cystocarp development late stage and its control at day 17.
Marinedrugs 20 00436 g009
Table 1. Sequences of the forward (F) and reverse (R) primers for each gene involved in S-transporter and assimilation (sulfate transporter, Sulfate adenylyltransferase) as Carrageenan precursor (phosphoglucomutase, galactose 1 phosphate uridylyltransferase), in Carrageenan synthesis (Galactose-6-Sulfurylases I and II, Carbohydrate sulfotransferase), and in reproduction (ODC).
GenePrimer NameSequence (5′-3′)
S transporter and assimilation
Sulfate transporter
(S-transporter)
ST-2545F
ST-2545R
GGAAGATCCGGACGAGATTATG
GGGTACCTTCGTCTAGTGTTTC
Sulfate adenylyltransferase
(SAT)
SAT-790F
SAT-790R
GAGGAATGCTGATGCTGTCT
ACCTCGGTTAATGAGTTCTTCC
Carrageenan precursor
Phosphoglucomutase
(PGM)
PG-17368F
PG-17368R
AGGTCGATAGCCGAGTTTAGA
CCAGGATTGTGACTAGCTGTAAG
Galactose 1 phosphate uridyltransferase
(GALT)
G1PU-1681F
G1PU-1681R
GTAGTAGATGCCTGGTGTGATG
CATATCTGGCCATGAGGATGAG
Carrageen synthesis
Galactose-6-Sulfurylase I
(SYI.1)
GS1-136F
GS1-136R
ACAACGAGAAGGCTGACAAG
CCGCACATTTGTTTCGCTATC
Galactose-6-Sulfurylase I
(SYI.2)
GS1-824F
GS1-824R
GAAACGGAGGTCACTCTTGTAG
GAAGTCGACCGAGTTGCTTAT
Galactose-6-Sulfurylase II
(SYII.1)
GS2-5356F
GS2-5356R
GGAGGATTCTTGTTCGAGGATG
AGTAGCGAGACCCGAGTATT
Galactose-6-Sulfurylase II
(SYII.2)
GS2-6049F
GS2-6049R
ATAACCCAAGTCCTCCTCCT
GCTATCCCGTTCTTGCATCT
Carbohydrate sulfotransferase
(ST1)
CS-3064F
CS-3064R
CTGCATCACTGCGTTACTATTTC
CATCAGGTCCAGCCACATAA
Carbohydrate sulfotransferase
(ST2)
CS-3265F
CS-3265R
TGTCGGGTGATGCGTTAAA
TCGTTCCACTTTGTCCAGATAC
Reproduction
Ornithine decarboxylase
(ODC)
D2-ODCF
D2-ODCR
5′3′ CGCAGACGCGACACAGTA
5′3′ TCACCAGAATGTTTAGCGAAGA
Publisher’s Note: MDPI stays neutral with regard to jurisdictional claims in published maps and institutional affiliations.

