Article

Variability in Macro- and Micronutrients of 15 Commercially Available Microalgae Powders

by
Fabian Sandgruber
1,2,
Annekathrin Gielsdorf
3,
Anja C. Baur
4,
Benjamin Schenz
1,2,
Sandra Marie Müller
5,
Tanja Schwerdtle
5,6,
Gabriele I. Stangl
2,4,
Carola Griehl
3,
Stefan Lorkowski
2,7 and
Christine Dawczynski
1,2,*
1
Junior Research Group Nutritional Concepts, Institute of Nutritional Science, Friedrich Schiller University Jena, Dornburger Str. 29, 07743 Jena, Germany
2
Competence Cluster for Nutrition and Cardiovascular Health (nutriCARD) Jena-Halle-Leipzig, Dornburger Str. 25, 07743 Jena, Germany
3
Competence Center Algal Biotechnology, Anhalt University of Applied Science, Bernburger Straße 55, 06366 Köthen, Germany
4
Institute of Agricultural and Nutritional Science, Martin Luther University Halle-Wittenberg, Theodor-Lieser-Str. 11, 06120 Halle, Germany
5
Department of Food Chemistry, Institute of Nutritional Science, University of Potsdam, Arthur-Scheunert-Allee 114–116, 14558 Nuthetal, Germany
6
NutriAct-Competence Cluster Nutrition Research, Berlin-Potsdam, Arthur-Scheunert-Allee 114–116, 14558 Nuthetal, Germany
7
Institute of Nutritional Science, Friedrich Schiller University Jena, Dornburger Str. 25, 07743 Jena, Germany
*
Author to whom correspondence should be addressed.
Mar. Drugs 2021, 19(6), 310; https://doi.org/10.3390/md19060310
Submission received: 13 April 2021 / Revised: 22 May 2021 / Accepted: 24 May 2021 / Published: 27 May 2021
(This article belongs to the Collection Microalgal Active Biomolecules)

Abstract

:
The nutrient composition of 15 commercially available microalgae powders of Arthrospira platensis, Chlorella pyrenoidosa and vulgaris, Dunaliella salina, Haematococcus pluvialis, Tetraselmis chuii, and Aphanizomenon flos-aquae was analyzed. The Dunaliella salina powders were characterized by a high content of carbohydrates, saturated fatty acids (SFAs), omega-6-polyunsaturated fatty acids (n6-PUFAs), heavy metals, and α-tocopherol, whereas the protein amounts, essential amino acids (EAAs), omega-3-PUFAs (n3-PUFAs), vitamins, and minerals were low. In the powder of Haematococcus pluvialis, ten times higher amounts of carotenoids compared to all other analyzed powders were determined, yet it was low in vitamins D and E, protein, and EAAs, and the n6/n3-PUFAs ratio was comparably high. Vitamin B12, quantified as cobalamin, was below 0.02 mg/100 g dry weight (d.w.) in all studied powders. Based on our analysis, microalgae such as Aphanizomenon and Chlorella may contribute to an adequate intake of critical nutrients such as protein with a high content of EAAs, dietary fibers, n3-PUFAs, Ca, Fe, Mg, and Zn, as well as vitamin D and E. Yet, the nutritional value of Aphanizomenon flos-aquae was slightly decreased by high contents of SFAs. The present data show that microalgae are rich in valuable nutrients, but the macro- and micronutrient profiles differ strongly between and within species.

1. Introduction

Microalgae are one of the oldest organisms known by mankind. It is estimated that there are over 50,000 species worldwide, but only about 30,000 species have been named and partially studied [1]. The food industry has discovered microalgae as a valuable microorganism for their purposes. Microalgae such as Chlorella species exhibit a high protein content, and almost all essential amino acids (EAAs), thus serving as a potential source of valuable, high-quality protein. Microalgae can additionally be rich in carotenoids [2,3,4], vitamins [5,6], minerals [7], and omega-3(n3)-fatty acids [8]. At present, only ten microalgae species are authorized by the European Commission for human nutrition [9]. Aphanizomenon flos-aquae, Arthrospira platensis, Chlorella luteoviridis, Chlorella pyrenoidosa, Chlorella vulgaris, Dunaliella salina, Odontella aurita, and Tetraselmis chuii can be ingested in powder, pellet, or tablet form [10]. Phaeodactylum tricornutum, Schizochytrium species, and Ulkenia species can only be consumed in oil form [10]. Haematococcus pluvialis can be ingested as an astaxanthin-enriched extract [10]. Data on the complete nutrient profile of these ten EU-authorized microalgae species are not available at present. Most of the existing data were obtained from microalgae cultivated on a laboratory scale, markedly different from industrial cultivation in open ponds and photobioreactors, thus causing possible variations in the nutrient profile. The variability of the nutrient profile of microalgae according to its species and the cultivation conditions, including culture medium, temperature, and light regime, is a well-studied fact [11,12,13]. Thus, the present study aims to evaluate the nutrient profile of fifteen commercially available microalgae powders and compares the determined data with the nutrient table highlighted in the label information. The total fiber content, the amount of protein and fat, selected minerals, trace elements, heavy metals, vitamins, amino acids profiles, and fatty acids composition of these commercially available microalgae powders were evaluated. Additionally, an individual nitrogen factor (N-factor) for each sample based on the determined amino acid profiles was calculated to ensure the correct quantification of the crude and pure protein.

2. Results

2.1. Amino Acid Analysis

The analysis of amino acid profiles of the microalgae species under consideration revealed that the sulfur-containing amino acid cysteine (Cys) was present in concentrations below the limit of quantification (LOQ) of 0.001%, and was the rarest in all analyzed samples (Table 1). The Cys concentration in the Arthrospira platensis species varied between 0.03 and 0.06% dry weight (d.w.), while the Cys concentration in Dunaliella salina and Haematococcus pluvialis was below the LOQ of 0.001% d.w. and was significantly different to Arthrospira platensis (p = 0.028). The amino acid methionine was equally scarce with the lowest concentrations in Dunaliella salina, Haematococcus pluvialis and Tetraselmis chuii powders. The second limiting amino acid was tryptophan with concentrations of 0.03% d.w. in Dunaliella salina and 0.37 to 0.55% d.w. in Arthrospira platensis. The main amino acids in all species were aspartate (Asp) and glutamic acid (Glu), with the highest concentrations in Arthrospira platensis recorded at 4.90 and 5.52% d.w. (Table 1). All analyzed samples were rich in alanine (Ala), arginine (Arg), and leucine (Leu, Table 1). Dunaliella salina and Tetraselmis chuii powders were deficient in concentrations of all analyzed amino acids with values close to or below the LOQ of 0.001%. In both powders, Glu, Leu, and Val were the main amino acids. The Dunaliella salina, Tetraselmis chuii, and Haematococcus pluvialis powders had concentrations of nitrogen below 2% d.w. These were: 1.5 and 1.0% d.w. in the Dunaliella species, 1.94% d.w. for Tetraselmis, and 1.04% d.w. in Haematococcus, respectively. In contrast, the N-content of the other analyzed powders ranged from 8.5 to 10.4%.

2.2. Evaluation of Protein Quality

The amino acid score (AAS), also known as the Chemical Score, was established in 1946 by the World Health Organization (WHO) to quantify dietary protein quality. It evaluates the protein quality by comparing its amino acid concentrations with those of a reference protein [14]. The reference protein was chosen according to WHO criteria for adults’ protein requirements [15]. Amino acids (AAs) with concentrations below the LOQ, e.g., in Dunaliella salina, were set to an LOQ of 0.001% to calculate the AAS with the highest possible concentration that could have been in the microalgae power. The calculated AAS of the analyzed microalgae powders varied from 6, being the lowest score in Dunaliella salina, to 100, being the highest score in Chlorella pyrenoidosa No. 3 and Arthrospira platensis powder No. 1 (Table 1).

2.3. Macronutrients and Further Components

The nitrogen (N) content quantified by the Kjeldahl method ranged from 1.0 to 10.4 g/100 g between the six species studied (Table 2). There was a wide range of variation due to the multiplication of the N content with several N-factors. With a general N-factor of 6.25, the crude protein content ranged from 0.6 to 65.2%. With the same specific N-factor of 4.78 [16] for all powders, the crude protein variation ranged from 0.5 to 49.9% d.w. Using the calculated specific N-factor based on each microalgae powder’s amino acid profile, the crude protein content could be determined more accurately. In this case, the powders’ crude protein content ranged from 0.21 to 49.6% d.w. Pure protein contents varying between 0.1 to 43.4% d.w. were detected (Table 2).
The total fiber content ranged from 6.3 and 38.7% d.w. in the studied microalgae. The highest concentration of 38.7% total fiber was detected in Arthrospira platensis powder (Table 2). The concentration of total fat was below 9% d.w. The quantities of total ash ranged from 0.9 to 11.0% d.w. in the analyzed microalgae. Only the Tetraselmis chuii powder showed a higher mean of total ash of 17.7% d.w. Digestible carbohydrate content was calculated based on the protein analysis results, dietary fiber, and ash concentrations. This resulted in a wide range, from 8.8 to 86.6% d.w. digestible carbohydrates within the analyzed powders (Table 2).

2.4. Fatty Acid Distribution

The fatty acid composition varied significantly (p < 0.05) depending on the analyzed microalgae species (Table 3). The dominating fatty acid in Arthrospira platensis was C16:0 with 1.28 and 2.08 g/100 g d.w. High concentrations of C16:0 were also observed in Chlorella pyrenoidosa No. 2 (1.47 g/100 g d.w.), Tetraselmis chuii (1.49 g/100 g d.w.), and Aphanizomenon flos-aquae (1.66 g/100 g d.w.). C18:2n6 was the second most abundant fatty acid with 0.90 to 1.49 g/100 g in four of five Arthrospira platensis powders. C18:3n6 was the third most prevalent fatty acid in four Arthrospira platensis powders. In one Arthrospira platensis powder, the concentration of C18:2n6 was lower than that of C18:3n6. Nevertheless, Chlorella species had, with 1.97 to 3.14 g/100 g, significantly higher amounts (p < 0.05) of C18:2n6 than Arthrospira platensis. The lowest amounts of saturated fatty acids (SFAs) were detected in Haematococcus pluvialis (0.23 g/100 g d.w.). The content of the main SFA C16:0 of Arthrospira platensis differed significantly from Chlorella vulgaris but not Chlorella pyrenoidosa with a p-value < 0.05. C18:1n9 varied greatly in Chlorella pyrenoidosa powder, with concentrations between 0.14 and 0.55 g/100 g d.w. in two powders and the third with up to 3.43 g/100 g d.w. C18:3n3 ranged in two Chlorella pyrenoidosa powder extracts from 0.87 to 1.25 g/100 g d.w., whereas the third extract contained only 0.036 g/100 g d.w. C18:2n6 was the dominating fatty acid in both Chlorella species and varied between 1.97 and 3.14 g/100 g d.w. in the five powders. C18:3n3 was the main n3-PUFA with up to 1.30 g/100 g d.w. in Chlorella vulgaris No.2, 1.25 g/100 g d.w. in Chlorella pyrenoidosa No. 1, and 0.97 mg/100 g d.w. in Tetraselmis chuii. These powders also contained good n6/n3 ratios, which were also calculated for Chlorella vulgaris No. 1. The n6/n3 ratios of Chlorella pyrenoidosa No. 1 (2.1) and No. 2 (2.3), Chlorella vulgaris No. 1 (5.0) and No. 2 (1.7), Tetraselmis chuii (0.4), Aphanizomenon flos-aquae (0.3), and Haematococcus pluvialis (1.6) were the lowest and therefore also favorable. The eicosapentaenoic acid (EPA) concentration was 0.41 g/100 g d.w. in the Tetraselmis chuii powder analyzed. The remaining powders contained less than 0.01 g/100 g d.w. of EPA and docosahexaenoic acid (DHA). In summary, comparably high amounts of C16:0 (> 25%) were observed in Tetraselmis chuii, Aphanizomenon flos-aquae, and all Arthrospira platensis. Chlorella pyrenoidosa No. 3, Tetraselmis chuii, and all Dunaliella salina contained the highest amounts of C18:1n9. C18:3n3 concentrations higher than 1.0 g/100 g were observed in Chlorella pyrenoidosa No. 1 and Chlorella vulgaris No. 2. EPA and DHA values were below 0.01 g/100 g in all powders except for Tetraselmis chuii, having 0.41 g/100 g EPA. An n6/n3 ratio lower than 2 was calculated for Chlorella vulgaris No. 2, Tetraselmis chuii, Aphanizomenon flos-aquae, and Haematococcus pluvialis.

2.5. Minerals, Trace Elements, and Heavy Metals

The concentrations of minerals, trace elements, and heavy metals were identified in all but one microalgae powder (Dunaliella salina), as its biomass was limited. There were large differences in Ca and Mg concentrations between the different algae species and the same species obtained from different providers (Table 4). The content of Ca in the analyzed Arthrospira platensis powders ranged from 4.5 to 4227 mg/100 g d.w., which is lower than the range described by [17] of 220 to 11,930 mg/100 g d.w. The highest Ca concentrations among the other species were detected in Chlorella pyrenoidosa No. 1 with up to 556 mg/100 g d.w. Remarkably, only one of the three analyzed Chlorella pyrenoidosa powders had such high concentrations, whereas the means of Ca of the other two powders ranged from 101.6 to 148.2 mg/100 g d.w. The highest Mg concentration was detected in a Chlorella pyrenoidosa powder with up to 815.1 mg/100 g d.w., followed by an Mg content of 368.1 mg/100 g d.w. in the Haematococcus pluvialis powder. Fe had the highest concentration for the analyzed trace elements, followed by Zn and I (Table 4). Mo concentration was higher than Cu followed by I in only one Arthrospira platensis powder. The concentration of Se was below the LOQ of 0.1 µg/100 g d.w. in the Aphanizomenon flos-aquae, Tetraselmis chuii, one Arthrospira platensis, and one Chlorella pyrenoidosa powders (Table 4).
The content of selected heavy metals was analyzed in 14 of the 15 microalgae. One Dunaliella salina powder had limited biomass (Table 4). The highest Cd concentrations were detected in one Arthrospira platensis powder with 9.61 µg/100 g d.w. This value, on average, was three times higher than that of the other microalgae powders. The highest Hg concentrations were detected in another Arthrospira platensis powder with 4.91 µg/100 g d.w. Dunaliella salina powder contained the highest Pb concentrations with 36.7 µg/100 g d.w. (Table 4). The As concentration was below 70 µg/100 g d.w. in the studied powders, except for one Arthrospira platensis powder and one Dunaliella salina powder, in which concentrations of 799.2 and 213.7 µg/100 g d.w. were found (Table 4).

2.6. Analysis of Vitamins

Vitamins D2 and D3 were analyzed in all fifteen microalgae powders, as shown in Table 5. In the Tetraselmis chuii, Haematococcus pluvialis, Dunaliella salina, and Arthrospira platensis powders, the vitamin D2 and vitamin D3 content was below an LOQ of 0.013 and 0.4 µg/100 g d.w., respectively. Vitamin D2 concentrations between 37.3 and 420.6 µg/100 g d.w. were detected only in Chlorella species. Low concentrations, between 0.64 and 1.25 µg/100 g d.w., of vitamin D3 were found in two Chlorella species and the Aphanizomenon flos-aquae powders.
β- and γ- tocopherol concentrations were below the LOQ of 0.5 mg/100 g d.w. in all 15 powders. α-tocopherol was the most abundant tocopherol in all microalgae samples. Dunaliella salina powders contained by far the highest concentrations of α-tocopherol with 37.5–46.9 mg/100 g d.w., whereas the concentrations in the remaining powders were on average 5 mg/100 g d.w. In the Haematococcus pluvialis powder, the α-tocopherol concentrations were below the LOQ of 0.5 mg/100 g d.w., whereas those in the Arthrospira platensis samples were close to the LOQ. δ-tocopherol was detected only in the Aphanizomenon flos-aquae powder with 1.90 mg/100 g d.w. In the remaining microalgae powders, the δ-tocopherol content was below the LOQ of 0.5 mg/100 g d.w.
Vitamin B12, quantified as cobalamin, was below the LOQ of 0.02 mg/100 g d.w. in all studied powders (data not shown).

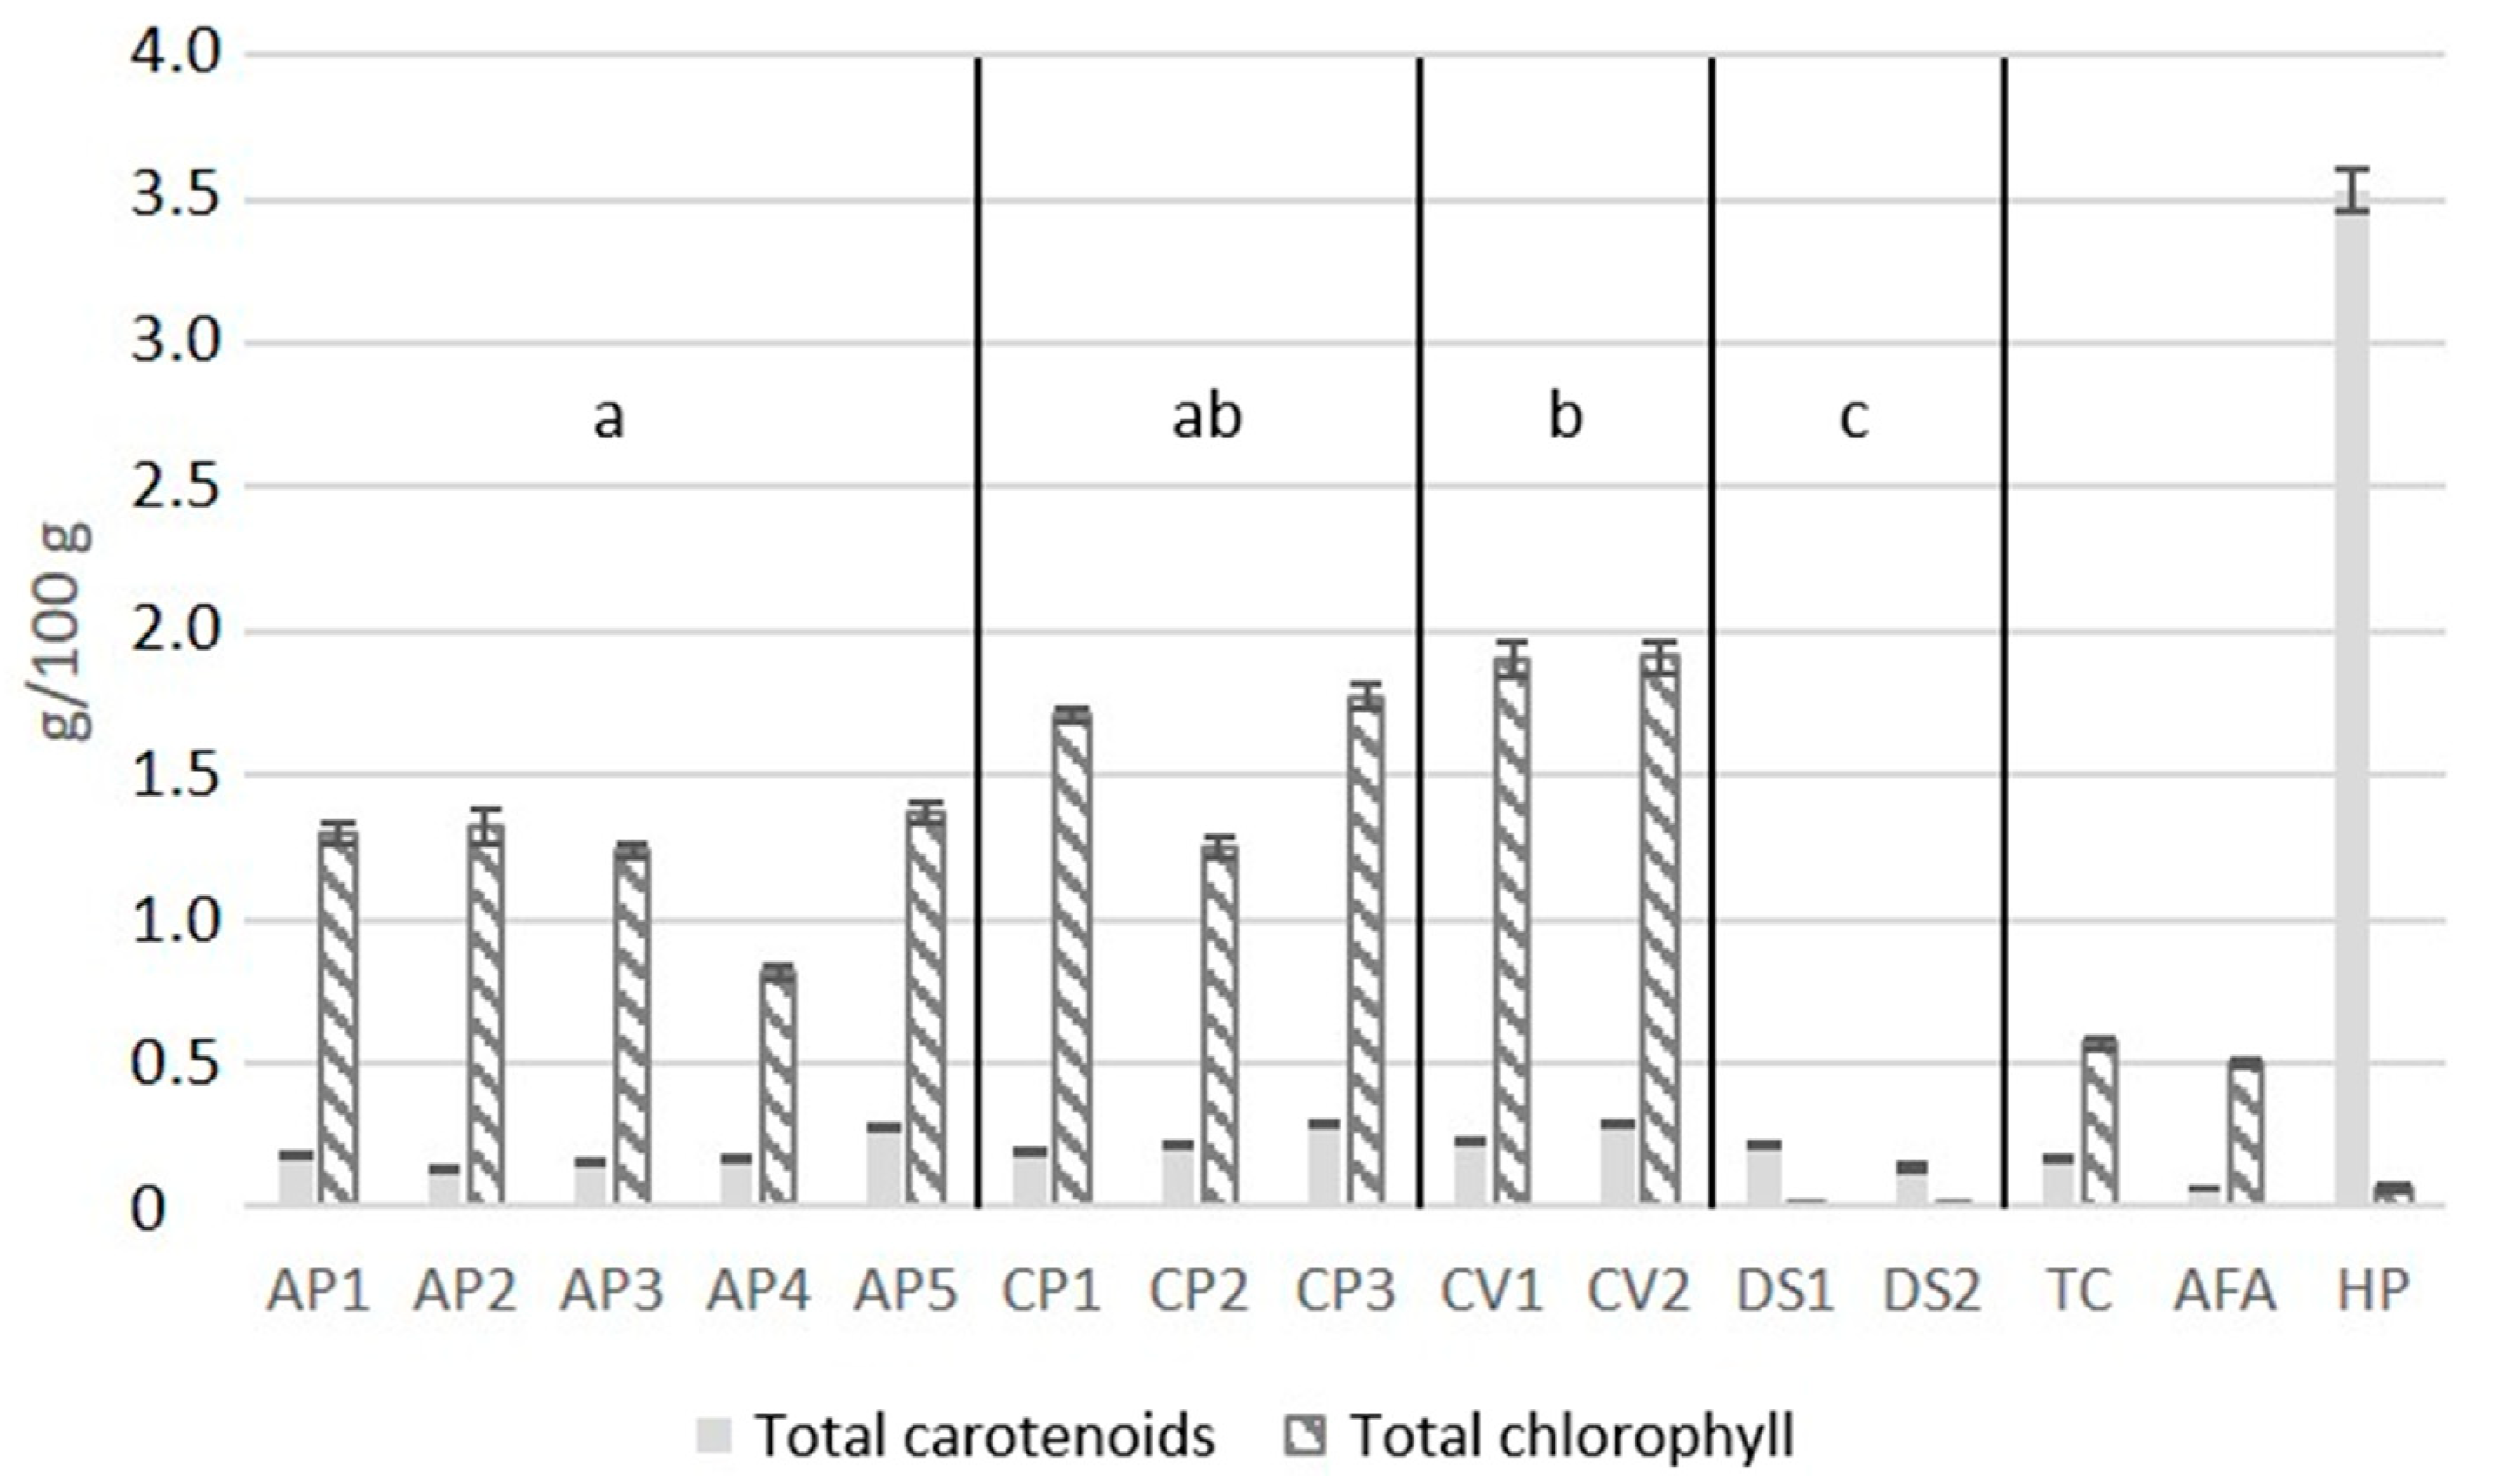
2.7. Total Chlorophylls and Carotenoids

Chlorella vulgaris powders contained on average the highest chlorophyll concentration at 1.9 g/100 g d.w., followed by Chlorella pyrenoidosa at 1.8 g/100 g d.w. (Figure 1). In contrast, the total chlorophyll concentrations in the powders of Dunaliella salina and Haematococcus pluvialis were less than 0.07 g/100 g d.w. The chlorophyll content of Dunaliella salina varied significantly (p < 0.05) from Arthrospira platensis, Chlorella vulgaris, and Chlorella pyrenoidosa.
The total carotenoid concentrations ranged from 0.07 in Aphanizomenon flos-aquae to 0.29 g/100 g d.w. in Chlorella vulgaris (Figure 1). In Haematococcus pluvialis, a total carotenoid content of 3.53 g/100 g d.w. was detected, which was more than ten times higher than that of the other analyzed powders (Figure 1). There were no significant differences in total carotenoid content within the four species Arthrospira platensis, Chlorella vulgaris, Chlorella pyrenoidosa, and Dunaliella salina.

3. Discussion

Microalgae have gained recognition as a viable resource for human nutrition. This study investigated the macro- and micronutrient profiles of fifteen commercially available microalgae powders with seven different species from various companies to evaluate their contribution to nutrient supply for human consumption. In addition, the analyzed amounts of nutrients were compared to those provided by the information label on all acquired products. Here, it has been determined that the amino acid percentages in Tetraselmis chuii, Arthrospira platensis, and Chlorella pyrenoidosa and vulgaris were similar to that described in the literature [18,19,20]. Slight differences were identifiable in the amino acid content with functional side-chains. These might occur during the drying process, which was unknown for the studied microalgae powders [21]. Many plants and yeasts can accumulate higher Glu levels due to stress exposure in order to stabilize cell membrane structure and scavenge free radicals [22,23]. The increase in branched amino acids such as Leu and valine (Val) in plants is most likely through abiotic stress caused by nitrogen starvation or high salt content, increasing the carotenoid content in Dunaliella salina [24,25]. Furthermore, the quantified nitrogen content is not in line with findings in the literature [26], where it reached 1.6% in Dunaliella salina and 4.1–5.2% in Haematococcus pluvialis [26]. The calculated AAS shows the high value of protein in Arthrospira platensis and Chlorella vulgaris. With an AAS of 98 for beef, 121 for eggs, and 127 for milk [27], both microalgae powders are able to compete with animal-based protein. The inconsistencies in the N-factor usage in previous studies have substantially impacted the calculations of the protein content and, therefore, hinder the comparability of the available data on the protein content in microalgae. Only a few research groups published their N-factor used for protein analysis, e.g., for Arthrospira platensis, which varied from 4.78 [16,28] to 6.25 [29] and 6.27 [30]. Thus, the differences in the N-factor used can result in under- or overestimation of the calculated protein content. Apart from Dunaliella salina, the N-factor of all analyzed microalgae species varied from 4.54 in one Chlorella vulgaris powder to 4.90 in Tetraselmis chuii. Because the concentration of 14 out of 18 AAs were under the LOQ in Dunaliella salina No. 2, it is possible that there is an over- or underestimation of the N-factor calculated for Dunaliella salina. Furthermore, a variation in the N-factor with a range of 4.62 to 4.87 was determined for the same Arthrospira platensis species but from different dealers. This N-factor coincides with the N-factor of 4.78 used in other studies [16,28].
Due to the multiplication of the N-content with different N-factors, the range of variation in the protein content increased even when the analyzed nitrogen content remained the same. This study used a specific N-factor based on each microalgae powders’ amino acid profile, thus enabling a more accurate calculation of each samples’ crude protein content. What is striking here is the inconsistency in the detected crude protein in Tetraselmis chuii with data in the literature [31] that report a crude protein content nearly three times higher. Aside from that, the crude protein content on the information label shows four times higher concentrations than detected. Comparing the crude protein content analyzed with the content labeled on the powder packaging, it is shown that there is an average protein overestimation of 33%, if Dunaliella salina and Tetraselmis chuii with an overestimation of 3700 and 400% are not included, when using a general N-factor compared to a specific one for each powder. Although the crude protein of Tetraselmis chuii does not match the data of the literature, several studies showed the impact of different lighting conditions [12] and availability of micronutrients from the culture medium [11,13] on the protein content of microalgae. Interestingly, the comparison of the crude and pure protein content indicates that Arthrospira platensis has the highest concentration of crude protein. However, Chlorella pyrenoidosa has the highest concentration of pure protein, caused by a lower non-protein-nitrogen (NPN) content in free amino acids, nucleic acids, chlorophyll [16], or ammonium in all analyzed Chlorella powders. Variation in the NPN content could result from different stages of harvesting and medium composition [11].
The concentrations of ash content under 11% and fat under 9%, which were detected in the present study, are comparable with the literature [29]. In comparison to the other analyzed powders, the total ash content in the marine microalgae Tetraselmis chuii was 2 to 3 times higher. This might occur due to its cultivation in salt water with higher amounts of minerals and trace elements compared to fresh water. Therefore, the microalgae might accumulate more minerals and trace elements. In addition, the washing process of the biomass, which is generally harder in marine than freshwater microalgae, as well as the chemical dewatering, where inorganic flocculants are used and can contaminate the product with aluminum, iron, and other metals, can affect the amount of ash [32]. The nutrient concentrations analyzed in the present study varies from the labels. Three powders had half the amount of total fat and one double the amount of total fat than that labeled on the packaging. The high content of carbohydrates in Dunaliella salina and Haematococcus pluvialis and comparably low contents of pure protein and total fiber indicate that these are highly processed microalgae products or that non-standard cultivation conditions have caused the accumulation of other substances [33,34]. Remarkable differences in the total fiber content were seen within powders of the same species. Some Arthrospira platensis powders showed 2–3 times higher fiber contents than others. Additionally, none of the determined total fiber contents matched the labeling information, if given. The label information had up to four times lower total fiber concentrations than determined. High intake of dietary fiber is related to reducing total and LDL cholesterol, an improved glucose metabolism, and a longer feeling of satiety [35,36]. Therefore, the nutritional value of the analyzed powder might be far more valuable than labeled on the packaging.
Microalgae are a known source of long-chain omega-3 polyunsaturated fatty acids (n3-PUFAs), which influence membrane fluidity and function, enzymes, and receptors [37]. As precursors of eicosanoids and docosanoids, long-chain n3-PUFAs influence inflammation processes and immune reactions in humans [38]. The PUFAs content of the microalgae powders was generally high, with 0.7 to 3.9 g/100 g d.w. The most dominant SFA in all powders was C16:0. The amount of C16:0 showed variations throughout all species. Variations of C16:0 were also seen within the same species of Chlorella and Arthrospira, with up to twice as much C16:0 in the species of Chlorella. There is evidence that increased consumption of SFAs such as C16:0 can raise total and LDL cholesterol and can therefore increase the risk for cardiovascular diseases [39]. Oleic acid concentrations (C18:1n9) showed considerable variations within the Chlorella species with a difference in concentration of up to 26 times. With C18:1n9 being the precursor of C18:2n6 and C18:3n3, Chlorella pyrenoidosa 1 and 2 seem to be more efficient in elongation and desaturation into n3-PUFAs by delta-15-desaturase, which may also depend on cultivation [40]. Due to industrialization, the n6/n3 PUFAs ratio typical of the Western diet has shifted from the original ratio of 1:1 to 20:1 [41]. A favorable n6/n3 ratio of 1:1 to 1:5 influences inflammatory processes and plays a role in preventing cardiovascular diseases [39]. Prostaglandin E2 and leukotriene B4 are two lipid mediators with pro-inflammatory properties [42,43]. Studies showed that the pro-inflammatory properties of prostaglandin E2 might exacerbate inflammatory processes though the release of DC-derived IL-23 [44], and therefore, the support of the inflammatory and autoreactive TH17 phenotype in rheumatoid arthritis, as well as bowel diseases [44,45]. Leukotriene B4 is an inducer for the activation of neutrophils, monocytes, and eosinophils. Its role in the activation of proinflammatory cytokines and mediators is well studied [46]. Prostaglandin E2 and leukotriene B4 and can be synthesized in the human body from n6-PUFAs, such as arachidonic acid [46]. Both eicosanoids are vital mediators of thrombosis and inflammation, whereas the resulting eicosanoids from n3-PUFAs have weaker or contrary physiological effects [41]. The regular consumption of the analyzed microalgae such as Chlorella pyrenoidosa, Tetraselmis chuii, Haematococcus pluvialis, and Aphanizomenon flos-aquae with n6/n3 ratios between 0.25 and 2.25 could improve the general n6/n3 PUFAs ratio of the modern Western diet. Due to the favorable n6/n3 PUFAs ratio, the Aphanizomenon flos-aquae powder seems beneficial for human health. However, its high content of SFAs, in particular, C16:0, reduces its nutritional value. The literature indicates that the content of free fatty acids such as C16:0, C17:1, 18:2n6, and MUFAs stored at room temperature can increase significantly (p < 0.05) whilst concentrations of n3-fatty acids and SFAs decrease due to oxidative instability over time [47]. To prevent time-dependent changes in compound compositions due to oxidative stability and photosensitivity, the powders were stored in darkness at −20 °C before analyzing the FAME. In addition, the packaging of the purchased powder was opaque to light and was vacuum-sealed. Nevertheless, it cannot be ruled out that changes of the compound composition happened due to the storage of the powders at the production facility where the storage conditions were mainly unknown.
The problem of high contamination of heavy metals in macroalgae is well documented [48]. Because of their cultivation in open seas, the substances they are exposed to are hardly adjustable, although microalgae contamination is less problematic due to adjustable cultivation media. An impure cultivation medium can still cause contamination. Therefore, the maximum amounts of Cd at < 100 µg/100 g, Hg at < 10 µg/100 g, and Pb at < 300 µg/100 g in microalgae are regulated by the Commission Regulation (EC) No. 1881/2006. None of the 14 analyzed microalgae had amounts that exceeded these limits. There is no regulation by the European Commission for the maximum concentration of As in microalgae or microalgae products. However, the existing guidelines by the Certification of Environmental Standards (CERES) for organic microalgae under the Regulation (EC) 889/2008, NOP, and derived from provisionally tolerable weekly intake (PTWI) for As by the WHO suggest a maximum limit of 70 µg/100 g. Based on these guidelines, Dunaliella salina No. 1 and Arthrospira platensis powder No. 4 are not suitable for to be declared “organic” (Table 2). By inactivating up to 200 enzymes, mostly involved in cellular energy pathways, DNA synthesis, and repair, As displays its toxicity. Acute As poisoning leads to encephalopathy, peripheral neuropathy, abdominal pain, severe diarrhea, or death [49]. In order to make a clearer statement on the possible negative influence on human health, a compound analysis of As, clarifying if it occurs as an organic or inorganic compound in the powders, was carried out. Inorganic As appears to be toxic, whereas organic As is non-toxic for humans. Nevertheless, all microalgae powders had no concerning concentrations of As for human health [49]. Overall, one microalgae powder of Arthrospira platensis (No. 1) had the lowest concentrations (12.91 µg/100 g) of all four determined heavy metals combined. In contrast, the powder of Arthrospira platensis (No. 4) showed the highest concentrations of As (799.2 µg/100 g) and Hg (4.91 µg/100 g) and is therefore less suitable for human consumption. These data indicate that the contamination with specific heavy metals does not exclusively depend on the species. Origin and cultivation conditions could be determinants for heavy metal concentrations as the legislation differs between the EU (VO (EU)/2015/2283), the U.S., and Asian countries [50]. Our samples originate mainly from China. In addition, one sample was cultivated in Germany (CP) and one sample was cultivated in Spain (TC; Table 6). The highest concentrations of As (AP, No. 4), Cd (AP, No. 2), Hg (AP, No. 4), and Pb (DS) are detected in samples from China, indicating water contamination or other factors depending on the location of cultivation ponds. This could be attributed to higher limit values constituted in the respective laws which apply for Asian countries. To this day, China has only regulations for heavy metal contents in macro algae but not microalgae [51]. Contained minerals and trace elements were shown in the label information in five out of fifteen powders. Label information of the Arthrospira platensis powder No. 1 had 60 to 70 times higher amounts of Ca, Mg, and Fe than detected. Furthermore, the concentrations of minerals and trace elements showed big differences within the same species, especially in the powder of Arthrospira platensis, where the amount of Ca was 1000 times higher than the Arthrospira platensis powder of a different producer. The Ca concentrations of the powders of Arthrospira platensis, Chlorella pyrenoidosa, Chlorella vulgaris, and Dunaliella salina varied significantly (p < 0.05) within the same species. These differences might result from different cultivation conditions, particularly the composition and purity of the growing medium. The concentration of the elements also depends on the harvest of the microalgae in different growing stations in which elements were accumulated [52,53]. An additional rinsing of the biomass can also affect the concentrations of minerals in the end product [54]. Again, the consumer will not receive the same product with the same nutrient composition when purchasing powders of the same microalgae species but from different producers.
The importance of vitamin D for the maintenance of calcium homeostasis in humans is well studied. Thus, an undersupply of vitamin D is associated with an increased risk of osteoporosis, hypertension, diabetes, and autoimmune diseases [55]. The primary source of vitamin D is the synthesis in the skin by photochemical conversion of provitamin D3. Apart from that, vitamin D and its precursors are also found, albeit in lower concentrations, in several foods. The highest natural vitamin D source is fish, which accumulates vitamin D3 from microalgae, its primary food source [56]. Fungi and yeast contain mainly vitamin D2, whereby these foods or food ingredients deliver comparably small concentrations of vitamin D2. Microalgae might synthesize vitamin D3 by converting 7-dehydrocholesterol due to exposure to ultraviolet B light [57]. Vitamin D3 was quantified in the Aphanizomenon flos-aquae, Chlorella vulgaris (No. 2), and Chlorella pyrenoidosa (No. 3) powders. Vitamin D2 concentrations were detected in all Chlorella powders, with differences of up to 10 times higher amounts in the same species. Within the method mentioned earlier in determining vitamin D2 concentration, the impurity of vitamin D2 might be from fungi which are present in the cultivation system for symbiotic reasons or due to contamination. Inconsistencies in vitamin D3 concentrations are due to the quantification of vitamin D3 in only two of five Chlorella powders. The α-tocopherol concentrations of Dunaliella salina powders were three times higher than the data available from the literature, which might indicate a concentration of α-tocopherol due to the processing of these microalgae [58]. The vitamin B12 content was used for advertising Chlorella pyrenoidosa (No. 1) with 60 µg/100 g d.w., Chlorella vulgaris (No. 2) 300 µg/100 g d.w., and Arthrospira platensis (No. 1, 2, 4) 160–350 µg/100 g d.w., even though the concentrations of vitamin B12 were below the LOQ of 20 µg/100 g d.w. for all studied microalgae. These data indicate that the advertised concentrations of vitamin B12 might be due to the identification of pseudo-cobalamin, whose bioavailability is close to none in humans [59]. Hence, the Chlorella pyrenoidosa powder no. 3 is the best vitamin D source, while both Dunaliella salina and Aphanizomenon flos-aquae powders showed the highest concentrations of α- and δ-tocopherol in all analyzed powders. Haematococcus pluvialis and Arthrospira platensis powders provide the lowest amounts of vitamins within the analyzed powders.
Chlorophylls are found in photosynthesizing plants, algae, and bacteria and are necessary for harvesting solar energy, charge separation, and electron transport within reaction centers [60]. Because of the free radical scavenging activity of chlorophyll and its derivatives, these substances can act as anti-oxidative and anti-inflammatory agents and are therefore beneficial for human consumption [61]. Chlorella is one of the richest sources of chlorophyll [62], which is congruent with the present analysis.
Microalgae can synthesize secondary carotenoids after exposure to environmental stressors such as decreasing nutrients and increasing light intensity [63]. Due to their anti-inflammatory and anti-oxidative properties, carotenoids play an important role in treating age-related macular degeneration [64], the prevention of cardiovascular diseases, different types of cancer [65,66,67,68], and stimulating cell proliferation in bones [69]. Dunaliella salina and Haematococcus pluvialis are known to accumulate larger concentrations of carotenoids. Under autotrophic conditions, the total carotenoid content in Haematococcus pluvialis was up to 1.6 g/100 g d.w. with a total chlorophyll concentration of less than 0.02 g/100 g d.w. [3]. The results of the 14 microalgae differed from the analyzed total carotenoid content of 3.5 g/100 g d.w. in the Haematococcus pluvialis powder (Figure 1). Recently published data show that Haematococcus pluvialis extracts obtained from the red phase can contain 2.9 g/100 g d.w. total carotenoids [26]. The analyzed chlorophyll and carotenoid concentrations of the studied microalgae were different from those in the literature data. This difference indicates that the purchased Haematococcus pluvialis and Dunaliella salina powders might be highly processed powders and not the entire algae biomass because there are widely studied taxa for astaxanthin and β-carotene concentrations. In contrast to Haematococcus pluvialis, the concentrations of carotenoids in the other microalgae powders were less than 0.3 g/100 g, which is in accordance with the literature. Variations depending on the harvesting times are possible [3,45,57,58]. In addition, the possibility of a decreased carotenoid and chlorophyll content compared to the label information can be caused by their degradation due to a possible exposure to oxygen, heat, acid, and light [70,71,72]. Although attention was paid to vacuum-sealed packaging opaque to light, as well as dark and cooled storage of the powder after arrival, the storage conditions at the production factory were mainly unknown. Therefore, degradation cannot be ruled out.
In summary, a ranking regarding the nutritional value for human nutrition of the analyzed microalgae powder was performed and is shown in Table 7. The order of ranking was performed relating to positive aspects such as the amount of macronutrients, AAS, n3, minerals, and trace elements, as well as vitamins. Less positive components such as low macronutrient contents, SFAs, and high amounts of heavy metals decreased the value of the microalgae powder. Dunaliella salina powders were mostly defined by high contents of carbohydrates, Zn, and α-tocopherol. Because of a generally low content of macronutrients such as protein, combined with the lowest AAS and high n6/n3 ratio, Dunaliella salina powders were ranked with the lowest nutritional value of all determined powders. The heavy metal analysis of Dunaliella salina No.1 revealed high concentrations of As and Pb and was therefore ranked last. Numbers 11 to 13 on the ranking list were given to Arthrospira platensis powders No. 3, 2, and 4. All three powders had high amounts of protein and different trace elements compared to ranking numbers 14 and 15. On the negative side, they were low in concentrations of vitamins and high in C16:0 amounts. In addition, the n6/n3 ratio was also high. No.4 had the highest concentration of As of all microalgae powders and was therefore placed on ranking number 13. The Arthrospira platensis powder No. 3 had the highest amounts of minerals and Zn, thus it was better ranked than Arthrospira platensis powder No. 3. The 10th place was given to the Haematococcus pluvialis powder because of the third highest carbohydrate concentration and the by far highest carotenoid amount. The powder had also higher contents of minerals than Arthrospira platensis powder No. 2 and the third lowest n6/n3 ratio. Contrariwise, the powder had low concentrations of total fat and protein combined with a low protein quality defined by the AAS. The vitamin concentrations were all under the LOQ. Places 8 and 9 were given to the Arthrospira platensis powders No. 1 and 5. The AAS, protein, and fiber content was in both powders generally high. Both powders lacked in vitamins and had a high n6/n3 ratio. Because of a higher n6/n3 ratio and high concentrations of As, the Arthrospira platensis powder No. 5 was higher ranked than No. 1, with the lowest heavy metal concentrations. Chlorella pyrenoidosa No. 2 had high amounts of total fiber, had the third highest vitamin D2 concentrations, and a low n6/n3 ratio. Because of the high concentration of As and low amounts of trace elements, Chlorella pyrenoidosa No. 2 was placed at 7. In the powder of Tetraselmis chuii the highest EPA concentrations were determined, as well as the second lowest n6/n3 ratio. High amounts of carbohydrates and α-tocopherol additionally defined the nutritional value of Tetraselmis chuii. However, the As concentrations were the 4th highest and the chlorophyll amounts the 4th lowest under all microalgae powders. Hence, the powder of Tetraselmis chuii was placed at number 6 because of the nutritionally valuable fatty acid profile. The rankings 4 to 5 were given to Chlorella pyrenoidosa No. 1 and Chlorella vulgaris No. 1. Both powders show their nutritional value throughout high amounts of fiber, vitamin D2, and a low n6/n3 ratio. Due to higher contents of minerals and the second lowest amounts of heavy metals, the nutritional value of Chlorella pyrenoidosa No. 1 was better ranked than Chlorella vulgaris No. 1. The 3rd place was given to Aphanizomenon flos-aquae because of the lowest n6/n3 ratio of all microalgae powders and its high concentrations of protein, Fe, Cu, and vitamins. The nutritional value was slightly decreased by its high amounts of C16:0. The powder of Chlorella vulgaris No. 2 was ranked 2nd place, because of the second highest AAS and vitamin D2 amounts, the highest chlorophyll concentration, 4th lowest n6/n3 ratio, and high protein and fiber contents. Chlorella pyrenoidosa No. 3 was named the best microalgae powder of all analyzed products. Although its n6/n3 ratio was slightly increased, the powder had the highest AAS and four times more vitamin D2 than the microalgae with the second highest amounts. The powder was additionally rich in protein and total fat. The powder contained overall favorable concentrations of all nutrients valuable for human nutrition.

4. Materials and Methods

4.1. Microalgae Powders

The following fifteen commercially available microalgae products of different origin were analyzed in this study: Arthrospira platensis (n = 5), Chlorella pyrenoidosa (n = 3), Chlorella vulgaris (n = 2), Dunaliella salina (n = 2), Haematococcus pluvialis (n = 1), Tetraselmis chuii (n = 1), and Aphanizomenon flos-aquae (n = 1). The microalgae products were purchased as a dried powder from different dealers. Care was taken that the packaging of all purchased powders was opaque to light and the powder was vacuum-sealed. Detailed information on the cultivation conditions, e. g., culture medium, cultivation method, and light-dark cycle, were mostly unknown. Contamination with other microalgae or microorganisms cannot be ruled out. The products were stored in darkness at 7 °C, which was mostly recommended on the label information of the acquired powders. The powders were all purchased in July 2018 and arrived within two weeks. The fifteen microalgae powders were analyzed within 14 days after arrival. The powders were additionally freeze-dried to determine the moisture content. Because the residual moisture of all 15 powders was < 1%, the moisture content was not taken into account for further calculation. For the analysis of the powders, the fresh biomass and not freeze-dried was used to prevent interference of the drying process with the nutrition profile. Aliquots of each microalgae were taken and stored at −20 °C for fatty acid analysis. Table 6 shows the given label information of all fifteen microalgae powders.

4.2. Amino Acids and Ammonium Quantification

A total of 20 mg d.w. microalgae powder was subjected to acidic hydrolysis (5 mL 6 N HCl, 48 h, 110 °C, nitrogen as protective gas). In addition, an alkaline hydrolysis (5 mL 4 M NaOH, 24 h, 110 °C, nitrogen as protective gas) was performed for the determination of tryptophan, which is unstable to acidic hydrolysis [73]. Alkaline hydrolysates were acidified with HCl to pH < 2. Acidic and acidified hydrolysates were evaporated, and the residues were equilibrated to the pH of the running program, according to the manufacturer’s instructions, with a Biochrom30+ analyzer (Biochrom, Cambridge, UK) in 5 mL loading buffer (sodium citrate pH 2.2). Norleucine was added as an internal standard. Amino acid separation by pH gradient, post-column ninhydrin derivatization, and detection was carried out by a Biochrom30+ analyzer (Biochrom, Cambridge, UK) to obtain individual amino acid and ammonium content [74]. Buffers and standards were purchased from Laborservice Onken (Gruendau, Germany).

4.3. N-Factor Calculation

For the determination of the protein concentration, an N-factor is needed. The N-factor was calculated from the amino acids and other nitrogen-containing molecules and the total organic N content according to the literature [75]. The calculation is seen as follows, with the AA Ala used as an example:
M (Anyhdro Ala) in g/mol:
M N in g mol M H 2 O in g mol
N (Amide) in %:
amount   Ammonia   in   % M N in   g / mol M Ammonia in   g / mol
N (Anhydro Ala) in %:
M Ala   in   g / mol M Anyhdro   Ala   in   g / mol N Ala   in   %
Amount (Weighted N of Ala) in %:
Amount   Ala   in   protein   in   % N Anhydro   Ala in   %   100
Amount (Anhydro Ala in dry sample) in %:
Amount   Ala   in   protein   in   %   M Anyhdro   Ala M Ala
Amount (N in Anhydro Ala in dry sample) in %:
Amount   Anhydro   Ala   in   %   Amount   Anhydro   Ala   in   dry   sample   in   % 100
kA (N-factor maximum upper limit):
sum Amount   of   Anhydro   AAs   in   dry   sample   in   %   sum Amount   of   N   in   Anhydro   AAs   in   dry   sample in   % + N   Amide   in   %
kP (N-factor maximum lower limit):
sum Amount   of   Anhydro   AAs   in   dry   sample   in   %   amount N   in   dry   sample   in   %
N-factor1 (N-factor plausible upper limit):
kA + kP 2 + kA kP 4
N-factor2 (N-factor plausible lower limit):
kA + kP 2 kA kP 4
N-factor:
N factor 1 +   N factor 2 2
Table 1 shows the variety of the amino acid profiles within and across the microalgae species, thus warranting the necessity of calculating a specific N-factor for each microalgae powder based on their amino acid profile. For calculating the N-factor, amino acids with a concentration lower than the limit of LOQ of 0.001 g/100 g were calculated as 0.001.

4.4. Quantification of Macronutrients

The N content was quantified using the Kjeldahl method to calculate the pure and crude protein contents according to DIN EN ISO 14891 2002-07. It was multiplied with a general N-factor of 6.25 and a specific N-factor calculated using the amino acid profile and calculation sheet of the National Renewable Energy Laboratory (Golden, CO, USA). The NPN content was calculated using the difference between the crude and pure protein content. The total fiber concentration was enzymatically analyzed with the BIOQUANT® Total Dietary Fiber kit (Merck, Darmstadt, Germany) [76]. The crude ash content was gravimetrically determined after incinerating the microalgae powder in a muffle furnace at 525 °C according to ASU L 06.00-4. The Soxhlet method combined with the acid hydrolysis of Weibull–Stoldt method was used to determine total fat content according to ASU L 06.00-6. The digestible carbohydrate concentration was calculated by subtracting the sum of the individual percentages of ash, total fat, total fiber, and pure protein from 100 g of microalgae biomass.

4.5. Lipid Extraction and Fatty Acid Analysis

The total fat in microalgae were extracted using a modification of the Folch/Bligh and Dyer method described by [77]. This extraction uses a methyl-tert-butyl ether instead of chloroform because of less toxicity and harmfulness for humans and the environment. After saponification with NaOCH3, the extracted lipids were methylated using BF3 as a catalyst for FAME preparation [78]. The FAME analysis of the extract was conducted via gas chromatography (GC; GC-17 V3, Shimadzu, Duisburg, Germany) equipped with an AOC-5000 auto-sampler and flame ionization detector. A fused-silica capillary column DB-225ms (30m × 0.25 mm, i.d. with 0.2 µm film thickness; J and W Scientific, Folsom, USA) with H2 as a carrier gas was used. The FAME was measured once. The GC solution software (LabSolution LC/GC release 5.92, Shimadzu, Duisburg, Germany) was used for fatty acid quantification. The FAME amounts were put in relation to the total fat content to determine the fatty acid concentration in the microalgae powders.

4.6. Quantification of Minerals, Trace Elements, and Heavy Metals

Before analyzing the identified minerals, trace elements, and heavy metals, a pressure digestion process with 10% HNO3 containing 1 µg/L rhodium in a closed microwave digestion system was applied on all microalgae samples. An inductively coupled plasma mass with a tandem spectrometry (ICP-MS/MS) system (Agilent ICP-QQQ-MS, 8800, Agilent Technologies, Waldbronn, Germany) was used for multi-element detection. A combination of oxygen and hydrogen was used as a reaction/collision gas mixture in mass-shift mode, whereas helium was used as a collision gas in on-mass mode to avoid interference. The Se isotope dilution analysis was carried out with a 10 µg/L solution of enriched 77Se and 10 µg/L naturally occurring Se in a 1:1 mixture and in two separate solutions. For guaranteed maximum sensitivity, the nebulizer gas flow as well as the parameters of lenses, Q1, collision cell, and Q2 were tuned daily (oxide ratio < 1.0% (140Ce16O+/140Ce+), doubly charged ratio < 1.5% (140Ce2+/140Ce+), background counts < 0.1 cps). An additional determination of calibration blanks and recalibration checkpoint was performed periodically every 25 samples for quality assurance.

4.7. Analysis of Vitamin Content

Microalgae samples were analyzed for vitamin D2 and D3 content using liquid chromatography–tandem mass spectrometry (LC-MS/MS) and prepared as described by [79]. Before the alkaline saponification, all samples were spiked with deuterated vitamin D2 and deuterated vitamin D3 (Sigma-Aldrich, Taufkirchen, Germany) as internal standards. Samples were extracted with n-hexane and further purified by normal-phase via high-performance liquid chromatography (HPLC) (1100 Series, Agilent Technologies). All compounds and their corresponding internal standards were identified based on specific retention times and were collected in fractions. These fractions were derivatized with 4-phenyl-1,2,4-triazolin-3,5-dione and injected into the LC-MS/MS (1200 Series, Agilent Technologies; QTRAP 5500, Sciex, Darmstadt, Germany). The conditions of the LC-MS/MS system are described by [80]. Ionization was induced by positive electrospray. Data were recorded in multiple reaction monitoring mode with the depicted ion transitions: vitamin D2 572 > 298, deuterated vitamin D2 575 > 301, vitamin D3 560 > 298, and deuterated vitamin D3 563 > 301.
The concentrations of α-, β-, γ-, and δ-tocopherol were analyzed via HPLC as described by [81]. In brief, 20 mg d.w. of microalgae was saponified with saturated sodium hydroxide and pyrogallol solution (1% in ethanol absolute) and extracted with n-hexane. The tocopherols were separated by HPLC (Agilent 1100 series, Agilent Technologies) with fluorescent detection equipped with a Zorbax Rx-SIL column (250 × 4.6 mm; particle size: 5 µm; Agilent Technologies) [82]. The LOQ for all tocopherols was 0.50 mg/100 g d.w.
Vitamin B12 was determined by TeLa (Bremerhaven, Germany) using HPLC-MS/MS and an LOQ of 0.02 mg/100 g d.w.

4.8. Total Carotenoids and Chlorophylls

The total carotenoid and chlorophyll content was determined as described by the literature [83,84]. While the total chlorophyll content, defined by chlorophyll a and b, was determined, cyanobacteria such as Arthrospira platensis and Aphanizomenon flos-aquae only possess chlorophyll a [85,86]. Dry algae biomass was disintegrated using 0.5 mL glass beads (0.75–1 mm) and extracted with ice-cold 90% acetone in a ball mill (Retsch, Haan, Germany) at 30 Hz for 20 min. After adding acetone, the mass was mixed and centrifuged, and after that, the clear supernatant was collected. Extraction was repeated until the biomass was decolorized. The extinction of combined extracts at 450, 647, 664, and 750 nm was measured by photometry (Analytik Jena, Jena, Germany). Total carotenoid and chlorophyll content was calculated as follows and described by the literature [83]:
Carotenoidstotal (mg/L) = 4.1 ∗ (E450 − E750) − 0.0535 ∗ Chla − 0.367 ∗ Chlb
Chla (mg/L) = (11.93 ∗ (E664 − E750)) − (1.93 ∗ (E647 − E750))
Chlb (mg/L) = (20.36 ∗ (E647)) − (5.5 ∗ (E664 − E750))
Total   Carotenoid / Chlorophyll   ( % ) = c mg L V mL 100 % 1000 m mg
  • Chlaa = Concentration of Chlorophyll a
  • Chlb = Concentration of Chlorophyll b
  • E = Emission
  • C = Concentration
  • V = Volume
  • m = Mass

4.9. Statistical Analysis

Data were expressed as means ± standard deviation. Statistical significance was determined by one-way ANOVA followed by post-hoc analysis (SPSS Statistics 27 Premium). Statistical analysis was performed for microalgae with two or more powders analyzed. In cases where the concentrations were under the LOQ, the value of the LOQ was used to perform statistical analysis. Differences with a p-value < 0.05 were considered significant.

5. Conclusions

The nutrient profiles of the 15 analyzed microalgae powders were characterized by a high protein, carbohydrate, and dietary fiber content. The use of a general N-factor over a specific factor calculated according to the amino acid profile revealed a slight overestimation of protein and total fiber content. The analyzed contents of nutrients showed strong deviations from the nutrients presented on the label information of each microalgae powder. The variation in the nutrient profile within the same species, but coming from different producers, and the difference to the data in the literature show the dependence of nutrient profiles on the cultivation and processing of the microalgae, presumably for the accumulation of nutrients such as carotenoids. The consumer is not getting the same nutrients of the same microalgae species when purchasing the same microalgae powder from a different producer. Further analysis of the cell structure and detection of contamination due to yeast, bacteria, or other microalgae is necessary to prove the suspicion of the analyzed powders being impure algae biomass or extracts. Thus, most of the analyzed microalgae powders, especially Aphanizomenon flos-aquae and Chlorella sp., contain various beneficial nutrients such as vitamin D, α-tocopherol, Ca, Fe, Mg, and Zn, and are rich in high-quality protein, n3-PUFAs, and dietary fiber. The nutritional value of Aphanizomenon flos-aquae, however, is reduced by its comparably high content of C16:0. In summary, microalgae are a valuable source of various nutrients and are a potential source for human nutrition.

Author Contributions

C.D., C.G., S.L., and G.I.S.: Acquisition of funding; F.S. and C.D. are responsible for the conception, analysis and evaluation of the nutrients, inclusive collection and management of the data, and writing the manuscript; A.G. and C.G.: Determination of amino acids and ammonium as well as chlorophylls and carotenoids; A.C.B. and G.I.S.: Quantification of vitamin D and tocopherols; S.L.: Supervision of fatty acid analysis by gas chromatography; S.M.M.: Determination of trace element contents via ICP-MS/MS. B.S.: Formal analysis. T.S.: Supervision. All authors have read and agreed to the published version of the manuscript.

Funding

This research was funded by the Federal Ministry of Education and Research (NovAL project, grant no. 031B0366B).

Acknowledgments

We thank Carsten Rohrer and Ute Helms for the technical assistance with the analytics of macronutrients.

Conflicts of Interest

The authors declare no conflict of interest.

References

  1. Richmond, A. Handbook of Microalgal Culture: Biotechnology and Applied Phycology; Wiley Online Library: Hoboken, NJ, USA, 2004; Volume 577. [Google Scholar]
  2. Di Lena, G.; Casini, I.; Lucarini, M.; Lombardi-Boccia, G. Carotenoid profiling of five microalgae species from large-scale production. Food Res. Int. 2019, 120, 810–818. [Google Scholar] [CrossRef]
  3. Grewe, C.; Griehl, C. Time- and media-dependent secondary carotenoid accumulation in Haematococcus pluvialis. Biotechnol. J. 2008, 3, 1232–1244. [Google Scholar] [CrossRef]
  4. Zhang, J.; Chen, F.; Sun, Z.; Sun, P.; Chen, T.; Chen, F. Microalgal carotenoids: Beneficial effects and potential in human health. Food Funct. 2014, 5, 413–425. [Google Scholar] [CrossRef]
  5. Brown, M.R.; Mular, M.; Miller, I.; Farmer, C.; Trenerry, C. The vitamin content of microalgae used in aquaculture. Environ. Biol. Fishes 1999, 11, 247–255. [Google Scholar] [CrossRef]
  6. Fabregas, J.; Herrero, C. Vitamin content of four marine microalgae. Potential use as source of vitamins in nutrition. J. Ind. Microbiol. Biotechnol. 1990, 5, 259–263. [Google Scholar] [CrossRef] [Green Version]
  7. Fábregas, J.; Herrero, C. Marine microalgae as a potential source of minerals in fish diets. Aquaculture 1986, 51, 237–243. [Google Scholar] [CrossRef] [Green Version]
  8. Breuer, G.; Evers, W.A.C.; De Vree, J.H.; Kleinegris, D.M.M.; Martens, D.E.; Wijffels, R.H.; Lamers, P.P. Analysis of Fatty Acid Content and Composition in Microalgae. J. Vis. Exp. 2013. [Google Scholar] [CrossRef] [PubMed] [Green Version]
  9. Pierre, G.; Delattre, C.; Dubessay, P.; Jubeau, S.; Vialleix, C.; Cadoret, J.-P.; Probert, I.; Michaud, P. What is in store for eps microalgae in the next decade? Molecules 2019, 24, 4296. [Google Scholar] [CrossRef] [PubMed] [Green Version]
  10. The European Commission. Commission implementing regulation (eu) 2017/2470 of 20 december 2017 establishing the union list of novel foods in accordance with regulation (eu) 2015/2283 of the european parliament and of the council on novel foods. Off. J. Eur. Union 2017, 351, 72. [Google Scholar]
  11. Ermis, H.; Guven-Gulhan, U.; Cakir, T.; Altinbas, M. Effect of iron and magnesium addition on population dynamics and high value product of microalgae grown in anaerobic liquid digestate. Sci. Rep. 2020, 10, 3510. [Google Scholar] [CrossRef] [Green Version]
  12. Loganathan, B.G.; Orsat, V.; Lefsrud, M.; Wu, B.S. A comprehensive study on the effect of light quality imparted by light-emitting diodes (LEDs) on the physiological and biochemical properties of the microalgal consortia of Chlorella variabilis and Scenedesmus obliquus cultivated in dairy wastewater. Bioprocess Biosyst. Eng. 2020, 43, 1445–1455. [Google Scholar] [CrossRef] [PubMed]
  13. Michelon, W.; Da Silva, M.L.B.; Mezzari, M.P.; Pirolli, M.; Prandini, J.M.; Soares, H.M. Effects of Nitrogen and Phosphorus on Biochemical Composition of Microalgae Polyculture Harvested from Phycoremediation of Piggery Wastewater Digestate. Appl. Biochem. Biotechnol. 2016, 178, 1407–1419. [Google Scholar] [CrossRef] [PubMed]
  14. Block, R.J.; Mitchell, H.H. Correlation of the amino acid composition of proteins with their nutritive value. Nutr. Abstr. Rev. 1946, 16, 249–278. [Google Scholar]
  15. WHO. Energy and Protein Requirements: Report of a Joint FAO/WHO/UNU Expert Consultation [Held in Rome from 5 to 17 October 1981]; World Health Organization: Geneva, Switzerland, 1985. [Google Scholar]
  16. Lourenço, S.O.; Barbarino, E.; Lavín, P.L.; Marquez, U.M.L.; Aidar, E. Distribution of intracellular nitrogen in marine microalgae: Calculation of new nitrogen-to-protein conversion factors. Eur. J. Phycol. 2004, 39, 17–32. [Google Scholar] [CrossRef]
  17. Rzymski, P.; Budzulak, J.; Niedzielski, P.; Klimaszyk, P.; Proch, J.; Kozak, L.; Poniedzialek, B. Essential and toxic elements in commercial microalgal food supplements. J. Appl. Phycol. 2019, 31, 3581. [Google Scholar] [CrossRef] [Green Version]
  18. Brown, M.R. The amino-acid and sugar composition of 16 species of microalgae used in mariculture. J. Exp. Mar. Biol. Ecol. 1991, 145, 79–99. [Google Scholar] [CrossRef]
  19. Christaki, E.; Florou-Paneri, P.; Bonos, E. Microalgae: A novel ingredient in nutrition. Int. J. Food Sci. Nutr. 2011, 62, 794–799. [Google Scholar] [CrossRef]
  20. Da Silva Gorgonio, C.M.; Aranda, D.A.G.; Couri, S. Morphological and chemical aspects of Chlorella pyrenoidosa, Dunaliella tertiolecta, Isochrysis galbana and Tetraselmis gracilis microalgae. Nat. Sci. 2013, 05, 783–791. [Google Scholar] [CrossRef] [Green Version]
  21. Seville, P.; Learoyd, T.; Li, H.-Y.; Williamson, I.; Birchall, J. Amino acid-modified spray-dried powders with enhanced aerosolisation properties for pulmonary drug delivery. Powder Technol. 2007, 178, 40–50. [Google Scholar] [CrossRef]
  22. Takagi, H.; Sakai, K.; Morida, K.; Nakamori, S. Proline accumulation by mutation or disruption of the proline oxidase gene improves resistance to freezing and desiccation stresses in saccharomyces cerevisiae. FEMS Microbiol. Lett. 2000, 184, 103–108. [Google Scholar] [CrossRef]
  23. Takagi, H. Proline as a stress protectant in yeast: Physiological functions, metabolic regulations, and biotechnological applications. Appl. Microbiol. Biotechnol. 2008, 81, 211–223. [Google Scholar] [CrossRef]
  24. Huang, T.; Jander, G. Abscisic acid-regulated protein degradation causes osmotic stress-induced accumulation of branched-chain amino acids in Arabidopsis thaliana. Planta 2017, 246, 737–747. [Google Scholar] [CrossRef] [PubMed]
  25. Lv, H.; Cui, X. Metabolic profiling of dunaliella salina shifting cultivation conditions to nitrogen deprivation. J. Postgenomics Drug Biomark. Dev. 2016, 6. [Google Scholar] [CrossRef]
  26. Molino, A.; Iovine, A.; Casella, P.; Mehariya, S.; Chianese, S.; Cerbone, A.; Rimauro, J.; Musmarra, D. Microalgae Characterization for Consolidated and New Application in Human Food, Animal Feed and Nutraceuticals. Int. J. Environ. Res. Public Health 2018, 15, 2436. [Google Scholar] [CrossRef] [PubMed] [Green Version]
  27. Schaafsma, G. The Protein Digestibility–Corrected Amino Acid Score. J. Nutr. 2000, 130, 1865S–1867S. [Google Scholar] [CrossRef] [PubMed] [Green Version]
  28. Pereira, M.I.B.; Chagas, B.M.E.; Sassi, R.; Medeiros, G.F.; Aguiar, E.M.; Borba, L.H.F.; Silva, E.P.E.; Neto, J.C.A.; Rangel, A.H.N. Mixotrophic cultivation of Spirulina platensis in dairy wastewater: Effects on the production of biomass, biochemical composition and antioxidant capacity. PLoS ONE 2019, 14, e0224294. [Google Scholar] [CrossRef] [Green Version]
  29. Wild, K.J.; Steingaß, H.; Rodehutscord, M. Variability in nutrient composition and in vitro crude protein digestibility of 16 microalgae products. J. Anim. Physiol. Anim. Nutr. 2018, 102, 1306–1319. [Google Scholar] [CrossRef] [PubMed]
  30. Afify, A.M.R.; Abd El Baky, H.H.; El Baroty, G.S.; El Baz, F.K.; Murad, S.A. Antioxidant activity of protein hydrolysates derived from blue-green algae spirulina platensis extracted with three different methods treated with enzymes. Biosci. Res. 2017, 14, 485–497. [Google Scholar]
  31. Leal, M.J.R.; Daschner, Á.; Oliag, P.T.; Marí, J.A.T. Informe del comité científico de la agencia española de seguridad alimentaria y nutrición (aesan) en relación a una solicitud de evaluación inicial para la comercialización de la microalga marina tetraselmis chuiien el marco del reglamento (ce) nº 258/97 sobre nuevos alimentos y nuevos ingredientes alimentarios. Revista del Comité Científico de la AESAN 2013, 18, 11–27. [Google Scholar]
  32. Ummalyma, S.B.; Mathew, A.K.; Pandey, A.; Sukumaran, R.K. Harvesting of microalgal biomass: Efficient method for flocculation through pH modulation. Bioresour. Technol. 2016, 213, 216–221. [Google Scholar] [CrossRef]
  33. Molino, A.; Rimauro, J.; Casella, P.; Cerbone, A.; Larocca, V.; Chianese, S.; Karatza, D.; Mehariya, S.; Ferraro, A.; Hristoforou, E.; et al. Extraction of astaxanthin from microalga Haematococcus pluvialis in red phase by using generally recognized as safe solvents and accelerated extraction. J. Biotechnol. 2018, 283, 51–61. [Google Scholar] [CrossRef] [PubMed]
  34. Muhaemin, M. Biomass nutrient profiles of marine microalgae dunaliella salina. J. Penelit. Sains 2010, 13, 64–67. [Google Scholar]
  35. Meyer, K.A.; Kushi, L.H.; Jacobs, D.R., Jr.; Slavin, J.; Sellers, T.A.; Folsom, A.R. Carbohydrates, dietary fiber, and incident type 2 diabetes in older women. Am. J. Clin. Nutr. 2000, 71, 921–930. [Google Scholar] [CrossRef] [PubMed] [Green Version]
  36. Praznik, W.; Loeppert, R.; Viernstein, H.; Haslberger, A.G.; Unger, F.M. Dietary Fiber and Prebiotics; Springer Science and Business Media LLC: Berlin/Heidelberg, Germany, 2015; pp. 891–925. [Google Scholar]
  37. Calder, P.C. Omega-3 fatty acids and inflammatory processes: From molecules to man. Biochem. Soc. Trans. 2017, 45, 1105–1115. [Google Scholar] [CrossRef] [Green Version]
  38. Dawczynski, C.; Dittrich, M.; Neumann, T.; Goetze, K.; Welzel, A.; Oelzner, P.; Völker, S.; Schaible, A.; Troisi, F.; Thomas, L.; et al. Docosahexaenoic acid in the treatment of rheumatoid arthritis: A double-blind, placebo-controlled, randomized cross-over study with microalgae vs. sunflower oil. Clin. Nutr. 2018, 37, 494–504. [Google Scholar] [CrossRef]
  39. Calder, P.C. Functional Roles of Fatty Acids and Their Effects on Human Health. J. Parenter. Enter. Nutr. 2015, 39, 18S–32S. [Google Scholar] [CrossRef] [PubMed]
  40. Robertson, R.; Guihéneuf, F.; Schmid, M.; Stengel, D.; Fitzgerald, G.; Ross, P.; Stanton, C. Algae-derived polyunsaturated fatty acids: Implications for human health. In Polyunsaturated Fatty Acids: Sources, Antioxidant Properties and Health Benefits; Nova Sciences Publishers, Inc.: Hauppauge, NY, USA, 2013. [Google Scholar]
  41. Simopoulos, A.P. The Importance of the Omega-6/Omega-3 Fatty Acid Ratio in Cardiovascular Disease and Other Chronic Diseases. Exp. Biol. Med. 2008, 233, 674–688. [Google Scholar] [CrossRef]
  42. Innes, J.K.; Calder, P.C. Omega-6 fatty acids and inflammation. Prostaglandins Leukot. Essent. Fat. Acids 2018, 132, 41–48. [Google Scholar] [CrossRef] [Green Version]
  43. Chen, H.; Qin, J.; Wei, P.; Zhang, J.; Li, Q.; Fu, L.; Li, S.; Ma, C.; Cong, B. Effects of leukotriene B4 and prostaglandin E2 on the differentiation of murine Foxp3+ T regulatory cells and Th17 cells. Prostaglandins Leukot. Essent. Fat. Acids 2009, 80, 195–200. [Google Scholar] [CrossRef]
  44. Sheibanie, A.F.; Yen, J.-H.; Khayrullina, T.; Emig, F.; Zhang, M.; Tuma, R.F.; Ganea, D. The Proinflammatory Effect of Prostaglandin E2 in Experimental Inflammatory Bowel Disease Is Mediated through the IL-23→IL-17 Axis. J. Immunol. 2007, 178, 8138–8147. [Google Scholar] [CrossRef] [Green Version]
  45. Sheibanie, A.F.; Khayrullina, T.; Safadi, F.F.; Ganea, D. Prostaglandin E2 exacerbates collagen-induced arthritis in mice through the inflammatory interleukin-23/interleukin-17 axis. Arthritis Rheum. 2007, 56, 2608–2619. [Google Scholar] [CrossRef]
  46. Crooks, S.; Stockley, R. Leukotriene B4. Int. J. Biochem. Cell Biol. 1998, 30, 173–178. [Google Scholar] [CrossRef]
  47. Ünver, N.; Çelik, Ş.; Yakar, Y. Storage stability and fatty acid composition of Sanliurfa butterfat. Mljekarstvo 2021, 71, 124–131. [Google Scholar] [CrossRef]
  48. Khaled, A.; Hessein, A.; Abdel-Halim, A.M.; Morsy, F.M. Distribution of heavy metals in seaweeds collected along Marsa-Matrouh beaches, Egyptian Mediterranean Sea. Egypt. J. Aquat. Res. 2014, 40, 363–371. [Google Scholar] [CrossRef] [Green Version]
  49. Ratnaike, R.N. Acute and chronic arsenic toxicity. Postgrad. Med. J. 2003, 79, 391–396. [Google Scholar] [CrossRef]
  50. Prüser, T.F.; Braun, P.; Wieacek, C. Mikroalgen als neuartiges lebensmittel. Ernährungs Umschau 2021, 4, M206–M213. [Google Scholar]
  51. Chen, J.; Wang, Y.; Benemann, J.R.; Zhang, X.; Hu, H.; Qin, S. Microalgal industry in China: Challenges and prospects. Environ. Biol. Fishes 2016, 28, 715–725. [Google Scholar] [CrossRef]
  52. Liu, L.; Wang, F.; Yang, J.; Li, X.; Cui, J.; Liu, J.; Shi, M.; Wang, K.; Chen, L.; Zhang, W. Nitrogen Feeding Strategies and Metabolomic Analysis To Alleviate High-Nitrogen Inhibition on Docosahexaenoic Acid Production in Crypthecodinium cohnii. J. Agric. Food Chem. 2018, 66, 10640–10650. [Google Scholar] [CrossRef] [PubMed]
  53. Saavedra, R.; Muñoz, R.; Taboada, M.E.; Vega, M.; Bolado, S. Comparative uptake study of arsenic, boron, copper, manganese and zinc from water by different green microalgae. Bioresour. Technol. 2018, 263, 49–57. [Google Scholar] [CrossRef] [PubMed] [Green Version]
  54. Zhu, C.J.; Lee, Y.K. Determination of biomass dry weight of marine microalgae. Environ. Biol. Fishes 1997, 9, 189–194. [Google Scholar] [CrossRef]
  55. Trehan, N.; Afonso, L.; Levine, D.L.; Levy, P.D. Vitamin D Deficiency, Supplementation, and Cardiovascular Health. Crit. Pathw. Cardiol. A J. Evid. Based Med. 2017, 16, 109–118. [Google Scholar] [CrossRef]
  56. Rao, D.S.; Raghuramulu, N. Food chain as origin of vitamin D in fish. Comp. Biochem. Physiol. Part A Physiol. 1996, 114, 15–19. [Google Scholar] [CrossRef]
  57. Takeuchi, A.; Okano, T.; Tanda, M.; Kobayashi, T. Possible origin of extremely high contents of vitamin-d3 in some kinds of fish liver. Comp. Biochem. Physiol. A Physiol. 1991, 100, 483–487. [Google Scholar]
  58. Safafar, H.; van Wagenen, J.; Møller, P.; Jacobsen, C. Carotenoids, phenolic compounds and tocopherols contribute to the antioxidative properties of some microalgae species grown on industrial wastewater. Mar. Drugs 2015, 13, 7339–7356. [Google Scholar] [CrossRef] [Green Version]
  59. Watanabe, F.; Takenaka, S.; Kittaka-Katsura, H.; Ebara, S.; Miyamoto, E. Characterization and Bioavailability of Vitamin B12-Compounds from Edible Algae. J. Nutr. Sci. Vitaminol. 2002, 48, 325–331. [Google Scholar] [CrossRef]
  60. Beale, S.I. Enzymes of chlorophyll biosynthesis. Photosynth. Res. 1999, 60, 43–73. [Google Scholar] [CrossRef]
  61. Kang, Y.-R.; Park, J.; Jung, S.K.; Chang, Y.H. Synthesis, characterization, and functional properties of chlorophylls, pheophytins, and Zn-pheophytins. Food Chem. 2018, 245, 943–950. [Google Scholar] [CrossRef]
  62. Morsy, E.; Abou-El-Souod, G.; Hassan, L. Comparison of different media formulations and the optimal growing conditions on growth, morphology and chlorophyll content of green alga, chlorella vulgaris. J. Am. Sci. 2016, 12, 86–95. [Google Scholar]
  63. Domínguez-Bocanegra, A.; Legarreta, I.G.; Jeronimo, F.M.; Campocosio, A.T. Influence of environmental and nutritional factors in the production of astaxanthin from Haematococcus pluvialis. Bioresour. Technol. 2004, 92, 209–214. [Google Scholar] [CrossRef] [PubMed]
  64. Richer, S.; Stiles, W.; Statkute, L.; Pulido, J.; Frankowski, J.; Rudy, D.; Pei, K.; Tsipursky, M.; Nyland, J. Double-masked, placebo-controlled, randomized trial of lutein and antioxidant supplementation in the intervention of atrophic age-related macular degeneration: The Veterans LAST study (Lutein Antioxidant Supplementation Trial). Optom. J. Am. Optom. Assoc. 2004, 75, 216–229. [Google Scholar] [CrossRef]
  65. Arab, L.; Steck, S. Lycopene and cardiovascular disease. Am. J. Clin. Nutr. 2000, 71, 1691S–1695S. [Google Scholar] [CrossRef] [Green Version]
  66. Giovannucci, E. Tomatoes, Tomato-Based Products, Lycopene, and Cancer: Review of the Epidemiologic Literature. J. Natl. Cancer Inst. 1999, 91, 317–331. [Google Scholar] [CrossRef]
  67. Giovannucci, E.; Rimm, E.B.; Liu, Y.; Stampfer, M.J.; Willett, W.C. A prospective study of tomato products, lycopene, and prostate cancer risk. J. Natl. Cancer Inst. 2002, 94, 391–398. [Google Scholar] [CrossRef] [PubMed]
  68. Kulczyński, B.; Gramza-Michałowska, A.; Kobus-Cisowska, J.; Kmiecik, D. The role of carotenoids in the prevention and treatment of cardiovascular disease—Current state of knowledge. J. Funct. Foods 2017, 38, 45–65. [Google Scholar] [CrossRef]
  69. Kim, L.; Rao, A.V.; Rao, L.G. Lycopene II—Effect on Osteoblasts: The Carotenoid Lycopene Stimulates Cell Proliferation and Alkaline Phosphatase Activity of SaOS-2 Cells. J. Med. Food 2003, 6, 79–86. [Google Scholar] [CrossRef] [PubMed]
  70. Zheng, Y.; Shi, J.; Pan, Z.; Cheng, Y.; Zhang, Y.; Li, N. Effect of heat treatment, pH, sugar concentration, and metal ion addition on green color retention in homogenized puree of Thompson seedless grape. LWT 2014, 55, 595–603. [Google Scholar] [CrossRef]
  71. Boon, C.S.; McClements, D.J.; Weiss, J.; Decker, E. Factors Influencing the Chemical Stability of Carotenoids in Foods. Crit. Rev. Food Sci. Nutr. 2010, 50, 515–532. [Google Scholar] [CrossRef] [PubMed]
  72. Koca, N.; Karadeniz, F.; Burdurlu, H.S. Effect of pH on chlorophyll degradation and colour loss in blanched green peas. Food Chem. 2007, 100, 609–615. [Google Scholar] [CrossRef]
  73. Oelshlegel, F.; Schroeder, J.; Stahmann, M. A simple procedure for basic hydrolysis of proteins and rapid determination of tryptophan using a starch column. Anal. Biochem. 1970, 34, 331–337. [Google Scholar] [CrossRef]
  74. Fountoulakis, M.; Lahm, H.-W. Hydrolysis and amino acid composition analysis of proteins. J. Chromatogr. A 1998, 826, 109–134. [Google Scholar] [CrossRef]
  75. (NREL). Nitrogen-to-Protein Factor Calculator. Available online: https://www.nrel.gov/bioenergy/assets/docs/calculation_sheet_n_factor.xls (accessed on 2 June 2020).
  76. Lee, S.C.; Prosky, L.; De Vries, J.W. Determination of Total, Soluble, and Insoluble Dietary Fiber in Foods—Enzymatic-Gravimetric Method, MES-TRIS Buffer: Collaborative Study. J. AOAC Int. 1992, 75, 395–416. [Google Scholar] [CrossRef]
  77. Matyash, V.; Liebisch, G.; Kurzchalia, T.V.; Shevchenko, A.; Schwudke, D. Lipid extraction by methyl-tert-butyl ether for high-throughput lipidomics. J. Lipid Res. 2008, 49, 1137–1146. [Google Scholar] [CrossRef] [PubMed] [Green Version]
  78. Degen, C.; Ecker, J.; Piegholdt, S.; Liebisch, G.; Schmitz, G.; Jahreis, G. Metabolic and growth inhibitory effects of conjugated fatty acids in the cell line HT-29 with special regard to the conversion of t11,t13-CLA. Biochim. Biophys. Acta BBA Mol. Cell Biol. Lipids 2011, 1811, 1070–1080. [Google Scholar] [CrossRef]
  79. Kühn, J.; Hirche, F.; Geissler, S.; Stangl, G.I. Oral intake of 7-dehydrocholesterol increases vitamin D3 concentrations in the liver and kidney. J. Steroid Biochem. Mol. Biol. 2016, 164, 199–204. [Google Scholar] [CrossRef] [PubMed]
  80. Kühn, J.; Schröter, A.; Hartmann, B.M.; Stangl, G.I. Cocoa and chocolate are sources of vitamin D2. Food Chem. 2018, 269, 318–320. [Google Scholar] [CrossRef] [PubMed]
  81. Klocker, H.; Hååg, P.; Eder, I.E.; Bartsch, G. Targeting the androgen receptor in hormone-refractory prostate cancer? new concepts. Futur. Oncol. 2005, 1, 93–101. [Google Scholar] [CrossRef]
  82. Baur, A.C.; Brandsch, C.; König, B.; Hirche, F.; Stangl, G.I. Plant Oils as Potential Sources of Vitamin D. Front. Nutr. 2016, 3, 29. [Google Scholar] [CrossRef] [Green Version]
  83. Rowan, K.S. Photosynthetic Pigments of Algae/Kingsley s. Rowan; Cambridge University Press: Cambridge, UK; New York, NY, USA, 1989. [Google Scholar]
  84. Jeffrey, S.T.; Humphrey, G.F. New spectrophotometric equations for determining chlorophylls a, b, c1 and c2 in higher plants, algae and natural phytoplankton. Biochem. Physiol. Pflanz. 1975, 167, 191–194. [Google Scholar] [CrossRef]
  85. Danesi, E.; Rangel-Yagui, C.; Carvalho, J.; Sato, S. Effect of reducing the light intensity on the growth and production of chlorophyll by Spirulina platensis. Biomass Bioenergy 2004, 26, 329–335. [Google Scholar] [CrossRef]
  86. De Nobel, W.T.; Matthijs, H.C.P.; Von Elert, E.; Mur, L.R. Comparison of the light-limited growth of the nitrogen-fixing cyanobacteria Anabaena and Aphanizomenon. New Phytol. 1998, 138, 579–587. [Google Scholar] [CrossRef]
Figure 1. Concentrations of total carotenoids and total chlorophyll in fifteen microalgae in g/100 g d.w. a, b, and c denote significant (p < 0.05) differences in chlorophyll concentrations between species. There are no significant differences between the total carotenoid contents of the four species (n = 3; AFA, Aphanizomenon flos-aquae; AP, Arthrospira platensis; CP, Chlorella pyrenoidosa; CV, Chlorella vulgaris; DS, Dunaliella salina; HP, Haematococcus pluvialis; TC, Tetraselmis chuii).
Marinedrugs 19 00310 g001
Table 1. Amino acid profiles and ammonium contents of 15 microalgae powders in g/100 g d.w. with their calculated protein quality and N-factor.
AP CP CV DS TCAFAHP
123451231212111
Ala3.70 ± 0.343.65 ± 0.223.87 ± 0.103.39 ± 0.133.77 ± 0.23a3.88 ± 0.103.440 ± 0.0013.82 ± 0.11a3.81 ± 0.243.59 ± 0.19a0.009 ± 0.009<LOQb0.72 ± 0.103.66 ± 0.270.300 ± 0.001
Arg3.24 ± 0.353.29 ± 0.223.45 ± 0.083.21 ± 0.123.27 ± 0.21a2.99 ± 0.062.58 ± 0.012.87 ± 0.09b2.95 ± 0.192.69 ± 0.15b<LOQ<LOQb0.52 ± 0.072.52 ± 0.190.320 ± 0.003
Asp4.67 ± 0.444.70 ± 0.294.90 ± 0.134.38 ± 0.194.70 ± 0.33a4.16 ± 0.093.76 ± 0.034.23 ± 0.15b4.06 ± 0.253.94 ± 0.21b0.010 ± 0.009<LOQc0.89 ± 0.134.41 ± 0.300.450 ± 0.003
Cys0.06 ± 0.010.037 ± 0.0020.071 ± 0.0040.037 ± 0.0030.030 ± 0.003a0.0486 ± 0.00040.023 ± 0.0010.037 ± 0.004a0.046 ± 0.0020.035 ± 0.003a<LOQ<LOQb0.013 ± 0.0020.016 ± 0.002<LOQ
Glu5.48 ± 0.425.40 ± 0.325.52 ± 0.165.08 ± 0.255.44 ± 0.33a4.96 ± 0.174.46 ± 0.014.80 ± 0.11b4.78 ± 0.294.49 ± 0.23b0.027 ± 0.0080.014 ± 0.001c1.22 ± 0.175.21 ± 0.360.84 ± 0.02
Gly2.44 ± 0.232.41 ± 0.142.55 ± 0.072.22 ± 0.072.49 ± 0.12a2.66 ± 0.062.25 ± 0.012.63 ± 0.07a2.55 ± 0.172.48 ± 0.14a0.010 ± 0.0030.004 ± 0.004b0.58 ± 0.082.23 ± 0.180.260 ± 0.004
His0.81 ± 0.080.80 ± 0.050.81 ± 0.020.66 ± 0.030.79 ± 0.04a0.98 ± 0.010.84 ± 0.010.91 ± 0.03a0.94 ± 0.060.85 ± 0.05a0.011 ± 0.019<LOQb0.15 ± 0.020.76 ± 0.070.091 ± 0.004
Ile2.34 ± 0.242.32 ± 0.162.43 ± 0.032.09 ± 0.042.36 ± 0.13a1.59 ± 0.031.336 ± 0.0031.49 ± 0.02b1.46 ± 0.101.39 ± 0.08b0.004 ± 0.007<LOQc0.40 ± 0.062.13 ± 0.180.21 ± 0.03
Leu4.00 ± 0.393.98 ± 0.254.16 ± 0.103.63 ± 0.144.04 ± 0.26a3.82 ± 0.083.38 ± 0.023.74 ± 0.11a3.70 ± 0.253.51 ± 0.19a0.027 ± 0.0130.020 ± 0.019b0.84 ± 0.123.72 ± 0.270.44 ± 0.02
Lys2.23 ± 0.242.26 ± 0.142.35 ± 0.072.07 ± 0.092.30 ± 0.16a3.81 ± 0.082.17 ± 0.013.40 ± 0.11a3.72 ± 0.233.08 ± 0.17a<LOQ<LOQb0.47 ± 0.052.42 ± 0.180.12 ± 0.01
Met1.09 ± 0.210.82 ± 0.080.80 ± 0.040.65 ± 0.130.89 ± 0.14a0.73 ± 0.060.41 ± 0.070.86 ± 0.01a0.77 ± 0.110.81 ± 0.03a<LOQ<LOQb0.04 ± 0.070.43 ± 0.010.01 ± 0.02
Phe2.16 ± 0.222.16 ± 0.142.22 ± 0.051.90 ± 0.072.16 ± 0.14a2.24 ± 0.041.97 ± 0.012.20 ± 0.06a2.17 ± 0.142.07 ± 0.12a0.006 ± 0.010<LOQb0.57 ± 0.081.96 ± 0.180.270 ± 0.004
Pro2.00 ± 0.172.06 ± 0.112.10 ± 0.071.81 ± 0.052.02 ± 0.12a2.57 ± 0.181.960 ± 0.0032.41 ± 0.07a2.52 ± 0.062.30 ± 0.07a<LOQ<LOQb0.59 ± 0.111.71 ± 0.080.220 ± 0.005
Ser2.75 ± 0.282.76 ± 0.172.92 ± 0.072.49 ± 0.102.80 ± 0.19a2.08 ± 0.051.89 ± 0.012.15 ± 0.07b2.07 ± 0.132.01 ± 0.11b<LOQ<LOQb0.49 ± 0.072.55 ± 0.160.280 ± 0.006
Thr2.38 ± 0.252.40 ± 0.162.50 ± 0.062.12 ± 0.092.43 ± 0.17a2.08 ± 0.051.73 ± 0.012.17 ± 0.07a2.01 ± 0.132.05 ± 0.12a<LOQ<LOQb0.49 ± 0.072.58 ± 0.180.190 ± 0.002
Trp0.51 ± 0.030.37 ± 0.040.42 ± 0.160.55 ± 0.260.41 ± 0.04a0.37 ± 0.030.31 ± 0.070.42 ± 0.05a0.33 ± 0.040.38 ± 0.05a0.028 ± 0.008<LOQb0.08 ± 0.020.39 ± 0.040.06 ± 0.02
Tyr2.40 ± 0.272.38 ± 0.162.50 ± 0.052.18 ± 0.092.41 ± 0.16a2.52 ± 0.073.54 ± 0.012.54 ± 0.09a2.53 ± 0.162.27 ± 0.13a0.011 ± 0.019<LOQb0.37 ± 0.052.43 ± 0.180.46 ± 0.02
Val2.43 ± 0.222.41 ± 0.162.55 ± 0.052.25 ± 0.052.48 ± 0.14a2.39 ± 0.052.10 ± 0.012.30 ± 0.05a2.23 ± 0.152.16 ± 0.13a0.024 ± 0.0040.019 ± 0.003b0.55 ± 0.082.28 ± 0.190.31 ± 0.02
Tau0.045 ± 0.0040.034 ± 0.0040.033 ± 0.0030.078 ± 0.0020.0295 ± 0.0005a0.05 ± 0.010.043 ± 0.0010.045 ± 0.001a0.051 ± 0.0030.035 ± 0.003a0.306 ± 0.0370.313 ± 0.017b0.18 ± 0.030.035 ± 0.0050.301 ± 0.008
MetS0.16 ± 0.090.31 ± 0.050.36 ± 0.040.34 ± 0.150.27 ± 0.14a0.23 ± 0.050.45 ± 0.050.13 ± 0.03a0.22 ± 0.060.14 ± 0.01a<LOQ<LOQb0.10 ± 0.060.33 ± 0.050.094 ± 0.003
(Cys)20.43 ± 0.040.42 ± 0.020.42 ± 0.010.39 ± 0.020.427 ± 0.004a0.40 ± 0.020.40 ± 0.010.451 ± 0.001a0.44 ± 0.030.43 ± 0.02a0.047 ± 0.0040.053 ± 0.003b0.10 ± 0.020.29 ± 0.030.110 ± 0.001
GABA0.059 ± 0.0020.062 ± 0.0010.059 ± 0.0020.05 ± 0.010.054 ± 0.003a0.08 ± 0.010.083 ± 0.0030.071 ± 0.001a0.09 ± 0.010.063 ± 0.003a<LOQ0.003 ± 0.005b0.014 ± 0.0020.02 ± 0.030.021 ± 0.001
Orn0.027 ± 0.0050.021 ± 0.0050.022 ± 0.0020.021 ± 0.0020.023 ± 0.001a0.025 ± 0.0010.040 ± 0.0020.036 ± 0.01a0.026 ± 0.0010.026 ± 0.001a<LOQ<LOQa<LOQ0.50 ± 0.040.028 ± 0.001
NH4+0.76 ± 0.100.71 ± 0.050.75 ± 0.010.66 ± 0.020.76 ± 0.03a0.92 ± 0.020.95 ± 0.010.80 ± 0.01b0.80 ± 0.050.79 ± 0.05b0.034 ± 0.0110.033 ± 0.002c0.14 ± 0.010.86 ± 0.070.174 ± 0.008
Evaluation of protein quality
NEA23.50 ± 0.8523.40 ± 0.5724.44 ± 0.2621.58 ± 0.3723.67 ± 0.69a22.87 ± 0.3021.33 ± 0.0422.61 ± 0.26a22.36 ± 0.5321.13 ± 0.43a0.089 ± 0.0240.024 ± 0.004b4.87 ± 0.2822.21 ± 0.622.80 ± 0.03
SEA4.05 ± 0.354.09 ± 0.224.26 ± 0.083.87 ± 0.124.06 ± 0.22a3.97 ± 0.063.42 ± 0.023.78 ± 0.10a3.89 ± 0.203.54 ± 0.16a0.012 ± 0.0190.002 ± 0.001b0.67 ± 0.083.28 ± 0.200.41 ± 0.01
EAA17.14 ± 0.6916.72 ± 0.4317.43 ± 0.2215.25 ± 0.3617.08 ± 0.44a17.03 ± 0.1613.40 ± 0.1016.59 ± 0.19a16.39 ± 0.4515.45 ± 0.34a0.103 ± 0.0200.045 ± 0.019b3.45 ± 0.2115.92 ± 0.491.61 ± 0.05
AAS (%)100 ± 1.594 ± 0.7494 ± 0.2271 ± 0.3794 ± 0.76a82 ± 0.359 ± 0.2100 ± 0.3a88 ± 0.994 ± 0.6a6 ± 3.113 ± 0.02b29 ± 1.459 ± 1.118 ± 0.8
N-factor4.874.724.764.754.62a4.634.674.73a4.674.54a0.710.42b4.904.634.85
AAS, amino acid score; AFA, Aphanizomenon flos-aquae; Ala, alanine; AP, Arthrospira platensis; Arg, arginine; Asp, aspartic acid; CP, Chlorella pyrenoidosa; CV, Chlorella vulgaris; Cys, cysteine; DS, Dunaliella salina; EAA, essential amino acids; GABA, γ-aminobutyric acid; Glu, glutamic acid; Gly, glycine; His, histidine; HP, Haematococcus pluvialis; Ile, isoleucine; Leu, leucine; LOQ, limit of quantification; Met, methionine; MetS, S-adenosylmethionine; NEA, nonessential amino acids; Orn, ornithine; Phe, phenylalanine; Pro, proline; SEA, semi-essential amino acids; Ser, serine; Tau, taurine; TC, Tetraselmis chuii; Thr, threonine; Trp, tryptophan; Tyr, Tyrosine; Val, valine; ◊ different letters indicate significant differences between the microalgae species (p < 0.05; n > 1); LOQ < 0.001; values are expressed as means ± SD (n = 3).
Table 2. Contents of nitrogenous compounds and main nutrients in 15 microalgae powders in (g/100 g d.w.).
AP CP CV DS TCAFAHP
123451231212111
Protein
Nitrogen (Kjeldahl)9.25 ± 0.0510.33 ± 0.0710.0 ± 0.210.4 ± 0.18.8 ± 0.4a9.12 ± 0.078.5 ± 0.19.83 ± 0.08a9.6 ± 0.29.6 ± 0.1a1.5 ± 0.21.0 ± 0.8b1.94 ± 0.069.3 ± 0.21.04 ± 0.04
Crude protein
(N-factor 6.25)
57.8 ± 0.364.5 ± 0.562.7 ± 1.265.2 ± 0.755.1 ± 2.2a57.0 ± 0.453.0 ± 0.661.4 ± 0.5a60.0 ± 1.260.1 ± 0.4a0.9 ± 0.10.6 ± 0.5b12.1 ± 0.458.4 ± 1.56.5 ± 0.3
Crude protein
(N-factor 4.78)
44.2 ± 0.249.3 ± 0.448.0 ± 1.049.9 ± 0.642.2 ± 1.7a43.6 ± 0.340.6 ± 0.547.0 ± 0.4a45.9 ± 1.046.0 ± 0.6a0.7 ± 0.10.5 ± 0.4b9.3 ± 0.344.6 ± 1.15.0 ± 0.2
Crude protein (specific N-factor)45.1 ± 0.348.7 ± 0.447.8 ± 1.249.6 ± 0.740.8 ± 2.0a42.4 ± 0.439.6 ± 0.646.5 ± 0.5a44.8 ± 1.143.7 ± 0.7a0.21 ± 0.010.24 ± 0.03b9.5 ± 0.443.2 ± 1.45.1 ± 0.3
Pure protein
(specific
N-factor)
38.3 ± 1.639.7 ± 0.239.9 ± 0.443.4 ± 1.737.8 ± 0.7a40.7 ± 0.534.0 ± 0.141.9 ± 0.3a41.0 ± 0.539.2 ± 0.3a0.12 ± 0.20.10 ± 0.1b9.1 ± 0.133.0 ± 1.43.3 ± 0.5
NPN1.4 ± 0.31.90 ± 0.094.7 ± 0.25.6 ± 0.34.2 ± 0.1a0.3 ± 0.11.2 ± 0.11.0 ± 0.1a0.8 ± 0.21.0 ± 0.1a0.09 ± 0.200.14 ± 0.10a0.08 ± 0.062.2 ± 0.40.4 ± 0.1
Further macronutrients
Total fiber30.9 ± 3.513.0 ± 1.110.9 ± 1.413.2 ± 1.538.7 ± 1.5a36.6 ± 2.621.9 ± 0.218.6 ± 1.7a29.8 ± 1.421.9 ± 1.1a6.3 ± 0.16.8 ± 0.1a9.2 ± 0.319.1 ± 2.215.8 ± 0.5
Total fat4.32 ± 0.034.8 ± 0.24.7 ± 0.25.6 ± 0.34.2 ± 0.1a8.1 ± 0.57.7 ± 0.38.6 ± 0.2b8.4 ± 0.28.7 ± 0.2b3.0 ± 0.13.05 ± 0.05c8.0 ± 0.14.4 ± 0.12.1 ± 0.1
Carbohydrates15.4 ± 3.934.9 ± 1.136.9 ± 1.431.2 ± 2.313.6 ± 1.6a8.8 ± 2.728.6 ± 0.425.1 ± 1.8a15.9 ± 1.524.9 ± 1.2a86.6 ± 0.285.8 ± 0.2b55.9 ± 0.436.6 ± 2.677.9 ± 0.8
Further main components
Ash11.0 ± 0.27.6 ± 0.17.62 ± 0.036.59 ± 0.035.77 ± 0.01a5.83 ± 0.027.8 ± 0.045.70 ± 0.02a4.90 ± 0.035.329 ± 0.001a3.985 ± 0.0034.24 ± 0.05a17.74 ± 0.046.9 ± 0.10.91 ± 0.03
AFA, Aphanizomenon flos-aquae; AP, Arthrospira platensis; CP, Chlorella pyrenoidosa; CV, Chlorella vulgaris; DS, Dunaliella salina; HP, Haematococcus pluvialis; NPN, non-protein-nitrogen; TC, Tetraselmis chuii; ◊ different letters indicate significant differences between the microalgae species (p < 0.05; n > 1); values are expressed as means ± SD (n = 3).
Table 3. Fatty acid composition in mg/100 g d.w. of 15 microalgae powders.
Fatty AcidsAP CP CV DS TCAFAHP
123451231212111
SFAs
C12:04.116.690.463.124.46a1.591.081.56a1.422.36a8.737.65b2.494.400.49
C14:065.615.76.9714.524.2a25.321.325.6a21.023.4a15.815.6a22.92755.95
C16:012781895207617901809a85714671195ab813942b776802b14861662177
C18:043597.044.8249388ab28853.1855ab273160a453486b40.675.537.6
C20:06.552.872.104.697.59a6.182.5025.0a5.467.36a7.719.43a2.931.511.67
C22:02.090.65<LOQ0.732.44a1.503.5613.9ab1.535.57a8.7312.9b<LOQ<LOQ0.65
C24:09.57<LOQ<LOQ1.084.42ab6.6114.035.7a5.626.59a2.544.96b2.03<LOQ1.28
MUFAs
C14:1n50.960.180.410.530.59a0.591.09<LOQa<LOQ0.80a<LOQ<LOQa<LOQ17.40.28
C16:1n7146146152110129a45.433.331.5b40.3115ab1.862.68c42.512229.5
C17:1n73.901.207.991.964.71a14.935.39.85b18.27.01ab0.510.55c2.977.563.36
C18:1n9134190115136175a137.75473430ab158179a777797b184413637.8
C18:1n731.520.816.023.6<LOQac47.590.826.9ab50.592.1b13.914.3c17322.724.7
C20:1n98.07<LOQ<LOQ0.864.13a3.0614.068.86a3.882.79a3.643.94a1650.760.63
C22:1n95.221.49<LOQ<LOQ1.81a<LOQ<LOQ<LOQa<LOQ<LOQa<LOQ<LOQa<LOQ<LOQ<LOQ
n6—PUFAs
C18:2n663513929428961489a259219712184b31432196b895739a482217512
C18:3n6699628781489915a1.8518.3<LOQb<LOQ2.53b0.670.30b44.6<LOQ8.33
C20:2n612.86.594.135.1715.2a9.173.125.85a9.125.70a0.17<LOQb4.200.781.22
C20:3n659.512.05.996.4520.4a<LOQ<LOQ<LOQb<LOQ<LOQb<LOQ<LOQb3.50<LOQ<LOQ
C20:4n637.56.081.983.0019.2a<LOQ<LOQ<LOQb<LOQ1.19b<LOQ<LOQb44.42.450.29
C22:5n62.460.43<LOQ0.746.51a<LOQ<LOQ1.61a<LOQ<LOQa<LOQ<LOQa<LOQ<LOQ<LOQ
n-3 PUFAs
C18:3n32.231.544.613.284.02a124786835.5b6241299b1.281.40a972880326
C20:5n32.520.604.311.409.30a7.148.853.55a5.954.61a4.396.94a4066.741.12
C22:6n30.54<LOQ0.47<LOQ2.54a<LOQ<LOQ<LOQa<LOQ<LOQa<LOQ<LOQa<LOQ<LOQ<LOQ
Sum
SFAs18012018213020632240a118615632152a11211147a12731339a15572018225
MUFAs330360292273315a2497213507ab271397a797819b222830696.2
PUFAs14512047174414052482a385728692230ab37823510b901748c19561107849
Others739305624409544a33272557191ab35163326b79.194.5c2300960880
n614452045173514002466a260319922191a31522206a895740b578220522
n35.292.149.394.6915.9a125487739.1b6301304b5.678.34a1378887327
n6/n3273956185299155a2.082.2756.1b5.011.69b15888.7a0.420.251.59
AFA, Aphanizomenon flos-aquae; AP, Arthrospira platensis; CP, Chlorella pyrenoidosa; CV, Chlorella vulgaris; DS, Dunaliella salina; HP, Haematococcus pluvialis; LOQ, limit of quantification; MUFAs, monounsaturated fatty acids; PUFAs, polyunsaturated fatty acids; SFAs, saturated fatty acids; TC, Tetraselmis chuii; LOQ < 0.1 mg/100 g d.w.; ◊ different letters indicate significant differences between the microalgae species (p < 0.05; n > 1).
Table 4. Concentrations of minerals, trace elements, and heavy metals in 14 microalgae powders.
AP CP CV DSTCAFAHPLOQ
12345123121111
Minerals
Camg/100 g4.54 ± 0.4112.5 ± 0.64227 ± 128809.1 ± 31.2149.1 ± 1.1a538.6 ± 25.4101.6 ± 1.3148.2 ± 4.6a87.1 ± 1.3112.2 ± 0.7a75.7 ± 2.0184.8 ± 6.2183.5 ± 8.8157.2 ± 5.00.11
Mgmg/100 g4.05 ± 0.0522.4 ± 1.2267.8 ± 10.7228.5 ± 10.62304 ± 10a815.1 ± 35.0235.6 ± 3.46282.4 ± 2.5b286.8 ± 1.4276.3 ± 2.6b267.2 ± 1.57304.6 ± 15.4294.8 ± 13.6368.1 ± 13.20.48
Trace elements
Femg/100 g1.16 ± 0.014.96 ± 0.086.97 ± 0.1049.2 ± 1.483.5 ± 1.5a20.7 ± 0.848.1 ± 0.921.98 ± 0.04a54.0 ± 0.753.1 ± 1.2a52.7 ± 1.151.8 ± 1.9110.4 ± 2.597.2 ± 3.70.07
Mnµg/100 g<LOQ<LOQ3.89 ± 0.11<LOQ5.14 ± 0.15a9.13 ± 0.52<LOQ<LOQa<LOQ<LOQa<LOQ5.28 ± 0.255.67 ± 0.285.25 ± 0.193.23
Niµg/100 g8.04 ± 1.9216.6 ± 0.547.5 ± 1.572.9 ± 12.141.43 ± 0.07a61.2 ± 1.771.3 ± 3.275.4 ± 0.6b90.2 ± 1.671.5 ± 1.7b111.0 ± 7.813.23 ± 0.7820.3 ± 2.632.5 ± 1.92.45
Cuµg/100 g11.0 ± 0.3188.4 ± 4.6575.4 ± 0.4489.4 ± 3.8300.0 ± 8.3a623.0 ± 13.456.6 ± 0.279.9 ± 1.3a65.3 ± 14.176.7 ± 5.1a182.7 ± 0.2521.4 ± 3.8499.4 ± 2.6274.7 ± 18.35.83
Znµg/100 g<LOQ11943 ± 1662404 ± 10351.5 ± 82.62144 ± 75a1211 ± 120607.6 ± 4.31790 ± 14a1032 ± 38758.0 ± 63a2106 ± 212073 ± 991938 ± 31610 ± 5439.85
Moµg/100 g3.06 ± 0.0236.9 ± 0.966.3 ± 2.0558.8 ± 1.226.2 ± 0.9a34.8 ± 0.114.4 ± 0.111.08 ± 0.07a13.07 ± 0.2811.8 ± 0.7a16.30 ± 0.0250.9 ± 0.147.09 ± 0.527.7 ± 1.30.14
Seµg/100 g<LOQ2.34 ± 0.090.30 ± 0.146.40 ± 0.047.74 ± 0.22a<LOQ7.02 ± 0.6513.2 ± 2.6a8.90 ± 0.478.17 ± 0.15a9.52 ± 0.44<LOQ<LOQ6.15 ± 1.310.20
Iµg/100 g273.9 ± 204.7252.2 ± 319.7431.4 ± 75.3195.4 ± 214.9372.8 ± 58.4a238.5 ± 140.9308.1 ± 32.9280.1 ± 210.8a211.9 ± 144.3207.7 ± 107.1a213.9 ± 149.8245.9 ± 288.4173.3 ± 230.7555.2 ± 129.00.05
Heavy metals
Asµg/100 g0.89 ± 0.1410.8 ± 0.249.4 ± 0.7799.2 ± 14.847.0 ± 1.6a5.1 ± 0.170.0 ± 0.719.4 ± 0.2a40.5 ± 2.327.9 ± 0.3a213.7 ± 3.755.1 ± 0.560.37 ± 0.0545.2 ± 1.30.03
Cdµg/100 g0.54 ± 0.269.61 ± 1.562.27 ± 1.911.96 ± 0.011.72 ± 0.50a0.46 ± 0.071.18 ± 0.261.64 ± 0.20a0.97 ± 0.021.66 ± 0.30a2.69 ± 0.840.59 ± 0.160.58 ± 0.301.48 ± 0.010.20
Hgµg/100 g0.58 ± 0.070.76 ± 0.160.25 ± 0.074.91 ± 1.023.96 ± 0.11a0.377 ± 0.0010.59 ± 0.370.428 ± 0.001a0.55 ± 0.040.68 ± 0.07a1.51 ± 0.430.40 ± 0.140.3835 ± 0.00013.33 ± 0.640.2
Pbµg/100 g10.9 ± 7.726.8 ± 8.7122.7 ± 16.064.25 ± 5.3116.48 ± 10.3a4.16 ± 5.1732.0 ± 10.731.1 ± 11.4a8.92 ± 9.2030.2 ± 11.7a36.7 ± 18.75.90 ± 7.644.98 ± 6.3311.2 ± 9.50.5
AFA, Aphanizomenon flos-aquae; AP, Arthrospira platensis; CP, Chlorella pyrenoidosa; CV, Chlorella vulgaris; DS, Dunaliella salina; HP, Haematococcus pluvialis; TC, Tetraselmis chuii; LOQ, limit of quantification; ◊ different letters indicate significant differences between the microalgae species (p < 0.05; n > 1); values are expressed as means ± SD (n = 2).
Table 5. Concentration of studied vitamins and precursors in 15 microalgae powders.
AP CP CV DS TCAFAHP
123451231212111
Vitamin D
Vitamin D2 *µg/100 g<LOQ<LOQ<LOQ<LOQ<LOQa37.3 ± 2.968.7 ± 1.7420.6 ± 1.7b55.4 ± 3.5110.3 ± 7.7b<LOQ<LOQa<LOQ<LOQ<LOQ
Vitamin D3 oµg/100 g<LOQ<LOQ<LOQ<LOQ<LOQa<LOQ<LOQ1.25 ± 0.03a<LOQ0.639 ± 0.007a<LOQ<LOQa<LOQ0.96 ± 0.07<LOQ
Tocopherols
α-tocopherol #mg/100 g1.20 ± 0.14<LOQ<LOQ<LOQ0.85 ± 0.40a3.62 ± 0.343.94 ± 0.554.78 ± 0.37b3.85 ± 0.234.50 ± 0.51b46.90 ± 1.9637.47 ± 1.41c9.49 ± 0.071.98 ± 0.44<LOQ
δ-tocopherol #mg/100 g<LOQ<LOQ<LOQ<LOQ<LOQa<LOQ<LOQ<LOQa<LOQ<LOQa<LOQ<LOQa<LOQ1.90 ± 0.50<LOQ
AFA, Aphanizomenon flos-aquae; AP, Arthrospira platensis; CP, Chlorella pyrenoidosa; CV, Chlorella vulgaris; DS, Dunaliella salina; HP, Haematococcus pluvialis; TC, Tetraselmis chuii; LOQ, limit of quantification; *, LOQ = 0.013 µg/100 g d.w.; o, LOQ = 0.4 µg/100 g d.w.; #, LOQ = 0.5 mg/ 100 g d.w.; ◊ different letters indicate significant differences between the microalgae species (p < 0.05; n > 1); values are expressed as means ± SD (n = 2).
Table 6. Label information of commercially acquired microalgae.
APCPCVDSTCAFAHP
123451231212
Energy (kJ)14631306162615531782/1221/16931448893/1421//
Protein6056.662.860.4060/60.70/5561.37.4/38//
Fat total8.24.106.44.108.2/4.70/107.87/7.5//
PUFAs/1.4/1.10//2.20//2.2//4.1//
MUFAs/1.5/0.36//1.10//2.5//1.2//
SFAs1.11.3/1.411.1/1.40/03.13/2.2//
Carbohydrates15.111.318.920.4227/60.70/236.929.7/31//
Sugar/3.7/3.8827///01.65/0//
Fiber716.4/3.5013/13.00/016.1<1////
Salt/<0.1/2.123.7///0<0.1//4.2//
VitaminsB1: 4.4 mg
B2: 6.9 mg
B3: 5.9 mg
B6: 18.4 mg
B12: 0.16 mg
C: 1.4 mg
D: 24 IU
K: 1.3 mg
/A: 68 mg
C: 17 mg
A: 0.6 mg
B6: 0.3 mg
B12: 0.05 mg
C: 5.1 mg
K: 3.1 mg
B12: 350 µg//B12:
100 µg
Total vitamins: 60 µg//////
Minerals and trace elementsCa: 270 mg
Mg: 270 mg
Fe: 82.7 mg
K: 1040 mg
Zn: 3.3 mg
Na: 700 mg
/Fe:
87 mg
Mg: 920 mg
Mn: 4.6 mg
Fe: 87 mg
P: 102 mg
Zn: 10.1 mg
K: 1104 mg
Cl: 112 mg
F: 0.9 mg
Cu: 1.84 mg
I: 0.46 mg
Fe: 48 mg
Ca: 130 mg
///Fe: 102 mg//////
Additional informationFolic acid:
27 µg
Chlorophyll: 1179 mg
Carotenoids: 451 mg
/////Chlorophyll:
2.88 g
/////Ash: 15 g//
Origin/ChinaChinaChina///Germany/ChinaChinaChinaSpain//
Expiration date10/202004/202107/201904/202005/201905/202004/202004/201907/202011/202006/202012/201904/202003/202001/2020
Daily reference intake<5 g3 Tea-spoons3 g5 g5 g4 g5 g3 g4.5 g3 Tea-spoons2 g1 Tea-spoon0.25 g2 g0.012 g
AFA, Aphanizomenon flos-aquae; AP, Arthrospira platensis; CP, Chlorella pyrenoidosa; CV, Chlorella Vulgaris; DS, Dunaliella salina; HP, Haematococcus Pluvialis; TC, Tetraselmis chuii.
Table 7. Ranking of all 15 analyzed microalgae powders.
RankingNamePositiv CharacteristicsNegative Characteristics
1.Chlorella pyrenoidosa No.3↑↑AAS, ↑↑ protein, ↑↑ total fat, ↑↑↑ vitamin D2 + D3↑ n6/n3 ratio
2.Chlorella vulgaris No.2↑↑↑ AAS, ↑↑ fiber, ↑↑ protein,
↑↑↑ chlorophyll, ↑↑↑ vitamin D2, ↓↓↓ n6/n3 ratio
3.Aphanizomenon flos-aquae↑↑ protein, ↑↑ Fe + Cu, ↑↑ vitamin D3 + δ-tocopherol, ↓↓↓ n6/n3 ratio↑↑↑ C16:0
4.Chlorella pyrenoidosa No.1↑↑ AAS, ↑↑↑ fiber, ↑↑ minerals + Cu, ↓↓↓ heavy metals,
↑↑ vitamin D2, ↓↓ n6/n3 ratio
5.Chlorella vulgaris No.1↑↑ AAS, ↑↑ protein, ↑↑↑ fiber,
↑↑↑ chlorophyll, ↑↑ vitamin D2,
↓↓ n6/n3 ratio
6.Tetraselmis chuii↑↑↑ carbohydrates,
↑↑ α-tocopherol, ↑↑ EPA,
↓↓↓ n6/n3 ratio
↑↑ As, ↓↓ chlorophylls
7.Chlorella pyrenoidosa No.2↑↑↑ fiber, ↑↑ vitamin D2, ↓↓ n6/n3 ratio↓↓ trace elements, ↑↑ As
8.Arthrospira platensis No.1↑↑↑ AAS, ↑↑ protein, ↑↑ fiber,
↓↓↓ heavy metals
↓↓ minerals + trace elements, ↓↓↓ vitamins, ↑ n6/n3 ratio
9.Arthrospira platensis No.5↑↑ AAS, ↑↑ protein, ↑↑↑ fiber,
↑ Mg, Cu, Zn
↑ As, ↓↓↓ vitamins,
↑↑ n6/n3 ratio
10.Haematococcus pluvialis↑↑↑ carbohydrates,
↑↑↑ carotenoids, ↑↑ minerals,
↓↓ n6/n3 ratio
↓↓ total fat + protein,
↓↓ AAS, ↓↓↓ vitamins
11.Arthrospira platensis No.3↑↑↑ protein, ↑↑↑ minerals + Zn↑↑↑ C16:0, ↑↑ n6/n3 ratio,
↓↓↓ vitamins
12.Arthrospira platensis No.2↑↑↑ protein, ↑↑↑ Zn↑↑↑ C16:0, ↑↑ n6/n3 ratio,
↓↓↓ vitamins
13.Arthrospira platensis No.4↑↑↑ protein, ↑↑↑ Mo + Ca↑↑↑ C16:0, ↑↑ n6/n3 ratio,
↑↑↑ As, ↓↓↓ vitamins
14.Dunaliella salina No.2↑↑↑ carbohydrates, ↑↑ Zn,
↑↑ α-tocopherol
↓↓↓ macronutrients,
↓↓↓ AAS, ↑ n6/n3 ratio
15.Dunaliella salina No.1↑↑↑ carbohydrates, ↑↑ Zn,
↑↑↑ α-tocopherol
↓↓↓ macronutrients, ↓↓↓ AAS, ↑ n6/n3 ratio, ↑↑ As+Pb
AAS, amino acid score; n3, omega-3-fatty acids; n6, omega-6-fatty acids; ↑ high, ↑↑ higher, ↑↑↑ very high; ↓ low, ↓↓ lower, ↓↓↓ very low.
Publisher’s Note: MDPI stays neutral with regard to jurisdictional claims in published maps and institutional affiliations.

