
Fish Oil Increases Diet-Induced Thermogenesis in Mice


Abstract
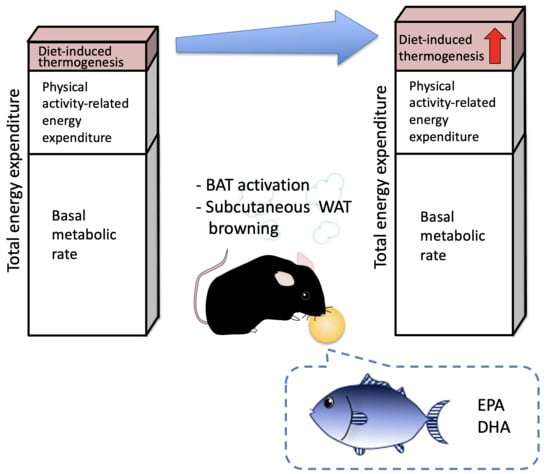
1. Introduction
2. Results
2.1. Effects of Fish Oil Supplementation on DIT, EE, Activity and RER
2.2. Body Weight and Tissue Weights of Con- and FO-Fed Mice
2.3. Serum Chemicals of Con- and FO-Fed Mice
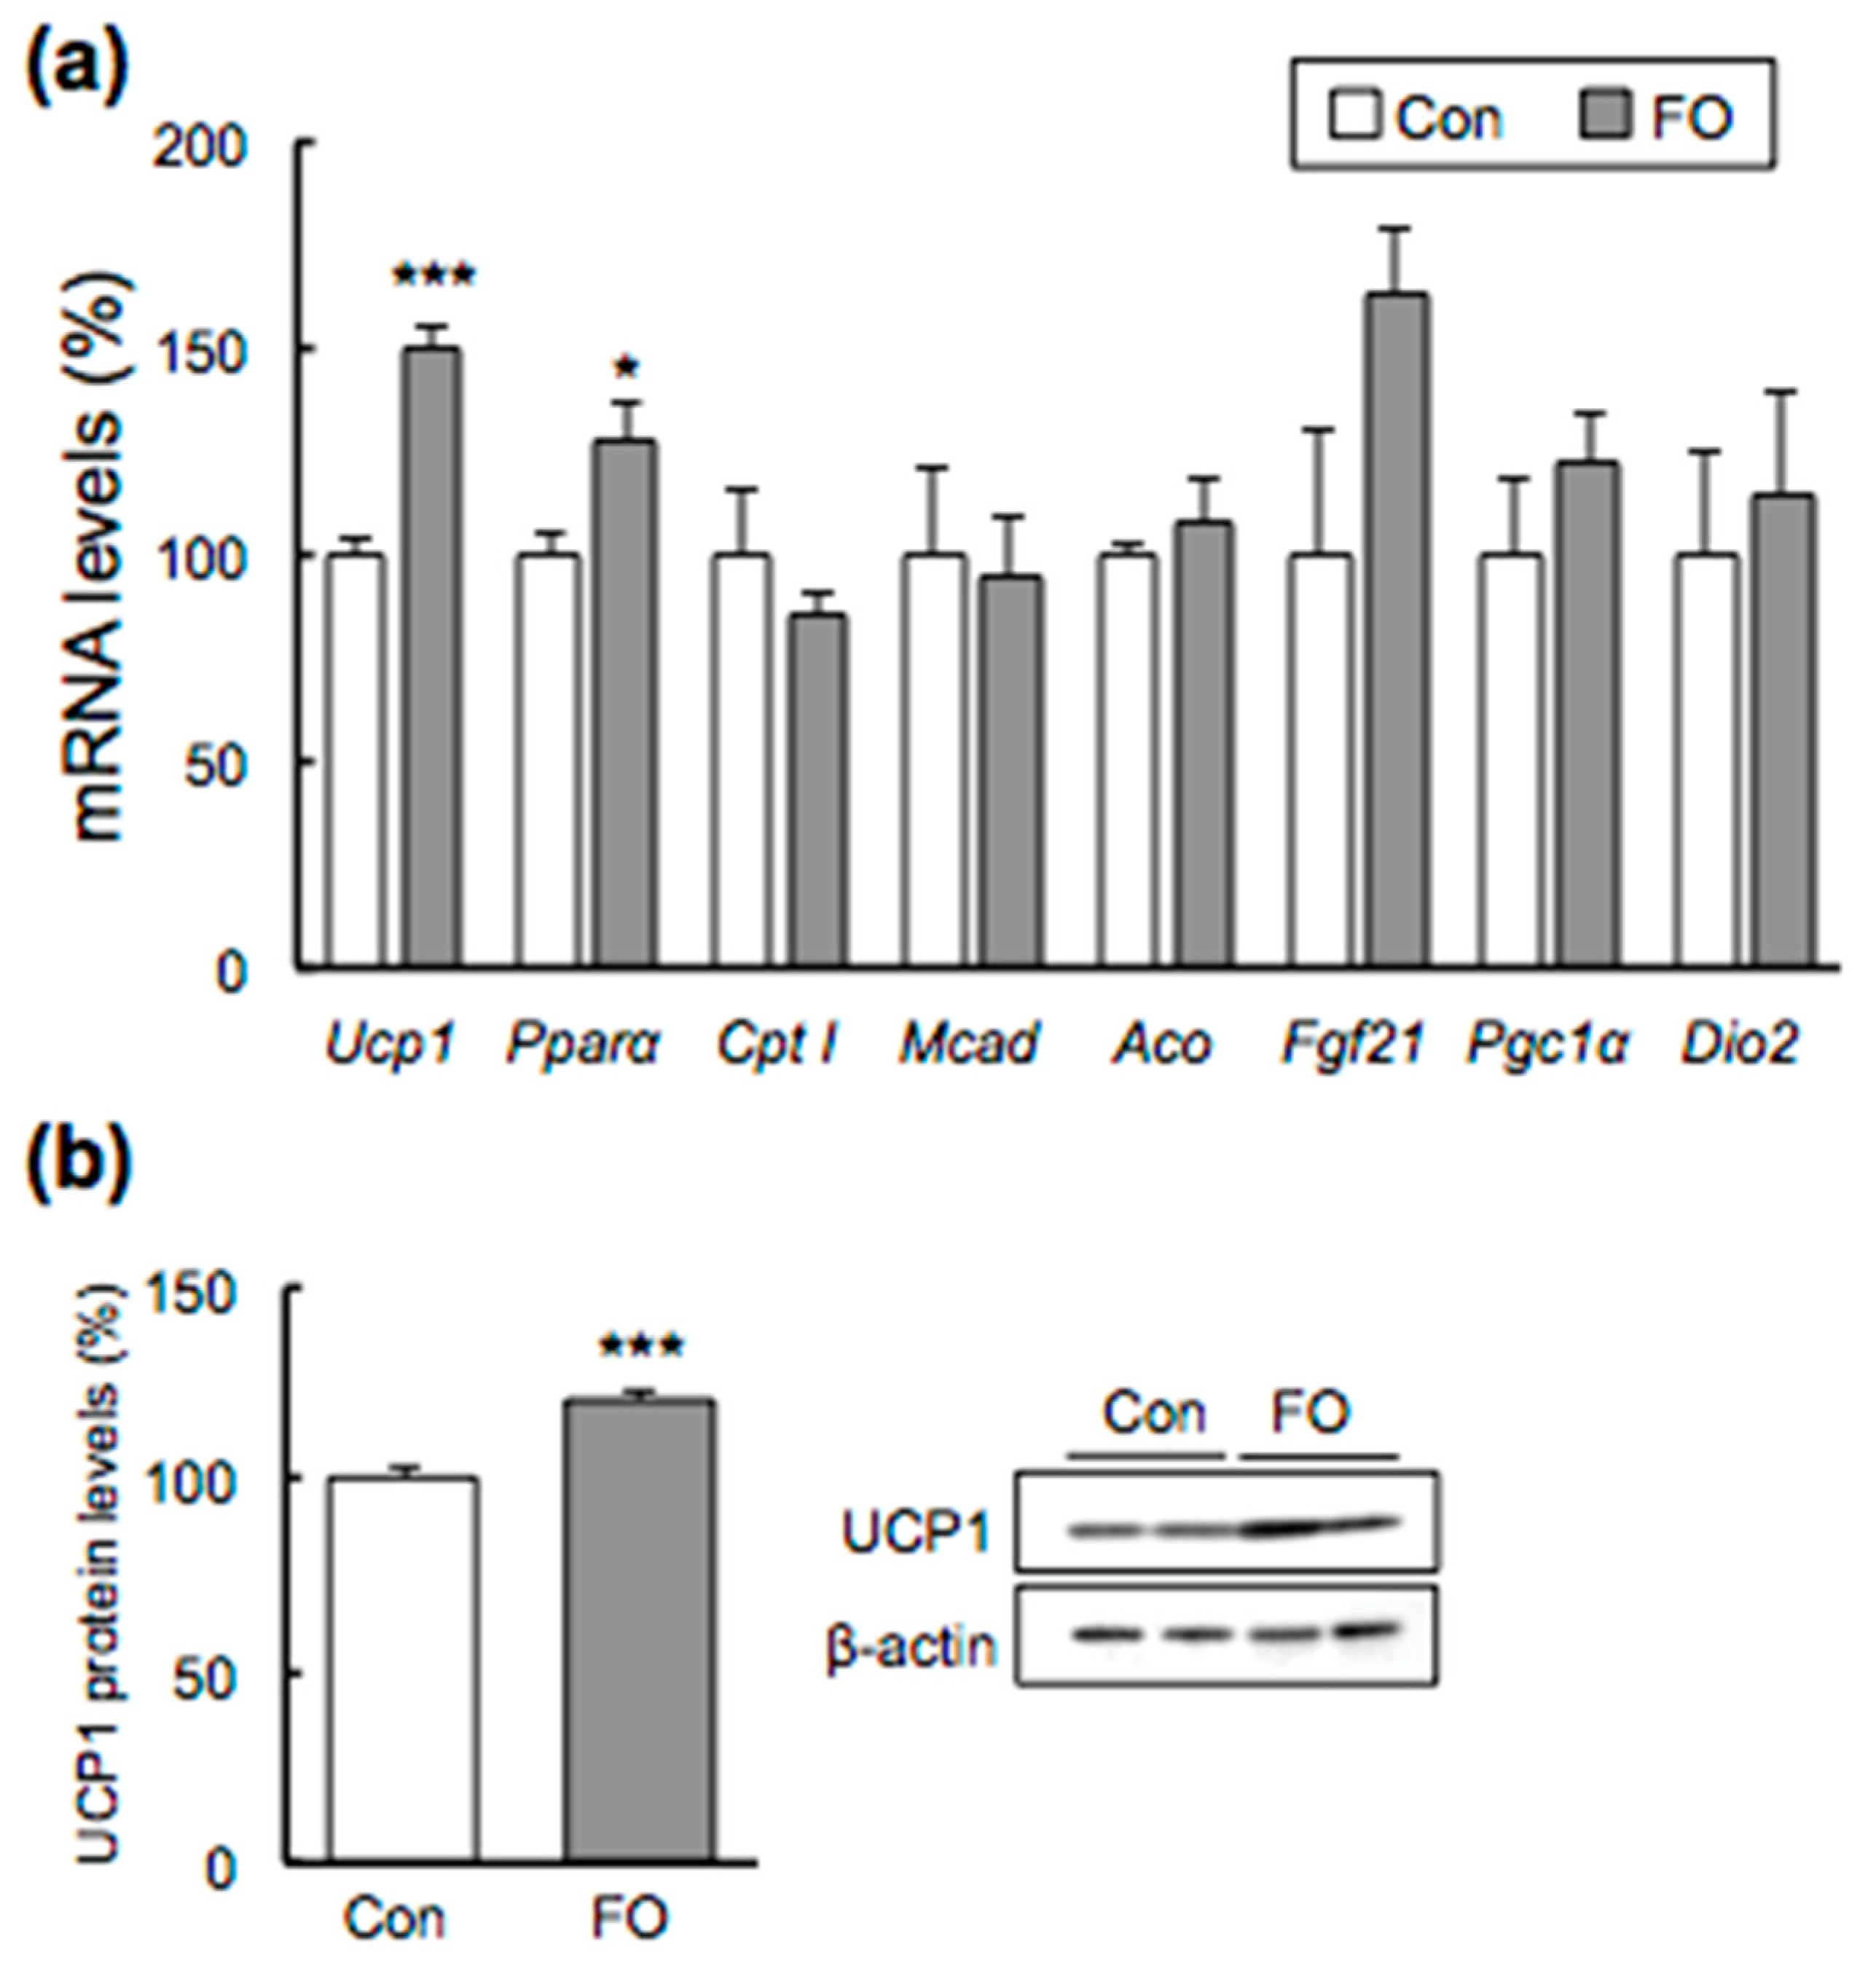
2.4. Effects of FO Supplementation on BAT
2.5. Effects of FO Supplementation on Gene Expression in subWAT
2.6. Effects of FO Supplementation on Gene Expression in Liver
3. Discussion
4. Materials and Methods
4.1. Animals
4.2. Diet
4.3. Measurement of O2 Consumption and CO2 Production to Calculate DIT and Energy Production
4.4. Quantitative Real-Time PCR
4.5. Serum Chemistry
4.6. Western Blotting
4.7. Statistical Analysis
Supplementary Materials
Author Contributions
Funding
Institutional Review Board Statement
Informed Consent Statement
Data Availability Statement
Conflicts of Interest
References
- Lam, Y.Y.; Ravussin, E. Analysis of energy metabolism in humans: A review of methodologies. Mol. Metab. 2016, 5, 1057–1071. [Google Scholar] [CrossRef] [PubMed]
- Tappy, L. Thermic effect of food and sympathetic nervous system activity in humans. Reprod. Nutr. Dev. 1996, 36, 391–397. [Google Scholar] [CrossRef] [PubMed]
- Diepvens, K.; Westerterp, K.R.; Westerterp-Plantenga, M.S. Obesity and thermogenesis related to the consumption of caffeine, ephedrine, capsaicin, and green tea. Am. J. Physiol. Regul. Integr. Comp. Physiol. 2007, 292, R77–R85. [Google Scholar] [CrossRef] [PubMed]
- Cannon, B.; Nedergaard, J. Brown adipose tissue: Function and physiological significance. Physiol. Rev. 2004, 84, 277–359. [Google Scholar] [CrossRef]
- Heaton, J.M. The distribution of brown adipose tissue in the human. J. Anat. 1972, 112, 35–39. [Google Scholar]
- Van Marken Lichtenbelt, W.D.; Vanhommerig, J.W.; Smulders, N.M.; Drossaerts, J.M.; Kemerink, G.J.; Bouvy, N.D.; Schrauwen, P.; Teule, G.J. Cold-activated brown adipose tissue in healthy men. N. Engl. J. Med. 2009, 360, 1500–1508. [Google Scholar] [CrossRef] [PubMed]
- Virtanen, K.A.; Lidell, M.E.; Orava, J.; Heglind, M.; Westergren, R.; Niemi, T.; Taittonen, M.; Laine, J.; Savisto, N.J.; Enerbäck, S.; et al. Functional brown adipose tissue in healthy adults. N. Engl. J. Med. 2009, 360, 1518–1525. [Google Scholar] [CrossRef]
- Heaton, G.M.; Wagenvoord, R.J.; Kemp, A., Jr.; Nicholls, D.G. Brown-adipose-tissue mitochondria: Photoaffinity labelling of the regulatory site of energy dissipation. Eur. J. Biochem. 1978, 82, 515–521. [Google Scholar] [CrossRef]
- Aquila, H.; Link, T.A.; Klingenberg, M. The uncoupling protein from brown fat mitochondria is related to the mitochondrial ADP/ATP carrier. Analysis of sequence homologies and of folding of the protein in the membrane. EMBO J. 1985, 4, 2369–2376. [Google Scholar] [CrossRef]
- Von Essen, G.; Lindsund, E.; Cannon, B.; Nedergaard, J. Adaptive facultative diet-induced thermogenesis in wild-type but not in UCP1-ablated mice. Am. J. Physiol. Endocrinol. Metab. 2017, 313, E515–E527. [Google Scholar] [CrossRef] [PubMed]
- Kontani, Y.; Wang, Y.; Kimura, K.; Inokuma, K.I.; Saito, M.; Suzuki-Miura, T.; Wang, Z.; Sato, Y.; Mori, N.; Yamashita, H. UCP1 deficiency increases susceptibility to diet-induced obesity with age. Aging Cell 2005, 4, 147–155. [Google Scholar] [CrossRef] [PubMed]
- Nagai, N.; Sakane, N.; Ueno, L.M.; Hamada, T.; Moritani, T. The -3826 A-->G variant of the uncoupling protein-1 gene diminishes postprandial thermogenesis after a high fat meal in healthy boys. J. Clin. Endocrinol. Metab. 2003, 88, 5661–5667. [Google Scholar] [CrossRef] [PubMed]
- Saito, M.; Okamatsu-Ogura, Y.; Matsushita, M.; Watanabe, K.; Yoneshiro, T.; Nio-Kobayashi, J.; Iwanaga, T.; Miyagawa, M.; Kameya, T.; Nakada, K.; et al. High incidence of metabolically active brown adipose tissue in healthy adult humans: Effects of cold exposure and adiposity. Diabetes 2009, 58, 1526–1531. [Google Scholar] [CrossRef]
- Cypess, A.M.; Weiner, L.S.; Roberts-Toler, C.; Elía, E.F.; Kessler, S.H.; Kahn, P.A.; English, J.; Chatman, K.; Trauger, S.A.; Doria, A.; et al. Activation of human brown adipose tissue by a β3-adrenergic receptor agonist. Cell Metab. 2015, 21, 33–38. [Google Scholar] [CrossRef] [PubMed]
- Yoneshiro, T.; Aita, S.; Kawai, Y.; Iwanaga, T.; Saito, M. Nonpungent capsaicin analogs (capsinoids) increase energy expenditure through the activation of brown adipose tissue in humans. Am. J. Clin. Nutr. 2012, 95, 845–850. [Google Scholar] [CrossRef]
- Yoneshiro, T.; Aita, S.; Matsushita, M.; Kayahara, T.; Kameya, T.; Kawai, Y.; Iwanaga, T.; Saito, M. Recruited brown adipose tissue as an antiobesity agent in humans. J. Clin. Investig. 2013, 123, 3404–3408. [Google Scholar] [CrossRef]
- Ramel, A.; Martinéz, A.; Kiely, M.; Morais, G.; Bandarra, N.M.; Thorsdottir, I. Beneficial effects of long-chain n-3 fatty acids included in an energy-restricted diet on insulin resistance in overweight and obese European young adults. Diabetologia 2008, 51, 1261–1268. [Google Scholar] [CrossRef]
- Thorsdottir, I.; Tomasson, H.; Gunnarsdottir, I.; Gisladottir, E.; Kiely, M.; Parra, M.D.; Bandarra, N.M.; Schaafsma, G.; Martinéz, J.A. Randomized trial of weight-loss-diets for young adults varying in fish and fish oil content. Int. J. Obes. 2007, 31, 1560–1566. [Google Scholar] [CrossRef] [PubMed]
- Gunnarsdottir, I.; Tomasson, H.; Kiely, M.; Martinéz, J.A.; Bandarra, N.M.; Morais, M.G.; Thorsdottir, I. Inclusion of fish or fish oil in weight-loss diets for young adults: Effects on blood lipids. Int. J. Obes. 2008, 32, 1105–1112. [Google Scholar] [CrossRef] [PubMed]
- Calder, P.C. Mechanisms of action of (n-3) fatty acids. J. Nutr. 2012, 142, 592S–599S. [Google Scholar] [CrossRef]
- Arterburn, L.M.; Hall, E.B.; Oken, H. Distribution, interconversion, and dose response of n-3 fatty acids in humans. Am. J. Clin. Nutr. 2006, 83, 1467S–1476S. [Google Scholar] [CrossRef] [PubMed]
- Muskiet, F.A.; Fokkema, M.R.; Schaafsma, A.; Boersma, E.R.; Crawford, M.A. Is docosahexaenoic acid (DHA) essential? Lessons from DHA status regulation, our ancient diet, epidemiology and randomized controlled trials. J. Nutr. 2004, 134, 183–186. [Google Scholar] [CrossRef] [PubMed]
- Forman, B.M.; Chen, J.; Evans, R.M. Hypolipidemic drugs, polyunsaturated fatty acids, and eicosanoids are ligands for peroxisome proliferator-activated receptors alpha and delta. Proc. Natl. Acad. Sci. USA 1997, 94, 4312–4317. [Google Scholar] [CrossRef] [PubMed]
- Krey, G.; Braissant, O.; L’Horset, F.; Kalkhoven, E.; Perroud, M.; Parker, M.G.; Wahli, W. Fatty acids, eicosanoids, and hypolipidemic agents identified as ligands of peroxisome proliferator-activated receptors by coactivator-dependent receptor ligand assay. Mol. Endocrinol. 1997, 11, 779–791. [Google Scholar] [CrossRef] [PubMed]
- Escher, P.; Braissant, O.; Basu-Modak, S.; Michalik, L.; Wahli, W.; Desvergne, B. Rat PPARs: Quantitative analysis in adult rat tissues and regulation in fasting and refeeding. Endocrinology 2001, 142, 4195–4202. [Google Scholar] [CrossRef] [PubMed]
- Barbera, M.J.; Schluter, A.; Pedraza, N.; Iglesias, R.; Villarroya, F.; Giralt, M. Peroxisome proliferator-activated receptor alpha activates transcription of the brown fat uncoupling protein-1 gene. A link between regulation of the thermogenic and lipid oxidation pathways in the brown fat cell. J. Biol. Chem. 2001, 276, 1486–1493. [Google Scholar] [CrossRef]
- Ishibashi, J.; Seale, P. Medicine. Beige can be slimming. Science 2010, 328, 1113–1114. [Google Scholar] [CrossRef]
- Seale, P.; Bjork, B.; Yang, W.; Kajimura, S.; Chin, S.; Kuang, S.; Scimè, A.; Devarakonda, S.; Conroe, H.M.; Erdjument-Bromage, H.; et al. PRDM16 controls a brown fat/skeletal muscle switch. Nature 2008, 454, 961–967. [Google Scholar] [CrossRef]
- Wu, J.; Boström, P.; Sparks, L.M.; Ye, L.; Choi, J.H.; Giang, A.H.; Khandekar, M.; Virtanen, K.A.; Nuutila, P.; Schaart, G.; et al. Beige adipocytes are a distinct type of thermogenic fat cell in mouse and human. Cell 2012, 150, 366–376. [Google Scholar] [CrossRef]
- Okamatsu-Ogura, Y.; Fukano, K.; Tsubota, A.; Uozumi, A.; Terao, A.; Kimura, K.; Saito, M. Thermogenic ability of uncoupling protein 1 in beige adipocytes in mice. PLoS ONE 2013, 8, e84229. [Google Scholar] [CrossRef]
- Laiglesia, L.M.; Lorente-Cebrián, S.; Prieto-Hontoria, P.L.; Fernández-Galilea, M.; Ribeiro, S.M.; Sáinz, N.; Martínez, J.A.; Moreno-Aliaga, M.J. Eicosapentaenoic acid promotes mitochondrial biogenesis and beige-like features in subcutaneous adipocytes from overweight subjects. J. Nutr. Biochem. 2016, 37, 76–82. [Google Scholar] [CrossRef] [PubMed]
- Zhao, M.; Chen, X. Eicosapentaenoic acid promotes thermogenic and fatty acid storage capacity in mouse subcutaneous adipocytes. Biochem. Biophys. Res. Commun. 2014, 450, 1446–1451. [Google Scholar] [CrossRef] [PubMed]
- Bargut, T.C.; Souza-Mello, V.; Mandarim-de-Lacerda, C.A.; Aguila, M.B. Fish oil diet modulates epididymal and inguinal adipocyte metabolism in mice. Food Funct. 2016, 7, 1468–1476. [Google Scholar] [CrossRef] [PubMed]
- Kim, M.; Goto, T.; Yu, R.; Uchida, K.; Tominaga, M.; Kano, Y.; Takahashi, N.; Kawada, T. Fish oil intake induces UCP1 upregulation in brown and white adipose tissue via the sympathetic nervous system. Sci. Rep. 2015, 5, 18013. [Google Scholar] [CrossRef] [PubMed]
- Kim, J.; Okla, M.; Erickson, A.; Carr, T.; Natarajan, S.K.; Chung, S. Eicosapentaenoic Acid Potentiates Brown Thermogenesis through FFAR4-dependent Up-regulation of miR-30b and miR-378. J. Biol. Chem. 2016, 291, 20551–20562. [Google Scholar] [CrossRef] [PubMed]
- Bargut, T.C.; Silva-e-Silva, A.C.; Souza-Mello, V.; Mandarim-de-Lacerda, C.A.; Aguila, M.B. Mice fed fish oil diet and upregulation of brown adipose tissue thermogenic markers. Eur. J. Nutr. 2016, 55, 159–169. [Google Scholar] [CrossRef]
- Yamazaki, T.; Ikaga, R.; Li, D.; Nakae, S.; Tanaka, S. A novel method for measuring diet-induced thermogenesis in mice. MethodsX 2019, 6, 1950–1956. [Google Scholar] [CrossRef]
- Hanssen, M.J.; Hoeks, J.; Brans, B.; van der Lans, A.A.; Schaart, G.; van den Driessche, J.J.; Jörgensen, J.A.; Boekschoten, M.V.; Hesselink, M.K.; Havekes, B.; et al. Short-term cold acclimation improves insulin sensitivity in patients with type 2 diabetes mellitus. Nat. Med. 2015, 21, 863–865. [Google Scholar] [CrossRef]
- Lefebvre, P.; Chinetti, G.; Fruchart, J.C.; Staels, B. Sorting out the roles of PPAR alpha in energy metabolism and vascular homeostasis. J. Clin. Investig. 2006, 116, 571–580. [Google Scholar] [CrossRef]
- Leblanc, J.; Dussault, J.; Lupien, D.; Richard, D. Effect of diet and exercise on norepinephrine-induced thermogenesis in male and female rats. J. Appl. Physiol. 1982, 52, 556–561. [Google Scholar] [CrossRef]
- Gulick, T.; Cresci, S.; Caira, T.; Moore, D.D.; Kelly, D.P. The peroxisome proliferator-activated receptor regulates mitochondrial fatty acid oxidative enzyme gene expression. Proc. Natl. Acad. Sci. USA 1994, 91, 11012–11016. [Google Scholar] [CrossRef] [PubMed]
- Pahlavani, M.; Razafimanjato, F.; Ramalingam, L.; Kalupahana, N.S.; Moussa, H.; Scoggin, S.; Moustaid-Moussa, N. Eicosapentaenoic acid regulates brown adipose tissue metabolism in high-fat-fed mice and in clonal brown adipocytes. J. Nutr. Biochem. 2017, 39, 101–109. [Google Scholar] [CrossRef] [PubMed]
- Oudart, H.; Groscolas, R.; Calgari, C.; Nibbelink, M.; Leray, C.; Le Maho, Y.; Malan, A. Brown fat thermogenesis in rats fed high-fat diets enriched with n-3 polyunsaturated fatty acids. Int. J. Obes. Relat. Metab. Disord. 1997, 21, 955–962. [Google Scholar] [CrossRef] [PubMed]
- Mascaró, C.; Acosta, E.; Ortiz, J.A.; Marrero, P.F.; Hegardt, F.G.; Haro, D. Control of human muscle-type carnitine palmitoyltransferase I gene transcription by peroxisome proliferator-activated receptor. J. Biol. Chem. 1998, 273, 8560–8563. [Google Scholar] [CrossRef]
- Leone, T.C.; Weinheimer, C.J.; Kelly, D.P. A critical role for the peroxisome proliferator-activated receptor alpha (PPARalpha) in the cellular fasting response: The PPARalpha-null mouse as a model of fatty acid oxidation disorders. Proc. Natl. Acad. Sci. USA 1999, 96, 7473–7478. [Google Scholar] [CrossRef] [PubMed]
- Goto, T.; Lee, J.Y.; Teraminami, A.; Kim, Y.I.; Hirai, S.; Uemura, T.; Inoue, H.; Takahashi, N.; Kawada, T. Activation of peroxisome proliferator-activated receptor-alpha stimulates both differentiation and fatty acid oxidation in adipocytes. J. Lipid. Res. 2011, 52, 873–884. [Google Scholar] [CrossRef]
- Rachid, T.L.; Penna-de-Carvalho, A.; Bringhenti, I.; Aguila, M.B.; Mandarim-de-Lacerda, C.A.; Souza-Mello, V. Fenofibrate (PPARalpha agonist) induces beige cell formation in subcutaneous white adipose tissue from diet-induced male obese mice. Mol. Cell. Endocrinol. 2015, 402, 86–94. [Google Scholar] [CrossRef]
- Rachid, T.L.; Silva-Veiga, F.M.; Graus-Nunes, F.; Bringhenti, I.; Mandarim-de-Lacerda, C.A.; Souza-Mello, V. Differential actions of PPAR-α and PPAR-β/δ on beige adipocyte formation: A study in the subcutaneous white adipose tissue of obese male mice. PLoS ONE 2018, 13, e0191365. [Google Scholar] [CrossRef]
- Shabalina, I.G.; Petrovic, N.; de Jong, J.M.; Kalinovich, A.V.; Cannon, B.; Nedergaard, J. UCP1 in brite/beige adipose tissue mitochondria is functionally thermogenic. Cell Rep. 2013, 5, 1196–1203. [Google Scholar] [CrossRef]
- Sato, H.; Taketomi, Y.; Miki, Y.; Murase, R.; Yamamoto, K.; Murakami, M. Secreted Phospholipase PLA2G2D Contributes to Metabolic Health by Mobilizing ω3 Polyunsaturated Fatty Acids in WAT. Cell Rep. 2020, 31, 107579. [Google Scholar] [CrossRef]
- Hondares, E.; Iglesias, R.; Giralt, A.; Gonzalez, F.J.; Giralt, M.; Mampel, T.; Villarroya, F. Thermogenic activation induces FGF21 expression and release in brown adipose tissue. J. Biol. Chem. 2011, 286, 12983–12990. [Google Scholar] [CrossRef]
- Fisher, F.M.; Kleiner, S.; Douris, N.; Fox, E.C.; Mepani, R.J.; Verdeguer, F.; Wu, J.; Kharitonenkov, A.; Flier, J.S.; Maratos-Flier, E.; et al. FGF21 regulates PGC-1α and browning of white adipose tissues in adaptive thermogenesis. Genes Dev. 2012, 26, 271–281. [Google Scholar] [CrossRef]
- Quesada-López, T.; Cereijo, R.; Turatsinze, J.V.; Planavila, A.; Cairó, M.; Gavaldà-Navarro, A.; Peyrou, M.; Moure, R.; Iglesias, R.; Giralt, M.; et al. The lipid sensor GPR120 promotes brown fat activation and FGF21 release from adipocytes. Nat. Commun. 2016, 7, 13479. [Google Scholar] [CrossRef] [PubMed]
- Oh, D.Y.; Talukdar, S.; Bae, E.J.; Imamura, T.; Morinaga, H.; Fan, W.; Li, P.; Lu, W.J.; Watkins, S.M.; Olefsky, J.M. GPR120 is an omega-3 fatty acid receptor mediating potent anti-inflammatory and insulin-sensitizing effects. Cell 2010, 142, 687–698. [Google Scholar] [CrossRef] [PubMed]
- Huber, J.; Löffler, M.; Bilban, M.; Reimers, M.; Kadl, A.; Todoric, J.; Zeyda, M.; Geyeregger, R.; Schreiner, M.; Weichhart, T.; et al. Prevention of high-fat diet-induced adipose tissue remodeling in obese diabetic mice by n-3 polyunsaturated fatty acids. Int. J. Obes. 2007, 31, 1004–1013. [Google Scholar] [CrossRef] [PubMed]
- Todoric, J.; Löffler, M.; Huber, J.; Bilban, M.; Reimers, M.; Kadl, A.; Zeyda, M.; Waldhäusl, W.; Stulnig, T.M. Adipose tissue inflammation induced by high-fat diet in obese diabetic mice is prevented by n-3 polyunsaturated fatty acids. Diabetologia 2006, 49, 2109–2119. [Google Scholar] [CrossRef]
- Innes, J.K.; Calder, P.C. The Differential Effects of Eicosapentaenoic Acid and Docosahexaenoic Acid on Cardiometabolic Risk Factors: A Systematic Review. Int. J. Mol. Sci. 2018, 19, 532. [Google Scholar] [CrossRef]
- Madsen, L.; Rustan, A.C.; Vaagenes, H.; Berge, K.; Dyrøy, E.; Berge, R.K. Eicosapentaenoic and docosahexaenoic acid affect mitochondrial and peroxisomal fatty acid oxidation in relation to substrate preference. Lipids 1999, 34, 951–963. [Google Scholar] [CrossRef]
- Buckley, R.; Shewring, B.; Turner, R.; Yaqoob, P.; Minihane, A.M. Circulating triacylglycerol and apoE levels in response to EPA and docosahexaenoic acid supplementation in adult human subjects. Br. J. Nutr. 2004, 92, 477–483. [Google Scholar] [CrossRef] [PubMed]
- Wada, S.; Yamazaki, T.; Kawano, Y.; Miura, S.; Ezaki, O. Fish oil fed prior to ethanol administration prevents acute ethanol-induced fatty liver in mice. J. Hepatol. 2008, 49, 441–450. [Google Scholar] [CrossRef] [PubMed]
- Houten, S.M.; Violante, S.; Ventura, F.V.; Wanders, R.J. The Biochemistry and Physiology of Mitochondrial Fatty Acid β-Oxidation and Its Genetic Disorders. Annu. Rev. Physiol. 2016, 78, 23–44. [Google Scholar] [CrossRef]
- Warfel, J.D.; Vandanmagsar, B.; Dubuisson, O.S.; Hodgeson, S.M.; Elks, C.M.; Ravussin, E.; Mynatt, R.L. Examination of carnitine palmitoyltransferase 1 abundance in white adipose tissue: Implications in obesity research. Am. J. Physiol. Regul. Integr. Comp. Physiol. 2017, 312, R816–R820. [Google Scholar] [CrossRef]
- Gao, X.; Li, K.; Hui, X.; Kong, X.; Sweeney, G.; Wang, Y.; Xu, A.; Teng, M.; Liu, P.; Wu, D. Carnitine palmitoyltransferase 1A prevents fatty acid-induced adipocyte dysfunction through suppression of c-Jun N-terminal kinase. Biochem. J. 2011, 435, 723–732. [Google Scholar] [CrossRef] [PubMed]
- Jensen, M.D.; Bajnárek, J.; Lee, S.Y.; Nielsen, S.; Koutsari, C. Relationship between postabsorptive respiratory exchange ratio and plasma free fatty acid concentrations. J. Lipid. Res. 2009, 50, 1863–1869. [Google Scholar] [CrossRef] [PubMed]
- Hibi, M.; Oishi, S.; Matsushita, M.; Yoneshiro, T.; Yamaguchi, T.; Usui, C.; Yasunaga, K.; Katsuragi, Y.; Kubota, K.; Tanaka, S.; et al. Brown adipose tissue is involved in diet-induced thermogenesis and whole-body fat utilization in healthy humans. Int. J. Obes. 2016, 40, 1655–1661. [Google Scholar] [CrossRef] [PubMed]
- Snitker, S.; Fujishima, Y.; Shen, H.; Ott, S.; Pi-Sunyer, X.; Furuhata, Y.; Sato, H.; Takahashi, M. Effects of novel capsinoid treatment on fatness and energy metabolism in humans: Possible pharmacogenetic implications. Am. J. Clin. Nutr. 2009, 89, 45–50. [Google Scholar] [CrossRef] [PubMed]
- Westerterp, K.R. Diet induced thermogenesis. Nutr. Metab. 2004, 1, 5. [Google Scholar] [CrossRef]
- Trumbo, P.; Schlicker, S.; Yates, A.A.; Poos, M. Dietary reference intakes for energy, carbohydrate, fiber, fat, fatty acids, cholesterol, protein and amino acids. J. Am. Diet. Assoc. 2002, 102, 1621–1630. [Google Scholar] [CrossRef]
- Forbes, R.M.; Cooper, A.R.; Mitchell, H.H. The composition of the adult human body as determined by chemical analysis. J. Biol. Chem. 1953, 203, 359–366. [Google Scholar] [CrossRef]
- Li, D.; Ikaga, R.; Yamazaki, T. Soya protein β-conglycinin ameliorates fatty liver and obesity in diet-induced obese mice through the down-regulation of PPARγ. Br. J. Nutr. 2018, 119, 1220–1232. [Google Scholar] [CrossRef]
- Weir, J.B. New methods for calculating metabolic rate with special reference to protein metabolism. J. Physiol. 1949, 109, 1–9. [Google Scholar] [CrossRef] [PubMed]
- Yamazaki, T.; Okawa, S.; Takahashi, M. The effects on weight loss and gene expression in adipose and hepatic tissues of very-low carbohydrate and low-fat isoenergetic diets in diet-induced obese mice. Nutr. Metab. 2016, 13, 78. [Google Scholar] [CrossRef] [PubMed]


| BW/Tissues | Con-Fed | FO-Fed |
|---|---|---|
| BW at start (g) | 23.1 ± 0.4 | 23.1 ± 0.2 |
| Final BW (g) | 25.9 ± 0.5 | 25.2 ± 0.4 |
| BAT (g) | 0.087 ± 0.006 | 0.083 ± 0.007 |
| Subcutaneous WAT(g) | 0.329 ± 0.029 | 0.251 ± 0.026 |
| Epididymal WAT (g) | 0.462 ± 0.041 | 0.326 ± 0.018 * |
| Mesenteric WAT (g) | 0.149 ± 0.024 | 0.081 ± 0.008 * |
| Liver (g) | 1.19 ± 0.03 | 1.22 ± 0.04 |
| Con-Fed | FO-Fed | |
|---|---|---|
| Glucose (mg/dL) | 169.6 ± 15.8 | 177.1 ± 11.4 |
| NEFA (mEq/L) | 0.83 ± 0.07 | 0.49 ± 0.06 ** |
| TG (mg/dL) | 179.9 ± 25.1 | 70.3 ± 16.4 ** |
| TC (mg/dL) | 179.0 ± 13.4 | 102.3 ± 3.7 *** |
| Dietary Constituents | Con | FO |
|---|---|---|
| g/100 g | ||
| Safflower oil (high oleic) | 3.46 | 0.00 |
| Butter | 10.38 | 0.00 |
| Fish oil | 0.00 | 13.84 |
| Casein | 22.2 | 22.2 |
| α-Starch | 52.98 | 52.98 |
| Vitamin mix (AIN-93) | 1.12 | 1.12 |
| Mineral mix (AIN-93) | 3.92 | 3.92 |
| Cellulose powder | 5.60 | 5.60 |
| L-Cystine | 0.34 | 0.34 |
| en% | ||
| Fat | 30 | 30 |
| Carbohydrate | 50 | 50 |
| Protein | 20 | 20 |
| Gene | Forward Primer (5′ to 3′) | Reverse Primer (5′ to 3′) |
|---|---|---|
| 36b4 | GGCCCTGCACTCTCGCTTTC | TGCCAGGACGCGCTTGT |
| Aco | GCCCAACTGTGACTTCCATT | GGCATGTAACCCGTAGCACT |
| β3-AR | TCTAGTTCCCAGCGGAGTTTTCATCG | CGCGCACCTTCATAGCCATCAAACC |
| Cidea | ATCACAACTGGCCTGGTTACG | TACTACCCGGTGTCCATTTCT |
| Cpt I | GCACTGCAGCTCGCACATTACAA | CTCAGACAGTACCTCCTTCAGGAAA |
| Dio2 | GCACGTCTCCAATCCTGAAT | TGAACCAAAGTTGACCACCA |
| Fgf21 | ATGGAATGGATGAGATCTAGAGTTGG | TCTTGGTCGTCATCTGTGTAGAGG |
| Mcad | GATCGCAATGGGTGCTTTTGATAGAA | AGCTGATTGGCAATGTCTCCAGCAAA |
| Pgc1α | AAGTGTGGAACTCTCTGGAACTG | GGGTTATCTTGGTTGGCTTTATG |
| Pparα | CCTCAGGGTACCACTACGGAGT | GGTCTTCTTCTGAATCTTGCAGCT |
| Prdm16 | GACATTCCAATCCCACCAGA | CACCTCTGTATCCGTCAGCA |
| Ucp1 | GGCCCTTGTAAACAACAAAATAC | GGCAACAAGAGCTGACAGTAAAT |
Publisher’s Note: MDPI stays neutral with regard to jurisdictional claims in published maps and institutional affiliations. |
© 2021 by the authors. Licensee MDPI, Basel, Switzerland. This article is an open access article distributed under the terms and conditions of the Creative Commons Attribution (CC BY) license (https://creativecommons.org/licenses/by/4.0/).
Share and Cite
Yamazaki, T.; Li, D.; Ikaga, R. Fish Oil Increases Diet-Induced Thermogenesis in Mice. Mar. Drugs 2021, 19, 278. https://doi.org/10.3390/md19050278
Yamazaki T, Li D, Ikaga R. Fish Oil Increases Diet-Induced Thermogenesis in Mice. Marine Drugs. 2021; 19(5):278. https://doi.org/10.3390/md19050278
Chicago/Turabian StyleYamazaki, Tomomi, Dongyang Li, and Reina Ikaga. 2021. "Fish Oil Increases Diet-Induced Thermogenesis in Mice" Marine Drugs 19, no. 5: 278. https://doi.org/10.3390/md19050278
APA StyleYamazaki, T., Li, D., & Ikaga, R. (2021). Fish Oil Increases Diet-Induced Thermogenesis in Mice. Marine Drugs, 19(5), 278. https://doi.org/10.3390/md19050278