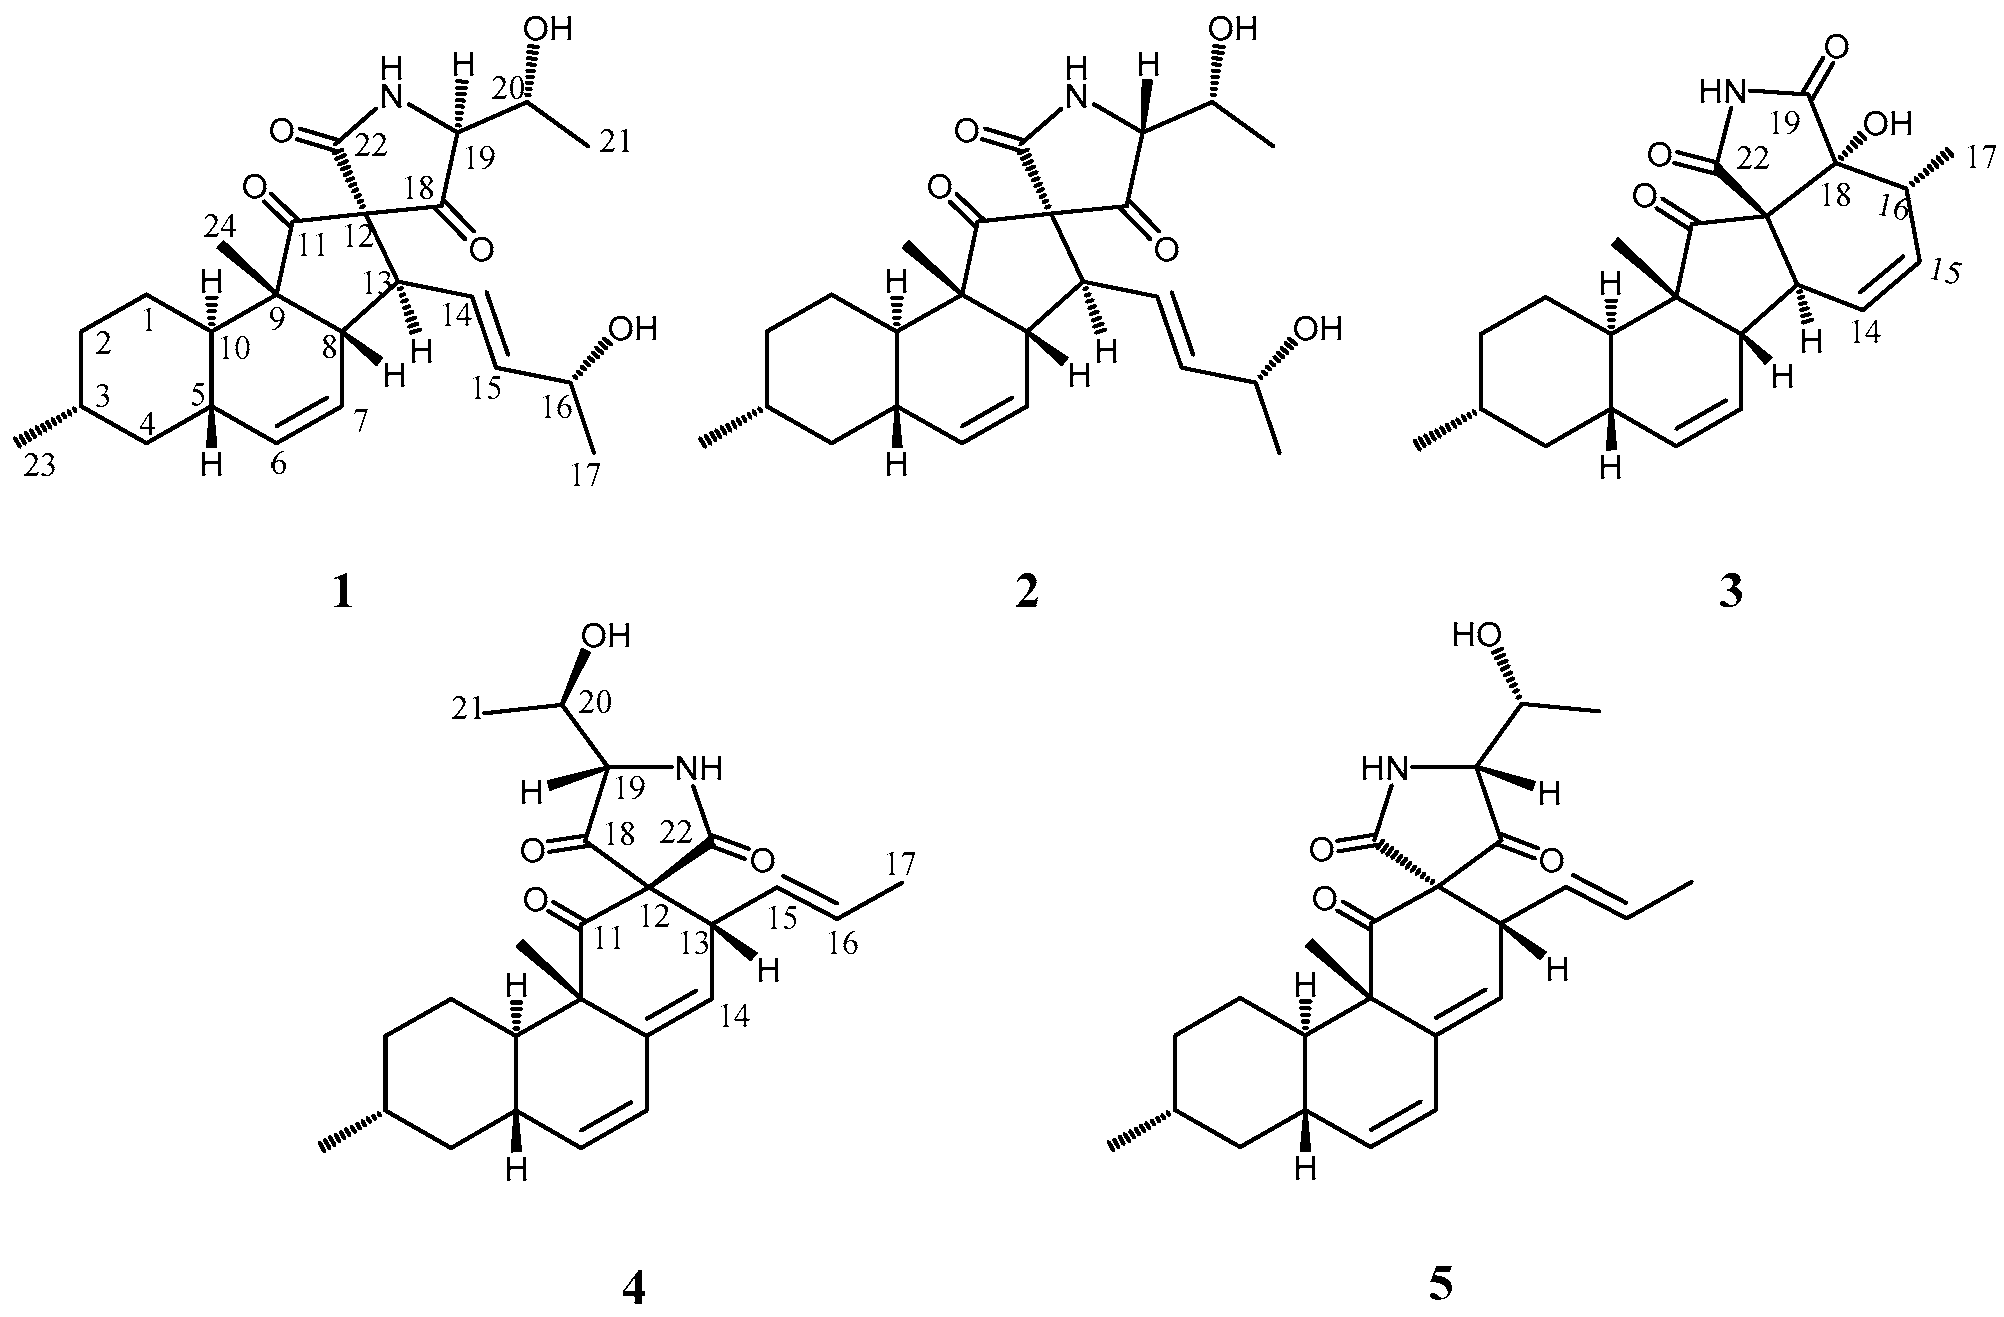
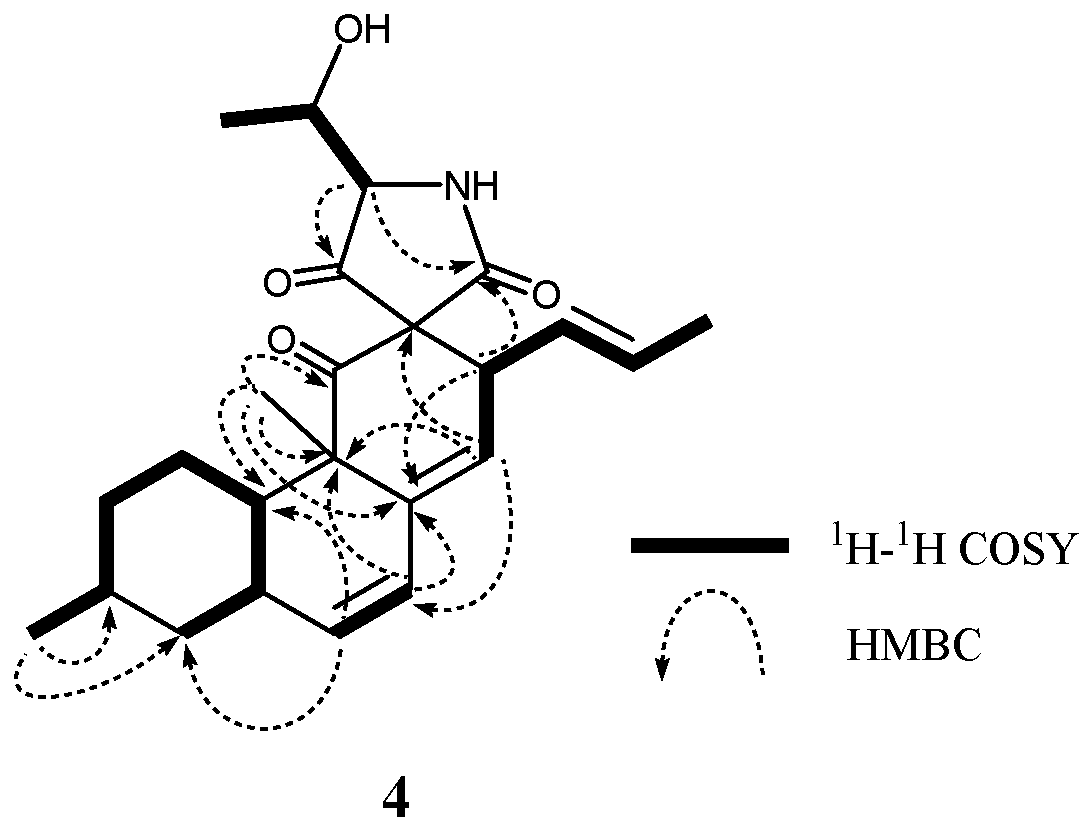
Altercrasins A–E, Decalin Derivatives, from a Sea-Urchin-Derived Alternaria sp.: Isolation and Structural Analysis Including Stereochemistry


Abstract
1. Introduction
2. Results and Discussion
3. Materials and Methods
3.1. General Experimental Procedures
3.2. Fungal Material
3.3. Culturing and Isolation of Metabolites
3.4. Assay for Cytotoxicity
4. Conclusions
Supplementary Materials
Author Contributions
Funding
Acknowledgments
Conflicts of Interest
References
- Blunt, J.W.; Copp, B.R.; Keyzers, R.A.; Munro, M.H.G.; Prinsep, M.R. Marine natural products. Nat. Prod. Rep. 2017, 34, 235–294. [Google Scholar] [CrossRef] [PubMed]
- Blunt, J.W.; Carroll, A.R.; Copp, B.R.; Davis, R.A.; Keyzers, R.A.; Prinsep, M.R. Marine natural products. Nat. Prod. Rep. 2018, 35, 8–53. [Google Scholar] [CrossRef] [PubMed]
- Yamada, T.; Iritani, M.; Ohishi, H.; Tanaka, K.; Minoura, K.; Doi, M.; Numata, A. Pericosines, antitumour metabolites from the sea hare-derived fungus Periconia byssoides. Structures and biological activities. Org. Biomol. Chem. 2007, 5, 3979–3986. [Google Scholar] [CrossRef] [PubMed]
- Yamada, T.; Kitada, H.; Kajimoto, T.; Numata, A.; Tanaka, R. The relationship between the CD Cotton effect and the absolute configuration of FD-838 and its seven stereoisomers. J. Org. Chem. 2010, 75, 4146–4153. [Google Scholar] [CrossRef] [PubMed]
- Yamada, T.; Umebayashi, Y.; Kawashima, M.; Sugiura, Y.; Kikuchi, T.; Tanaka, R. Determination of the chemical structures of tandyukisins B–D, isolated from a marine sponge-derived fungus. Mar. Drugs 2015, 13, 3231–3240. [Google Scholar] [CrossRef] [PubMed]
- Yamada, T.; Kikuchi, T.; Tanaka, R. Altercrasin A, a novel decalin derivative with spirotetramic acid, produced by a sea urchin-derived Alternaria sp. Tetrahedron Lett. 2015, 56, 1229–1232. [Google Scholar] [CrossRef]
- Ueno, M.; Someno, T.; Sawa, R.; Iinuma, H.; Naganawa, H.; Ishizuka, M.; Takeuchi, T. Delaminomycins, novel nonpeptide extracellular matrix receptor antagonist and a new class of potent immunomodulator. II. Physico-chemical properties and structure elucidation of delaminomycin A. J. Antibiotics. 1993, 46, 979–984. [Google Scholar] [CrossRef][Green Version]
- Singh, S.B.; Zink, D.L.; Huber, J.; Genilloud, O.; Salazar, O.; Diez, M.T.; Basilio, A.; Vicente, F.; Byrne, K.M. Discovery of lucensimysin A and B from Streptpmyces lucensis MA7349 using an antisense strategy. Org. Lett. 2006, 8, 5449–5452. [Google Scholar] [CrossRef] [PubMed]
- Singh, S.B.; Zink, D.L.; Herath, K.B.; Salazar, O.; Genilloud, O. Discovery and antibacterial activity of lucensimysin C from Streptpmyces lucensis. Tetrahedron Lett. 2008, 49, 2616–2619. [Google Scholar] [CrossRef]
- Singh, S.B.; Zink, D.L.; Dorso, K.; Motyl, M.; Salazar, O.; Basilio, A.; Vicente, F.; Byrne, K.M.; Ha, S.; Genilloud, O. Isolation, structure, and antibacterial activities of lucensimysins D−G, discovered from Streptpmyces lucensis MA7349 using an antisense strategy. J. Nat. Prod. 2009, 72, 345–352. [Google Scholar] [CrossRef] [PubMed]
- Jang, J.-H.; Asami, Y.; Jang, J.-P.; Kim, S.-O.; Moon, D.O.; Shin, K.-S.; Hashizume, D.; Muroi, M.; Saito, T.; Oh, H.; Kim, B.Y.; et al. Fusarisetin A, an acinar morphogenesis inhibitor from a soil fungus, Fusarium sp. FN080326. J. Am. Chem. Soc. 2011, 133, 6865–6867. [Google Scholar] [CrossRef] [PubMed]
- Deng, J.; Zhu, B.; Lu, Z.; Yu, H.; Li, A. Total synthesis of (−)-fusarisetin A and reassignment of the absolute configuration of its natural counterpart. J. Am. Chem. Soc. 2012, 134, 920–923. [Google Scholar] [CrossRef] [PubMed]
- Yin, J.; Wang, C.; Kong, L.; Cai, S.; Gao, S. Asymmetric synthesis and biosynthetic implications of (+)-fusarisetin A. Angew. Chem. Int. Ed. 2012, 51, 7786–7789. [Google Scholar] [CrossRef] [PubMed]
- Pornpakakul, S.; Roengsumran, S.; Deechangvipart, S.; Petsom, A.; Muangsin, N.; Ngamrojnavanich, N.; Sriubolmas, N.; Chaichit, N.; Ohta, T. Diaporthichalasin, a novel CYP3A4 inhibitor from an endophytic Diaporthe sp. Tetrahedron Lett. 2007, 48, 651–655. [Google Scholar] [CrossRef]
- Brown, S.G.; Jansma, M.J.; Hoye, T.R. Case study of empirical and computational chemical shift analyses: reassignment of the relative configuration of phomopsichalasin to that disporthichalasin. J. Nat. Prod. 2012, 75, 1326–1331. [Google Scholar] [CrossRef] [PubMed]


| Position | 1 | 2 | 3 | ||||||||||||
|---|---|---|---|---|---|---|---|---|---|---|---|---|---|---|---|
| 1Ha (J,Hz) | 13Cb | 1Ha (J,Hz) | 13Cb | 1Ha (J,Hz) | 13Cb | ||||||||||
| 1a | 1.55 | dq | 13.2, 3.6 | 25.9 | (t) | 1.52 | dq | 13.2, 3.6 | 25.9 | (t) | 1.80 | dq | 12.6, 3.6 | 26.0 | (t) |
| 1b | 1.12 | qd | 13.2, 3.6 | 1.13 | qd | 13.2, 3.6 | 1.20 | qd | 12.6, 3.6 | ||||||
| 2a | 0.91 | m | 36.0 | (t) | 0.90 | m | 36.0 | (t) | 0.87 | qd | 12.6, 3.6 | 36.2 | (t) | ||
| 2b | 1.74 | ddt | 12.6, 5.4, 3.6 | 1.75 | ddt | 12.6, 5.4, 3.6 | 1.74 | ddt | 12.6, 5.4, 3.6 | ||||||
| 3 | 1.48 | m | 33.5 | (d) | 1.49 | m | 33.5 | (d) | 1.49 | m | 33.7 | (d) | |||
| 4a | 0.82 | q | 12.6 | 42.6 | (t) | 0.83 | q | 12 | 42.7 | (t) | 0.79 | q | 12.6 | 43.0 | (t) |
| 4b | 1.87 | ddd | 12.6, 5.8, 3.5 | 1.88 | ddd | 12.0, 5.4, 3.5 | 1.87 | ddd | 12.6, 5.4, 3.6 | ||||||
| 5 | 1.92 | br t | 12.6 | 37.4 | (d) | 1.93 | m | 37.5 | (d) | 1.95 | br t | 12.6 | 37.5 | (d) | |
| 6 | 5.55 | d | 10.2 | 133.2 | (d) | 5.54 | d | 10.2 | 132.9 | (d) | 5.57 | d | 9.6 | 133.1 | (d) |
| 7 | 5.70 | ddd | 10.2, 5.0, 2.2 | 125.3 | (d) | 5.69 | ddd | 10.2, 4.8, 2.4 | 125.7 | (d) | 5.97 | ddd | 9.6, 4.8, 3.0 | 126.1 | (d) |
| 8 | 2.65 | ddt | 11.8, 5.0, 1.8 | 49.9 | (d) | 2.74 | ddt | 12.0, 4.8, 1.8 | 49.7 | (d) | 3.34 | ddt | 12.6, 4.8, 0.9 | 45.3 | (d) |
| 9 | 52.9 | (s) | 52.9 | (s) | 53.4 | (s) | |||||||||
| 10 | 1.49 | m | 38.7 | (d) | 1.40 | td | 13.2, 3.0 | 39.0 | (d) | 1.35 | td | 12.6, 3.6 | 40.4 | (d) | |
| 11 | 211.6 | (s) | 211.7 | (s) | 211.3 | (s) | |||||||||
| 12 | 74.0 | (s) | 74.2 | (s) | 74.7 | (s) | |||||||||
| 13 | 3.16 | dd | 11.8, 9.0 | 52.8 | (d) | 3.01 | dd | 12.0, 9.0 | 52.5 | (d) | 2.83 | ddd | 12.6, 5.4, 2.4 | 45.5 | (d) |
| 14 | 5.62 | ddd | 15.5, 9.0, 1.8 | 124.3 | (d) | 5.82 | ddd | 15.0, 9.0, 1.8 | 125.5 | (d) | 6.42 | ddq | 8.8, 5.4, 2.4 | 133.6 | (d) |
| 15 | 5.73 | dd | 15.5, 5.5 | 141.9 | (d) | 5.59 | ddd | 15.0, 5.4, 0.6 | 140.8 | (d) | 5.83 | ddq | 8.8, 5.4, 2.4 | 134.3 | (d) |
| 16 | 4.21 | m | 67.8 | (d) | 4.17 | m | 68.0 | (d) | 2.48 | m | 43.7 | (d) | |||
| 17 | 1.16 | d | 6.6 | 24.2 | (q) | 1.14 | d | 6.6 | 23.9 | (q) | 1.20 | d | 7.2 | 15.3 | (q) |
| 18 | 207.1 | (s) | 207.8 | (s) | 81.2 | (s) | |||||||||
| 19 | 3.66 | d | 6.8 | 70.4 | (d) | 3.93 | d | 4.2 | 69.7 | (d) | 173.3 | (d) | |||
| 20 | 3.99 | m | 67.9 | (d) | 3.98 | m | 67.4 | (d) | |||||||
| 21 | 1.25 | d | 6.0 | 20.4 | (q) | 1.27 | d | 6.0 | 20.7 | (q) | |||||
| 22 | 170.7 | (s) | 170.2 | (s) | 177.5 | (s) | |||||||||
| 23 | 0.91 | d | 6.6 | 22.6 | (q) | 0.92 | d | 6.6 | 22.6 | (q) | 0.89 | d | 6.6 | 22.8 | (q) |
| 24 | 0.99 | s | 16.0 | (q) | 0.99 | s | 16.1 | (q) | 1.05 | s | 17.3 | (q) | |||
| 16-OH | 3.79 | d | 5.0 | 3.47 | br s | ||||||||||
| 20-OH | 4.17 | d | 6.0 | 4.02 | br s | ||||||||||
| NH | 8.01 | br s | 8.02 | br s | |||||||||||
| Position | 4 | 5 | ||||||||
|---|---|---|---|---|---|---|---|---|---|---|
| 1Ha (J,Hz) | 13Cb | 1Ha (J,Hz) | 13Cb | |||||||
| 1α | 1.67 | m | 27.6 | (t) | 1.91 | dq | 12.6, 3.6 | 28.0 | (t) | |
| 1β | 1.20 | qd | 12.6, 3.6 | 1.20 | qd | 12.6, 3.6 | ||||
| 2α | 0.85 | qd | 12.6, 3.6 | 36.1 | (t) | 0.90 | m | 36.2 | (t) | |
| 2β | 1.72 | m | 1.73 | ddt | 11.4, 5.4, 3.6 | |||||
| 3 | 1.49 | m | 33.5 | (d) | 1.49 | m | 33.5 | (d) | ||
| 4α | 0.79 | q | 12.6 | 42.6 | (t) | 0.80 | q | 12 | 42.9 | (t) |
| 4β | 1.85 | ddd | 12.6, 5.4, 3.6 | 1.87 | ddd | 12.0, 5.8, 3.5 | ||||
| 5 | 2.08 | m | 39.1 | (d) | 2.09 | m | 38.6 | (d) | ||
| 6 | 5.48 | d | 10.2 | 133.3 | (d) | 5.49 | d | 10.2 | 133.5 | (d) |
| 7 | 6.04 | dd | 10.2, 3.0 | 127.7 | (d) | 6.07 | dd | 10.2, 3.0 | 127.4 | (d) |
| 8 | 141.5 | (s) | 140.1 | (s) | ||||||
| 9 | 50.7 | (s) | 50.6 | (s) | ||||||
| 10 | 1.70 | m | 44.7 | (d) | 1.37 | td | 12.6, 3.6 | 45.3 | (d) | |
| 11 | 208.4 | (s) | 205.2 | (s) | ||||||
| 12 | 70.5 | (s) | 72.7 | (s) | ||||||
| 13 | 3.71 | d | 9.6 | 43.6 | (d) | 3.96 | d | 9 | 41.5 | (d) |
| 14 | 5.52 | d | 1.8 | 124.6 | (d) | 5.70 | d | 1.8 | 126.9 | (d) |
| 15 | 5.37 | ddq | 16.8, 9.6, 1.8 | 128.4 | (d) | 5.37 | ddq | 16.8, 9.0, 1.8 | 129.4 | (d) |
| 16 | 5.57 | dq | 16.8, 6.6 | 131.0 | (d) | 5.62 | dq | 16.8, 6.6 | 129.9 | (d) |
| 17 | 1.62 | d | 6.6 | 18.0 | (q) | 1.59 | d | 6.6 | 17.9 | (q) |
| 18 | 208.4 | (s) | 204.7 | (s) | ||||||
| 19 | 3.49 | d | 7.2 | 69.9 | (d) | 3.81 | d | 4.8 | 68.9 | (d) |
| 20 | 3.99 | m | 68.1 | (d) | 3.90 | m | 67.0 | (d) | ||
| 21 | 1.28 | d | 6.6 | 20.2 | (q) | 1.29 | d | 6.0 | 20.8 | (q) |
| 22 | 168.1 | (s) | 170.7 | (s) | ||||||
| 23 | 0.89 | d | 6.6 | 22.6 | (q) | 0.89 | d | 6.6 | 22.6 | (q) |
| 24 | 1.12 | s | 17.4 | (q) | 1.12 | s | 16.6 | (q) | ||
| 20-OH | 4.06 | br s | 4.02 | d | 6.0 | |||||
| NH | 7.88 | br s | 7.86 | br s | ||||||
| Compounds | Cell line P388 | Cell line HL-60 | Cell line L1210 |
|---|---|---|---|
| IC50 (μM) a | IC50 (μM) a | IC50 (μM) a | |
| 1 | 36.2 | 21.5 | 22.1 |
| 2 | 20.0 | 12.1 | 8.0 |
| 3 | 61.2 | 41.6 | 27.1 |
| 4 | 9.7 | 6.1 | 8.4 |
| 5 | 15.5 | 6.2 | 10.3 |
| 5-Fluorouracil b | 7.2 | 4.5 | 1.1 |
© 2019 by the authors. Licensee MDPI, Basel, Switzerland. This article is an open access article distributed under the terms and conditions of the Creative Commons Attribution (CC BY) license (http://creativecommons.org/licenses/by/4.0/).
Share and Cite
Yamada, T.; Tanaka, A.; Nehira, T.; Nishii, T.; Kikuchi, T. Altercrasins A–E, Decalin Derivatives, from a Sea-Urchin-Derived Alternaria sp.: Isolation and Structural Analysis Including Stereochemistry. Mar. Drugs 2019, 17, 218. https://doi.org/10.3390/md17040218
Yamada T, Tanaka A, Nehira T, Nishii T, Kikuchi T. Altercrasins A–E, Decalin Derivatives, from a Sea-Urchin-Derived Alternaria sp.: Isolation and Structural Analysis Including Stereochemistry. Marine Drugs. 2019; 17(4):218. https://doi.org/10.3390/md17040218
Chicago/Turabian StyleYamada, Takeshi, Asumi Tanaka, Tatsuo Nehira, Takumi Nishii, and Takashi Kikuchi. 2019. "Altercrasins A–E, Decalin Derivatives, from a Sea-Urchin-Derived Alternaria sp.: Isolation and Structural Analysis Including Stereochemistry" Marine Drugs 17, no. 4: 218. https://doi.org/10.3390/md17040218
APA StyleYamada, T., Tanaka, A., Nehira, T., Nishii, T., & Kikuchi, T. (2019). Altercrasins A–E, Decalin Derivatives, from a Sea-Urchin-Derived Alternaria sp.: Isolation and Structural Analysis Including Stereochemistry. Marine Drugs, 17(4), 218. https://doi.org/10.3390/md17040218