Selective Inhibition of Liver Cancer Cells Using Venom Peptide

 , ,
, ,  and
and 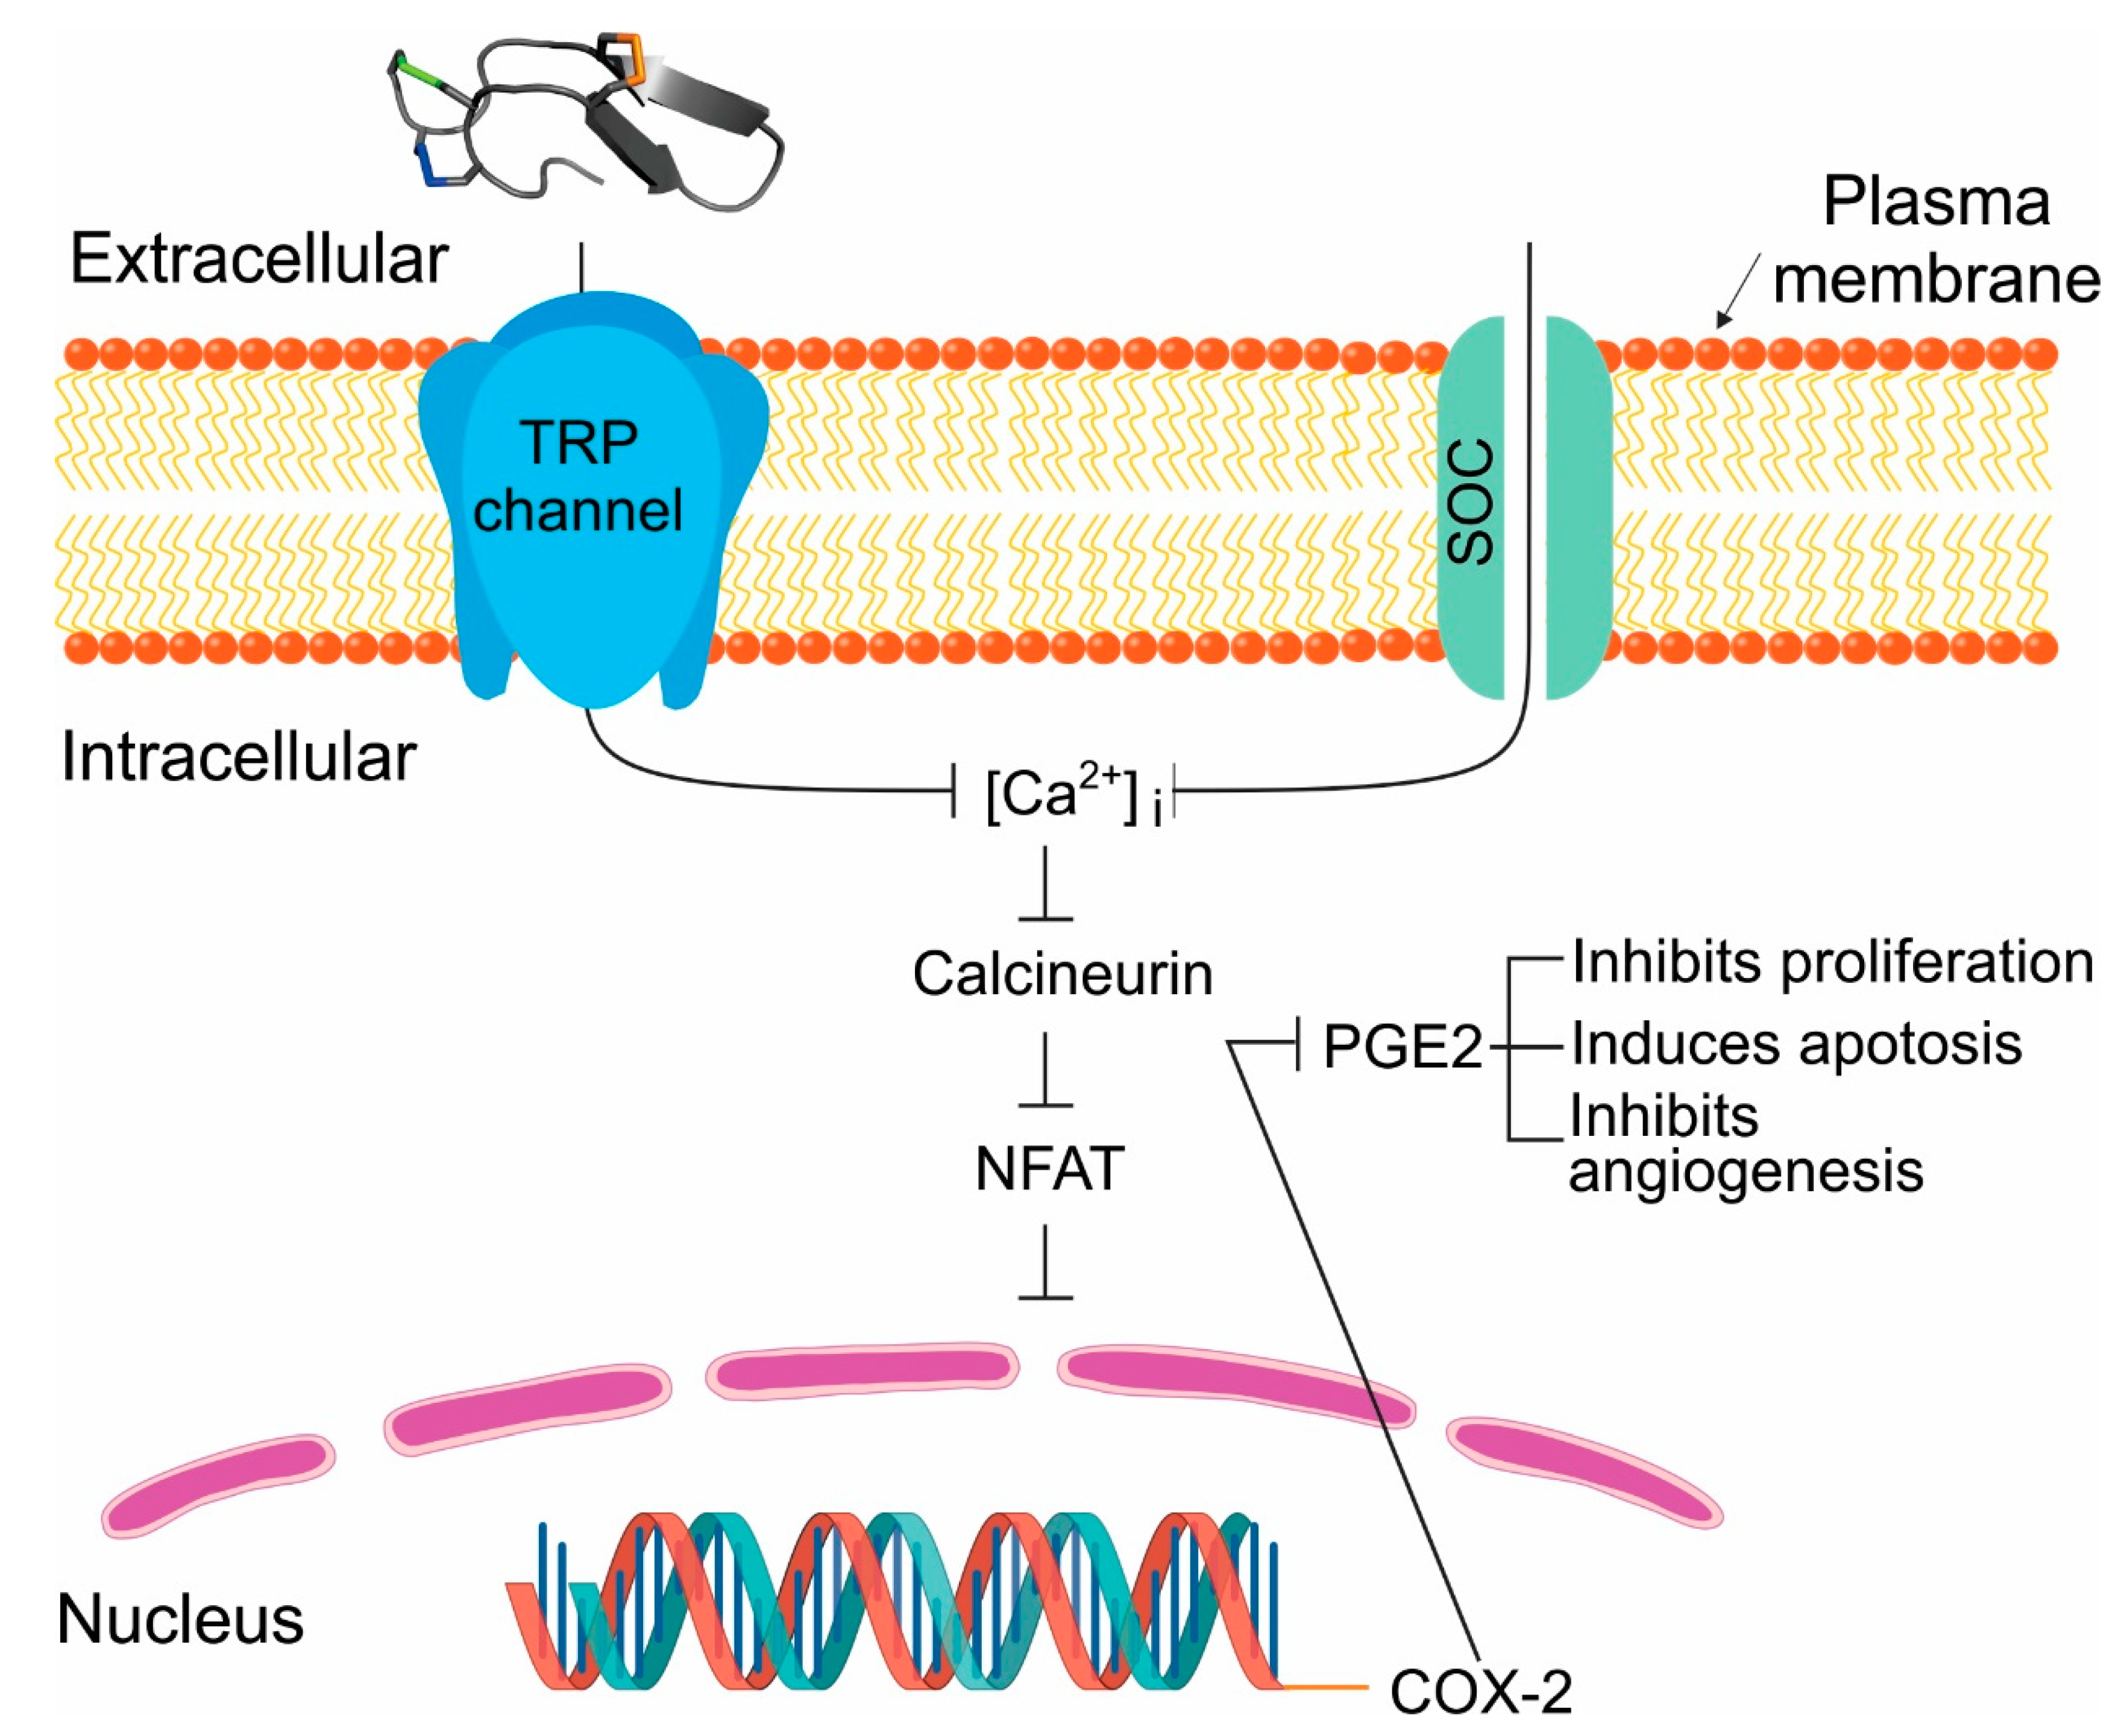
Abstract
1. Introduction
2. Results
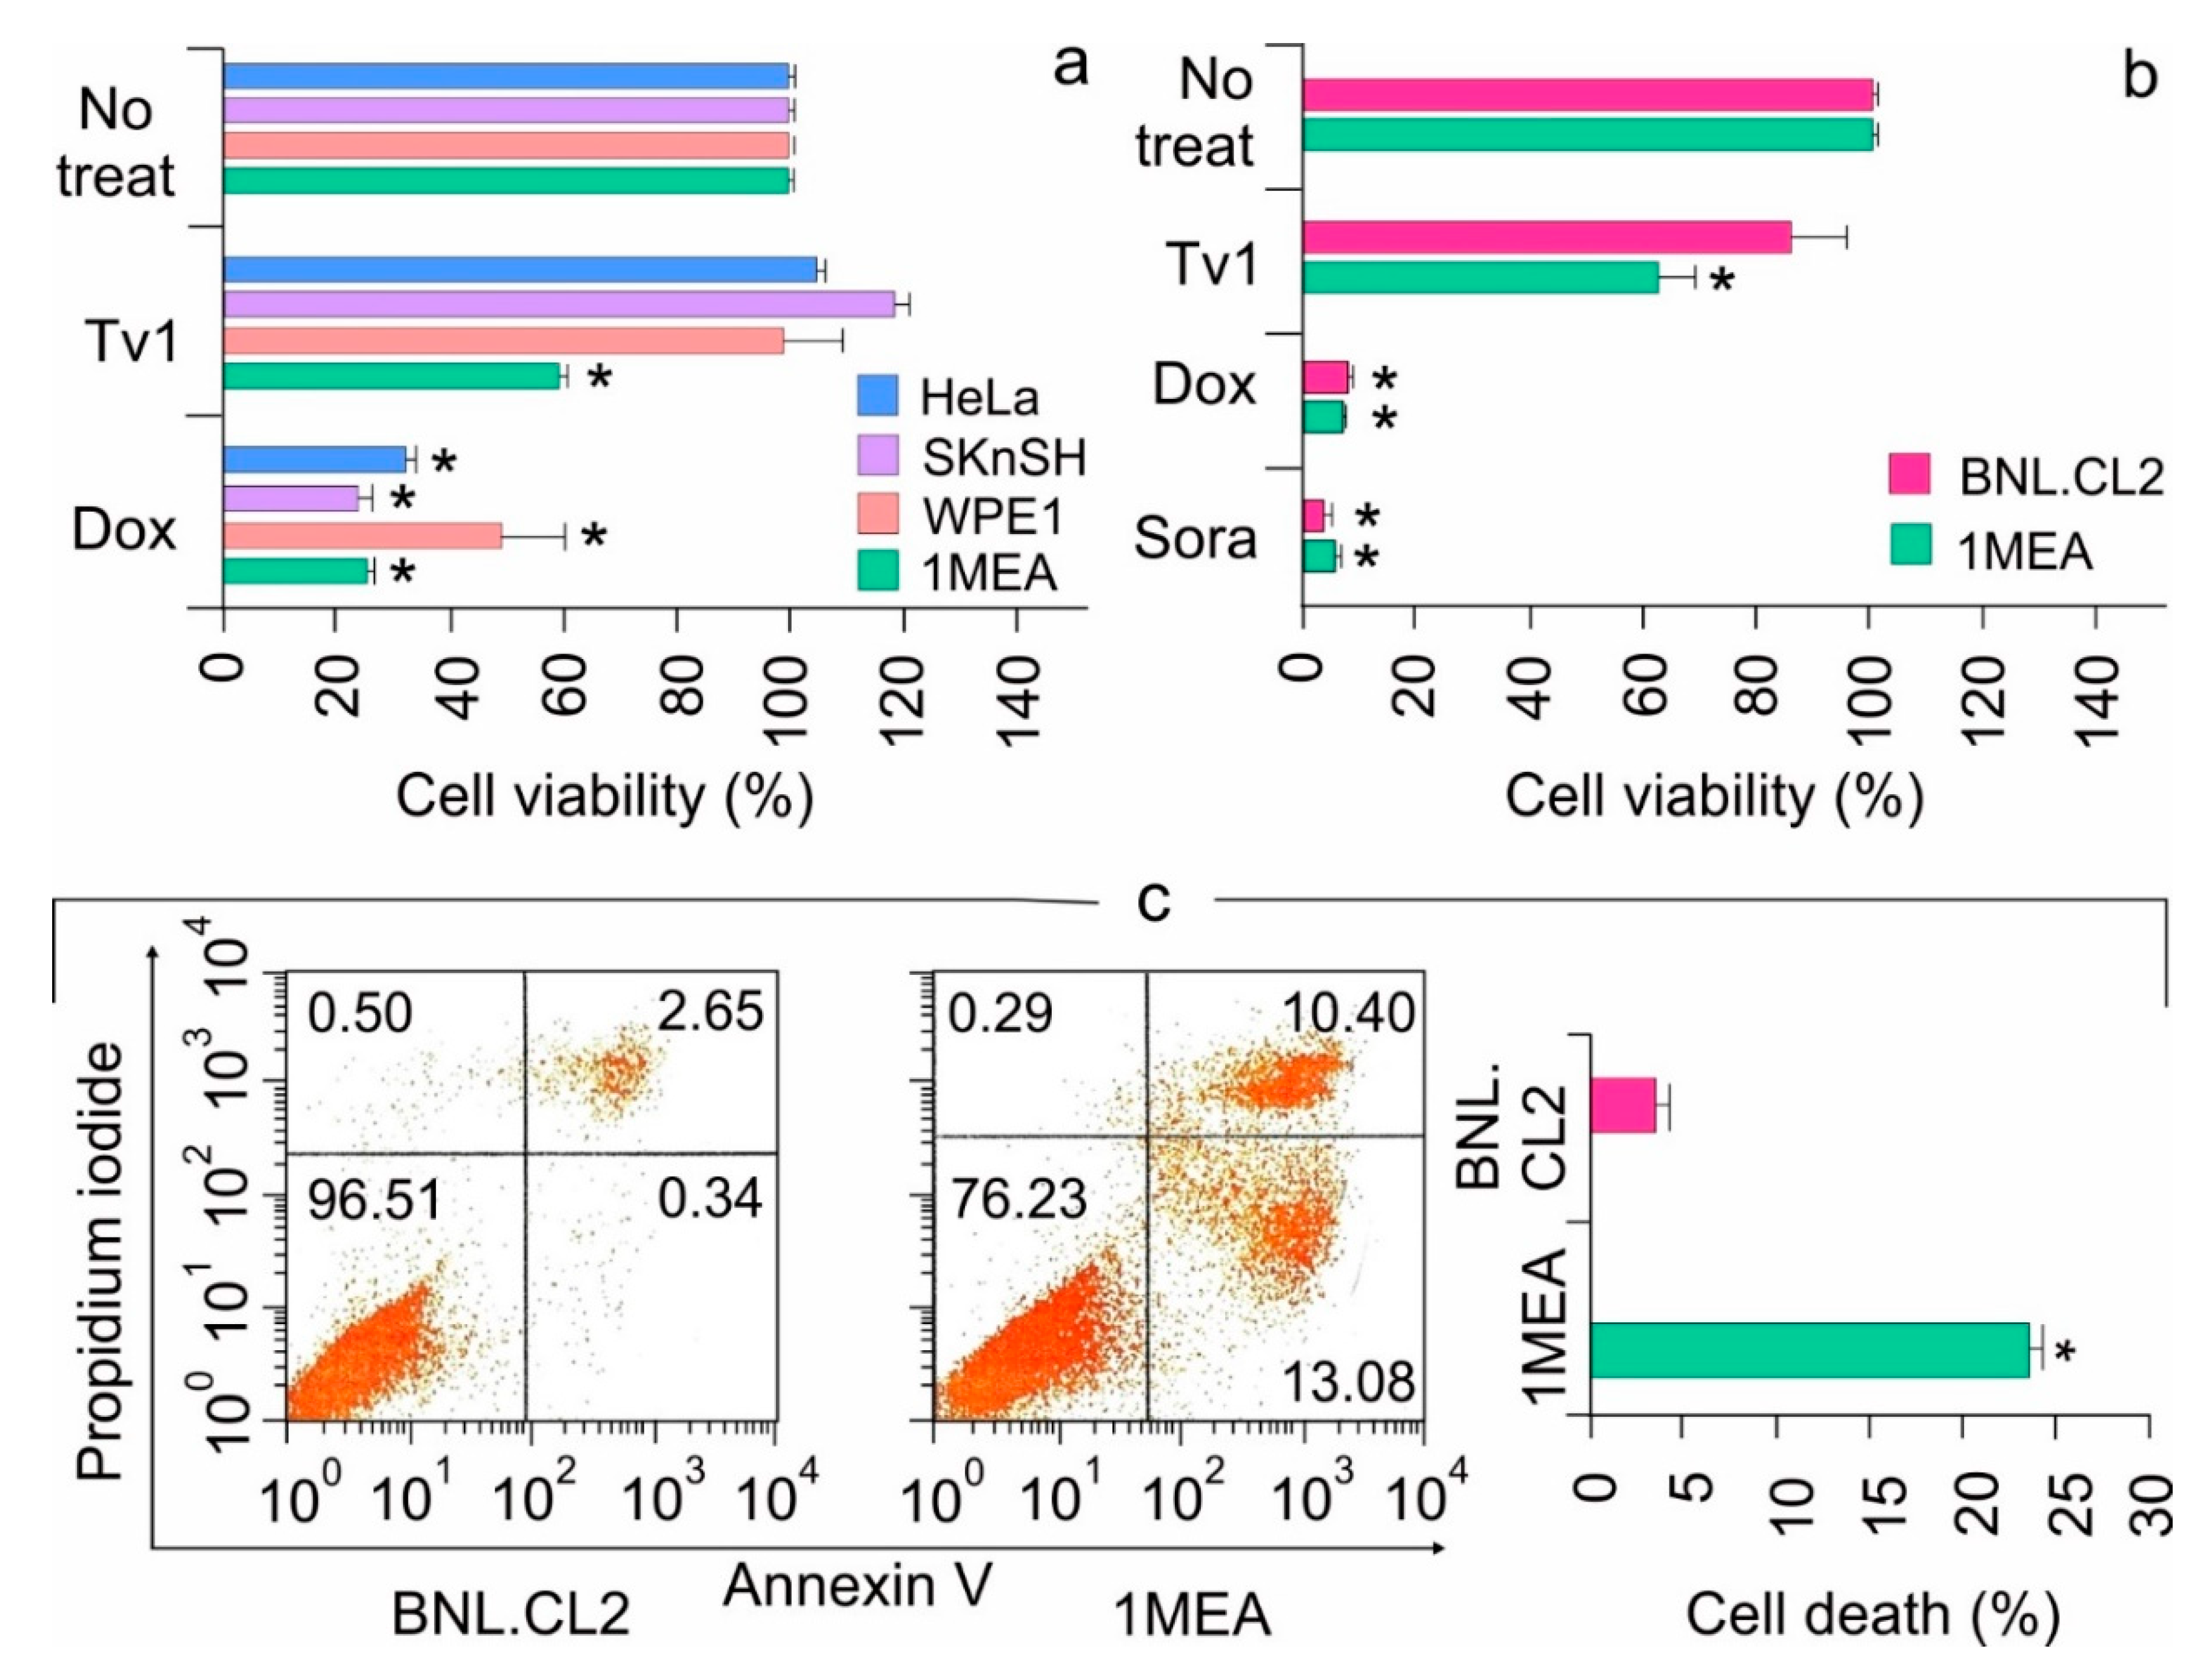
2.1. Tv1 Shows Selective Cytotoxicity in Liver Cancer Cells
2.2. Tv1 Induced Apoptotic Death of Liver Cancer Cells and Inhibited Migration
2.3. Tv1 Has Antitumor Activity in an Allograft Tumor Mouse Model
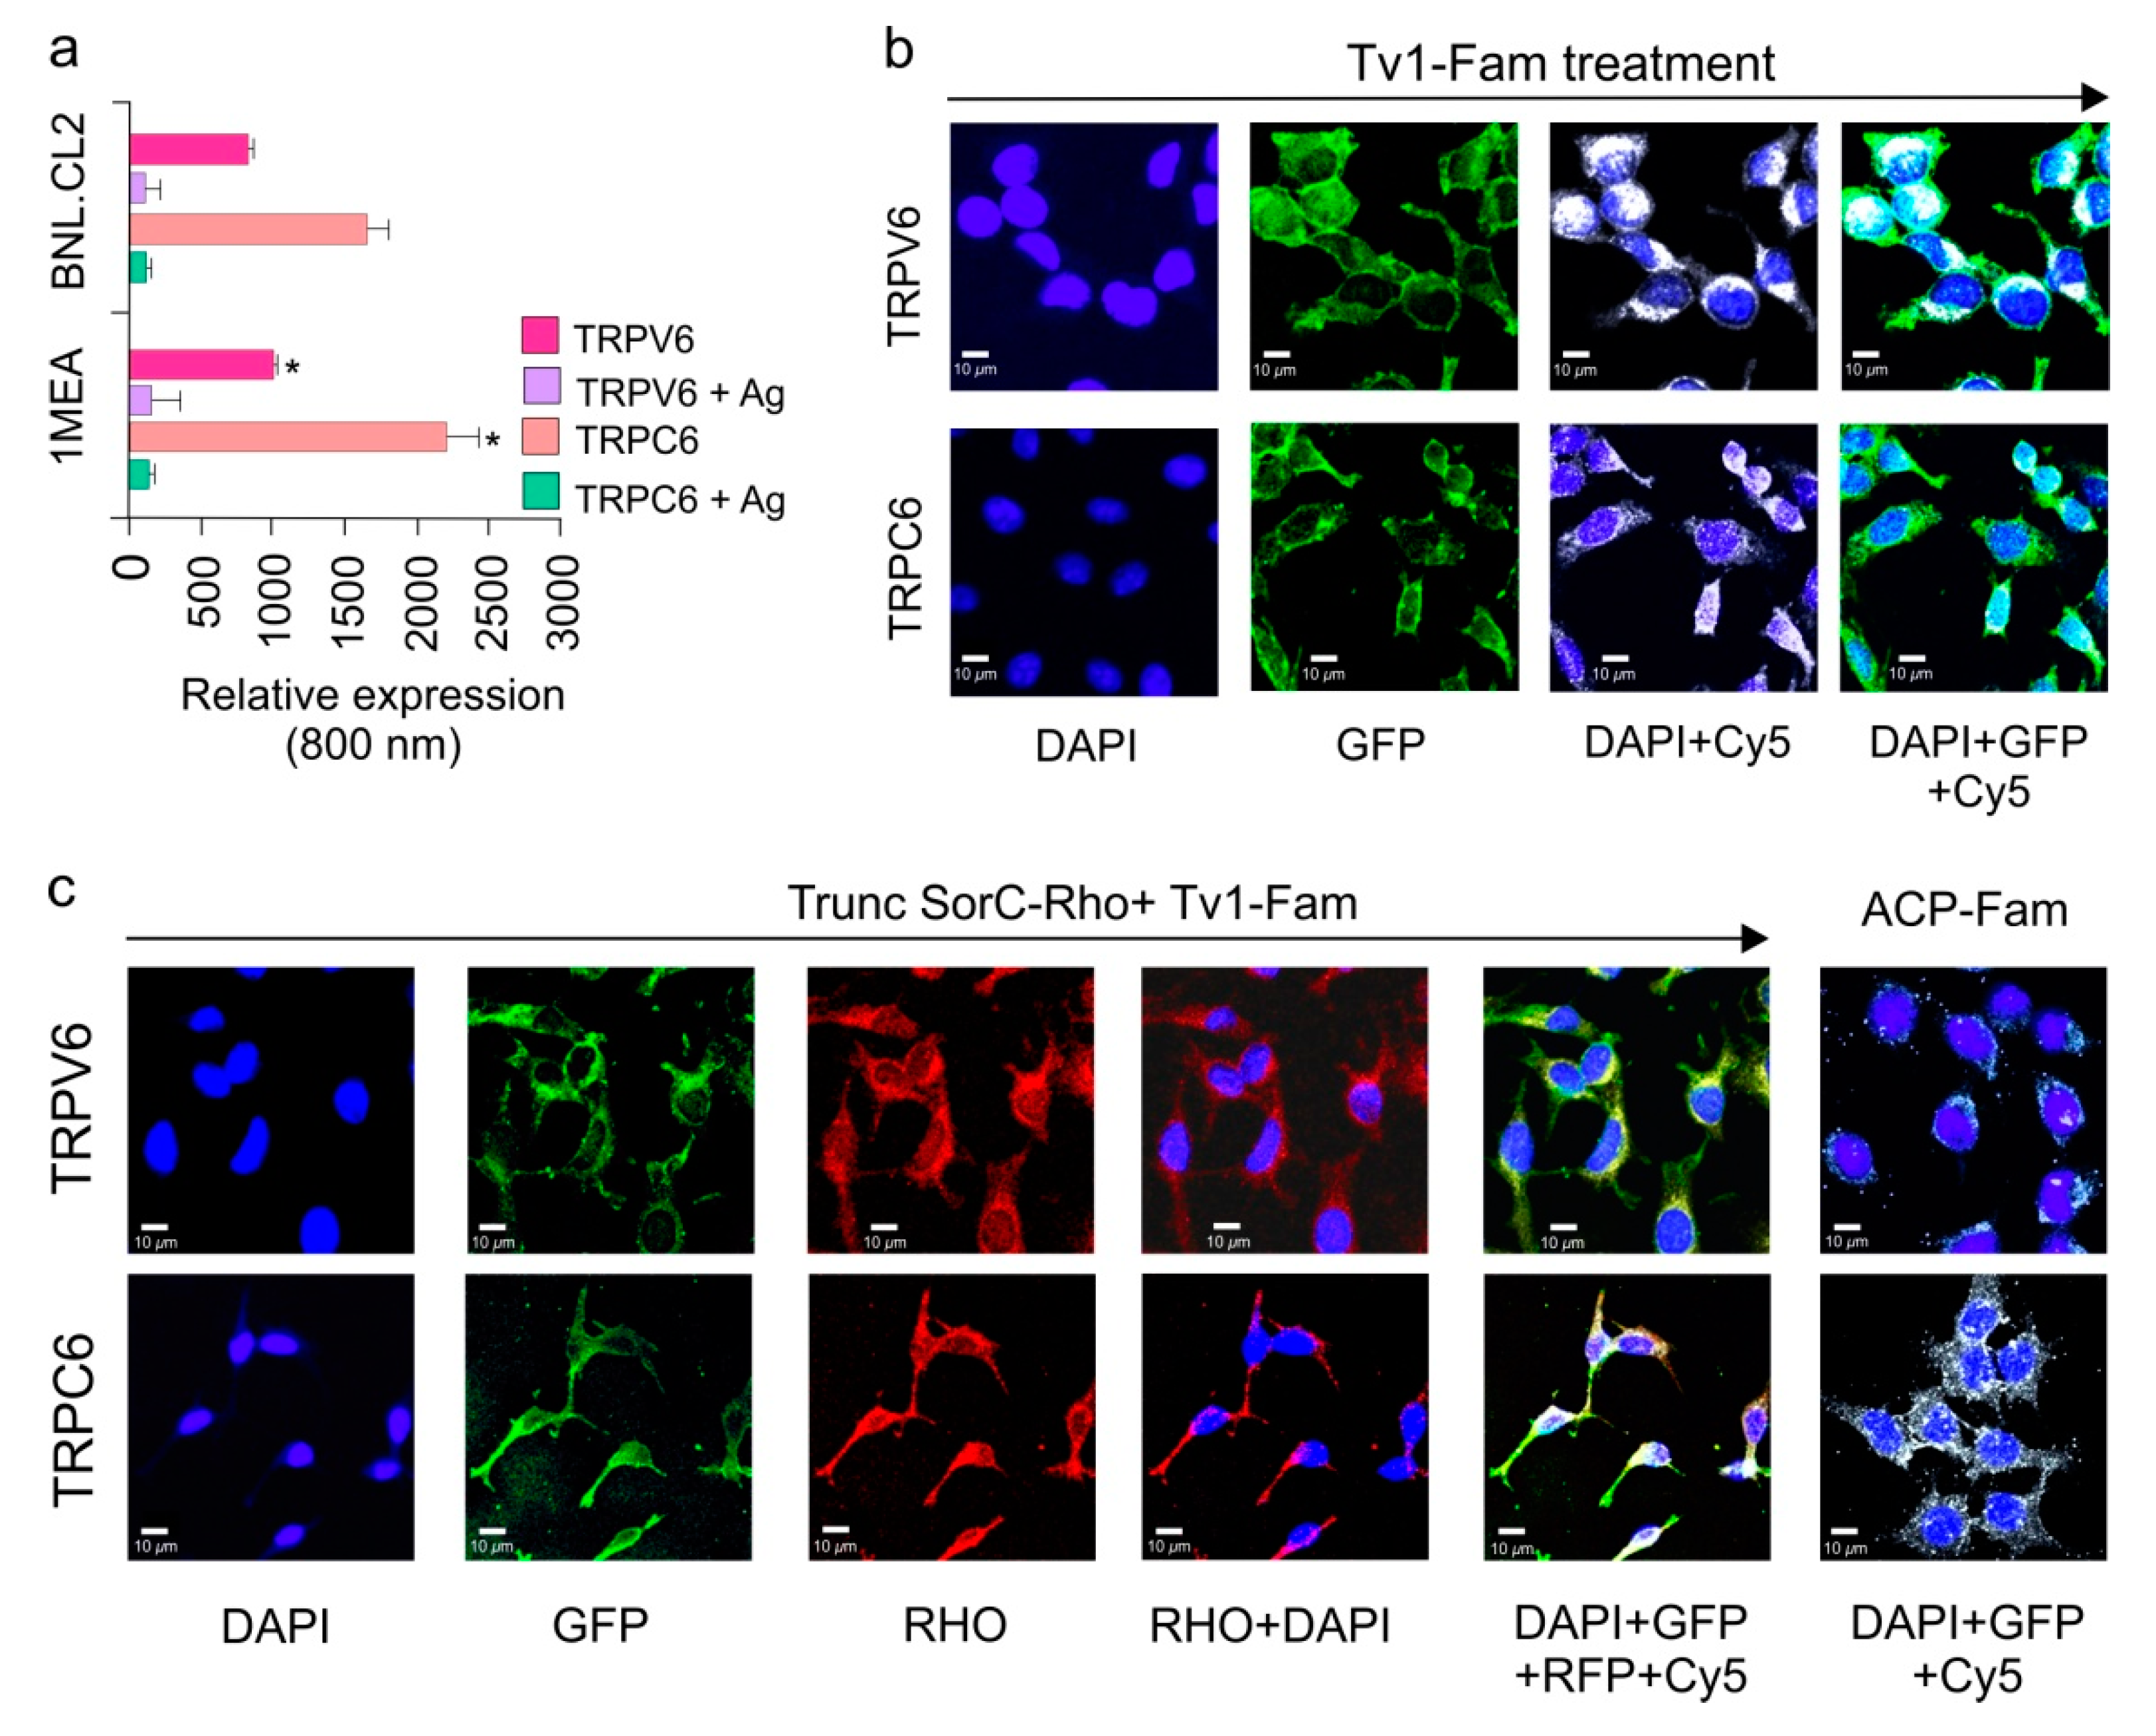
2.4. TRPC6 and TRPV6 Ion Channels Are Overexpressed in 1MEA Cells
2.5. Tv1 Co-Localizes with TRP Channel Subtypes
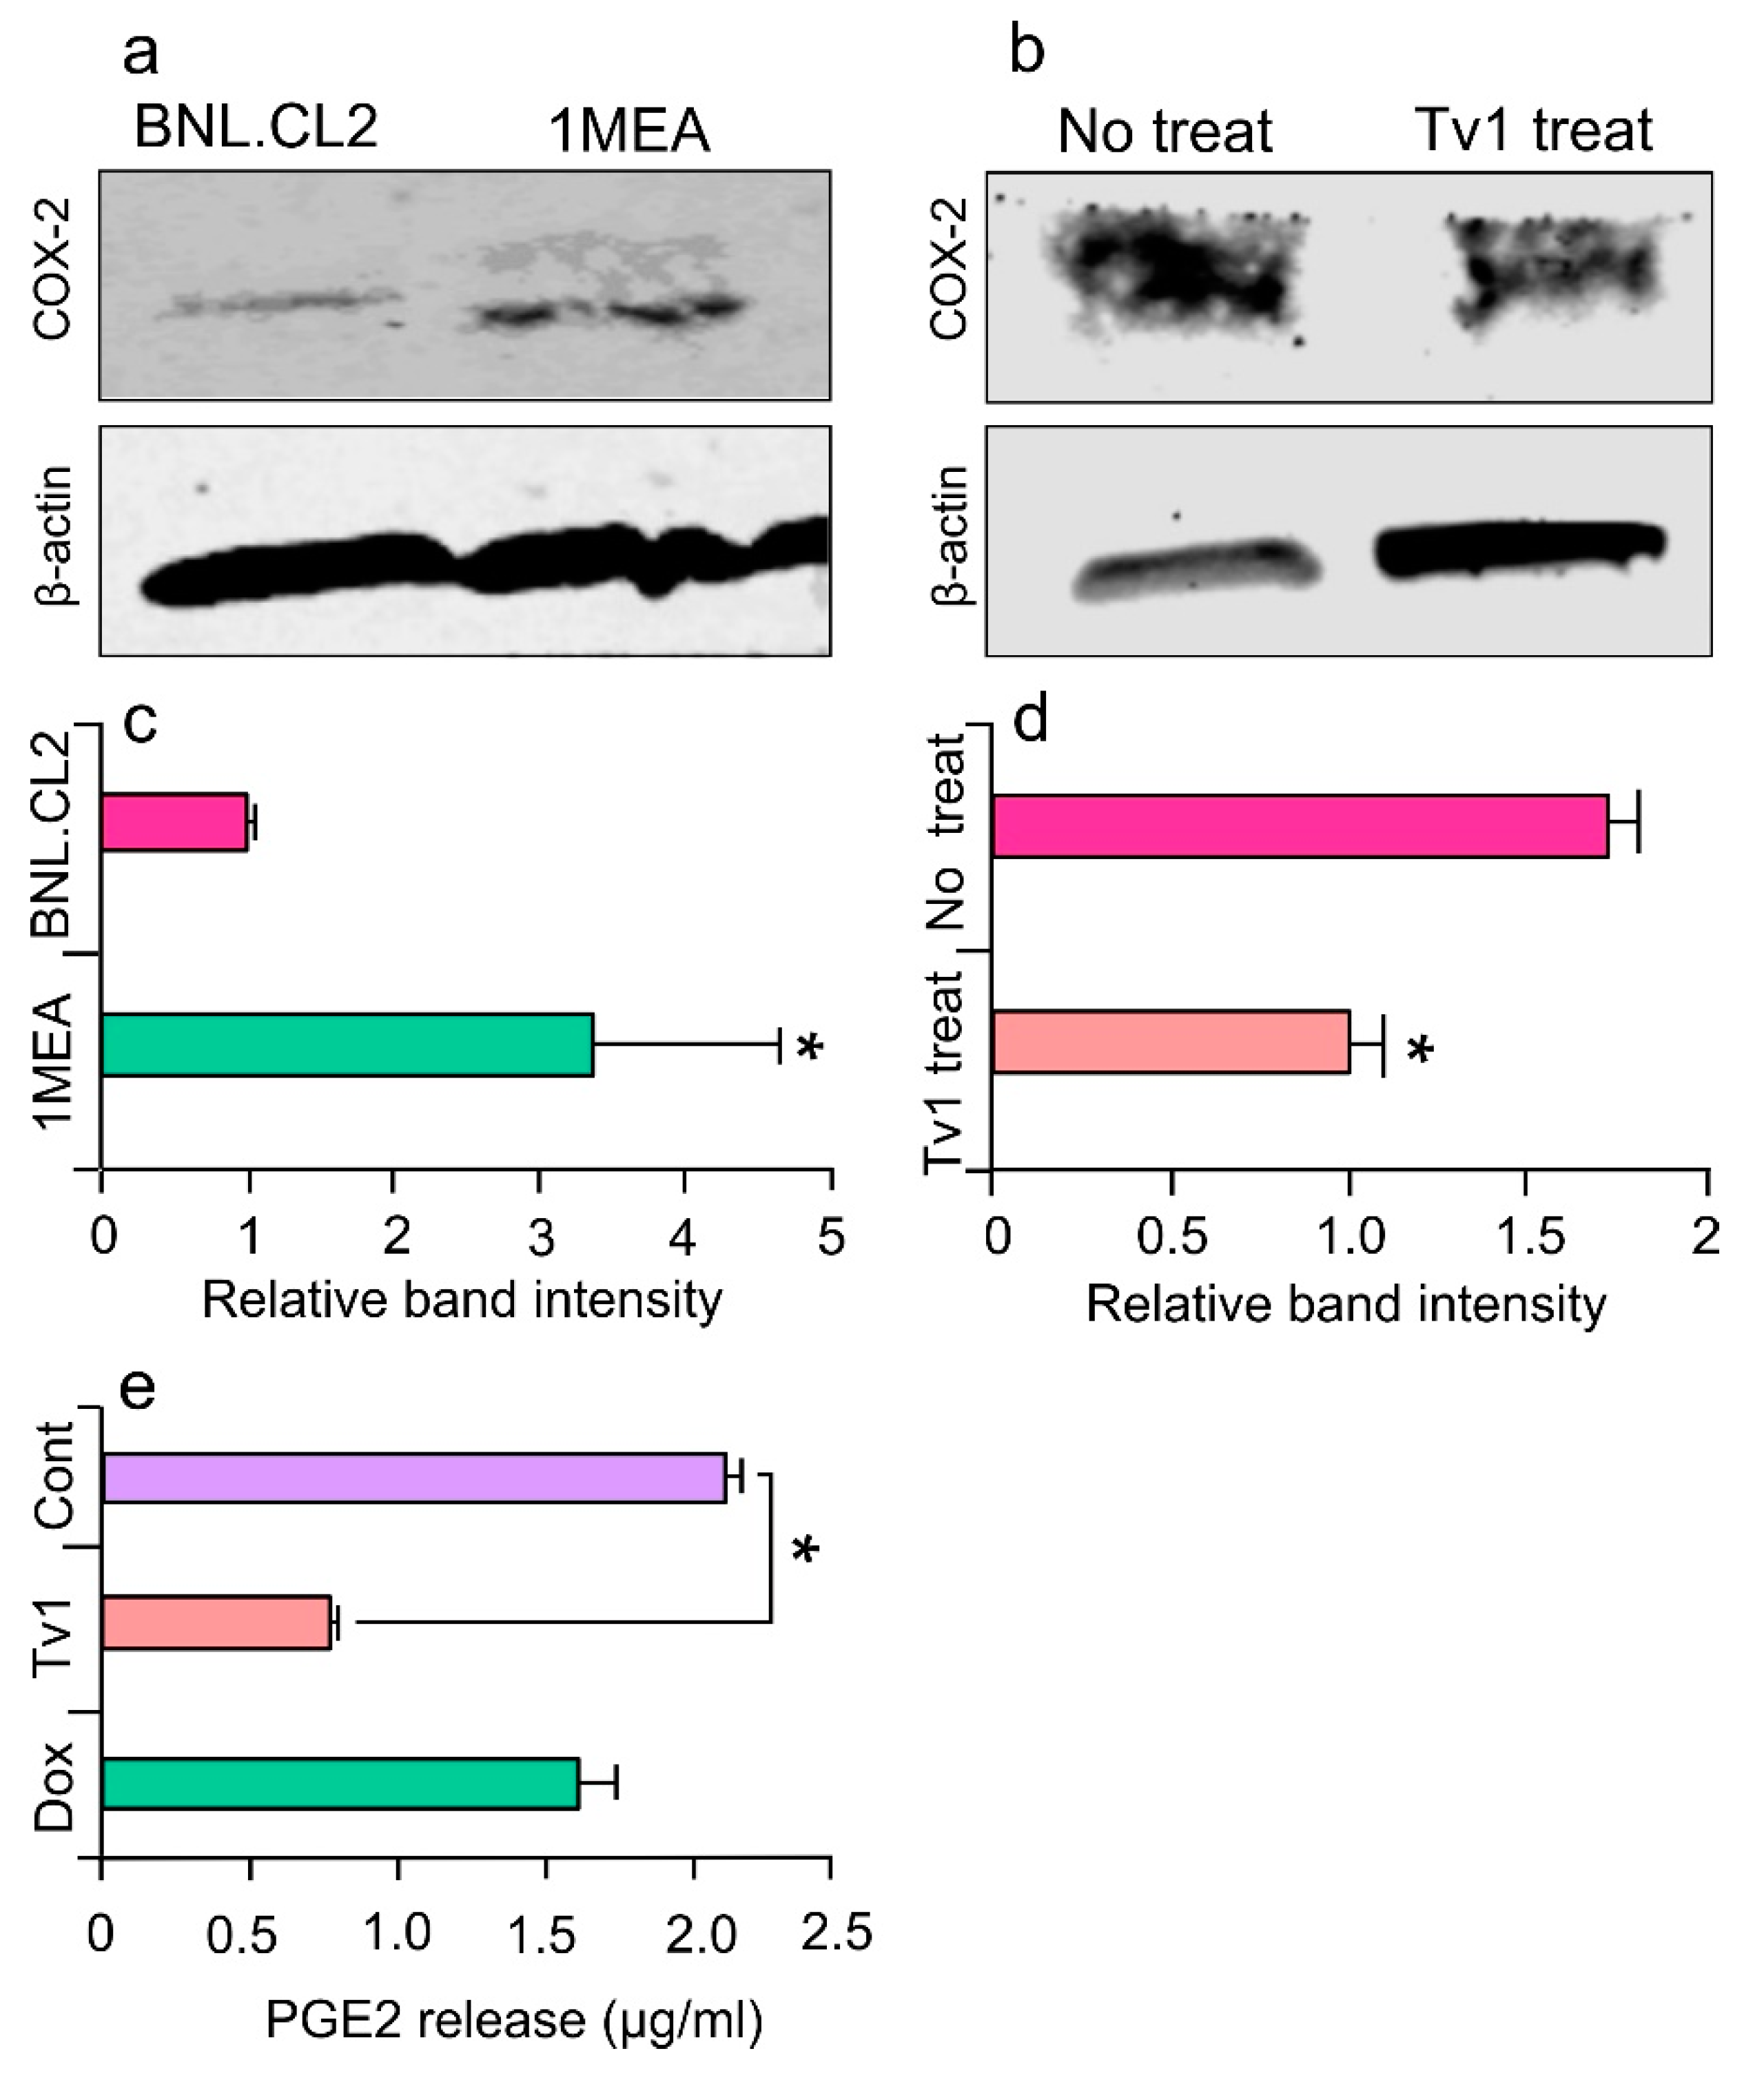
2.6. Tv1 Inhibited COX-2 Expression and Bioactivity
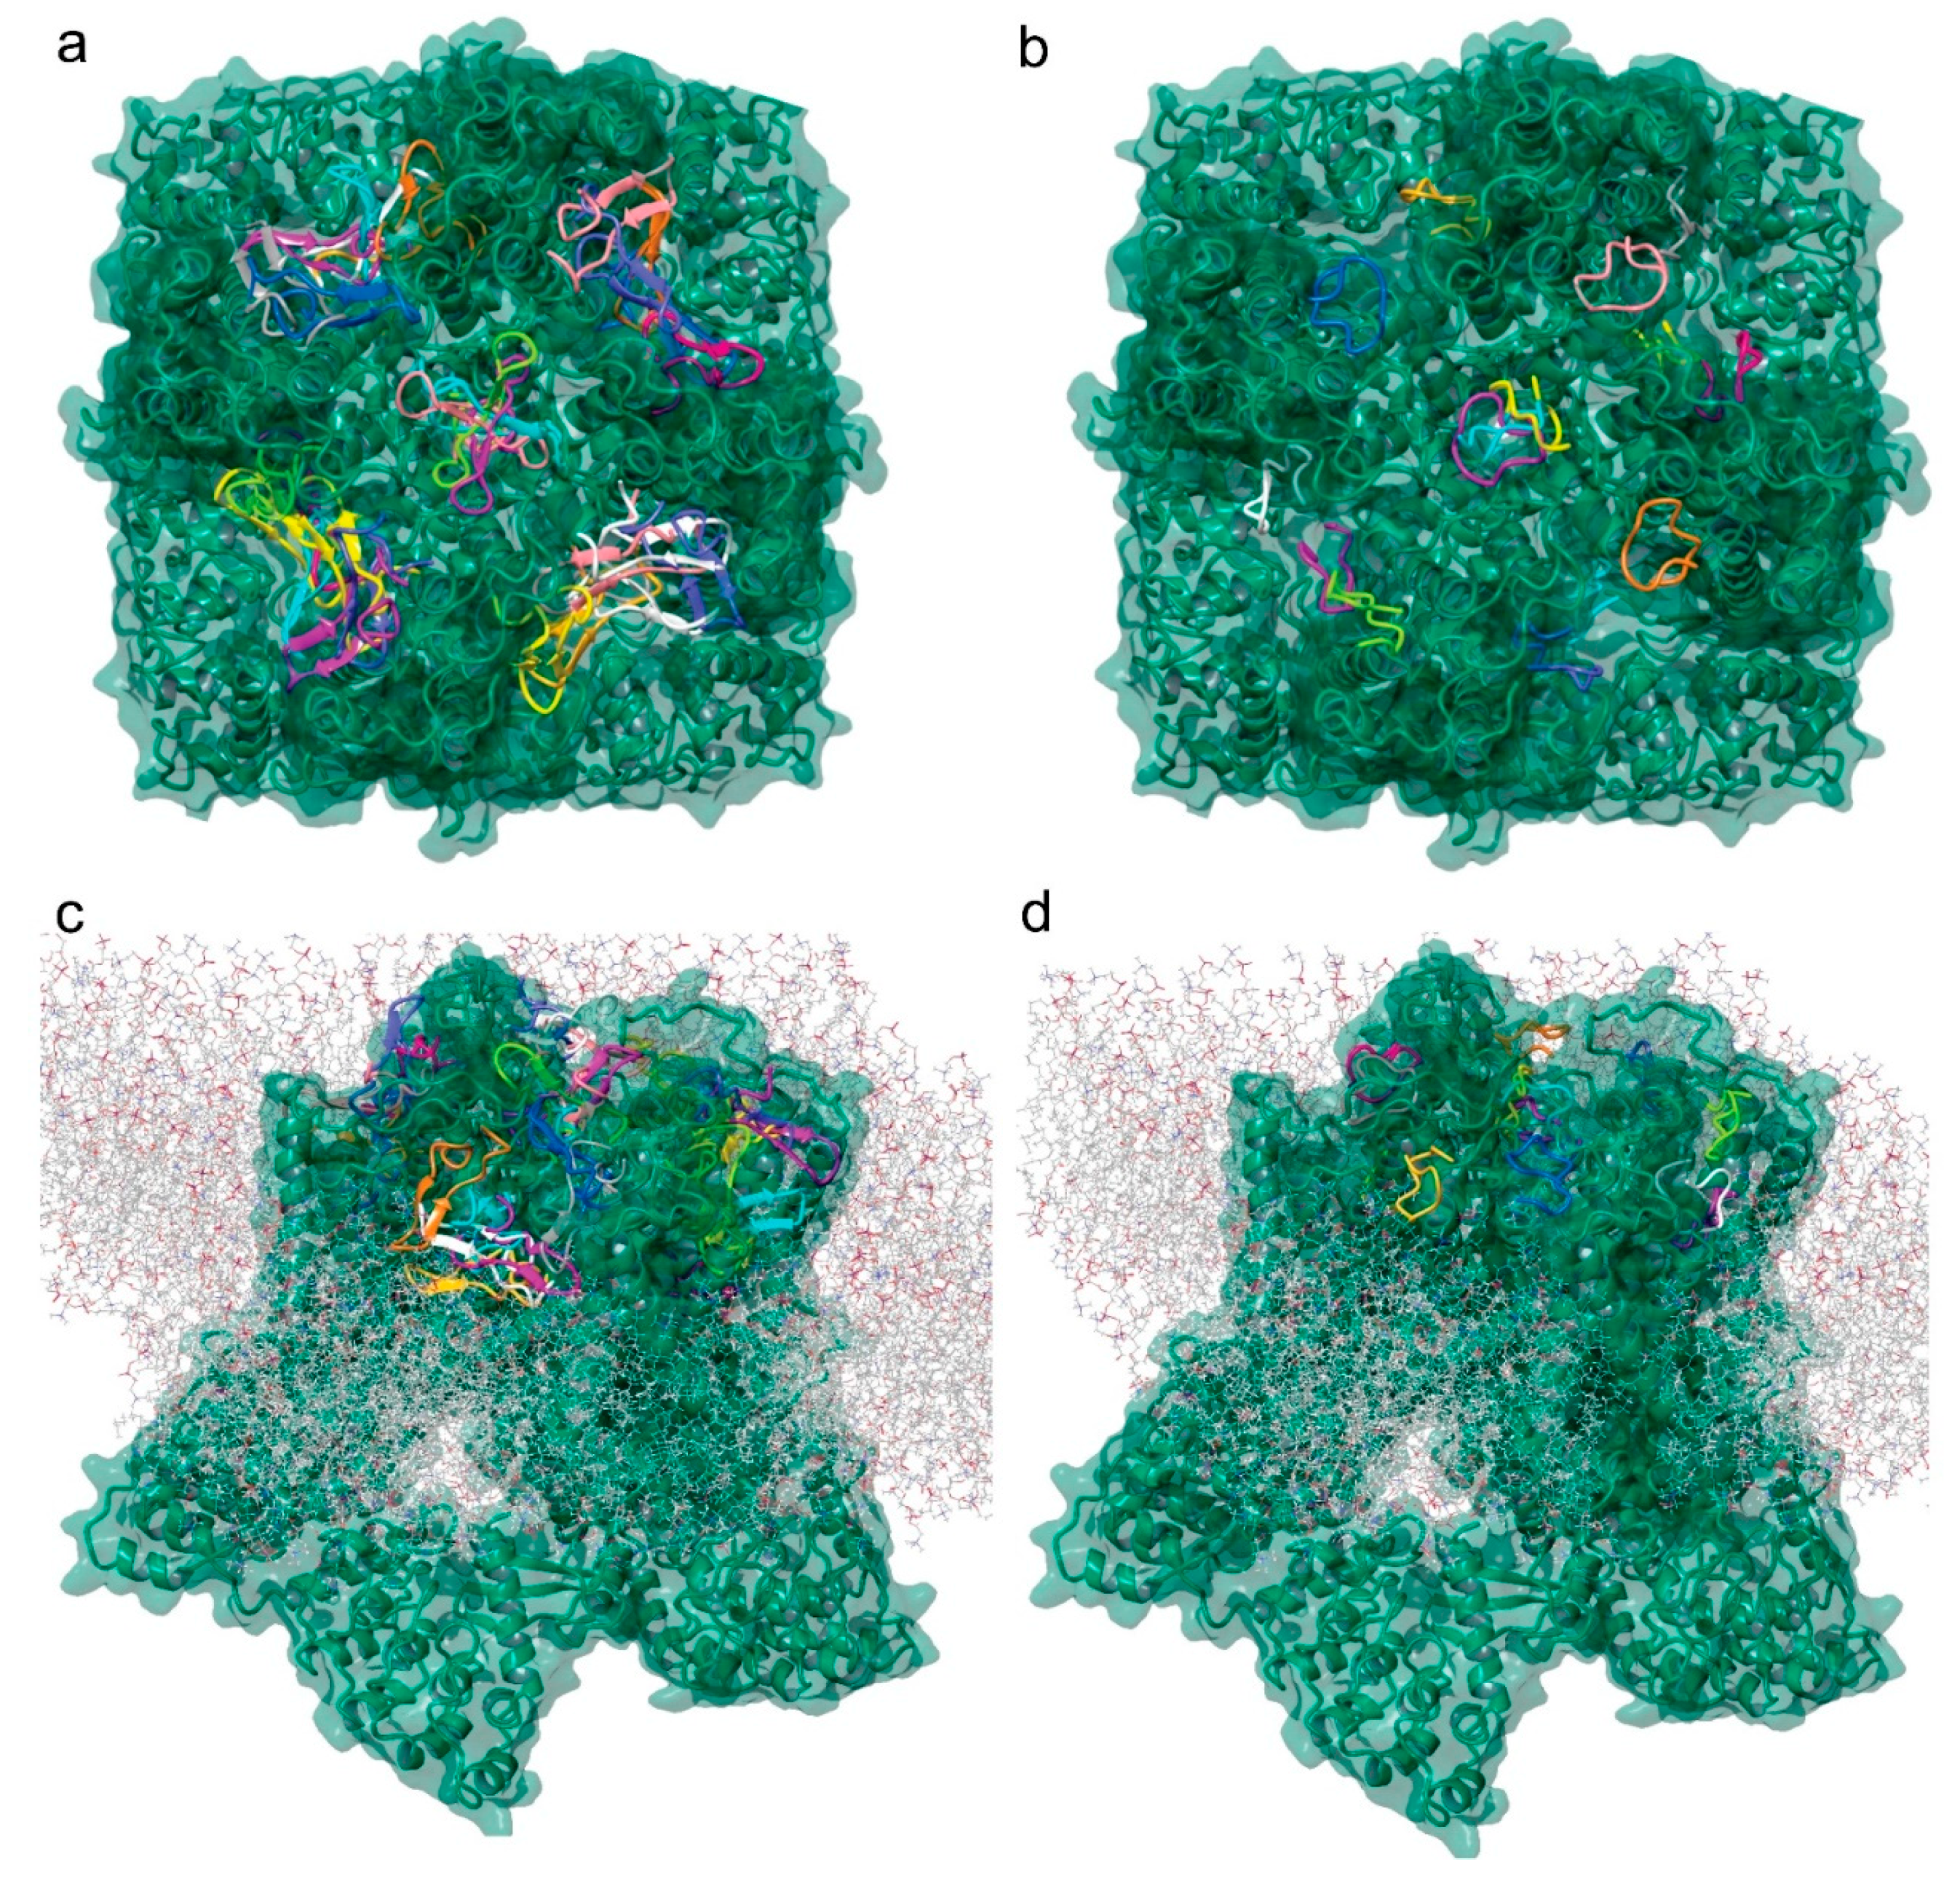
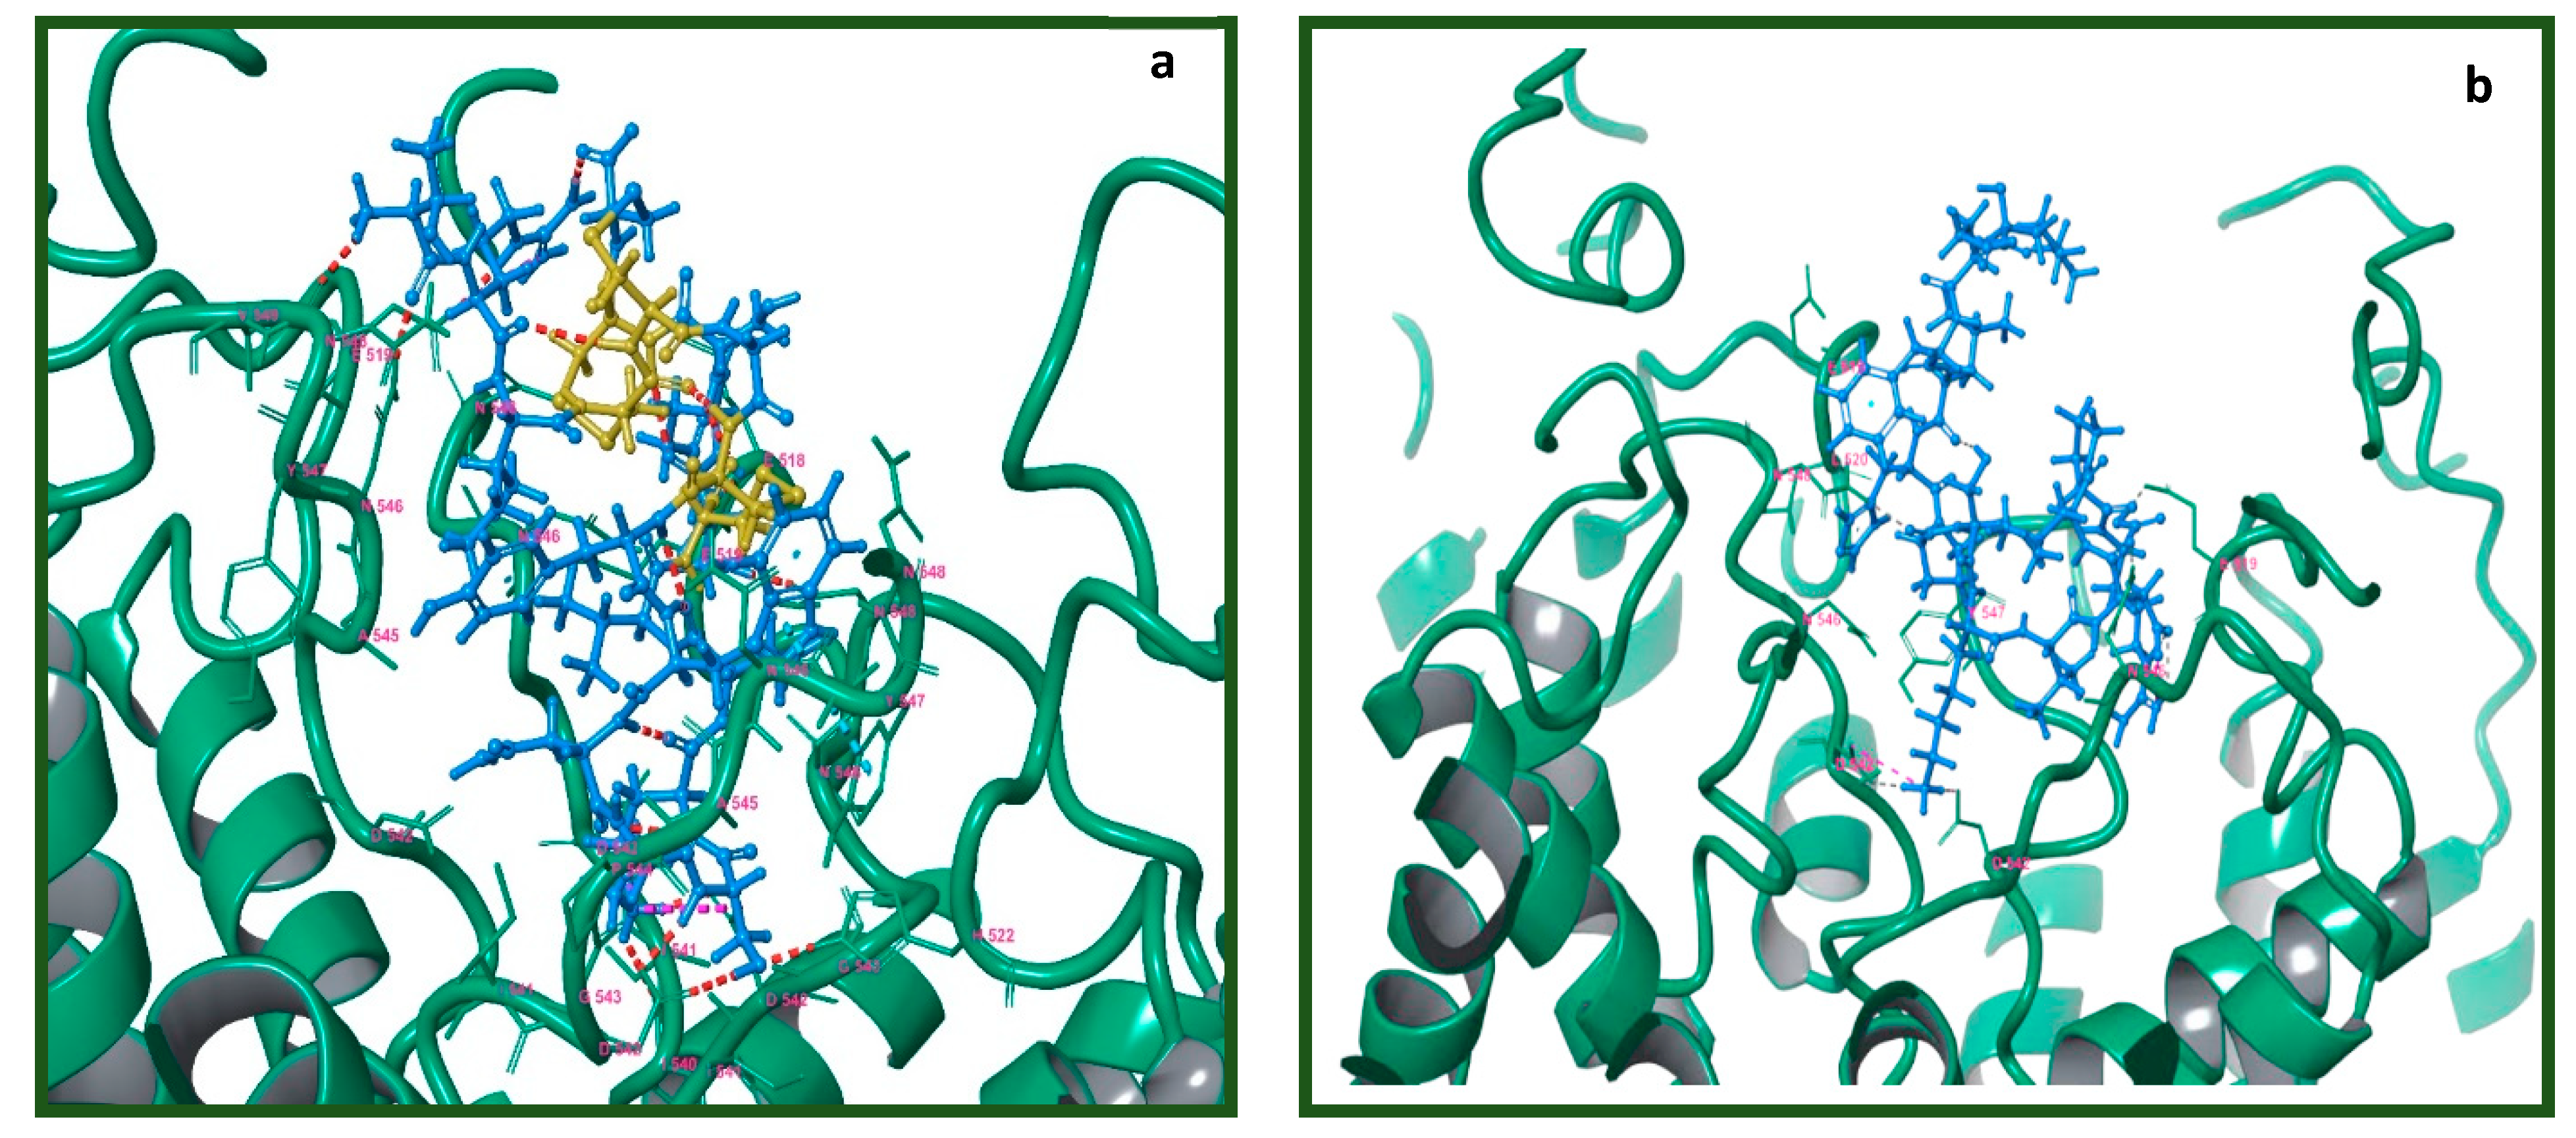
2.7. Molecular Modeling of the Tv1/TRPV6 Interaction
2.8. Mutational Analysis of the Tv1/TRPV6 Interaction
3. Discussion
4. Experimental Procedures
4.1. Tissue Culture and Reagents
4.2. Synthesis, Purification, and Characterization of Tv1
4.3. Fluorescent Labeling of Oxidized Tv1 Peptide
4.4. Synthesis and Rhodamine Labeling of Truncated Soricidin (TruncSorC) Peptide
4.5. Synthesis of a Non-Specific Fluorescent Peptide ACPK-Fam
4.6. In Vitro Cell Viability or MTT Assay
4.7. Flow Cytometry
4.8. Migration Assay
4.9. Antitumor Activity in Allograft Transplantation Models
4.10. In Cell Western Assay
4.11. Immunofluorescence Assay
4.12. Confocal Imaging and Colocalization Analyses
4.13. Analysis of Co-Localization using Manders Overlap Coefficient
4.14. Whole-cell Protein Extraction and Immunoblotting
4.15. Prostaglandin E2 (PGE2) Release
4.16. Statistical Analysis
4.17. Model Preparation and Docking
4.18. Molecular Dynamics (MD) Simulation
Supplementary Materials
Author Contributions
Funding
Conflicts of Interest
References
- Tabrizian, P.; Roayaie, S.; Schwartz, M.E. Current Management of Hepatocellular Carcinoma. World J. Gastroenterol. 2014, 20, 10223–10237. [Google Scholar] [CrossRef] [PubMed]
- Dardevet, L.; Rani, D.; El Aziz, T.A.; Bazin, I.; Sabatier, J.M.; Fadl, M.; Brambilla, E.; De Waard, M. Chlorotoxin: A Helpful Natural Scorpion Peptide to Diagnose Glioma and Fight Tumor Invasion. Toxins 2015, 7, 1079–1101. [Google Scholar] [CrossRef] [PubMed]
- Oršolić, N. Bee Venom in Cancer Therapy. Cancer Metastasis Rev. 2012, 31, 173–194. [Google Scholar] [CrossRef] [PubMed]
- Mahadevappa, R.; Ma, R.; Kwok, H.F. Venom Peptides: Improving Specificity in Cancer Therapy. Trends Cancer 2017, 3, 611–614. [Google Scholar] [CrossRef] [PubMed]
- Dubovskii, P.V.; Vassilevski, A.A.; Kozlov, S.A.; Feofanov, A.V.; Grishin, E.V.; Efremov, R.G. Latarcins: Versatile Spider Venom Peptides. Cell. Mol. Life Sci. 2015, 72, 4501–4522. [Google Scholar] [CrossRef]
- Moreno, M.; Giralt, E. Three Valuable Peptides from Bee and Wasp Venoms for Therapeutic and Biotechnological Use: Melittin, Apamin and Mastoparan. Toxins 2015, 7, 1126–1150. [Google Scholar] [CrossRef]
- Kim, J.W.; Lee, H.S. Tumor Targeting by Doxorubicin-RGD-4C Peptide Conjugate in an Orthotopic Mouse Hepatoma Model. Int. J. Mol. Med. 2004, 14, 529–535. [Google Scholar] [CrossRef]
- Mas-Moruno, C.; Rechenmacher, F.; Kessler, H. Cilengitide: The First Anti-Angiogenic Small Molecule Drug Candidate Design, Synthesis and Clinical Evaluation. Anticancer. Agents Med. Chem. 2010, 10, 753–768. [Google Scholar] [CrossRef]
- Corti, A.; Fiocchi, M.; Curnis, F. Targeting CD13 with Asn-Gly-Arg (NGR) Peptide-Drug Conjugates. In Next-Generation Therapies and Technologies for Immune-Mediated Inflammatory Diseases; Springer: Berlin/Heidelberg, Germany, 2017. [Google Scholar]
- Veiseh, M.; Gabikian, P.; Bahrami, S.-B.B.; Veiseh, O.; Zhang, M.; Hackman, R.C.; Ravanpay, A.C.; Stroud, M.R.; Kusuma, Y.; Hansen, S.J.; et al. Tumor Paint: A Chlorotoxin: Cy5.5 Bioconjugate for Intraoperative Visualization of Cancer Foci. Cancer Res. 2007, 67, 6882–6888. [Google Scholar] [CrossRef]
- Nelson, R. Tumor Paint Lights Up Cancer Cells, Facilitates Surgery. Available online: https://www.medscape.com/viewarticle/827738 (accessed on 11 October 2019).
- Ortiz, E.; Gurrola, G.B.; Schwartz, E.F.; Possani, L.D. Scorpion Venom Components as Potential Candidates for Drug Development. Toxicon 2015, 93, 125–135. [Google Scholar] [CrossRef]
- Olivera, B.M. ω-Conotoxin MVIIA: From Marine Snail Venom to Analgesic Drug. In Drugs From the Sea; Fusetani, N., Ed.; Karger: Basel, Switzerland, 2000; pp. 75–85. [Google Scholar]
- Dave, K.; Lahiry, A. Conotoxins: Review and Docking Studies to Determine Potentials of Conotoxin as an Anticancer Drug Molecule. Curr. Top. Med. Chem. 2012, 12, 845–851. [Google Scholar] [CrossRef] [PubMed]
- Huber, S.M. Oncochannels. Cell Calcium 2013, 53, 241–255. [Google Scholar] [CrossRef] [PubMed]
- Turner, K.L.; Sontheimer, H. Cl-and K+ Channels and Their Role in Primary Brain Tumour Biology. Phil. Trans. R. Soc. B 2014, 369, 20130095. [Google Scholar] [CrossRef] [PubMed]
- Bortner, C.D.; Cidlowski, J.A. Channels and Apoptosis in Cancer. Phil. Trans. R. Soc. B 2014, 369, 20130104. [Google Scholar] [CrossRef] [PubMed]
- Roderick, H.L.; Cook, S.J. Ca2+ Signalling Checkpoints in Cancer: Remodelling Ca2+ for Cancer Cell Proliferation and Survival. Nat. Rev. Cancer 2008, 8, 361–375. [Google Scholar] [CrossRef]
- Monteith, G.R.; Davis, F.M.; Roberts-Thomson, S.J. Calcium Channels and Pumps in Cancer: Changes and Consequences. J. Biol. Chem. 2012, 287, 31666–31673. [Google Scholar] [CrossRef]
- Bödding, M. TRP Proteins and Cancer. Cell. Signal. 2007, 19, 617–624. [Google Scholar] [CrossRef]
- Gkika, D.; Prevarskaya, N. TRP Channels in Prostate Cancer: The Good, the Bad and the Ugly? Asian J. 2011, 13, 673–676. [Google Scholar] [CrossRef]
- Nilius, B.; Owsianik, G. The Transient Receptor Potential Family of Ion Channels. Genome Biol. 2011, 12, 218. [Google Scholar] [CrossRef]
- Prevarskaya, N.; Skryma, R.; Shuba, Y. Calcium in Tumour Metastasis: New Roles for Known Actors. Nat. Rev. Cancer 2011, 11, 609–618. [Google Scholar] [CrossRef]
- Ouadid-Ahidouch, H.; Ahidouch, A. K+ Channels and Cell Cycle Progression in Tumor Cells. Front. Physiol. 2013, 4, 1–8. [Google Scholar] [CrossRef] [PubMed]
- Tian, Y.; Zhu, M.X. A Novel TRPC6-Dependent Mechanism of TGF-β-Induced Migration and Invasion of Human Hepatocellular Carcinoma. Cells 2018, 61, 1120–1122. [Google Scholar] [CrossRef] [PubMed]
- Song, J.; Wang, Y.; Li, X. Critical Role of TRPC6 Channels in the Development of Human Renal Cell Carcinoma. Mol. Biol. Rep. 2013, 40, 5115–5122. [Google Scholar] [CrossRef] [PubMed]
- Jiang, H.-N.; Zeng, B.; Zhang, Y.; Daskoulidou, N.; Fan, H.; Qu, J.-M.; Xu, S.-Z. Involvement of TRPC Channels in Lung Cancer Cell Differentiation and the Correlation Analysis in Human Non-Small Cell Lung Cancer. PLoS ONE 2013, 8, e67637. [Google Scholar] [CrossRef]
- Shapovalov, G.; Ritaine, A.; Skryma, R.; Prevarskaya, N. Role of TRP Ion Channels in Cancer and Tumorigenesis. Semin. Immunopathol. 2016, 38, 357–369. [Google Scholar] [CrossRef]
- Azimi, I.; Monteith, G.R. Plasma Membrane Ion Channels and Epithelial to Mesenchymal Transition in Cancer Cells. Endocr. Relat. Cancer 2016, 23, R517–R525. [Google Scholar] [CrossRef]
- Aydar, E.; Yeo, S.; Djamgoz, M.; Palmer, C. Abnormal Expression, Localization and Interaction of Canonical Transient Receptor Potential Ion Channels in Human Breast Cancer Cell Lines and Tissues: A Potential Target for Breast Cancer Diagnosis and Therapy. Cancer Cell Int. 2009, 9, 1–12. [Google Scholar] [CrossRef]
- Liberati, S.; Morelli, M.B.; Nabissi, M.; Santoni, M.; Santoni, G. Oncogenic and Anti-Oncogenic Effects of Transient Receptor Potential Channels. Curr. Top. Med. Chem. 2013, 13, 344–366. [Google Scholar] [CrossRef]
- Diez-Bello, R.; Jardin, I.; Lopez, J.J.; El Haouari, M.; Ortega-Vidal, J.; Altarejos, J.; Salido, G.M.; Salido, S.; Rosado, J.A. (−)-Oleocanthal Inhibits Proliferation and Migration by Modulating Ca2+ Entry through TRPC6 in Breast Cancer Cells. Biochim. Biophys. Acta Mol. Cell Res. 2018, 1866, 474–485. [Google Scholar] [CrossRef]
- Barritt, G.J. Multiple Roles for Transient Receptor Potential (TRP) Non-Selective Cation Channels in Liver Function. Proc. Aust. Physiol.Soc. 2011, 43, 121. [Google Scholar]
- Anand, P.; Grigoryan, A.; Bhuiyan, M.H.; Ueberheide, B.; Russell, V.; Quinoñez, J.; Moy, P.; Chait, B.T.; Poget, S.F.; Holford, M.; et al. Sample Limited Characterization of a Novel Disulfide-Rich Venom Peptide Toxin from Terebrid Marine Snail Terebra Variegata. PLoS ONE 2014, 9, e94122. [Google Scholar] [CrossRef] [PubMed]
- Wang, H.; Zhang, Y.; Cao, L.; Han, H.; Wang, J.; Yang, B.; Nattel, S.; Wang, Z. HERG K + Channel, a Regulator of Tumor Cell Apoptosis and Proliferation HERG K+ Channel, a Regulator of Tumor Cell Apoptosis and Proliferation 1. Cancer Res. 2002, 62, 4843–4848. [Google Scholar] [PubMed]
- Fecher-Trost, C.; Wissenbach, U.; Weissgerber, P. TRPV6: From Identification to Function. Cell Calcium 2017, 67, 116–122. [Google Scholar] [CrossRef] [PubMed]
- Bowen, C.V.; DeBay, D.; Ewart, H.S.; Gallant, P.; Gormley, S.; Ilenchuk, T.T.; Iqbal, U.; Lutes, T.; Martina, M.; Mealing, G.; et al. In Vivo Detection of Human TRPV6-Rich Tumors with Anti-Cancer Peptides Derived from Soricidin. PLoS ONE 2013, 8, 1–11. [Google Scholar] [CrossRef]
- Chen, H.; Cai, W.; Chu, E.S.H.; Tang, J.; Wong, C.-C.; Wong, S.H.; Sun, W.; Liang, Q.; Fang, J.; Sun, Z.; et al. Hepatic Cyclooxygenase-2 Overexpression Induced Spontaneous Hepatocellular Carcinoma Formation in Mice. Oncogene 2017, 36, 4415–4426. [Google Scholar] [CrossRef]
- Ogunwobi, O.O.; Wang, T.; Zhang, L.; Liu, C. COX-2 and Akt Mediate Multiple Growth Factor-Induced Epithelial-Mesenchymal Transition in Human Hepatocellular Carcinoma. J. Gastroenterol. Hepatol. 2012, 27, 566–578. [Google Scholar] [CrossRef]
- Ogunwobi, O.O.; Liu, C. Hepatocyte Growth Factor Upregulation Promotes Carcinogenesis and Epithelial-Mesenchymal Transition in Hepatocellular Carcinoma via Akt and COX-2 Pathways. Clin. Exp. Metastasis 2011, 28, 721–731. [Google Scholar] [CrossRef]
- Fu, S.; Hirte, H.; Welch, S.; Ilenchuk, T.T.; Lutes, T.; Rice, C.; Fields, N.; Nemet, A.; Dugourd, D.; Piha-Paul, S.; et al. First-in-Human Phase I Study of SOR-C13, a TRPV6 Calcium Channel Inhibitor, in Patients with Advanced Solid Tumors. Invest. New Drugs 2017, 35, 324–333. [Google Scholar] [CrossRef]
- Ojeda, P.G.; Wang, C.K.; Craik, D.J. Chlorotoxin: Structure, Activity, and Potential Uses in Cancer Therapy. Biopolymers 2015, 106, 25–36. [Google Scholar] [CrossRef]
- Pedersen, S.F.; Owsianik, G.; Nilius, B. TRP Channels: An Overview. Cell Calcium 2005, 38, 233–252. [Google Scholar] [CrossRef]
- Herringa, S.F.; Moller, C.C.; Du, J.; Yue, L.; Hinkes, B.; Chernin, G.; Viangos, C.N.; Hoyer, P.F.; Reiser, J.; Hildbrandt, F. A Novel TRPC6 Mutation That Causes Childhood FSGS. PLoS ONE 2009, 4, e77771. [Google Scholar] [CrossRef] [PubMed]
- El Boustany, C.; Bidaux, G.; Enfissi, A.; Delcourt, P.; Prevarskaya, N.; Capiod, T. Capacitative Calcium Entry and Transient Receptor Potential Canonical 6 Expression Control Human Hepatoma Cell Proliferation. Hepatology 2008, 47, 2068–2077. [Google Scholar] [CrossRef] [PubMed]
- Park, S.P.; Kim, B.M.; Koo, J.Y.; Cho, H.; Lee, C.H.; Kim, M.; Na, H.S.; Oh, U. A Tarantula Spider Toxin, GsMTx4, Reduces Mechanical and Neuropathic Pain. Pain 2008, 137, 208–217. [Google Scholar] [CrossRef] [PubMed]
- Chen, R.; Chung, S.H. Effect of Gating Modifier Toxins on Membrane Thickness: Implications for Toxin Effect on Gramicidin and Mechanosensitive Channels. Toxins 2013, 5, 456–471. [Google Scholar] [CrossRef] [PubMed]
- Lehen’Kyi, V.; Flourakis, M.; Skryma, R.; Prevarskaya, N. TRPV6 Channel Controls Prostate Cancer Cell Proliferation via Ca2+/NFAT-Dependent Pathways. Oncogene 2007, 26, 7380–7385. [Google Scholar] [CrossRef] [PubMed]
- Raphaël, M.; Lehen’kyi, V.; Vandenberghe, M.; Beck, B.; Khalimonchyk, S.; Vanden Abeele, F.; Farsetti, L.; Germain, E.; Bokhobza, A.; Mihalache, A.; et al. TRPV6 Calcium Channel Translocates to the Plasma Membrane via Orai1-Mediated Mechanism and Controls Cancer Cell Survival. Proc. Natl. Acad. Sci. USA 2014, 111, E3870–E3879. [Google Scholar] [CrossRef]
- Jiang, Y.; Gou, H.; Zhu, J.; Tian, S.; Yu, L. Lidocaine Inhibits the Invasion and Migration of TRPV6-Expressing Cancer Cells by TRPV6 Downregulation. Oncol. Lett. 2016, 12, 1164–1170. [Google Scholar] [CrossRef]
- Schwarz, E.C.; Wissenbach, U.; Niemeyer, B.A.; Strauβ, B.; Philipp, S.E.; Flockerzi, V.; Hoth, M. TRPV6 Potentiates Calcium-Dependent Cell Proliferation. Cell Calcium 2006, 39, 163–173. [Google Scholar] [CrossRef]
- Simonin, C.; Awale, M.; Brand, M.; Van Deursen, R.; Schwartz, J.; Fine, M.; Kovacs, G.; Häfliger, P.; Gyimesi, G.; Sithampari, A.; et al. Optimization of TRPV6 Calcium Channel Inhibitors Using a 3D Ligand-Based Virtual Screening Method. Angew. Chem. Int. Ed. 2015, 54, 14748–14752. [Google Scholar] [CrossRef]
- McGoldrick, L.L.; Singh, A.K.; Saotome, K.; Yelshanskaya, M.V.; Twomey, E.C.; Grassucci, R.A.; Sobolevsky, A.I. Opening of the Human Epithelial Calcium Channel TRPV6. Nature 2018, 553, 233–237. [Google Scholar] [CrossRef]
- Singh, A.K.; McGoldrick, L.L.; Twomey, E.C.; Sobolevsky, A.I. Mechanism of Calmodulin Inactivation of the Calcium-Selective TRP Channel TRPV6. Sci. Adv. 2018, 4, 4–10. [Google Scholar] [CrossRef] [PubMed]
- Saotome, K.; Singh, A.K.; Yelshanskaya, M.V.; Sobolevsky, A.I. Crystal Structure of the Epithelial Calcium Channel TRPV6. Nature 2016, 534, 506–511. [Google Scholar] [CrossRef] [PubMed]
- Huang, W.-C.; Chai, C.-Y.; Chen, W.-C.; Hou, M.-F.; Wang, Y.-S.; Chiu, Y.-C.; Lu, S.-R.; Chang, W.-C.; Juo, S.-H.H.; Wang, J.-Y.; et al. Histamine Regulates Cyclooxygenase 2 Gene Activation through Orai1-Mediated NFκB Activation in Lung Cancer Cells. Cell Calcium 2011, 50, 27–35. [Google Scholar] [CrossRef]
- Shen, Y.; Delaglio, F.; Cornilescu, G.; Bax, A. TALOS+: A Hybrid Method for Predicting Protein Backbone Torsion Angles from NMR Chemical Shifts. J. Biomol. NMR 2009, 44, 213–223. [Google Scholar] [CrossRef] [PubMed]
- Shapovalov, G.; Lehen’kyi, V.; Skryma, R.; Prevarskaya, N. TRP Channels in Cell Survival and Cell Death in Normal and Transformed Cells. Cell Calcium 2011, 50, 295–302. [Google Scholar] [CrossRef] [PubMed]
- Hai, L.; Kawarabayashi, Y.; Imai, Y.; Honda, A.; Inoue, R. Counteracting Effect of TRPC1-Associated Ca2+ Influx on TNF-α-Induced COX-2-Dependent Prostaglandin E2 Production in Human Colonic Myofibroblasts. Am. J. Physiol. Gastrointest. Liver Physiol. 2011, 301, 356–367. [Google Scholar] [CrossRef]
- Qu, L.; Liu, B. Cyclooxygeanse-2 Promotes Metastasis in Osteosarcoma. Cancer Cell Int. 2015, 15, 69. [Google Scholar] [CrossRef]
- Naruse, T.; Nishida, Y.; Hosono, K.; Ishiguro, N. Meloxicam Inhibits Osteosarcoma Growth, Invasiveness and Metastasis by COX-2-Dependent and Independent Routes. Carcinogenesis 2006, 27, 584–592. [Google Scholar] [CrossRef]
- Nzeako, U.C.; Guicciardi, M.E.; Yoon, J.H.; Bronk, S.F.; Gores, G.J. COX-2 Inhibits Fas-Mediated Apoptosis in Cholangiocarcinoma Cells. Hepatology 2002, 35, 552–559. [Google Scholar] [CrossRef]
- Acar, H.; Srivastava, S.; Chung, E.J.; Schnorenberg, M.R.; Barrett, J.C.; Labelle, J.L.; Tirrell, M. Self-Assembling Peptide-Based Building Blocks in Medical Applications. Adv. Drug Deliv. Rev. 2016, 110, 65–79. [Google Scholar] [CrossRef]
- Thundimadathil, J. Cancer Treatment Using Peptides: Current Therapies and Future Prospects. J. Amino Acids 2012. [Google Scholar] [CrossRef] [PubMed]
- Moran, M.M. TRP Channels as Potential Drug Targets. Annu. Rev. Pharmacol. Toxicol. 2018, 58, 309–330. [Google Scholar] [CrossRef] [PubMed]
- Hilchie, A.L.; Hoskin, D.W.; Power Coombs, M.R. Anticancer Activities of Natural and Synthetic Peptides. In Antimicrobial Peptides: Basics for Clinical Application; Matsuzaki, K., Ed.; Springer: Singapore, 2019; pp. 131–147. [Google Scholar]
- Ma, R.; Mahadevappa, R.; Kwok, H.F. Venom-Based Peptide Therapy: Insights into Anti-Cancer Mechanism. Oncotarget 2017, 8, 100908–100930. [Google Scholar] [CrossRef] [PubMed]
- Abidin, S.A.Z.; Lee, Y.Q.; Othman, I.; Naidu, R. Malaysian Cobra Venom: A Potential Source of Anti-Cancer Therapeutic Agents. Toxins 2019, 11, 1–13. [Google Scholar]
- Djamgoz, M.B.; Onkal, R. Persistent Current Blockers of Voltage-Gated Sodium Channels: A Clinical Opportunity for Controlling Metastatic Disease. Recent Pat. Anticancer. Drug Discov. 2013, 8, 66–84. [Google Scholar] [CrossRef]
- Lang, F.; Stournaras, C. Ion Channels in Cancer: Future Perspectives and Clinical Potential Ion Channels in Cancer: Future Perspectives and Clinical Potential. Phil. Trans. R. Soc. B 2014, 369, 20130108. [Google Scholar] [CrossRef]
- Litan, A.; Langhans, S.A. Cancer as a Channelopathy: Ion Channels and Pumps in Tumor Development and Progression. Front. Cell. Neurosci. 2015, 9, 1–11. [Google Scholar] [CrossRef]
- Leanza, L.; Managò, A.; Zoratti, M.; Gulbins, E.; Szabo, I. Pharmacological Targeting of Ion Channels for Cancer Therapy: In Vivo Evidences. Biochim. Biophys. Acta Mol. Cell Res. 2016, 1863, 1385–1397. [Google Scholar] [CrossRef]
- Boohaker, R.J.; Lee, M.W.; Vishnubhotla, P.; Perez, J.M.; Khaled, A.R. The Use of Therapeutic Peptides to Target and to Kill Cancer Cells. Curr. Med. Chem. 2012, 19, 3794–3804. [Google Scholar] [CrossRef]
- Teicher, B.A. Tumor Models for Efficacy Determination. Mol. Cancer Ther. 2006, 5, 2435–2443. [Google Scholar] [CrossRef]
- Manders, E.; Verbeek, F.; Aten, J. Measurment of Co-Localization of Objects in Dualcolor Confocal Images. J. Microsc. 1993, 169, 375–382. [Google Scholar] [CrossRef]
- Beales, I.L.P.; Ogunwobi, O.; Cameron, E.; El-Amin, K.; Mutungi, G.; Wilkinson, M. Activation of Akt Is Increased in the Dysplasia-Carcinoma Sequence in Barrett’s Oesophagus and Contributes to Increased Proliferation and Inhibition of Apoptosis: A Histopathological and Functional Study. BMC Cancer 2007, 7, 97. [Google Scholar] [CrossRef] [PubMed]
- Tubert-Brohman, I.; Sherman, W.; Repasky, M.; Beuming, T. Improved Docking of Polypeptides with Glide. J. Chem. Inf. Model. 2013, 53, 1689–1699. [Google Scholar] [CrossRef] [PubMed]
- Friesner, R.A.; Banks, J.L.; Murphy, R.B.; Halgren, T.A.; Klicic, J.J.; Mainz, D.T.; Repasky, M.P.; Knoll, E.H.; Shelley, M.; Perry, J.K.; et al. Glide: A New Approach for Rapid, Accurate Docking and Scoring. 1. Method and Assessment of Docking Accuracy. J. Med. Chem. 2004, 47, 1739–1749. [Google Scholar] [CrossRef] [PubMed]
- Genheden, S.; Ryde, U. The MM/PBSA and MM/GBSA Methods to Estimate Ligand-Binding Affinities. Expert Opin. Drug Discov. 2015, 10, 449–461. [Google Scholar] [CrossRef] [PubMed]
- Beard, H.; Cholleti, A.; Pearlman, D.; Sherman, W.; Loving, K.A. Applying Physics-Based Scoring to Calculate Free Energies of Binding for Single Amino Acid Mutations in Protein-Protein Complexes. PLoS ONE 2013, 8, e82849. [Google Scholar] [CrossRef]


© 2019 by the authors. Licensee MDPI, Basel, Switzerland. This article is an open access article distributed under the terms and conditions of the Creative Commons Attribution (CC BY) license (http://creativecommons.org/licenses/by/4.0/).
Share and Cite
Anand, P.; Filipenko, P.; Huaman, J.; Lyudmer, M.; Hossain, M.; Santamaria, C.; Huang, K.; Ogunwobi, O.O.; Holford, M. Selective Inhibition of Liver Cancer Cells Using Venom Peptide. Mar. Drugs 2019, 17, 587. https://doi.org/10.3390/md17100587
Anand P, Filipenko P, Huaman J, Lyudmer M, Hossain M, Santamaria C, Huang K, Ogunwobi OO, Holford M. Selective Inhibition of Liver Cancer Cells Using Venom Peptide. Marine Drugs. 2019; 17(10):587. https://doi.org/10.3390/md17100587
Chicago/Turabian StyleAnand, Prachi, Petr Filipenko, Jeannette Huaman, Michael Lyudmer, Marouf Hossain, Carolina Santamaria, Kelly Huang, Olorunseun O. Ogunwobi, and Mandë Holford. 2019. "Selective Inhibition of Liver Cancer Cells Using Venom Peptide" Marine Drugs 17, no. 10: 587. https://doi.org/10.3390/md17100587
APA StyleAnand, P., Filipenko, P., Huaman, J., Lyudmer, M., Hossain, M., Santamaria, C., Huang, K., Ogunwobi, O. O., & Holford, M. (2019). Selective Inhibition of Liver Cancer Cells Using Venom Peptide. Marine Drugs, 17(10), 587. https://doi.org/10.3390/md17100587