Bioactive Diketopiperazines and Nucleoside Derivatives from a Sponge-Derived Streptomyces Species

 , ,
, , 
Abstract
1. Introduction
2. Results and Discussion
2.1. Purification of the Compounds
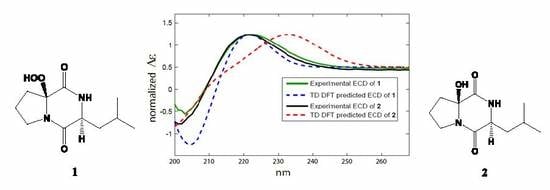
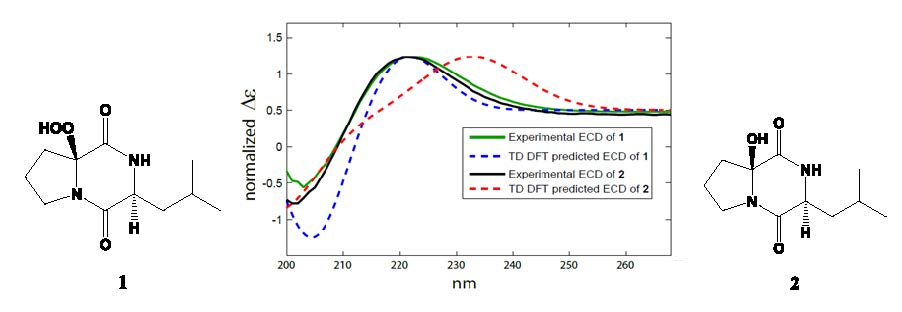
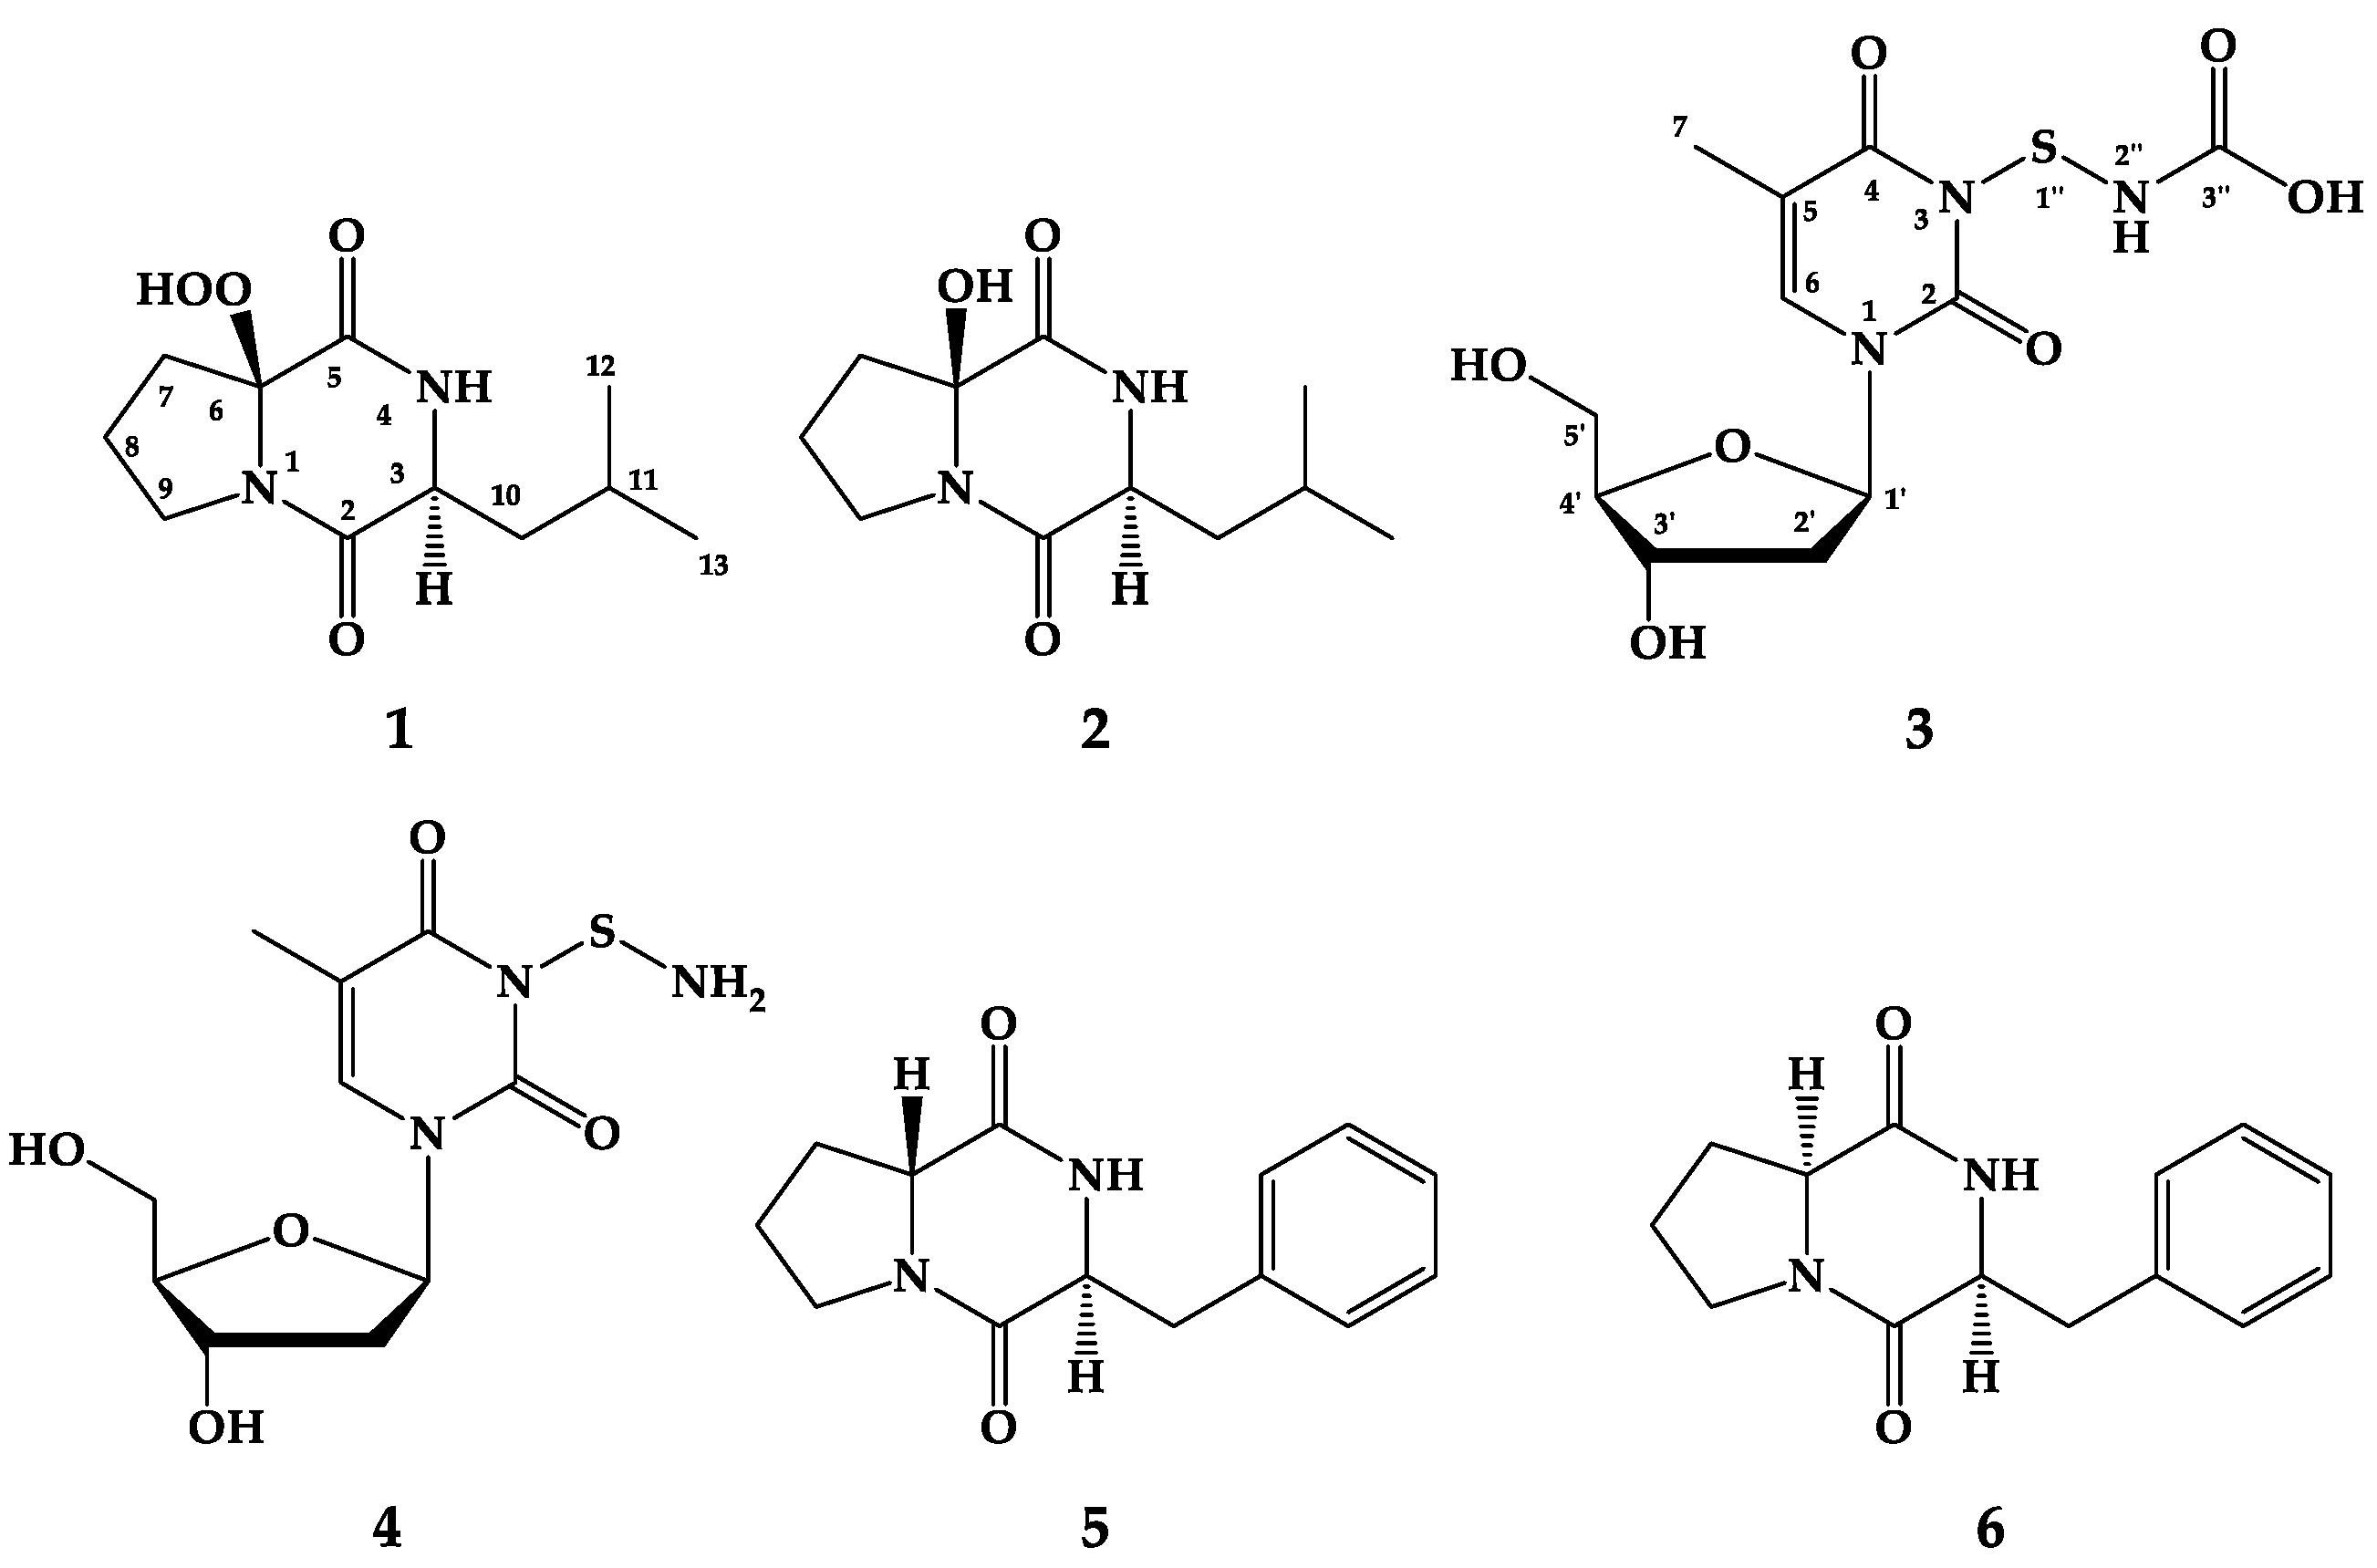
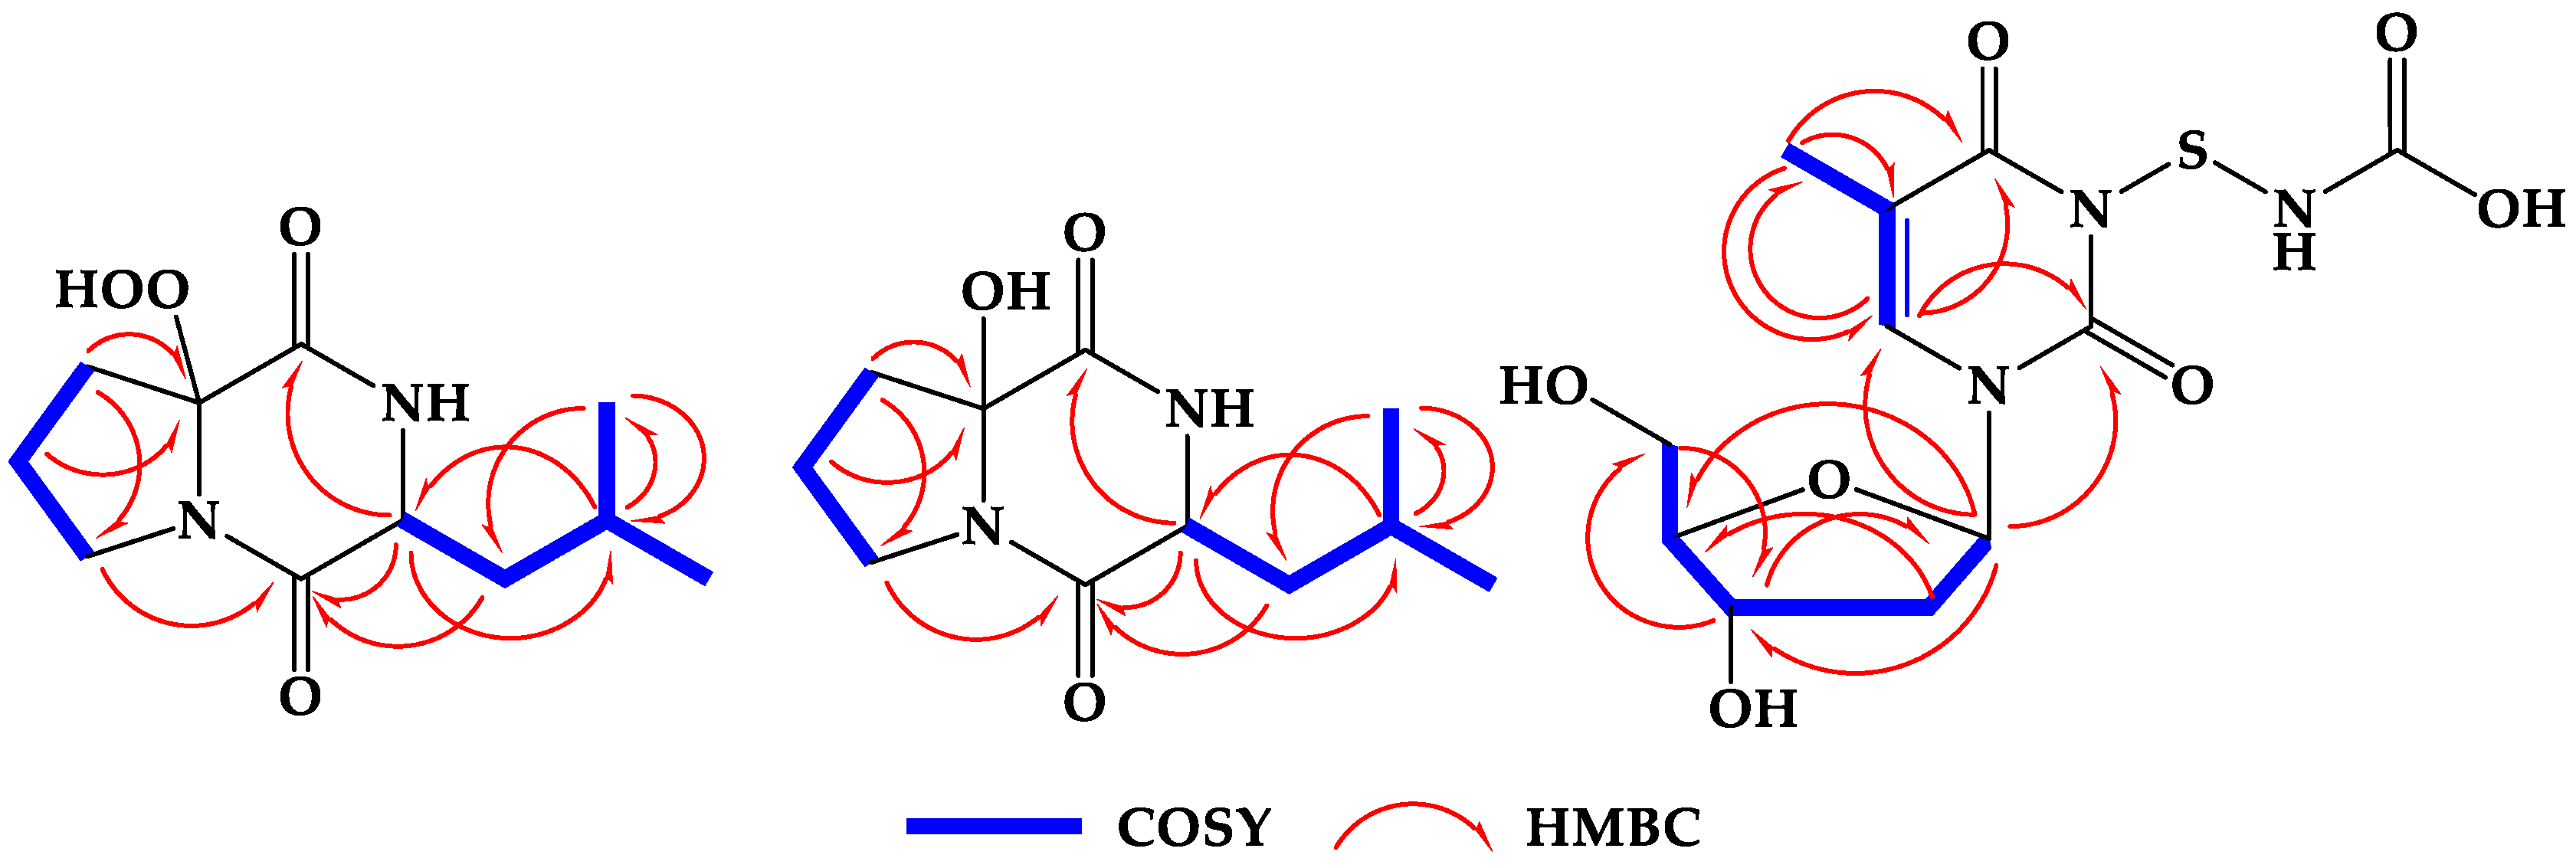
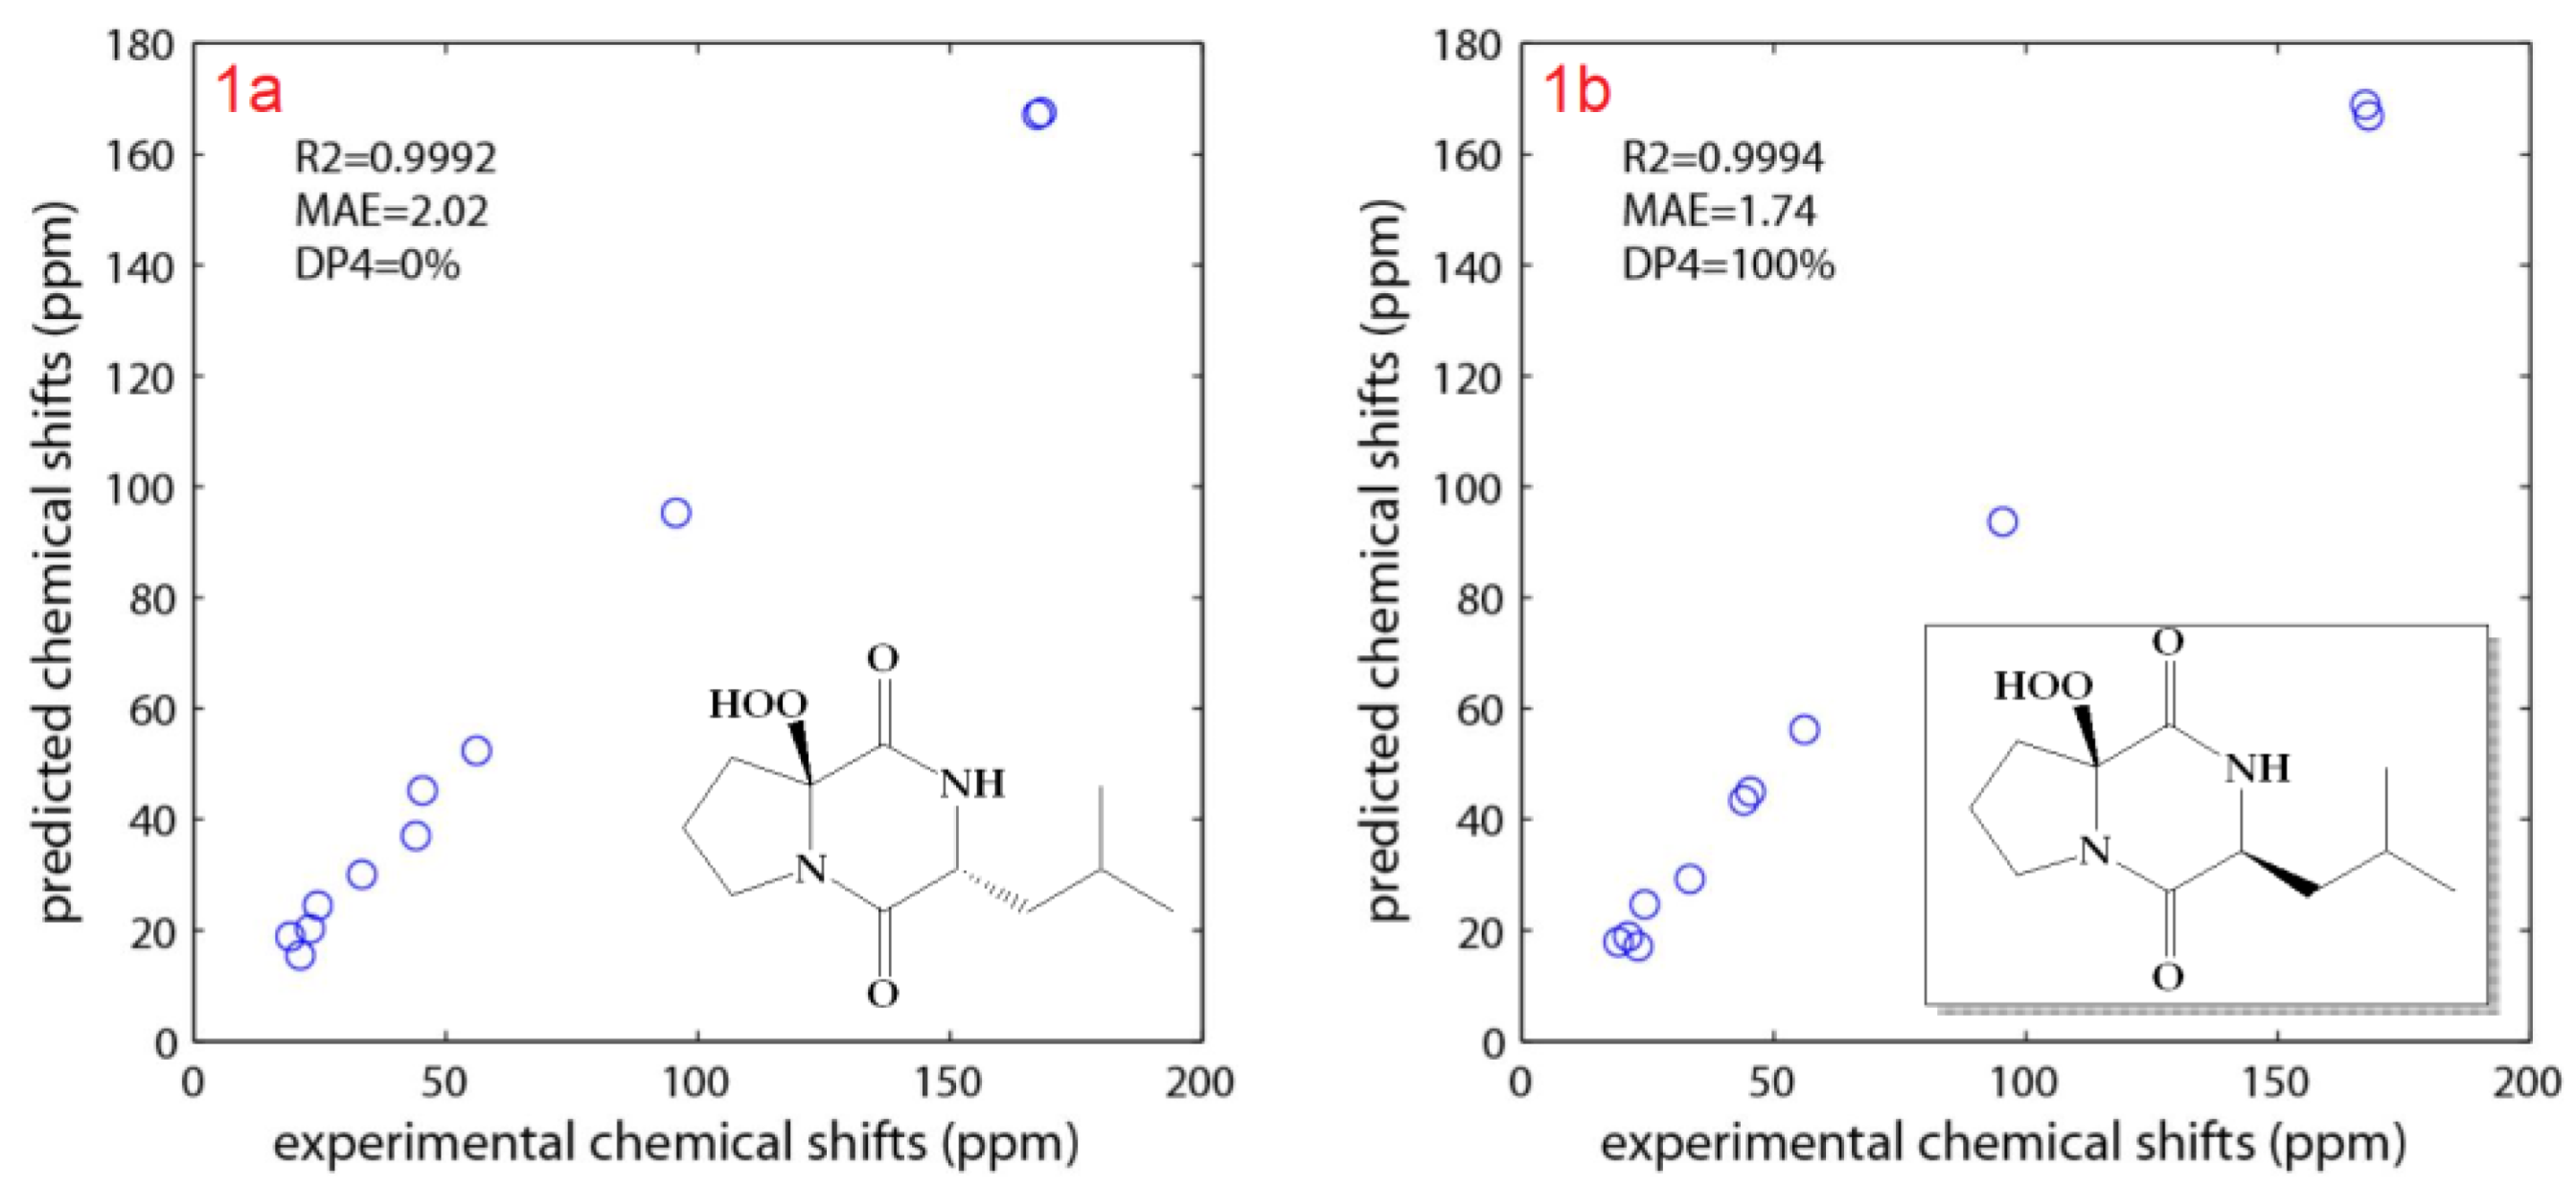
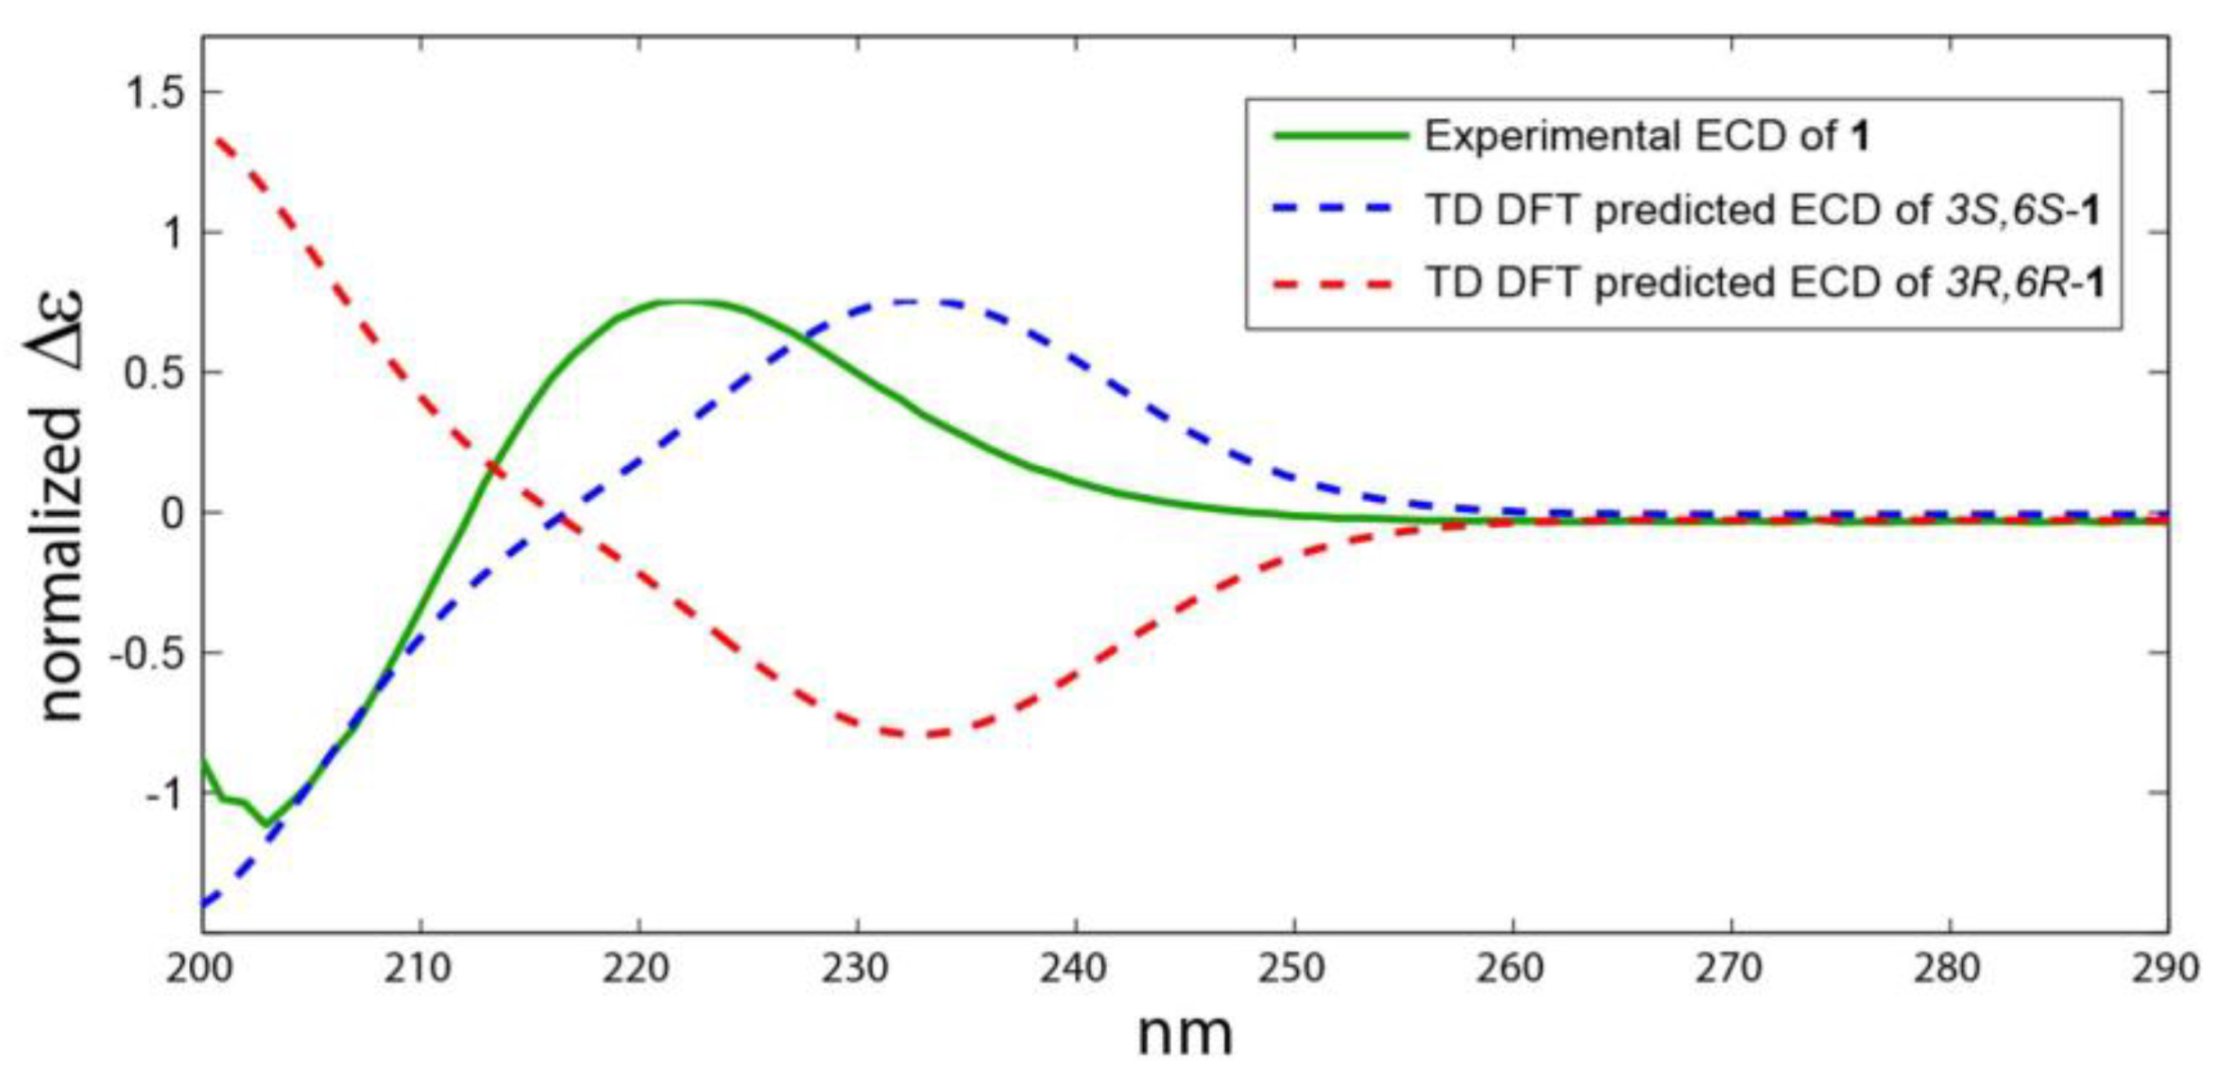
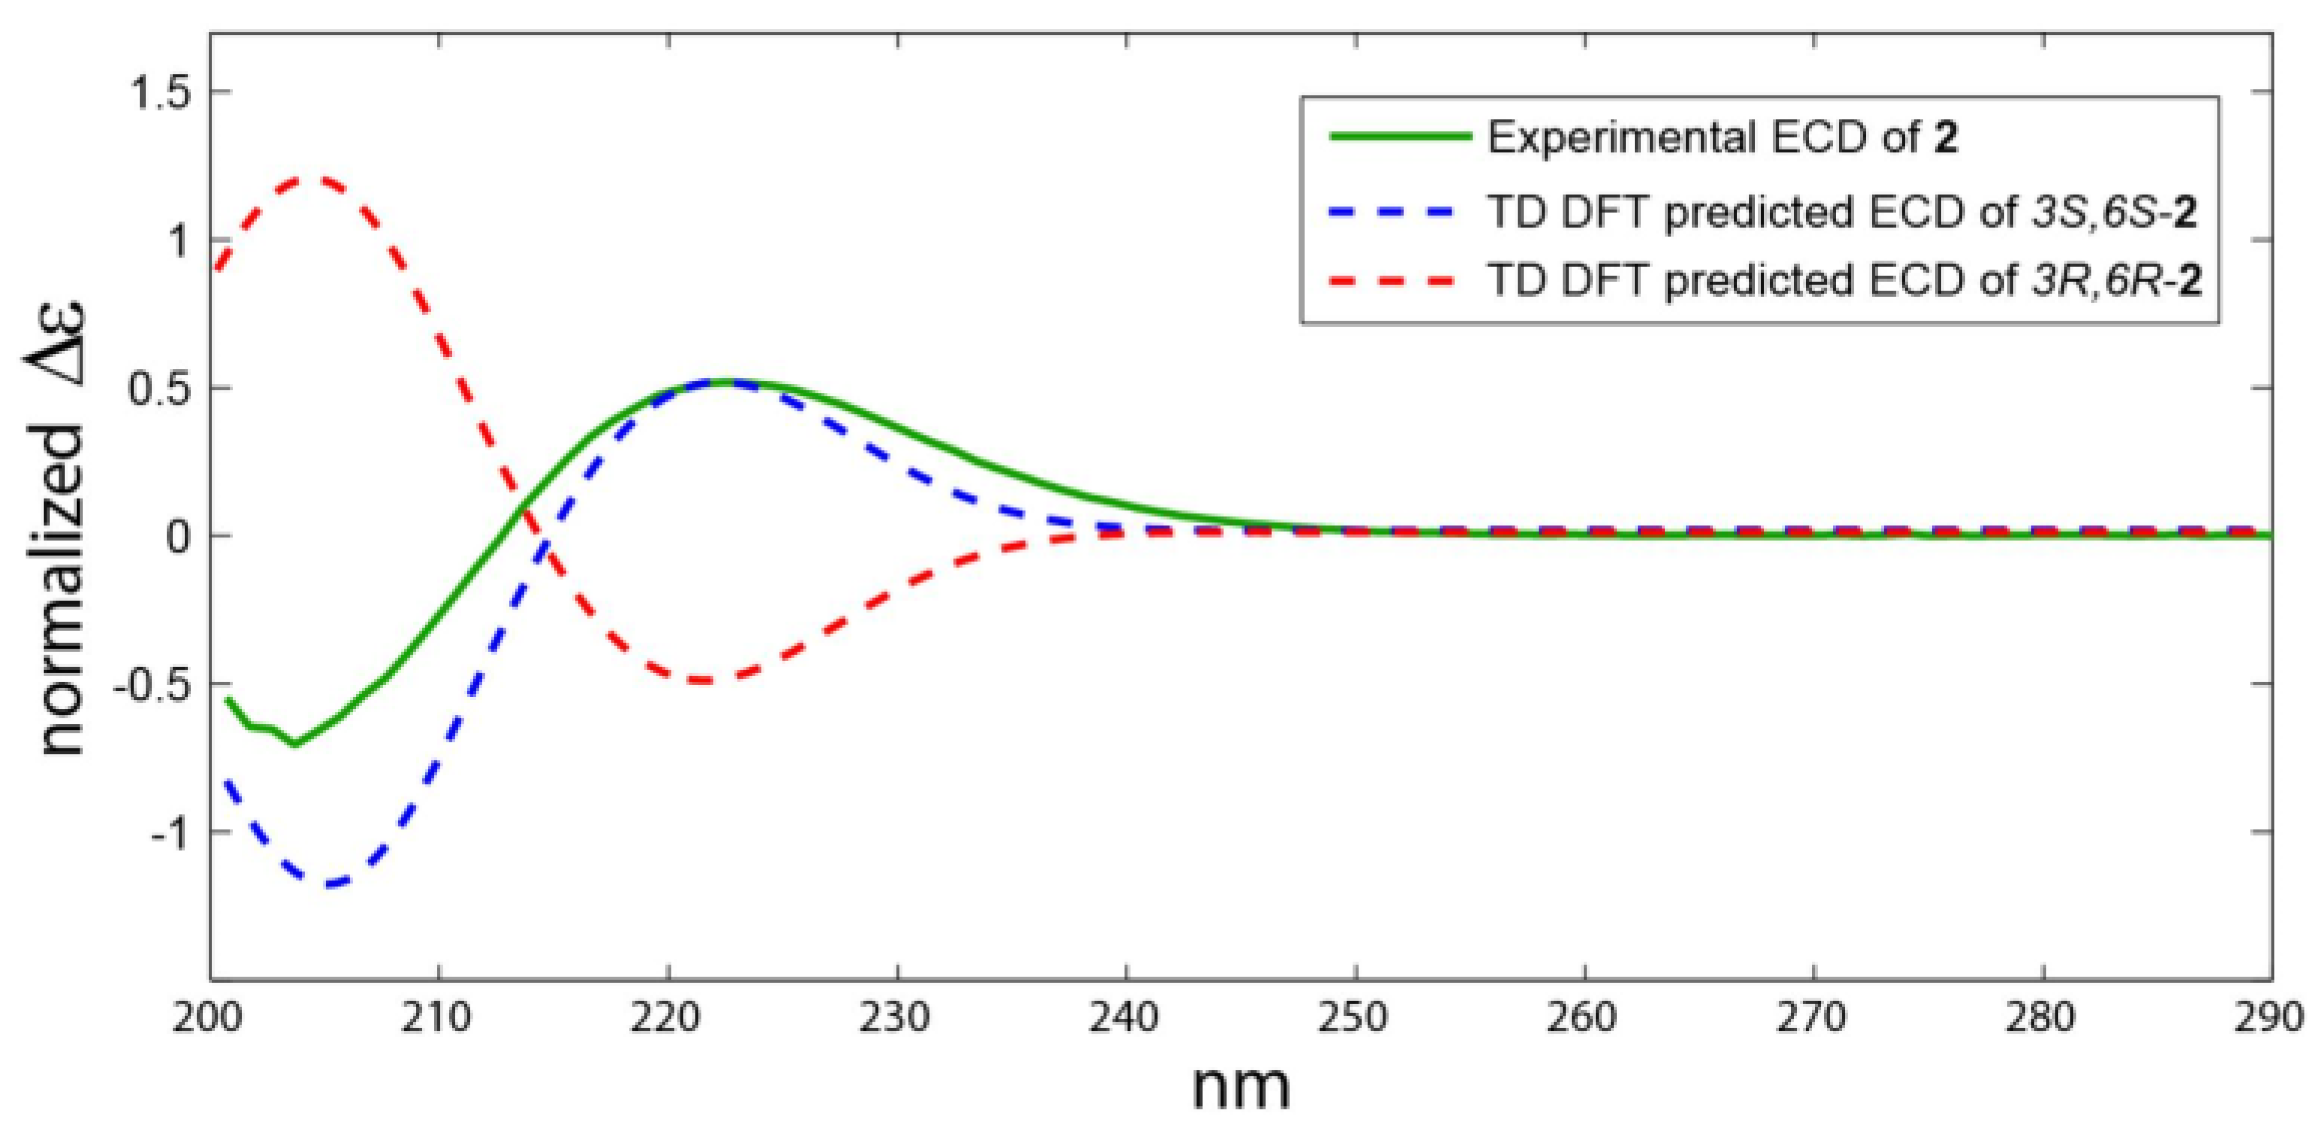
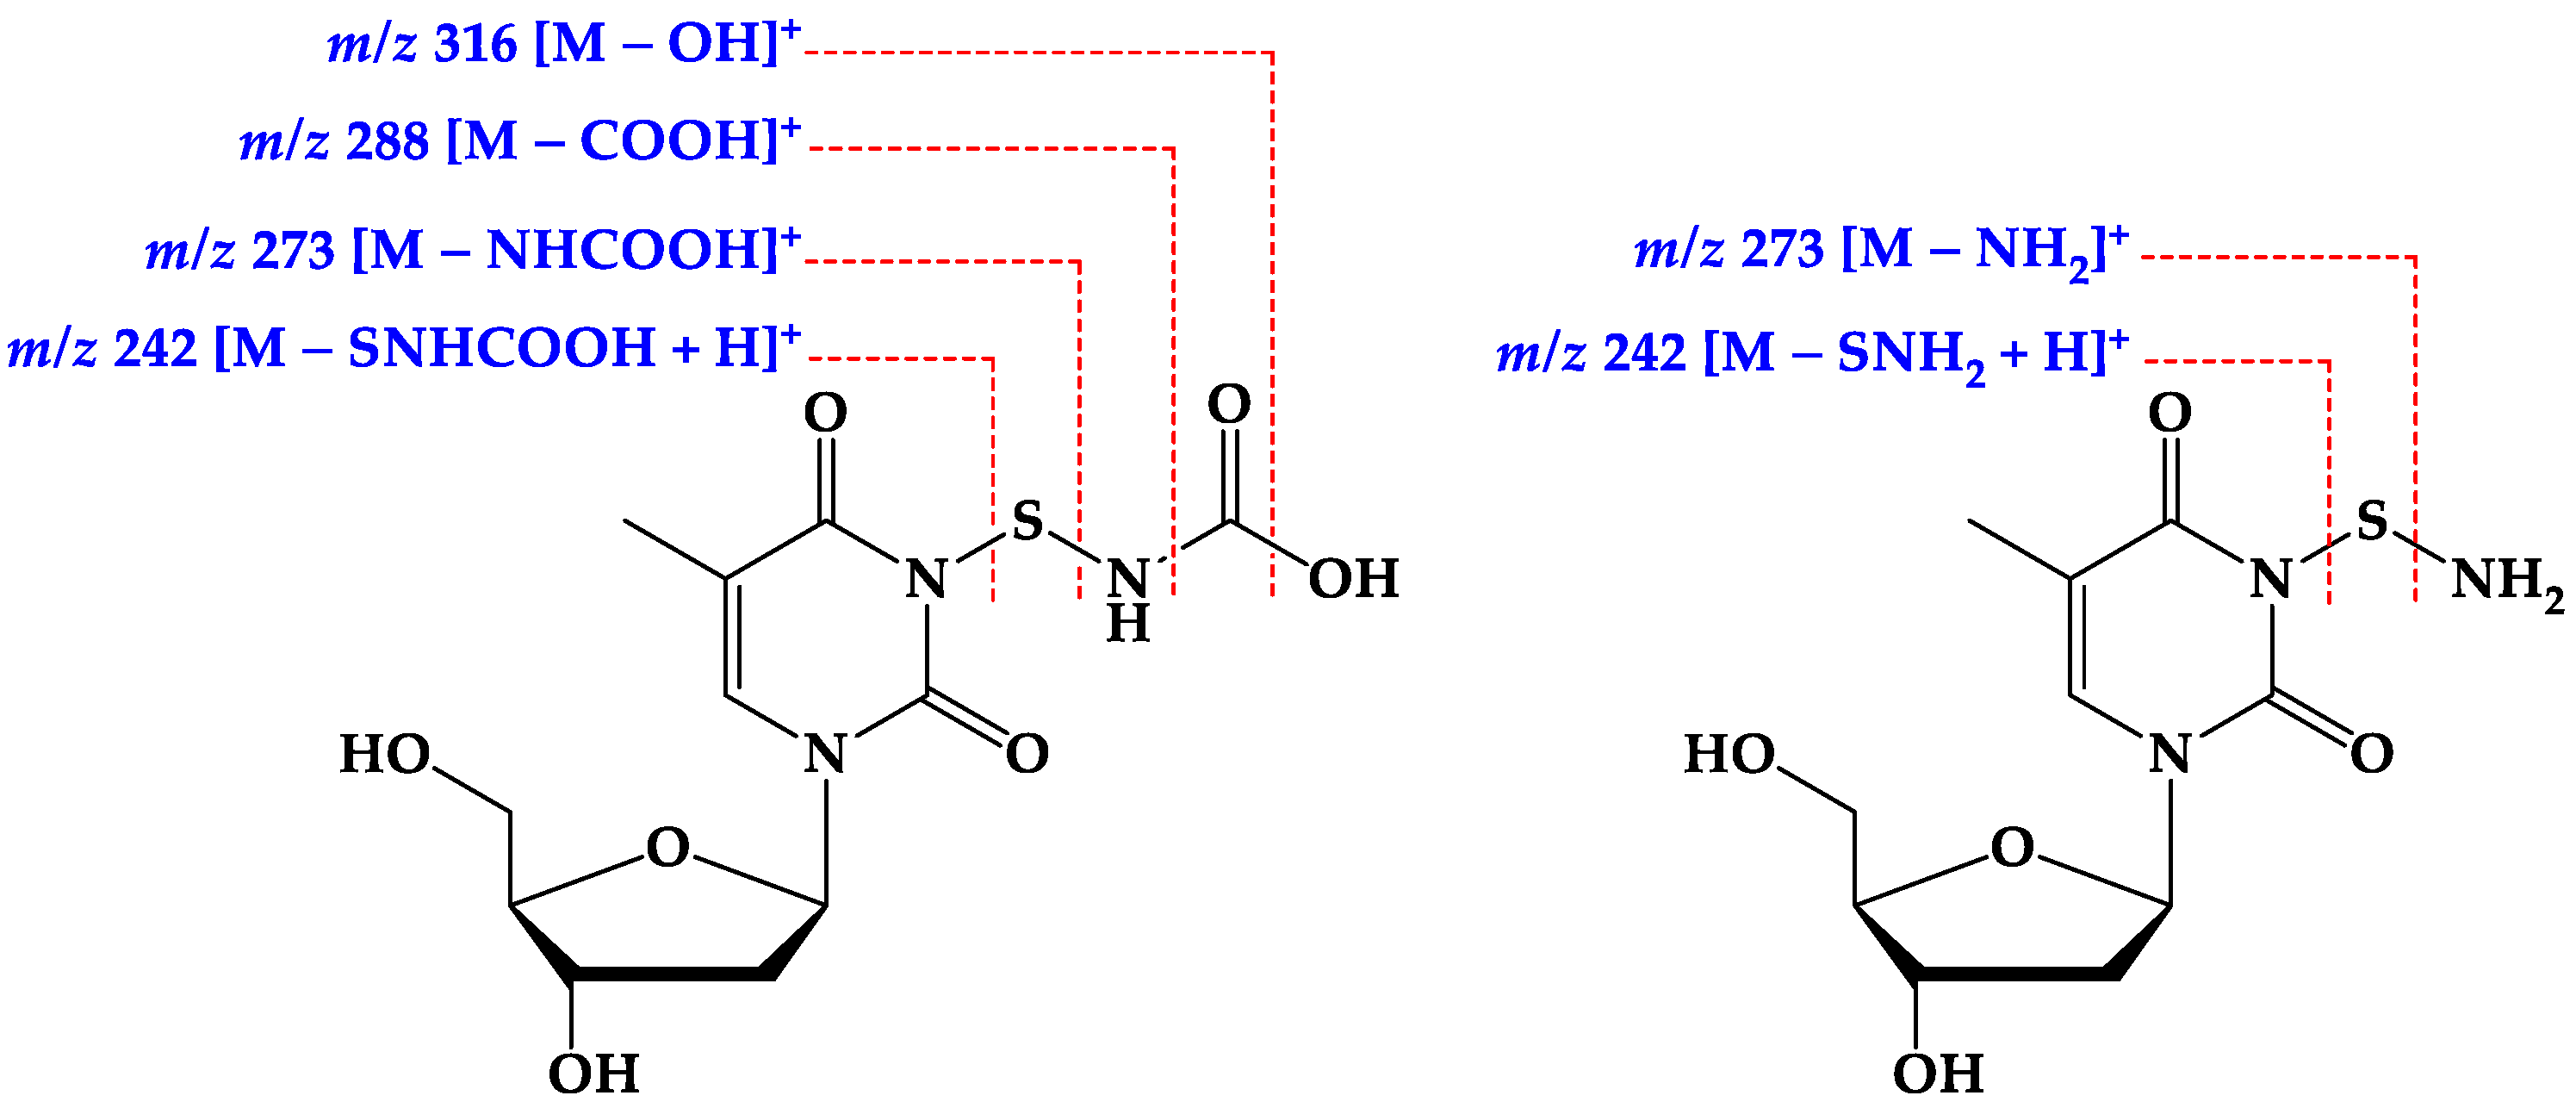
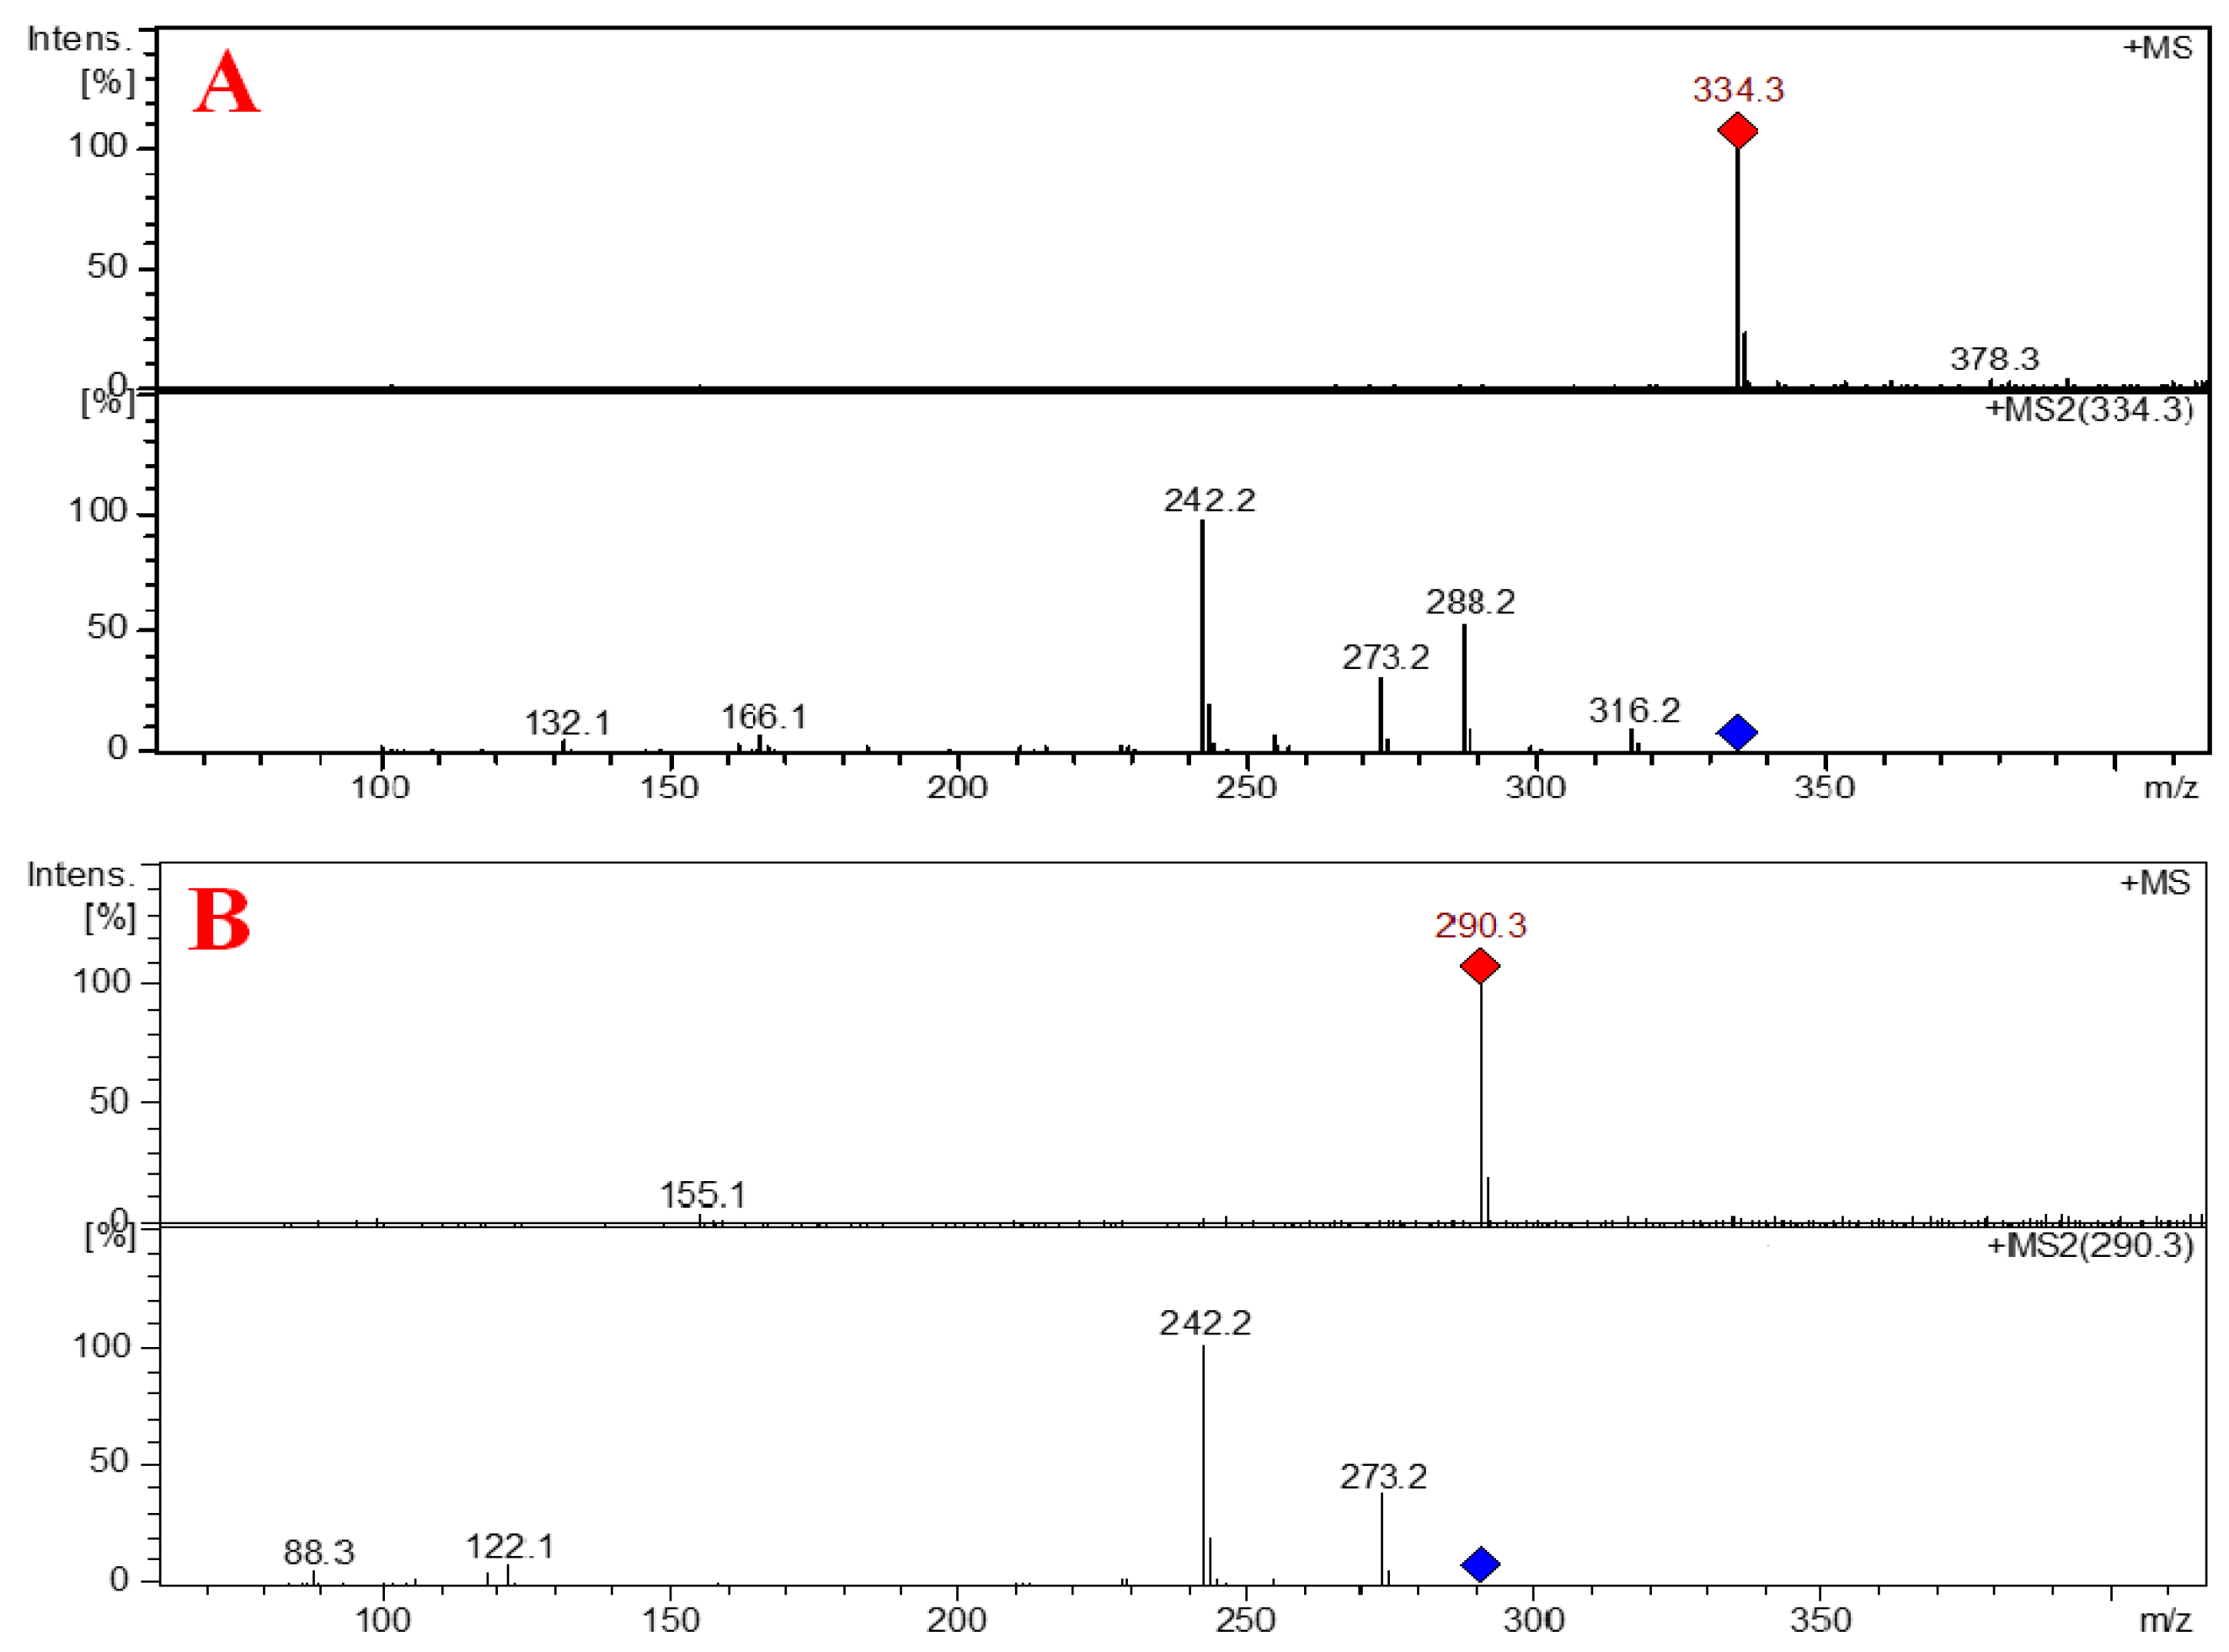
2.2. Structure Elucidation of the Compounds
3. Materials and Methods
3.1. General Experimental Procedures
3.2. Biological Materials
3.3. Fermentation and Extraction
3.4. Purification of the Compounds
3.5. Spectral Data of the Compounds
3.6. Determination of the Configuration of the Leucine Moiety in 1 and 2
3.7. Computational Details
3.8. Cytotoxicity Evaluation
3.9. Antimicrobial Evaluation
4. Conclusions
Supplementary Materials
Author Contributions
Funding
Acknowledgments
Conflicts of Interest
References
- Demain, A.L.; Zhang, L. Natural Products and Drug Discovery. In Natural Products: Drug Discovery and Therapeutics Medicines; Zhang, L., Demain, A., Eds.; Humana Press: Totowa, NJ, USA, 2005; pp. 3–32. [Google Scholar]
- Zhang, L. Integrated Approaches for Discovering Novel Drugs from Microbial Natural Products. In Natural Products: Drug Discovery and Therapeutics Medicines; Zhang, L., Demain, A., Eds.; Human Press: Totowa, NJ, USA, 2005; pp. 33–56. [Google Scholar]
- Wright, G.D.; Sutherland, A.D. New strategies for combating multidrug-resistant bacteria. Trends Mol. Med. 2007, 13, 260–267. [Google Scholar] [CrossRef] [PubMed]
- Fenical, W.; Jensen, P.R. Developing a new resource for drug discovery: Marine actinomycete bacteria. Nat. Chem. Biol. 2006, 2, 666–673. [Google Scholar] [CrossRef] [PubMed]
- Manivasagana, P.; Venkatesana, J.; Sivakumar, K.; Kima, S.K. Pharmaceutically active secondary metabolites of marine actinobacteria. Microbiol. Res. 2014, 169, 262–278. [Google Scholar] [CrossRef] [PubMed]
- Blunt, J.W.; Carroll, A.R.; Copp, B.R.; Davis, R.A.; Keyzers, R.A.; Prinsep, M.R. Marine natural products. Nat. Prod. Rep. 2018, 35, 8–53. [Google Scholar] [CrossRef]
- Martins, M.; Carvalho, I. Diketopiperazines: Biological activity and synthesis. Tetrahedron 2007, 63, 9923–9932. [Google Scholar] [CrossRef]
- Kanoh, K.; Kohno, S.; Katada, J.; Takahashi, J.; Uno, I.; Hayashi, Y. Synthesis and biological activities of phenylahistin derivatives. Bioorg. Med. Chem. 1999, 7, 1451–1457. [Google Scholar] [CrossRef]
- Cui, C.; Kakeya, H.; Okada, G.; Onose, R.; Osada, H. Novel mammalian cell cycle inhibitors, tryprostatins A, B and other diketopiperazines produced by Aspergillus fumigatus. I. Taxonomy, fermentation, isolation and biological properties. J. Antibiot. 1996, 49, 527–533. [Google Scholar] [CrossRef]
- Greiner, D.; Bonaldi, T.; Eskeland, R.; Roemer, E.; Imhof, A. Identification of a specific inhibitor of the histone methyltransferase SU(VAR)3-9. Nat. Chem. Biol. 2005, 1, 143–145. [Google Scholar] [CrossRef]
- Chou, T.; Depew, K.; Zheng, Y.; Safer, M.; Chan, D.; Helfrich, B.; Zatorska, D.; Zatorski, A.; Bornmann, W.; Denishefsky, S. Reversal of anticancer multidrug resistance by the ardeemins. Proc. Natl. Acad. Sci. USA 1998, 95, 8369–8374. [Google Scholar] [CrossRef]
- Murshid, S.S.A.; Badr, J.M.; Youssef, D.T.A. Penicillosides A and B: New cerebrosides from the marine-derived fungus Penicillium species. Rev. Bras. Farmacogn. 2016, 26, 29–33. [Google Scholar] [CrossRef]
- Asiry, I.A.M.; Badr, J.M.; Youssef, D.T.A. Penicillivinacine, antimigratory diketopiperazine alkaloid from the marine-derived fungus Penicillium vinaceum. Phytochem. Lett. 2015, 13, 53–58. [Google Scholar] [CrossRef]
- Shaala, L.A.; Youssef, D.T.A. Identification and bioactivity of compounds from the fungus Penicillium sp. CYE-87 isolated from a marine tunicate. Mar. Drugs 2015, 13, 1698–1709. [Google Scholar] [PubMed]
- Mourshid, S.A.; Badr, J.M.; Risinger, A.L.; Mooberry, S.L.; Youssef, D.T.A. Penicilloitins A and B, new antimicrobial fatty acid esters from a marine endophytic Penicillium species. Z. Naturforsch. C. 2016, 71, 387–392. [Google Scholar] [CrossRef] [PubMed]
- Shaala, L.A.; Youssef, D.T.A.; Badr, J.M.; Harakeh, S.M. Bioactive 2(1H)-pyrazinones and diketopiperazine alkaloids from a tunicate-derived actinomycete Streptomyces sp. Molecules 2016, 21, 1116. [Google Scholar] [CrossRef] [PubMed]
- Youssef, D.T.A.; Alahdal, A.M. Cytotoxic and antimicrobial compounds from the marine-derived fungus, Penicillium species. Molecules 2018, 23, 394. [Google Scholar] [CrossRef]
- Nishanth, S.K.; Nambisan, B.; Dileep, C. Three bioactive cyclic dipeptides from the Bacillus sp. N strain associated with entomopathogenic nematode. Peptides 2014, 53, 59–69. [Google Scholar] [CrossRef]
- Fdhila, F.; Vázquez, V.; Sánchez, J.L.; Riguera, R. dd-Diketopiperazines: Antibiotics active against Vibrio anguillarum isolated from marine bacteria associated with cultures of Pectenmaximus. J. Nat. Prod. 2003, 66, 1299–1301. [Google Scholar] [CrossRef]
- Munekata, M.; Tamura, G. Selective inhibition of SV40-transformed cell growth by diketopiperazines. Agric. Biol. Chem. 1981, 45, 2613–2618. [Google Scholar] [CrossRef]
- Smith, S.G.; Goodman, J.M. Assigning stereochemistry to single diastereoisomers by GIAO NMR calculation: The DP4 Probability. J. Am. Chem. Soc. 2010, 132, 12946–12959. [Google Scholar] [CrossRef]
- Roulland, E.; Solanki, H.; Calabro, K.; Zubia, M.; Genta-Jouve, G.; Thomas, O.P. Stereochemical study of puna’auic acid, an allenic fatty acid from the Eastern Indo-Pacific cyanobacterium Pseudanabaena sp. Org. Lett. 2018, 20, 2311–2314. [Google Scholar] [CrossRef]
- Afoullouss, S.; Calabro, K.; Genta-Jouve, G.; Gegunde, S.; Alfonso, A.; Nesbitt, R.; Morrow, C.; Alonso, E.; Botana, L.M.A.; Louise Allcock, A.L.; et al. Treasures from the deep: Characellides as anti-inflammatory lipoglycotripeptides from the sponge Characella pachastrelloides. Org. Lett. 2019, 21, 246–251. [Google Scholar] [CrossRef] [PubMed]
- Marfey, P. Determination of d-amino acids. II. Use of a bifunctional reagent, 1,5-difluoro-2,4-dinitrobenzene. Carlsberg Res. Commun. 1984, 49, 591–596. [Google Scholar] [CrossRef]
- Hammoda, H.M.; Badr, J.M.; Youssef, D.T.A. Three antioxidant compounds of the red alga Liagora farinosa. Nat. Prod. Sci. 2007, 13, 140–143. [Google Scholar]
- Abou-Hussein, D.R.; Badr, J.M.; Youssef, D.T.A. Nucleoside constituents of the Egyptian tunicate Eudistoma laysani. Nat. Prod. Sci. 2007, 13, 229–233. [Google Scholar]
- Youssef, D.T.A.; Ibrahim, S.R.; Shaala, L.A.; Mohamed, G.A.; Banjar, Z.M. New cerebroside and nucleoside derivatives from a Red Sea strain of the marine cyanobactrium Moorea producens. Molecules 2016, 21, 324. [Google Scholar] [CrossRef]
- Ethier, A.L.; Switzer, J.R.; Rumple, A.C.; Medina-Ramos, W.; Li, Z.; Fisk, J.; Holden, B.; Gelbaum, L.; Pollet, P.; Eckert, C.A.; et al. The effects of solvent and added bases on the protection of benzylamines with carbon dioxide. Processes 2015, 3, 497–513. [Google Scholar] [CrossRef]
- Available online: https://www.sigmaaldrich.com/catalog/product/aldrich/855006?lang=en®ion=SA (accessed on 10 October 2019).
- Vichai, V.; Kirtikara, K. Sulforhodamine B colorimetric assay for cytotoxicity screening. Nat. Protoc. 2006, 1, 1112–1116. [Google Scholar] [CrossRef]
- Kiehlbauch, J.A.; Hannett, G.E.; Salfinger, M.; Archinal, W.; Monserrat, C.; Carlyn, C. Use of the National Committee for Clinical Laboratory Standards Guidelines for Disk Diffusion Susceptibility Testing in New York State Laboratories. J. Clin. Microbiol. 2000, 38, 3341–3348. [Google Scholar]
- Chun, J.; Goodfellow, M. A phylogenetic analysis of the genus Nocardia with 16s rRNA gene sequences. Int. J. Syst. Bacteriol. 1995, 2, 240–245. [Google Scholar] [CrossRef]
- Frisch, M.J.; Trucks, G.W.; Schlegel, H.B.; Scuseria, G.E.; Robb, M.A.; Cheeseman, J.R.; Scalmani, G.; Barone, V.; Mennucci, B.; Petersson, G.A.; et al. G09a: Gaussian 09, Revision A.02, Gaussian Inc.: Wallingford, CT, USA, 2009.


| No. | δC (mult.) | δH [mult., J (Hz)] | HMBC |
|---|---|---|---|
| 2 | 168.0, qC | ||
| 3 | 56.0, CH | 4.04 (dt, 7.2, 3.0) | C-2, C-5, C-10, C-11 |
| 4 (NH) | - | 6.25 (brs) | |
| 5 | 167.2, qC | ||
| 6 | 95.5, qC | ||
| 7 | 33.4, CH2 | 2.44 (ddd, 13.2, 7.2, 3.0) 2.15 (m) | C-6, C-8, C-9 |
| 8 | 19.2, CH2 | 2.16 (m), 2.08 (m) | C-6, C-7, C-9 |
| 9 | 45.3, CH2 | 3.90 (ddd, 12.0, 8.6, 7.8) 3.62 (ddd, 12.0, 9.6, 4.2) | C-2, C-7, C-8 |
| 10 | 44.1, CH2 | 1.96 (m), 1.84 (t, 7.2) | C-2, C-3, C-12, C-13 |
| 11 | 24.5, CH | 1.80 (nonet, 6.6) | C-3, C-12, C-13 |
| 12 | 23.1, CH3 | 0.99 (d, 6.6) | C-10, C-11 |
| 13 | 21.1, CH3 | 0.95 (d, 6.6) | C-10, C-11 |
| OOH | 9.27 (brs) |
| No. | δC (mult.) | δH [mult., J (Hz)] | HMBC |
|---|---|---|---|
| 2 | 168.0, qC | ||
| 3 | 56.4, CH | 3.97 (td, 10.4, 4.2) | C-2, C-5, C-10, C-11 |
| 4 (NH) | - | 6.02 (brs) | |
| 5 | 167.2, qC | ||
| 6 | 86.7, qC | ||
| 7 | 37.6, CH2 | 2.30 (m), 2.15 (m) | C-6, C-8, C-9 |
| 8 | 19.2, CH2 | 2.18 (m), 2.08 (m) | C-6, C-7, C-9 |
| 9 | 45.6, CH2 | 3.73 (m), 3.66 (m) | C-2, C-7, C-8 |
| 10 | 44.4, CH2 | 1.88 (dd, 10.2, 7.2) 1.80 (m) | C-2, C-3, C-12, C-13 |
| 11 | 24.5, CH | 1.80 (m) | C-3, C-12, C-13 |
| 12 | 23.0, CH3 | 1.00 (d, 6.0) | C-10, C-11 |
| 13 | 21.2, CH3 | 0.94 (d, 6.0) | C-10, C-11 |
| OH | 2.97 (brs) |
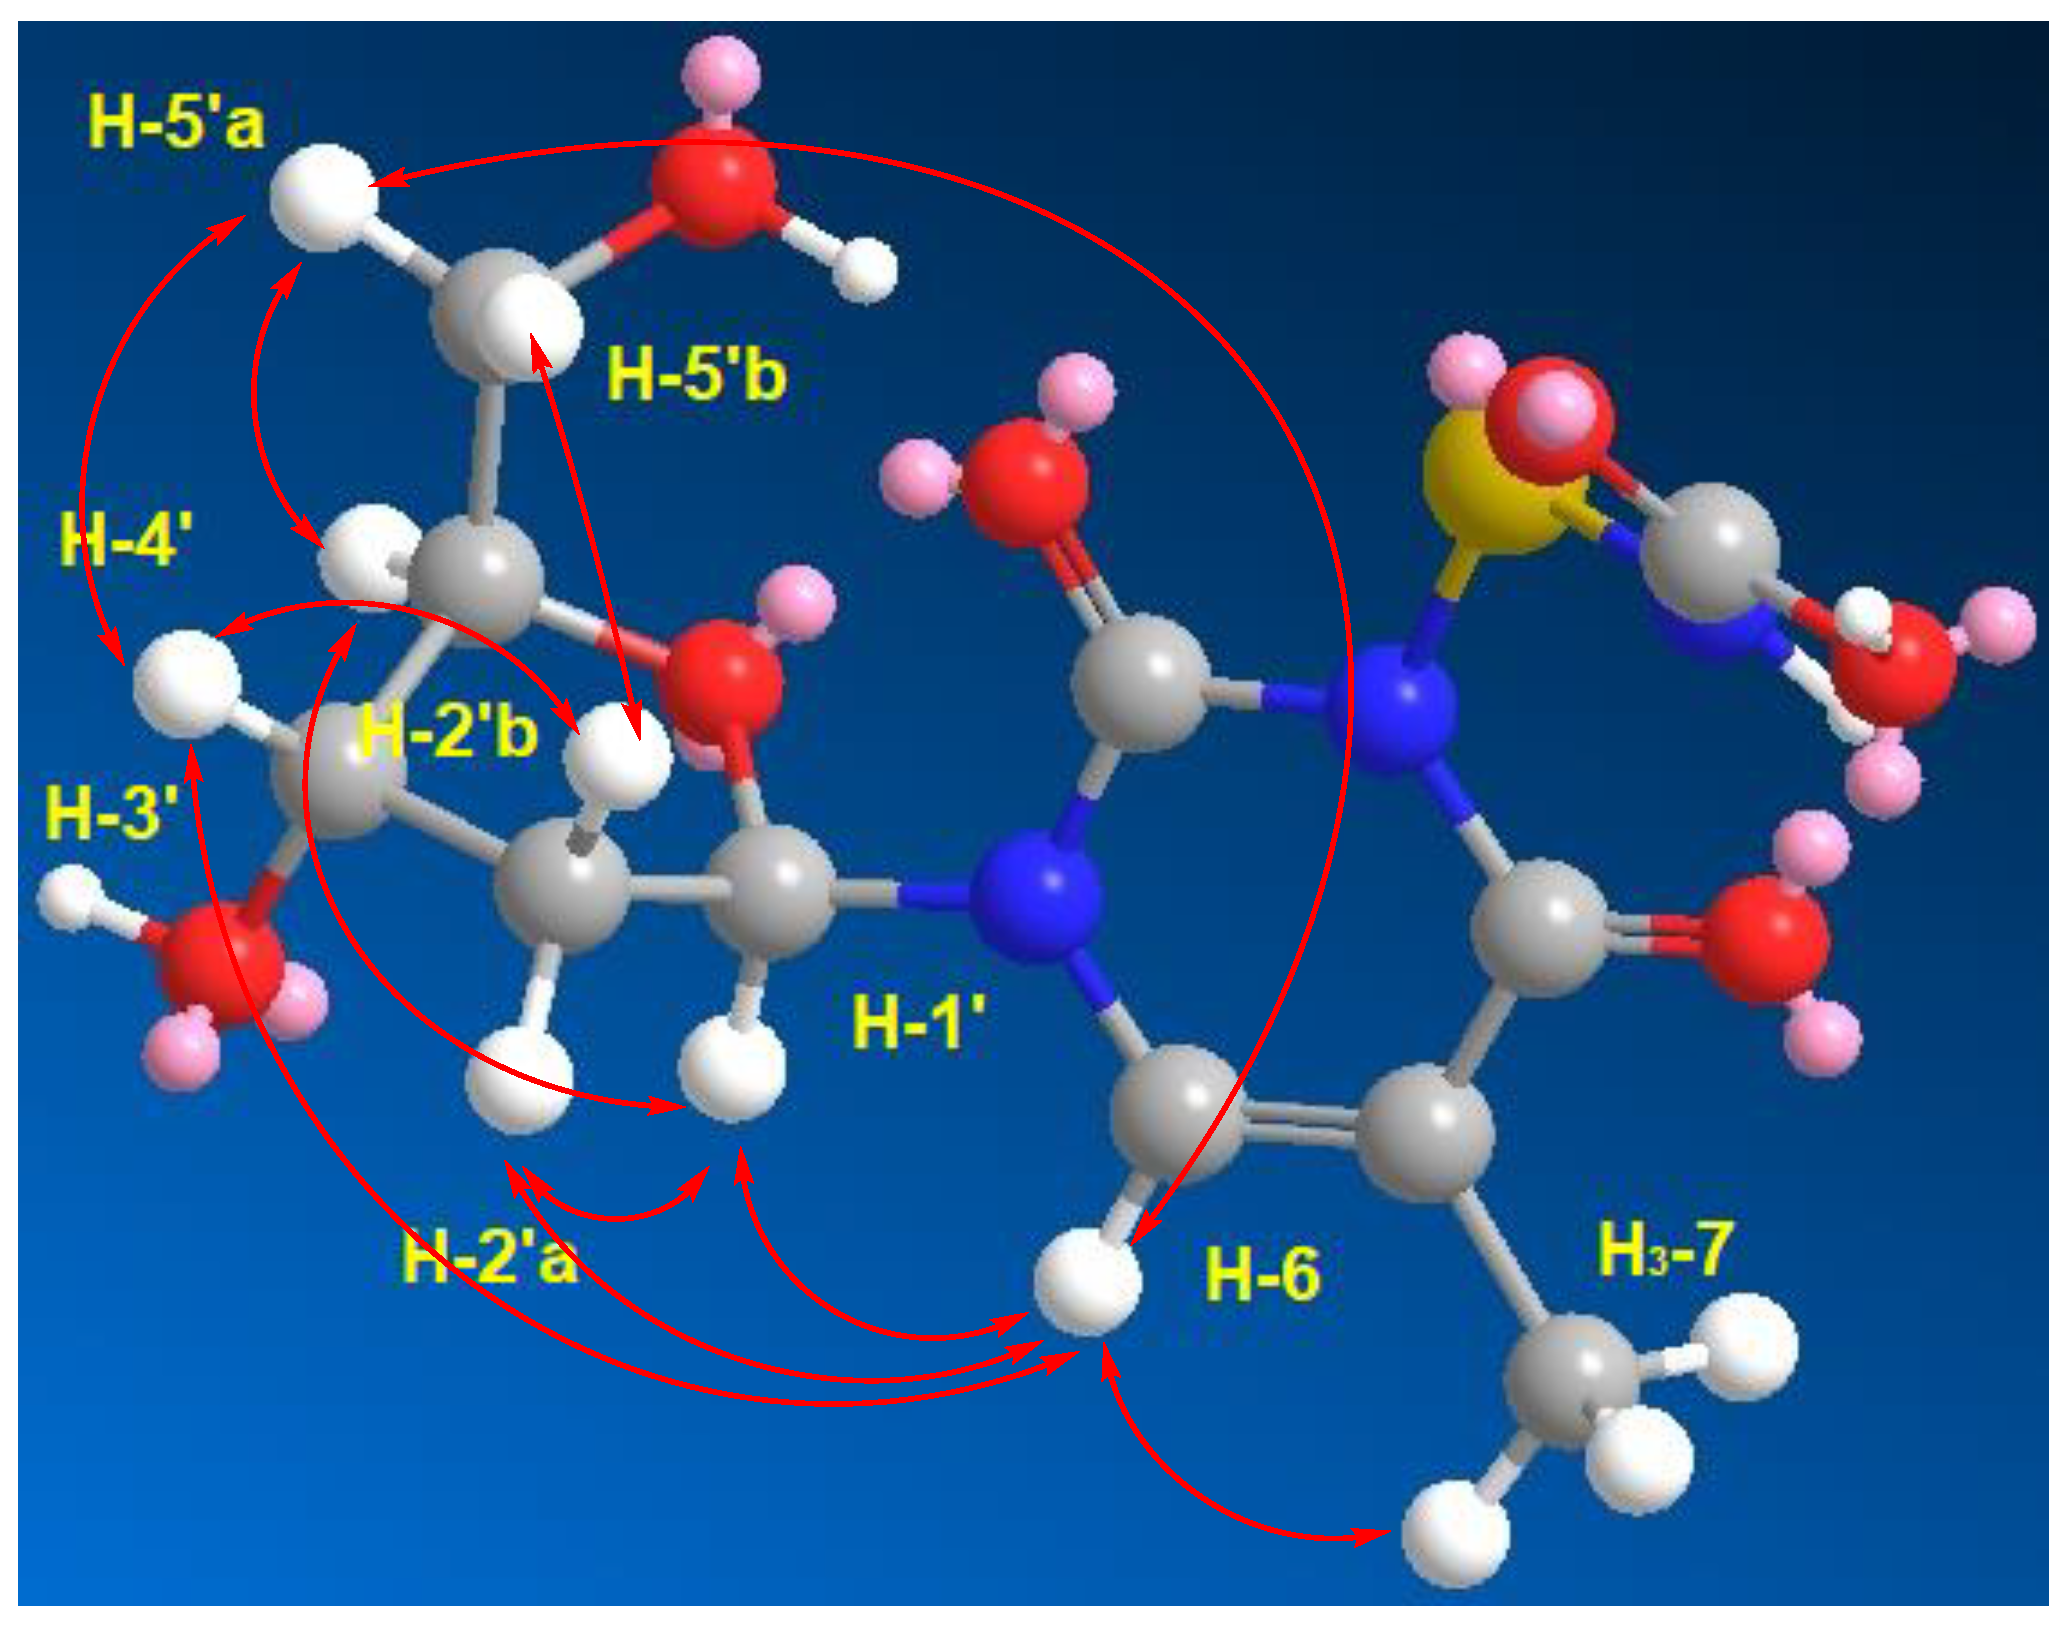
| No. | δC (mult.) | δH [m., J (Hz)] | HMBC | ROESY |
|---|---|---|---|---|
| 2 | 150.4, qC | - | ||
| 4 | 163.7, qC | - | ||
| 5 | 109.3, qC | - | ||
| 6 | 136.1, CH | 7.68 (s) | C-2, C-4, C-7 | H3-7, H-1′, H-2′a, H-4′, H-5′a |
| 7 | 12.2, CH3 | 1.75 (s) | C-4, C-5, C-6 | H-6 |
| 1′ | 83.7, CH | 6.15 (t, 7.0) | C-2, C-6, C-2′, C-3′ | H-2′a, H-4′, H-6 |
| 2′a 2′b | 39.5, CH2 | 2.07 (m) 2.02 (m) | C-4′ | H-1′, H-6 H-3′, H-4′, H-5′b |
| 3′ | 70.3, CH | 4.22 (quin, 3.0) | C-1′, C-5′ | H-2′b |
| 4′ | 87.2, CH | 3.74 (q, 3.5) | H-2′b, H-5′a, H-6 | |
| 5′a 5′b | 61.3, CH2 | 3.57 (dd, 12.0, 3.5) 3.53 (dd, 12.0,4.0) | C-3′ | H-4′, H-6 H-2′b |
| OH-3′ | 5.24 (brs) | |||
| OH-5′ | 5.05 (brs) | |||
| NH | 7.26 (brs) | |||
| 3′′ (COOH) | 158.1, qC | 10.90 (hump) |
| No. | δC (mult.) | δH [m., J (Hz)] | HMBC |
|---|---|---|---|
| 2 | 150.4, qC | - | |
| 4 | 163.7, qC | - | |
| 5 | 109.3, qC | - | |
| 6 | 136.1, CH | 7.70 (s) | C-2, C-4, C-7 |
| 7 | 12.2, CH3 | 1.77 (s) | C-4, C-5, C-6 |
| 1′ | 83.7, CH | 6.16 (t, 6.8) | C-2, C-6, C-2′, C-3′ |
| 2′a 2′b | 39.5, CH2 | 2.09 (ddd, 13.6, 7.7, 6.0) 2.04 (ddd, 13.6, 6.0, 3.4) | C-4′ |
| 3′ | 70.4, CH | 4.24 (m) | C-1′, C-5′ |
| 4′ | 87.2, CH | 3.76 (q, 4.2) | |
| 5′a 5′b | 61.3, CH2 | 3.58 (brd, 12.0) 3.54 (brd, 12.0) | C-3′ |
| OH-3′ | 5.26 (brs) | ||
| OH-5′ | 5.06 (brs) | ||
| NH2 | a |
| IC50 (μM) | Inhibition Zones (mm) at 100 μg/disc | |||
|---|---|---|---|---|
| Compound | HCT 116 | MCF 7 | S. aureus | C. albicans |
| 1 | 146 | 88.8 | 23.0 | 19.0 |
| 2 | 150 | 117 | 20.0 | 16.0 |
| 3 | ≥50 | 90 | NT | NT |
| 4 | ≥50 | 112 | NT | NT |
| 5 | 32.7 | 81.9 | 14.0 | 11.0 |
| 6 | 131 | 123 | 10.0 | 9.0 |
| Doxorubicin a | 1.62 | 0.77 | ||
| Ciprofloxacin b | 22.0 | |||
| Ketoconazole c | 30.0 | |||
© 2019 by the authors. Licensee MDPI, Basel, Switzerland. This article is an open access article distributed under the terms and conditions of the Creative Commons Attribution (CC BY) license (http://creativecommons.org/licenses/by/4.0/).
Share and Cite
Shaala, L.A.; Youssef, D.T.A.; Badr, J.M.; Harakeh, S.M.; Genta-Jouve, G. Bioactive Diketopiperazines and Nucleoside Derivatives from a Sponge-Derived Streptomyces Species. Mar. Drugs 2019, 17, 584. https://doi.org/10.3390/md17100584
Shaala LA, Youssef DTA, Badr JM, Harakeh SM, Genta-Jouve G. Bioactive Diketopiperazines and Nucleoside Derivatives from a Sponge-Derived Streptomyces Species. Marine Drugs. 2019; 17(10):584. https://doi.org/10.3390/md17100584
Chicago/Turabian StyleShaala, Lamiaa A., Diaa T. A. Youssef, Jihan M. Badr, Steve M. Harakeh, and Grégory Genta-Jouve. 2019. "Bioactive Diketopiperazines and Nucleoside Derivatives from a Sponge-Derived Streptomyces Species" Marine Drugs 17, no. 10: 584. https://doi.org/10.3390/md17100584
APA StyleShaala, L. A., Youssef, D. T. A., Badr, J. M., Harakeh, S. M., & Genta-Jouve, G. (2019). Bioactive Diketopiperazines and Nucleoside Derivatives from a Sponge-Derived Streptomyces Species. Marine Drugs, 17(10), 584. https://doi.org/10.3390/md17100584