Article

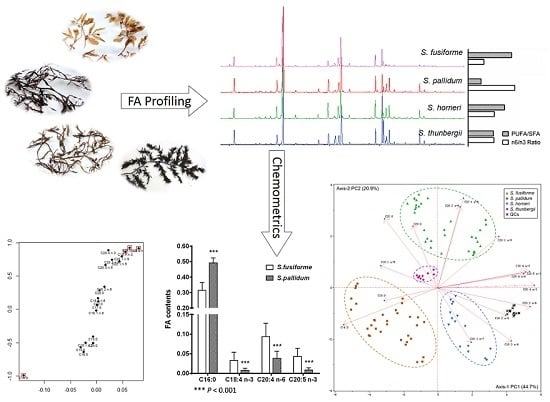
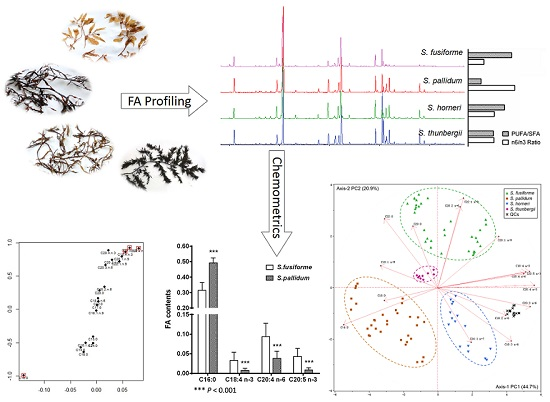
Comparative Studies on the Characteristic Fatty Acid Profiles of Four Different Chinese Medicinal Sargassum Seaweeds by GC-MS and Chemometrics

1
Key Laboratory of Marine Drugs, Chinese Ministry of Education, School of Medicine and Pharmacy, Ocean University of China, Qingdao 266003, China
2
Laboratory of Genetics and Breeding of Marine Organisms, College of Marine Life Science, Ocean University of China, Qingdao 266003, China
3
Zhejiang Mariculture Research Institute, Wenzhou 325005, China
*
Author to whom correspondence should be addressed.
Mar. Drugs 2016, 14(4), 68; https://doi.org/10.3390/md14040068
Submission received: 19 January 2016 / Revised: 18 March 2016 / Accepted: 23 March 2016 / Published: 29 March 2016
(This article belongs to the Special Issue Marine Fatty Acids-2016)

Abstract

:
Sargassum seaweeds produce abundant biomass in China and have long been used as herbal medicine and food. Their characteristic fatty acid (FA) profiles and related potential function in promoting cardiovascular health (CVH) have not been systematically investigated. In this study, FA profiles of four medicinal Sargassum were characterized using GC-MS. Principal component analysis was used to discriminate the four medicinal Sargassum, and orthogonal projection to latent structures discriminant analysis was carried out between the two official species HAI ZAO and between the two folk medicine species HAI QIAN. In all of the algae investigated, the major SFA and MUFA were palmitic and stearic acid, respectively, while the major PUFAs were linoleic, arachidonic, and eicosapentaenoic acid. S. fusiforme and S. horneri had higher concentrations of PUFAs. With respect to CVH, all of the studied species, particularly S. fusiforme, exhibited satisfactory levels such as PUFA/SFA ratio and n-6/n-3 ratio. Each species possesses a unique FA profile and is discriminated clearly. Potential key FA markers (between the two Chinese official species, and between the two folk species) are assessed. The study provides characteristic fatty acid profiles of four Chinese medicinal Sargassum and their related potential function in promoting CVH.

Graphical Abstract

1. Introduction

Polyunsaturated fatty acids (PUFAs) have been shown to have beneficial association with cardiovascular health (CVH) [1]. Several PUFA drugs have been approved by FDA until now, such as Epanova and Lovaza, for treating coronary heart disease and dyslipidemia [2,3]. Being considered as the most important PUFAs supplement, fish oil is a well-known resource of n-3 PUFAs, whose substitutes include olive oil, vegetable oil, krill oil, and seaweed oil [4]. It is clear from recent prospective randomized trials that both fish and plant sources of n-3 PUFAs can favorably impact CVH [5]. On the other hand, fatty acid (FA) is commonly used as a building-block of complex lipids, such as glycoglycerolipids. We found that monogalactosyldiacylglycerols (MGDGs) from marine seaweed Sargassum horneri showed significant effects on triglyceride accumulation inhibition in 3T3-L1 adipocytes [6].
Sargassum, a genus of brown seaweed (Phaeophyceae) in the Fucales order, is abundant in China. Some species in this genus have been widely used as traditional Chinese medicine (TCM) for thousands of years. S. fusiforme (Hizikia fusiforme) and S. pallidum are the two official species recorded in Chinese Pharmacopoeia and are both referred to as “HAI ZAO”. S. horneri and S. thunbergii are used as folk medicine and are both referred to as “HAI QIAN”. These four seeweeds possess a similar function and usage, for treating atherosclerosis, hyperlipidemia, hypertension, thyroid diseases, and cancer [7,8]. Sargassum algae are rich in fatty acids, which are known to play an important role in CVH. However, the characteristic fatty acid profiles of these marine seaweeds TCM and their function in improving CVH have not been systematically investigated.
The objective of this study was to characterize the fatty acid profiles of four medicinal Sargassum (S. fusiforme, S. pallidum, S. horneri, and S. thunbergii) in China via gas chromatography-mass spectrometry (GC-MS). Their potential effects on CVH were evaluated by nutritional indices, such as the n-6 PUFA/n-3 PUFA ratio [9], the PUFA/SFA ratio [10], the unsaturation index (UI), the atherogenic index (AI), and the thrombogenic index (TI) [11]. The characteristic FAs for these species were evaluated using chemometric tool analysis. It is known that FA composition varies along with environmental factors, which make it more complicated [12]. Thus, large-scale representative samples are required for the characteristic FA profile of individual alga. Detailed comparison between the two pharmacopoeia species (S. fusiforme and S. pallidum) and between the two folk medicine species (S. horneri, and S. thunbergii) were constructed.

2. Results and Discussion
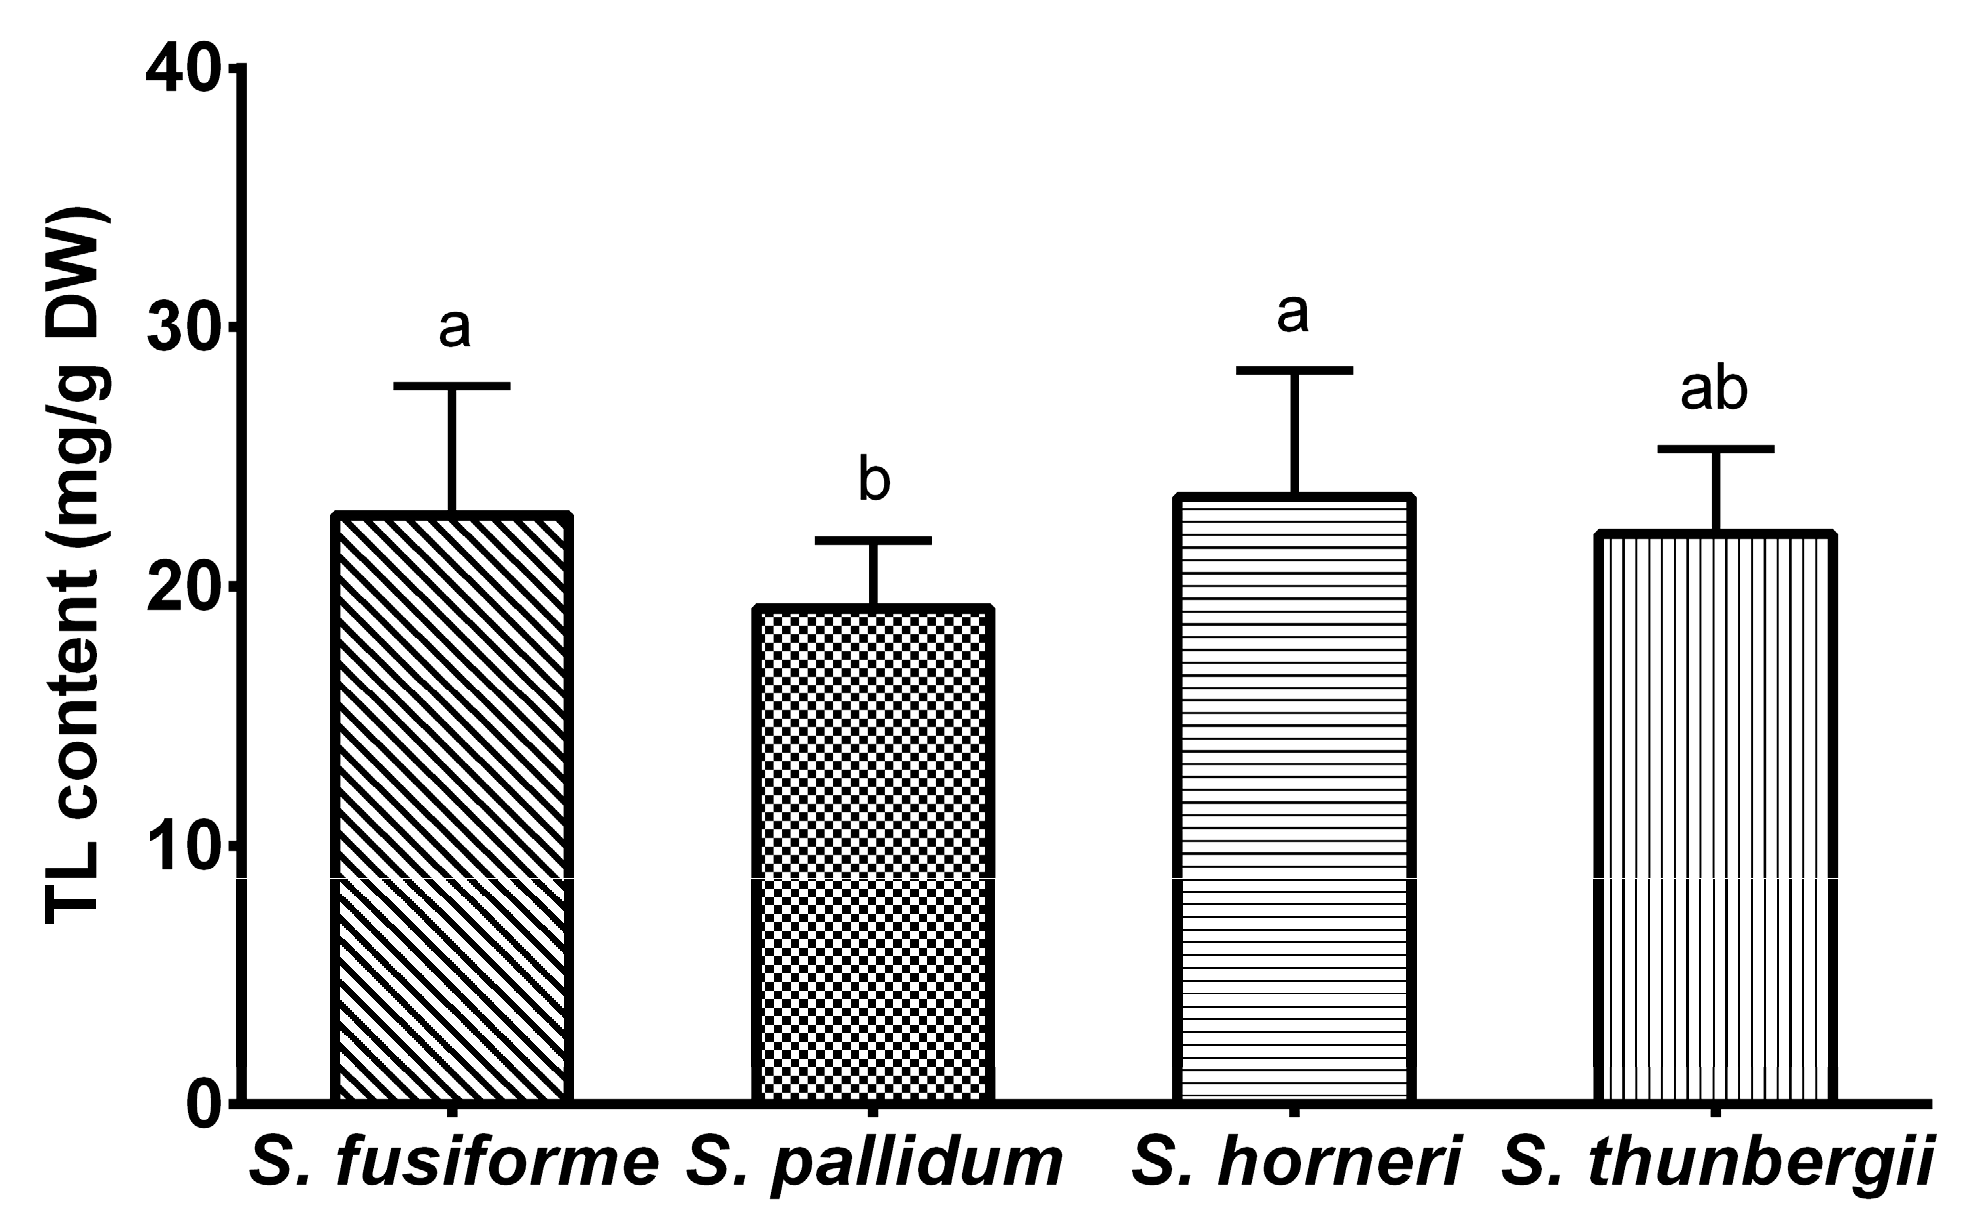
2.1. Total Lipids

The total lipid (TL) contents in the four algae investigated in this study are shown in Figure 1. S. horneri exhibited the highest TL content (23.4 ± 4.9 mg/g DW), which was lower than that reported by Nomura (47.4 ± 0.8–142.5 ± 32.0 mg/g DW) [13] and Terasaki (62.6 ± 18.7 mg/g DW) [14] but higher than that reported by Murakami (5.17 ± 0.17–11.5 ± 0.7 mg/g DW) [15]. The TL contents of S. fusiforme (22.7 ± 5.0 mg/g DW) and S. thunbergii (22.0 ± 3.3 mg/g DW) were in accordance with the literature (15.7–27.5 mg/g DW for S. fusiforme [14,16,17] and 31.8 ± 13.1 mg/g DW for S. thunbergii [14]). The lowest value was observed in S. pallidum (18.2 ± 1.6 mg/g DW), which was significantly different from both S. horneri and S. fusiforme (p < 0.01) in the present study.

2.2. Fatty Acid Profiles

The fatty acid contents (composition/profiles) and nutritional indices related to CVH of the four species are presented in Table 1. The four algal species exhibited similar FA patterns but differed significantly in their FA contents (p < 0.05 for all FAs). Typical GC-MS chromatogram is shown in Figure 2.
Within the algae analyzed, the saturated fatty acids (SFAs) varied from 41.70% ± 6.88% of total fatty acid methyl esters (FAMEs) in S. fusiforme to 61.12% ± 4.80% in S. pallidum. Monounsaturated fatty acids (MUFAs) ranged from 27.09% ± 1.18% of total FAME in S. pallidum to 32.89% ± 1.07% in S. thunbergii. In all the species, palmitic acid (C16:0) was the dominant FA, and oleic acid (C18:1 n-9) was the dominant unsaturated fatty acid (UFA). These findings are in agreement with previous studies, in which C16:0 was the major FA in all Sargassum species [18,19,20].
S. fusiforme was the species with the highest PUFA levels (26.09% ± 7.97%); S. pallidum, in contrast, had the lowest PUFA levels (11.79% ± 4.62%). For the n-3 PUFA family, the highest proportion was also found in S. fusiforme (8.58% ± 4.37%), and the lowest proportion was observed in S. pallidum (1.71% ± 0.95%). Eicosapentaenoic acid (C20:5 n-3, EPA), stearidonic acid (18:4 n-3, SDA), and eicosatetraenoic acid (C20:4 n-3, ETA) were the only three n-3 PUFAs detected. The n-6 PUFA family content varied from 10.07% ± 3.70% in S. pallidum to 19.91% ± 1.78% in S. horneri. The most abundant n-6 PUFA was arachidonic acid (C20:4 n-6, ARA) in S. fusiforme (9.37% ± 3.38%) and S. horneri (10.70% ± 1.19%) and linoleic acid (C18:2 n-6, LNA) in S. pallidum (5.03% ± 1.66%) and S. thunbergii (7.01% ± 0.97%). Our observation that ARA and LNA comprised the major n-6 PUFAs in the algae we investigated is in keeping with other reports on S. fusiforme [14,16,20], S. pallidum [19,21], S. horneri [13,14,22], and S. thunbergii [14,20,23,24]. In addition, minor amounts of γ-linolenic acid (C18:3 n-6, GLA), eicosadienoic acid (C20:2 n-6), and dihomo-γ-linolenic acid (C20:3 n-6, DGLA) were recorded.
It should be noted that lower levels of PUFAs were recorded in our study than in other studies. Dawczynski [15] found much higher levels of EPA in fresh S. fusiforme (42.4% ± 11.88%), which was approximately 10-fold greater than our measurement (4.29% ± 2.10%). In addition, the ARA content was reported to be 15.5%–38.5% in S. pallidum [19,25,26] and 10.2%–14.8% in S. thunbergii [14,20,23], and a high content of DGLA (14.5%–16.5%) in S. pallidum was reported as well [26]. Khotimchenko demonstrated that different parts of the thallus of S. pallidum differ in the content of DGLA and other PUFAs, and the distribution of PUFAs within the thallus does not depend on environmental factors [18]. Sanina posited the opposite result, that unsaturation and the n-3/n-6 ratio of FAs in the glycolipids of S. pallidum rise from summer to winter [12]. In our opinion, aside from environmental factors, the algal material drying process is primarily responsible for the loss of PUFA content [6,27,28]. In the present study, the cleaned algae were dried under sunlight and stored in the dark at room temperature, which follows the processing method of food and herbal medicine in China. There are several studies on FAs of S. fusiforme in China that performed a similar processing method. The literature data showed 5.8%–11.8% for C18:2 n-6, 0.7%–3.3% for C18:3 n-3, 0.5%–16.4% for C20:4 n-6, and 4.4%–7.9% for C20:5 n-3 [29,30,31]. Our results are consisted with the literature.
The PUFA/SFA ratio is a primary indicator used to evaluate the lipid quality, and its recommended minimum value is 0.45 by the British Department of Health [10]. That level is exceeded by the PUFA/SFA ratios found in S. fusiforme (0.67) and S. horneri (0.56) in the present study.
The lipid contents of marine algae are unique with respect to their low ratio of n-6 to n-3 polyunsaturated fatty acids (PUFA) [32]. The balance between n-6 and n-3 PUFAs is demonstrated in several studies to associate with an improvement in whole body glucose tolerance, obesity, inflammatory, and other metabolic dysfunction [33]. The n-6 PUFA/n-3 PUFA ratio should not exceed 10 according to WHO recommendations [9], while the European Nutritional Societies suggest this ratio not exceed 5 for the prevention of inflammatory, cardiovascular, and neurological disorders [34]. All the examined Sargassum species exhibited a favorable n-6/n-3 ratio below 5—except S. pallidum (7.17).
The artherogenic index (AI) and thrombogenic index (TI) are proposed to evaluate risky factors that are implicated in coronary heart disease development by Ulbricht [11]. Both of them were <2 in the investigated species, owing to the high n-3 PUFA contents and low n-6/n-3 ratios. The results suggest that the Sargassum might be beneficial to cardiovascular health.

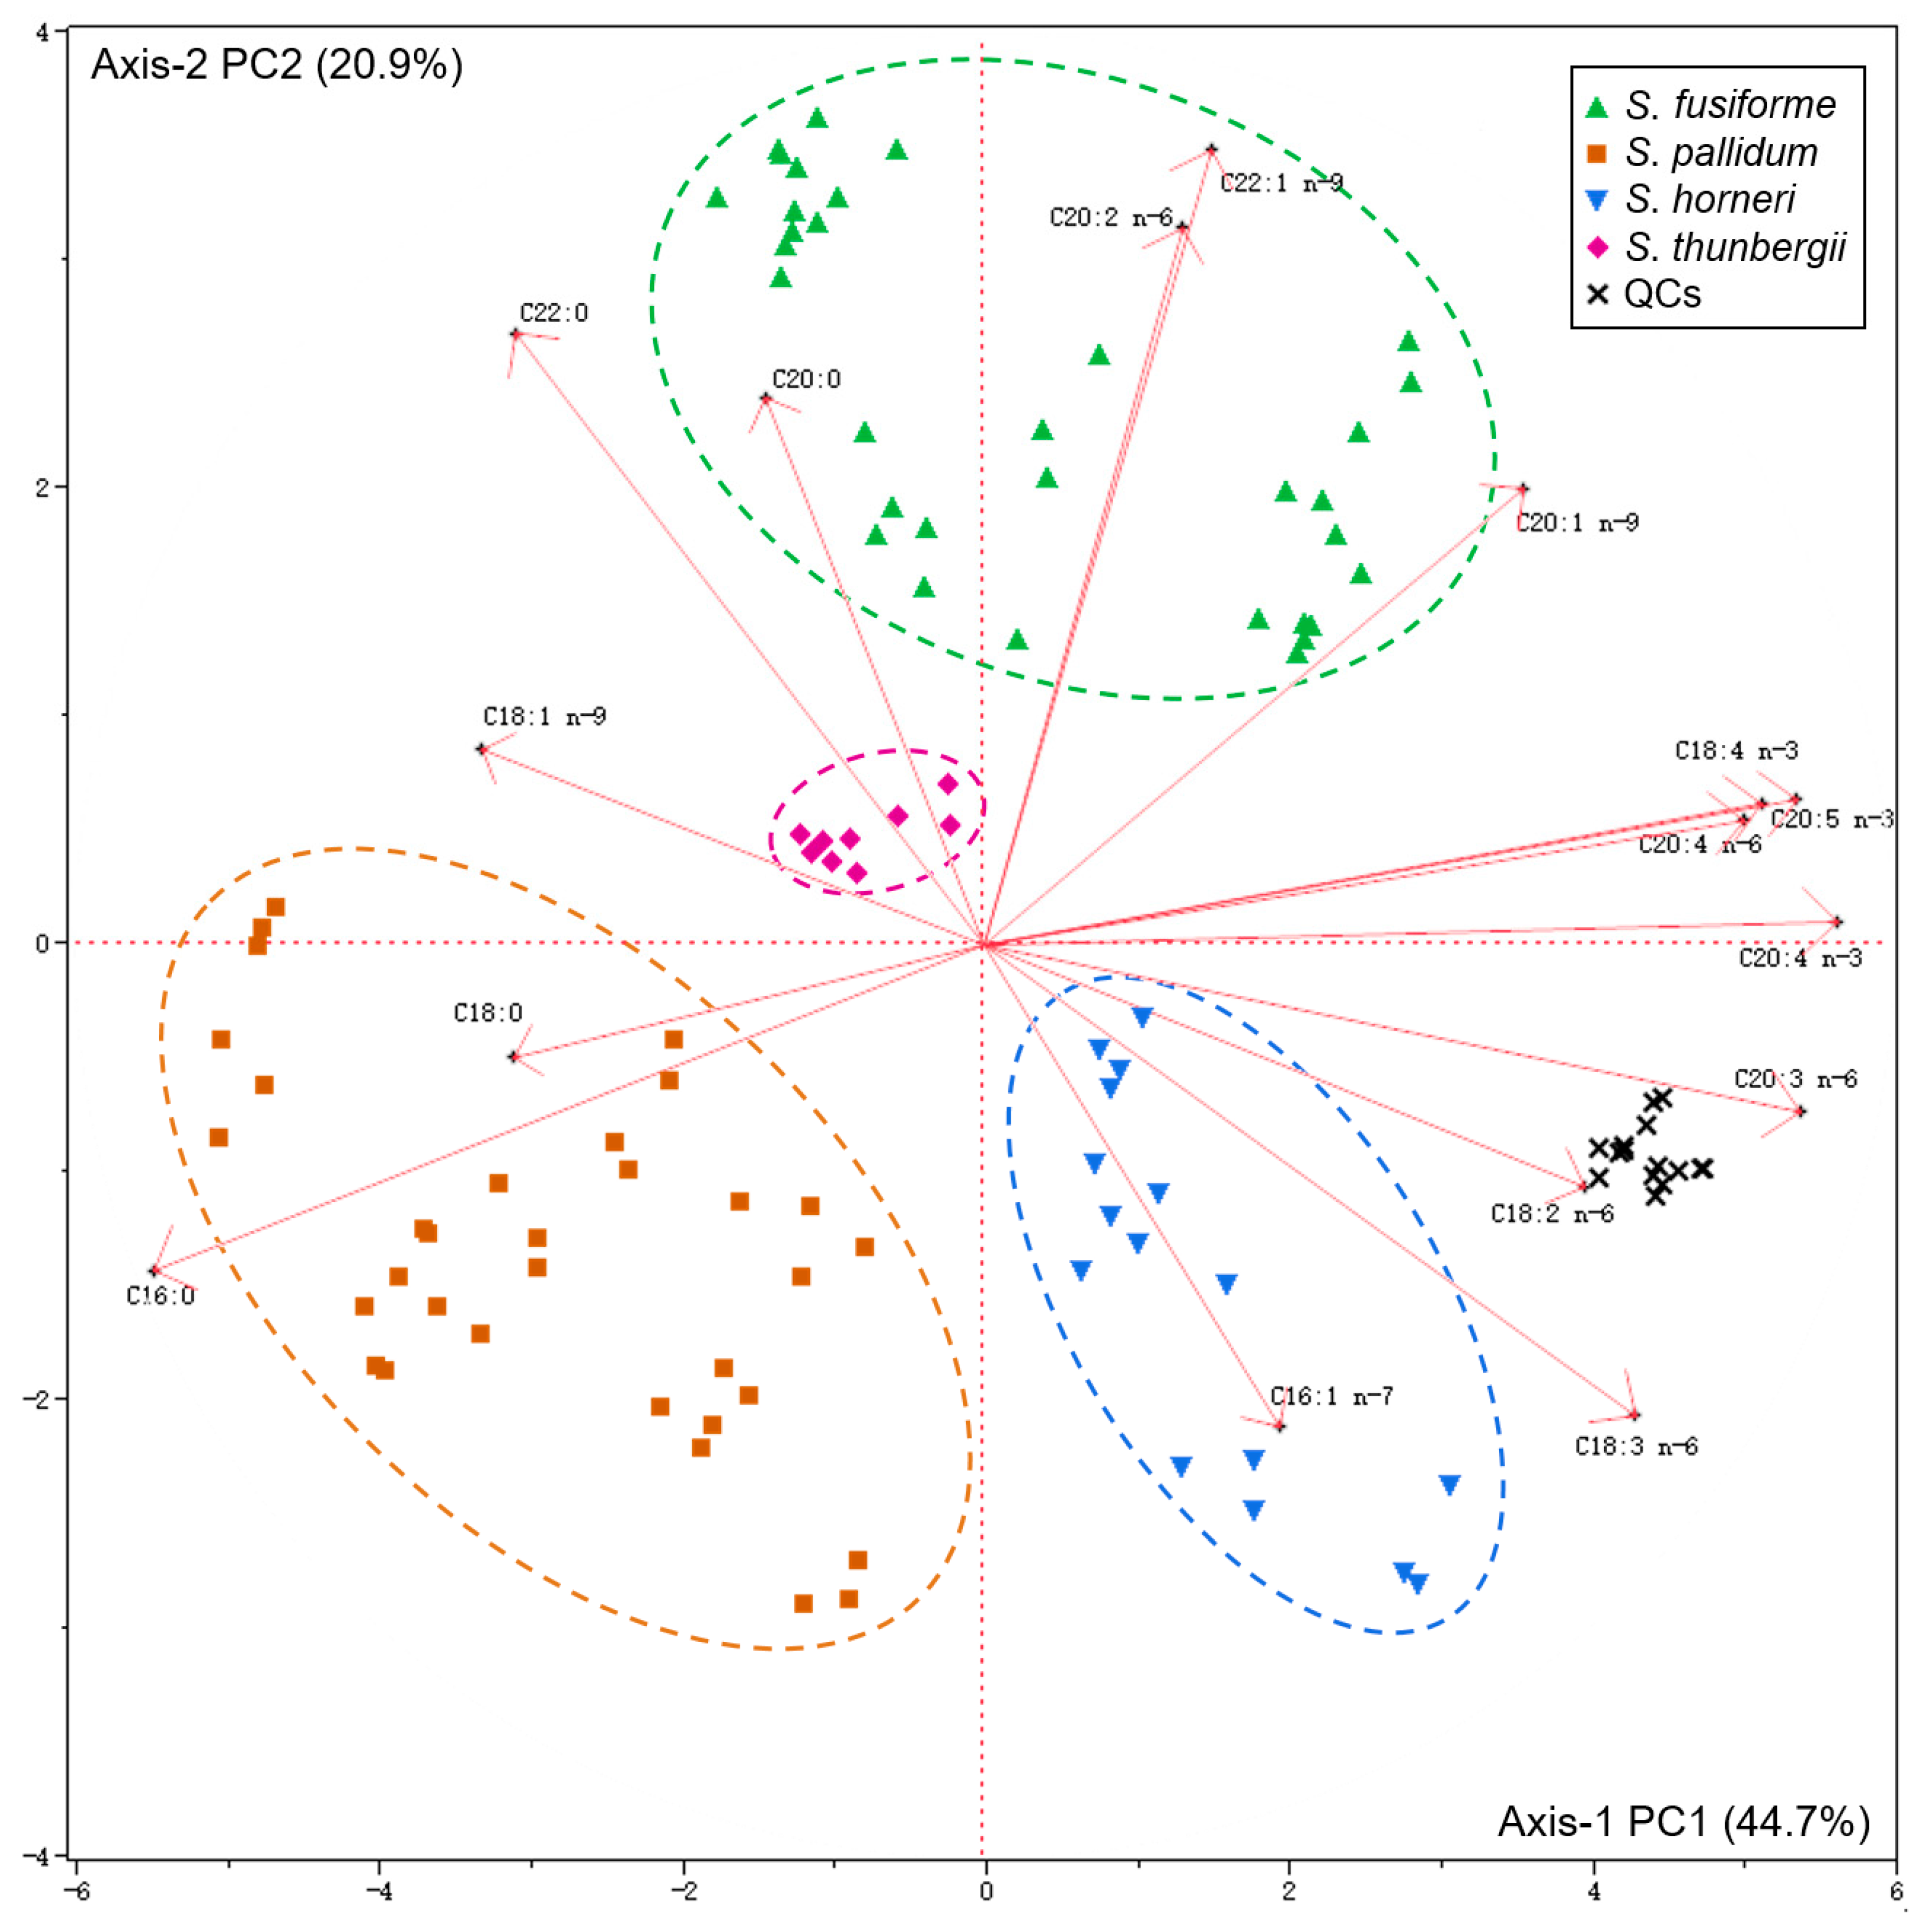
2.3. Principal Component Analysis

A principal component analysis (PCA) was performed, and a bi-plot graph (scores plot and loading plot) was obtained using the FA variables (Figure 3). The first two principal components (PC1 and PC2) accounted for 44.7% and 20.9% of the total variation, respectively. Generated from comparisons of the first two PCs, the bi-plots revealed four distinct groups of samples. The QC samples clustered together in the plot, which verifies the reliability of the GC-MS data [35,36]. Clear separation of the algal samples was observed, and no outliers were found, which indicates that the fatty acid profiles were quite different among the studied species.
Specific patterns of correlation between PCs and FA variables are visualized in Figure 3. Axis-1 represents the degree of unsaturation, which indicates that algae with high UFA contents (particularly n-3 and n-6 PUFAs) are oriented in the positive axis-1, whereas those algae with higher amounts of SFAs are centered more towards the negative axis-1. Axis-2 expresses the length of the FA carbon chains. As the value on axis-2 rises, the lengths of the FA carbon chains in the algae increase (Figure 3). A closer examination of the PCA results indicated that S. pallidum was correlated with stearic acid (C18:0) and palmitic acid (C16:0), whereas S. fusiforme showed a strong positive correlation with C20 and C22 FAs. Moreover, S. horneri had higher positive loadings for C18 n-6 PUFAs (including LNA and GLA). A weak positive correlation with FAs was observed in S. thunbergii.
Our results revealed that each individual species possesses a unique FA profile. FA signature is considered as potential chemotaxonomic tool for closer understanding the relationships among different macroalgae species at ordinal levels of families, orders, and phyla [18]. Poor evidence is found for FA signature applying to classify different species in Sargassum genus until now. Therefore, a PCA of FA profiles may be a potential chemotaxonomic tool for Sargassum species.

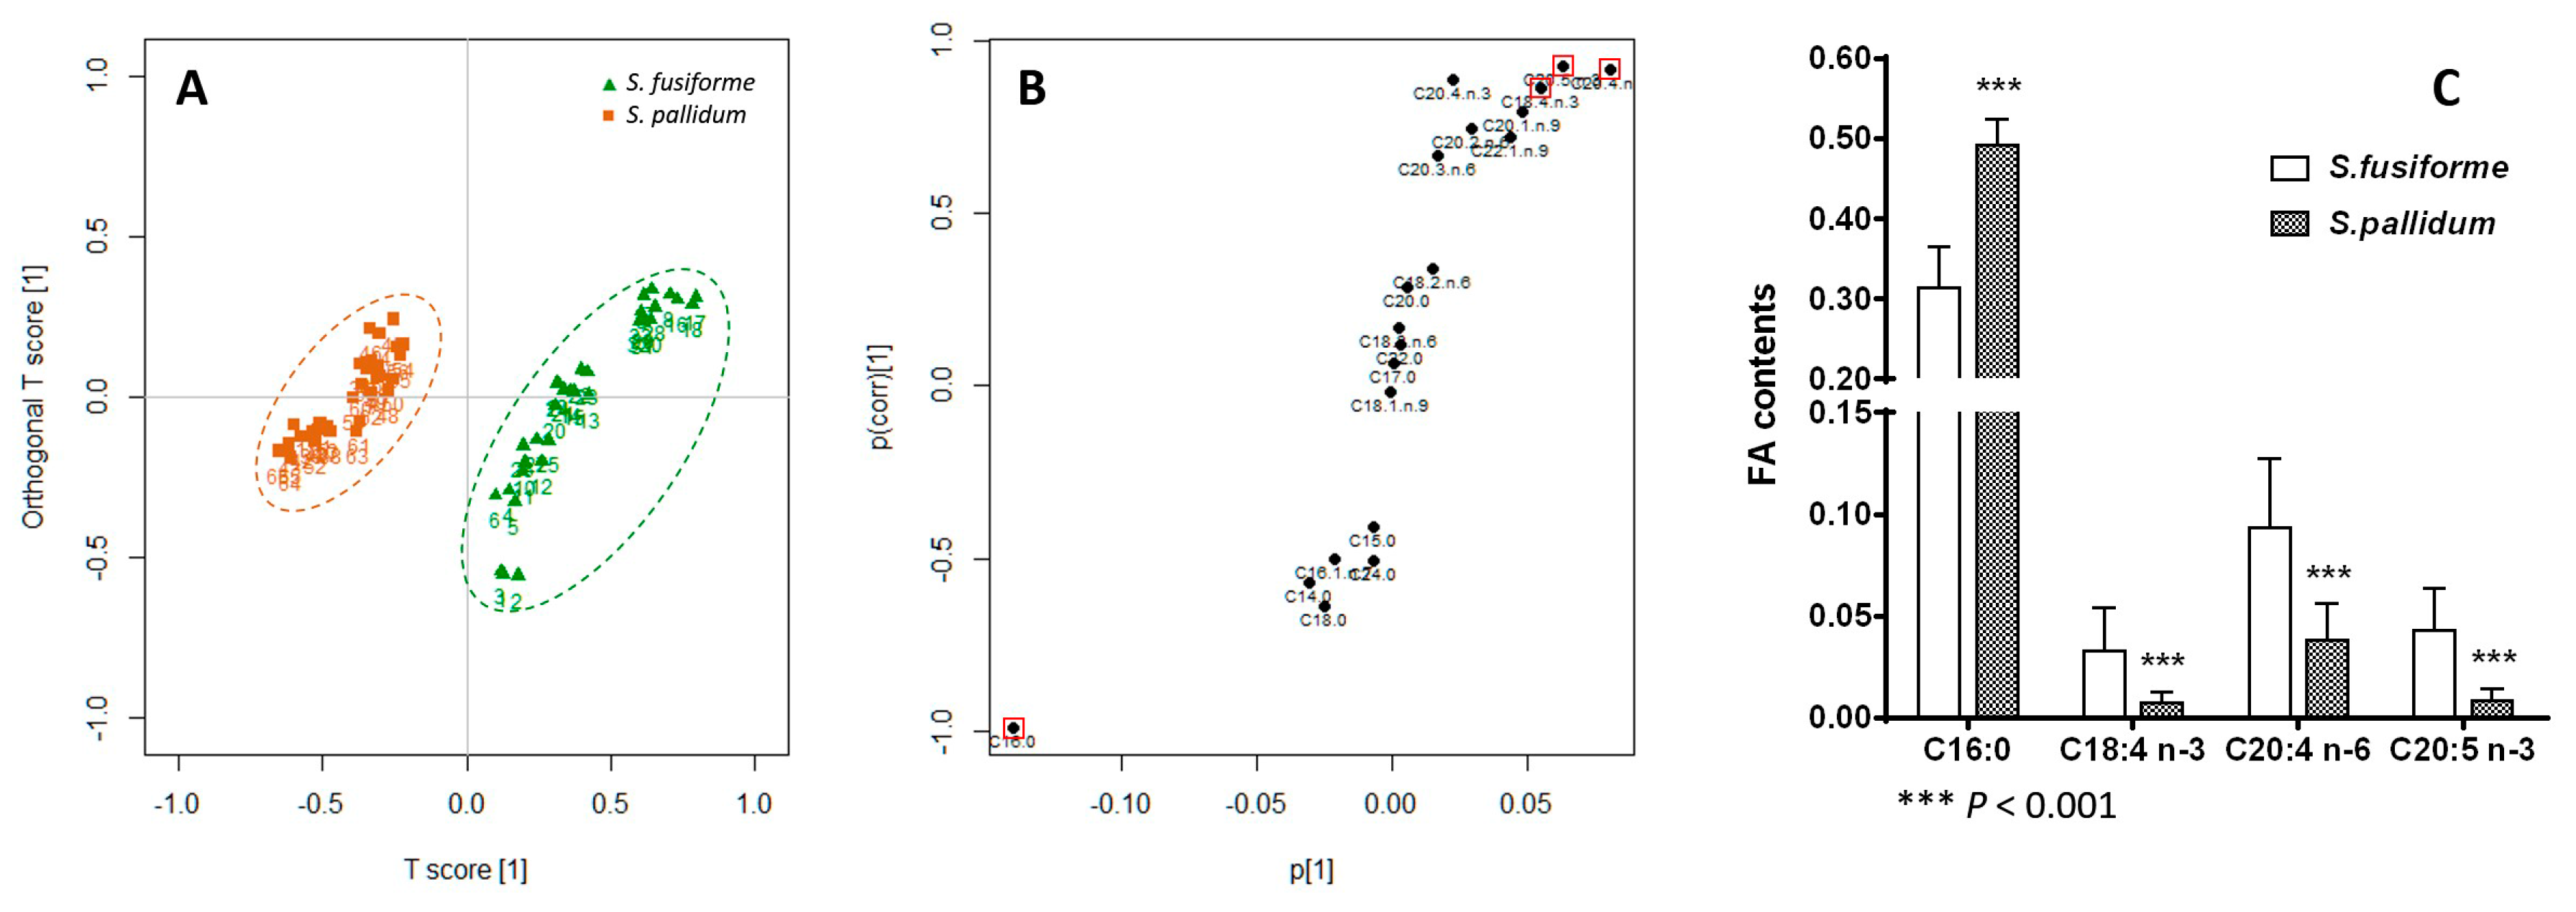
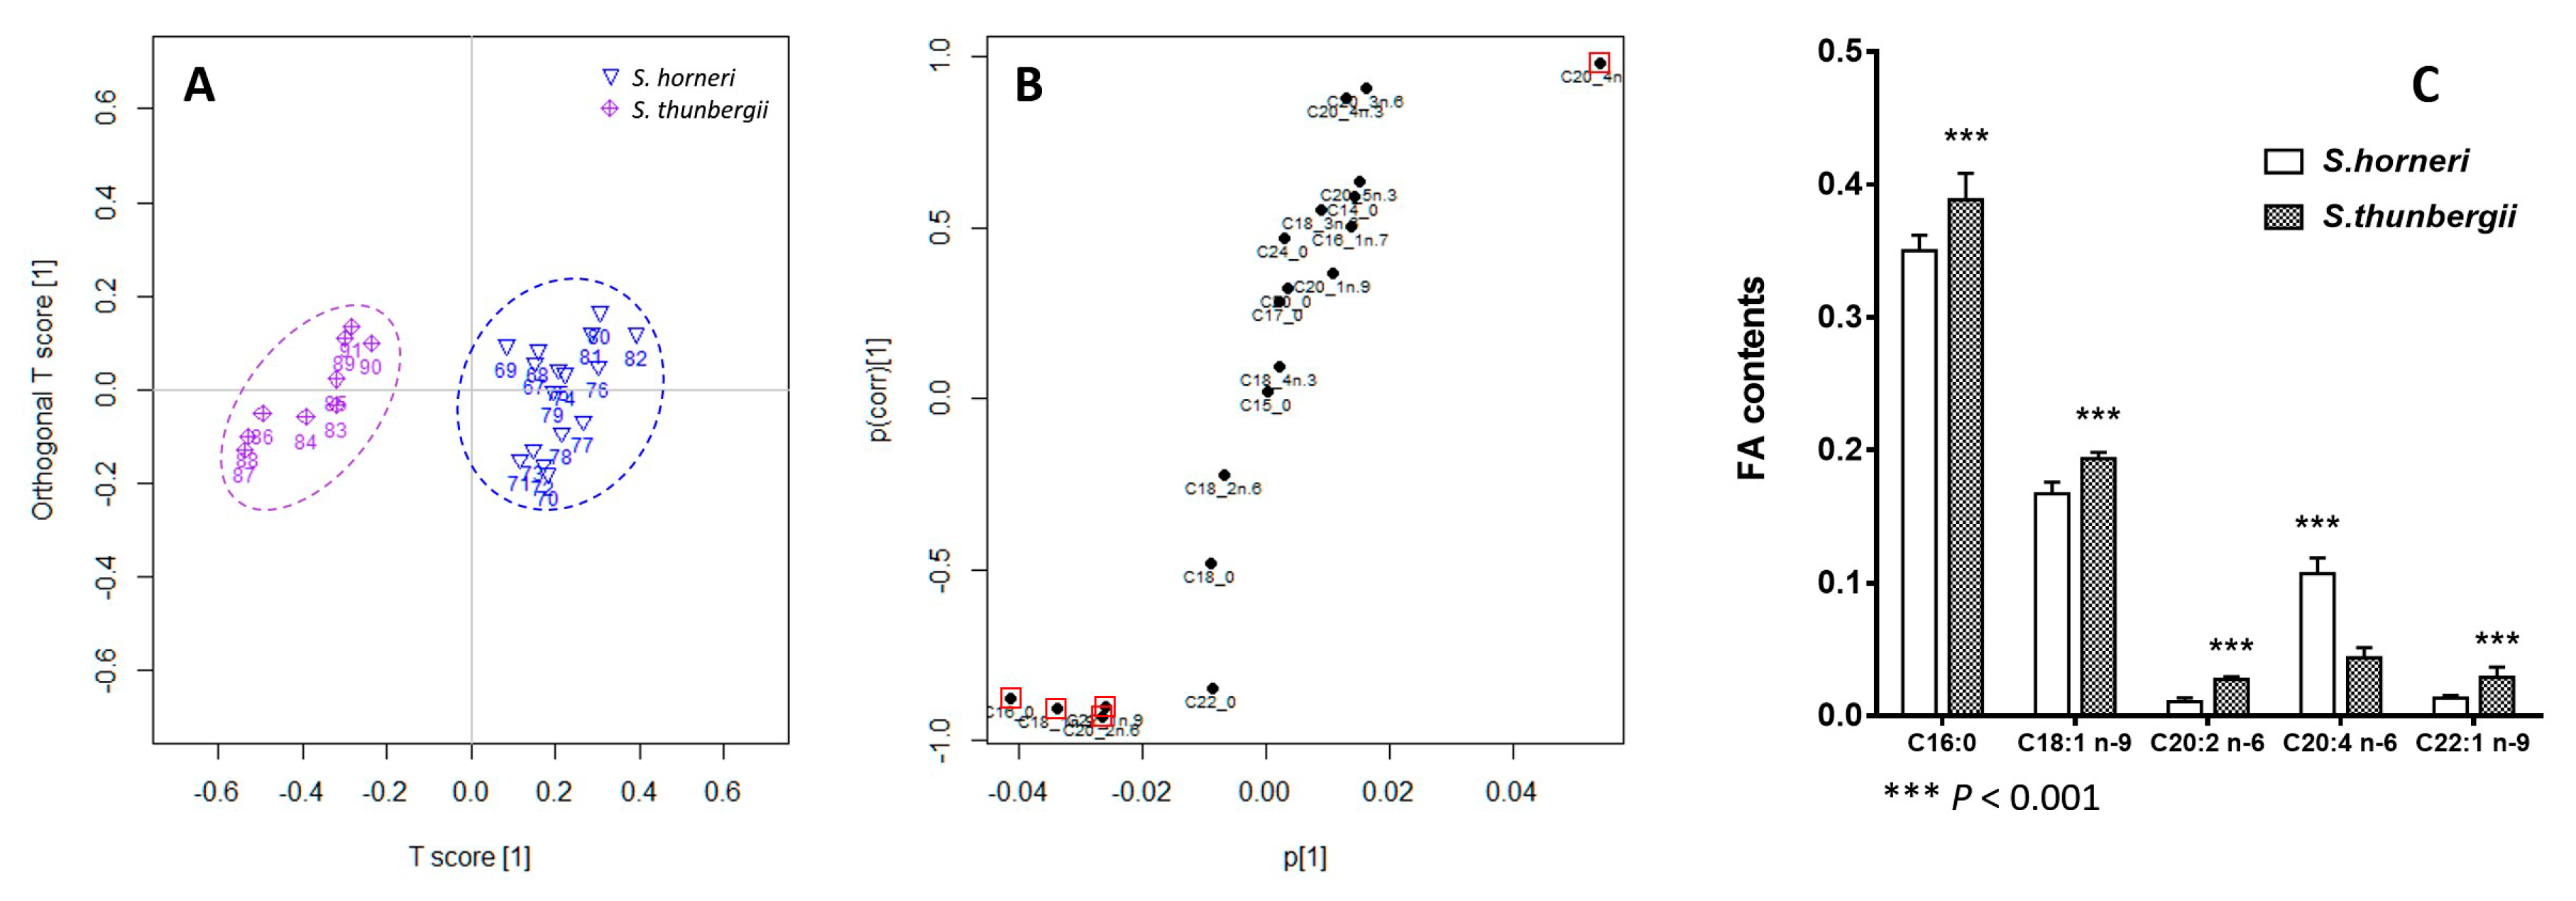
2.4. Orthogonal Projection to Latent Structures Discriminant Analysis

S. fusiforme and S. pallidum are the two official species HAI ZAO with the same function and usage in Chinese Pharmacopoeia. In the present study, their FA profiles were significantly different (Table 1), particularly with respect to nutritional indices such as the n-6/n-3 ratio, AI, and TI. To reveal potential key FAs differences between them, orthogonal projection to latent structures discriminant analysis (OPLS-DA) was applied to the FA profiles. The score scatter plot and S-plot were generated after Pareto scaling and mean-centering. In score scatter plot (Figure 4A), S. fusiforme and S. pallidum were highly discriminated by OPLS-DA. In S-plot (Figure 4B), the x-axis represents the contribution of a particular marker to the group differences, while the Y-axis denotes confidence of the marker’s contribution. All the long chain (C20 and C22) PUFAs were grouped in the upper-right quadrant, which displayed the increased FAs in S. fusiforme. Meanwhile, most of the SFA were in the lower-left quadrant, as they were S. fusiforme’s decreased FAs. The top four important variables were selected according to the variable importance in the projection (VIP) scores and marked in the S-plot. As shown in Figure 4C, S. fusiforme exhibited significantly higher contents of PUFAs C18:4 n-3, C20:4 n-6, and C20:5 n-3 than S. pallidum. In contrast, the content of C16:0, the only SFA detected, was distinctly lower in S. fusiforme (p < 0.001 for all the FAs). There were obvious differences in the aspect of FA profile between S. fusiforme and S. pallidum from the current results.
Similarly, OPLS-DA was performed to discern the separation between the two folk medicine HAI QIAN, S. horneri and S. thunbergii. They were clearly discriminated as well in the score scatter plot (Figure 5A). However, the FA variables distributed irregularly in the S-plot (Figure 5B), which was different from that in the two official species HAI ZAO. Nevertheless, top five important variables were found, namely, C16:0, C18:1 n-9, C20:2 n-6, and C22:1 n-9 for the increased FAs in S. thunbergii, and C20:4 n-6 increased in S. horneri (Figure 5C).

3. Experimental Section

3.1. Sampling and Processing of Algal Material

In total, the 91 algae samples used in this study were collected from the east coast of China: 33 samples of S. fusiforme, 33 samples of S. pallidum, 16 samples of S. horneri, and 9 samples of S. thunbergii (see Table S1). All the algal materials used in this study were provided by the Culture Collection of Seaweed at the Ocean University of China. The collected algae were identified by Prof. Dr. Tao Liu (College of Marine Life Science, Ocean University of China), and voucher specimens have been deposited at the School of Medicine and Pharmacy, Ocean University of China. The collected algal materials were washed with fresh water followed by distilled water and thoroughly cleaned of epiphytes. In accordance with the drying processes used for food and herbal medicine in daily life in China, the cleaned algae were dried under sunlight instead of freeze-drying. The dried fronds were cut into short pieces and stored in the dark at room temperature until use.

3.2. Lipid Extraction

The dried algae were ground into 40-mesh powders before analysis. The Bligh and Dyer method was performed for total lipid extraction [37]. Briefly, approximately 750 mg of powder was extracted with chloroform:methanol (1:2 v/v) containing BHT (0.01% w/v) and then evaporated to dryness in vacuum. The extracted lipids were weighed, and subsequent analyses were performed immediately.

3.3. Fatty Acid Esterification

The fatty acids were converted into their corresponding FAMEs via transmethylation of the lipid samples with 1.0 mL of 1 M KOH in anhydrous methanol, followed by heating for 10 min at 70 °C. Subsequently, 2.0 mL of 1 M methanolic HCl were added, followed by heating for 10 min at 70 °C and the addition of 1 mL of water [38]. Nonadecanoic acid (C19:0) was used as an internal standard, and the FAMEs were extracted in hexane.

3.4. Fatty Acid Analysis

GC-MS analysis was performed using a Thermo Trace 1300 ISQ gas chromatography-mass spectrometer (Thermo Fisher Scientific Inc., San Jose, CA, USA) equipped with a TR5-MS capillary column of 30 m × 0.25 mm × 0.25 μm (Thermo Fisher Scientific Inc., San Jose, CA, USA). The column temperature was initially set at 120 °C, held at that temperature for 1 min after injection, increased at a rate of 15 °C/min to 180 °C, and held at that temperature for 1 min. Next, the temperature was continually increased at a rate of 2 °C/min to 200 °C, held at that temperature for 1 min, and then increased at a rate of 10 °C/min to 260 °C, followed by a final hold at that temperature for 1 min. The injection was performed in the splitless mode, and the injection temperature was set at 250 °C. Nitrogen (99.9% purity) was used as the carrier gas at a flow rate of 1 mL/min. The interface temperature was set at 250 °C and the electron energy was 70 eV. The scan range was from m/z 20 to 500 in mass detection conditions, and the chromatograms were acquired in full scan mode. All analyses were performed in triplicate. Visualization, calibration, and format transfer of the GC-MS data were performed using Xcalibur 2.1 (Thermo Fisher Scientific Inc.), followed by deconvolution using IXCR (Advanced Chemistry Development, Inc., Toronto, ON, Canada). The FAME standards (purity: 99%) mixture was purchased from Nu-Chek-Prep, Inc. (Elysian, MN, USA). The FAME peaks were identified using the NIST 11 MS data library and a comparison of their retention times with authentic standards. All the FAME peaks were quantified by area normalization with threshold set at 0.1% prior to data analysis and statistics.

3.5. Quality Control

The data acquisition sequence was randomized to minimize the time variation, as in the GC-MS experiment. Quality control (QC) samples, consisting of a representative average of samples pooled from different final sample extracts, were tested at the beginning, end, and randomly throughout the analytical run to ensure the stability of the GC-MS method [35,39].

3.6. Statistical Analysis

GraphPad Prism 6.0 was used for statistical analysis. All data are presented as the means ± standard deviation (SD). Statistical analysis was conducted using the unpaired two-tailed t-test and one-way ANOVA (using the Tukey post hoc test). p < 0.05 was considered to be statistically significant. JMP 10.0 (SAS Institute Inc., Cary, NC, USA) and R-package muma [40] used for multivariate statistical analysis.

4. Conclusions

In this study, FA profiles of four medicinal Sargassum seaweeds (S. fusiforme, S. pallidum, S. horneri, and S. thunbergii) were characterized using GC-MS. Each species possesses unique FA profile characteristics, as assessed using PCA. Potential key FAs comprising significant differences between the two Chinese official species, and between the two folk medicine species, were assessed using OPLS-DA, respectively. With respect to cardiovascular health, all of the studied species, particularly S. fusiforme, exhibit satisfactory nutritional indices, such as the PUFA/SFA ratio, the n-6 PUFA/n-3 PUFA ratio, AI, and TI. Our current study suggests that the Sargassum might be beneficial to CVH.

Supplementary Materials

The following are available online at www.mdpi.com/1660-3397/14/4/68/s1, Table S1: Algal samples information.

Acknowledgments

Financial support from the NSFC (31271845) and the National High Technology Research and Development Program of China (863 Program, 2013AA093003) to Hongbing Liu is gratefully acknowledged. The authors also thank Yuanhong Wang (Laboratory of Chemical Analysis, Ocean University of China) for providing standards and assisting in FAME identification and Zuowei Yan (ACD/Labs) for processing spectral deconvolution and peak alignments.

Author Contributions

Hongbing Liu and Huashi Guan conceived and designed the experiments; Tao Liu and Lining Zhang provided the algal samples; Zhen Chen and Yibing Xu performed the sample preparation and GC-MS analysis experiments; Zhen Chen analyzed the data; Zhen Chen and Hongbing Liu wrote the paper; all authors contributed in the review of the manuscript.

Conflicts of Interest

The authors declare no conflict of interest.

Abbreviations

The following abbreviations are used in this manuscript:
TCMtraditional Chinese medicine
CVHcardiovascular health
FAfatty acid
FAMEfatty acid methyl ester
SFAsaturated fatty acid
UFAunsaturated fatty acid
MUFAmonounsaturated fatty acid
PUFApolyunsaturated fatty acid
UIunsaturation index
AIatherogenic index
TIthrombogenic index
PCAprincipal component analysis
OPLS-DAorthogonal projection to latent structures discriminant analysis
VIPvariable importance in the projection
QCquality control

References

  1. Kris-Etherton, P.M.; Hecker, K.D.; Binkoski, A.E. Polyunsaturated fatty acids and cardiovascular health. Nutr. Rev. 2004, 62, 414–426. [Google Scholar] [CrossRef] [PubMed]
  2. Blair, H.A.; Dhillon, S. Omega-3 carboxylic acids (epanova®): A review of its use in patients with severe hypertriglyceridemia. Am. J. Cardiovasc. Drugs 2014, 14, 393–400. [Google Scholar] [CrossRef] [PubMed]
  3. Bradberry, J.C.; Hilleman, D.E. Overview of omega-3 Fatty Acid therapies. P. T. 2013, 38, 681–691. [Google Scholar] [PubMed]
  4. Jeon, Y.-J.; Samarakoon, K.W.; Elvitigala, D.A.S. Marine-Derived Pharmaceuticals and Future Prospects. In Hb25_Springer Handbook of Marine Biotechnology; Springer: Berlin, Germany; Heidelberg, Germany, 2015. [Google Scholar]
  5. De Caterina, R. n-3 fatty acids in cardiovascular disease. N. Engl. J. Med. 2011, 364, 2439–2450. [Google Scholar] [CrossRef] [PubMed]
  6. Ma, A.; Chen, Z.; Wang, T.; Song, N.; Yan, Q.; Fang, Y.; Guan, H.; Liu, H. Isolation of the molecular species of monogalactosyldiacylglycerols from brown edible seaweed Sargassum horneri and their inhibitory effects on triglyceride accumulation in 3T3-L1 adipocytes. J. Agric. Food Chem. 2014, 62, 11157–11162. [Google Scholar] [CrossRef] [PubMed]
  7. Bocanegra, A.; Bastida, S.; Benedí, J.; Ródenas, S.; Sánchez-Muniz, F.J. Characteristics and nutritional and cardiovascular-health properties of seaweeds. J. Med. Food 2009, 12, 236–258. [Google Scholar] [CrossRef] [PubMed]
  8. Chen, Z.; Liu, H. Research progress in chemical components and biological activity of Sargassum. Chin. J. Mar. Drugs 2012, 31, 41–51. [Google Scholar]
  9. World Health Organization. Population nutrient intake goals for preventing diet-related chronic diseases. Recommendations for preventing dental diseases. In Diet, Nutrition and the Prevention of Chronic Diseases; Report of a Joint WHO/FAO Expert Consulta; World Health Organization: Geneva, Switzerland, 2003. [Google Scholar]
  10. Department of Health. Nutritional Aspects of Cardiovascular Disease; Report on Health and Social Subjects No.46; Her Majesty’s Stationery Office (HMSO): London, UK, 1994. [Google Scholar]
  11. Ulbricht, T.L.V.; Southgate, D.A.T. Coronary heart disease: Seven dietary factors. Lancet 1991, 338, 985–992. [Google Scholar] [CrossRef]
  12. Sanina, N.M.; Goncharova, S.N.; Kostetsky, E.Y. Seasonal changes of fatty acid composition and thermotropic behavior of polar lipids from marine macrophytes. Phytochemistry 2008, 69, 1517–1527. [Google Scholar] [CrossRef] [PubMed]
  13. Nomura, M.; Kamogawa, H.; Susanto, E.; Kawagoe, C.; Yasui, H.; Saga, N.; Hosokawa, M.; Miyashita, K. Seasonal variations of total lipids, fatty acid composition, and fucoxanthin contents of Sargassum horneri (Turner) and Cystoseirahakodatensis (Yendo) from the northern seashore of Japan. J. Appl. Phycol. 2013, 25, 1159–1169. [Google Scholar] [CrossRef]
  14. Terasaki, M.; Hirose, A.; Narayan, B.; Baba, Y.; Kawagoe, C.; Yasui, H.; Saga, N.; Hosokawa, M.; Miyashita, K. Evaluation of recoverable functional lipid components of several brown seaweeds (phaeophyta) from Japan with special reference to fucoxanthin and fucosterol contents. J. Phycol. 2009, 45, 974–980. [Google Scholar] [CrossRef]
  15. Murakami, K.; Yamaguchi, Y.; Noda, K.; Fujii, T.; Shinohara, N.; Ushirokawa, T.; Sugawa-Katayama, Y.; Katayama, M. Seasonal variation in the chemical composition of a marine brown alga, Sargassum horneri (Turner) C. Agardh. J. Food Compos. Anal. 2011, 24, 231–236. [Google Scholar] [CrossRef]
  16. Dawczynski, C.; Schubert, R.; Jahreis, G. Amino acids, fatty acids, and dietary fibre in edible seaweed products. Food Chem. 2007, 103, 891–899. [Google Scholar] [CrossRef]
  17. Zheng, T.; Liu, C.C.; Yang, J.Y.; Liu, Q.G.; Li, J. Le Hijiki Seaweed (Hizikia fusiformis): Nutritional Value, Safety Concern and Arsenic Removal Method. Adv. Mater. Res. 2013, 634–638, 1247–1252. [Google Scholar] [CrossRef]
  18. Kumari, P.; Bijo, A.J.; Mantri, V.A.; Reddy, C.R.K.; Jha, B. Fatty acid profiling of tropical marine macroalgae: An analysis from chemotaxonomic and nutritional perspectives. Phytochemistry 2013, 86, 44–56. [Google Scholar] [CrossRef] [PubMed]
  19. Khotimchenko, S.V. Fatty acid composition of seven Sargassum species. Phytochemistry 1991, 30, 2639–2641. [Google Scholar] [CrossRef]
  20. Wu, X.; Lu, B.; Tseng, C.K. Comparative fatty acid composition of four Sargassum species (Fucales, Phaeophyta). Chin. J. Oceanol. Limnol. 1995, 13, 370–373. [Google Scholar]
  21. Sanina, N.M.; Goncharova, S.N.; Kostetsky, E.Y. Fatty acid composition of individual polar lipid classes from marine macrophytes. Phytochemistry 2004, 65, 721–730. [Google Scholar] [CrossRef] [PubMed]
  22. Airanthi, M.K.W.-A.; Sasaki, N.; Iwasaki, S.; Baba, N.; Abe, M.; Hosokawa, M.; Miyashita, K. Effect of brown seaweed lipids on fatty acid composition and lipid hydroperoxide levels of mouse liver. J. Agric. Food Chem. 2011, 59, 4156–4163. [Google Scholar] [CrossRef] [PubMed]
  23. Li, X.; Fan, X.; Han, L.; Lou, Q. Fatty acids of some algae from the Bohai Sea. Phytochemistry 2002, 59, 157–161. [Google Scholar] [CrossRef]
  24. Narayan, B.; Miyashita, K.; Hosakawa, M. Comparative evaluation of fatty acid composition of different Sargassum (Fucales, Phaeophyta) species harvested from temperate and tropical waters. J. Aquat. Food Prod. Technol. 2004, 13, 53–70. [Google Scholar] [CrossRef]
  25. Gerasimenko, N.I.; Martyyas, E.A.; Logvinov, S.V.; Busarova, N.G. Biological activity of lipids and photosynthetic pigments of Sargassum pallidum C. Agardh. Appl. Biochem. Microbiol. 2013, 50, 73–81. [Google Scholar] [CrossRef]
  26. Zhukova, N.V.; Svetashev, V.I. A high level of dihomogammalinolenic acid in brown alga Sargassum pallidum (Turn.). Phytochemistry 1999, 50, 1209–1211. [Google Scholar] [CrossRef]
  27. Wang, J.; Hu, Y.; Sun, L. Analysis of fatty acids in haihaozi (Sargassum pallidum). Chin. J. Mar. Drugs 2001, 40–41. [Google Scholar]
  28. Sánchez-Machado, D.I.; López-Cervantes, J.; López-Hernández, J.; Paseiro-Losada, P. Fatty acids, total lipid, protein and ash contents of processed edible seaweeds. Food Chem. 2004, 85, 439–444. [Google Scholar] [CrossRef]
  29. Dai, Z.Y.; Hong, Y.P.; Zhang, Y.P.; Zhang, H. Evaluation on nutritional components of Sargassum fusiforme. J. Fish. China 2002, 26, 382–384. [Google Scholar]
  30. Xia, J.F.; Wang, C.S.; Qian, G.Y. Comparative analysis of fatty acids between Sargassum fusiforme and Laminaria japonica. Food Res. Dev. 2009, 12, 5–8. [Google Scholar]
  31. Lin, J.; Lin, T.; Lin, L.P.; Chen, W.F.; He, Q. Nutrition and feed safety of seaweed from Fujian coastal waters. Fujian J. Agric. Sci. 2011, 26, 997–1002. [Google Scholar]
  32. Tsai, C.J.; Sun Pan, B. Identification of sulfoglycolipid bioactivities and characteristic fatty acids of marine macroalgae. J. Agric. Food Chem. 2012, 60, 8404–8410. [Google Scholar] [CrossRef] [PubMed]
  33. Jeromson, S.; Gallagher, I.; Galloway, S.; Hamilton, D. Omega-3 fatty acids and skeletal muscle health. Mar. Drugs 2015, 13, 6977–7004. [Google Scholar] [CrossRef] [PubMed]
  34. Alles, M.S.; Eussen, S.R.B.M.; van der Beek, E.M. Nutritional challenges and opportunities during the weaning period and in young childhood. Ann. Nutr. Metab. 2014, 64, 284–293. [Google Scholar] [CrossRef] [PubMed]
  35. Lee, D.K.; Yoon, M.H.; Kang, Y.P.; Yu, J.; Park, J.H.; Lee, J.; Kwon, S.W. Comparison of primary and secondary metabolites for suitability to discriminate the origins of Schisandra chinensis by GC/MS and LC/MS. Food Chem. 2013, 141, 3931–3937. [Google Scholar] [CrossRef] [PubMed]
  36. Theodoridis, G.; Gika, H.G.; Wilson, I.D. LC-MS-based methodology for global metabolite profiling in metabonomics/metabolomics. TrAC Trends Anal. Chem. 2008, 27, 251–260. [Google Scholar] [CrossRef]
  37. Bligh, E.G.; Dyer, W.J. A rapid method of total lipid extraction and purification. Can. J. Biochem. Physiol. 1959, 37, 911–917. [Google Scholar] [CrossRef] [PubMed]
  38. Carreau, J.; Dubacq, J. Adaptation of a macro-scale method to the micro-scale for fatty acid methyl transesterification of biological lipid extracts. J. Chromatogr. A 1978, 151, 384–390. [Google Scholar] [CrossRef]
  39. Sangster, T.; Major, H.; Plumb, R.; Wilson, A.J.; Wilson, I.D. A pragmatic and readily implemented quality control strategy for HPLC-MS and GC-MS-based metabonomic analysis. Analyst 2006, 131, 1075–1078. [Google Scholar] [CrossRef] [PubMed]
  40. Gaude, E.; Chignola, F.; Spiliotopoulos, D.; Mari, S.; Spitaleri, A.; Ghitti, M. Muma: Metabolomics Univariate and Multivariate Analysis. R Package Version 1.4, 2012. Available online: https://CRAN.R-project.org/package=muma (accessed on 26 March 2016).
Figure 1. Total lipid contents of four Sargassum algae. The data are presented as means ± SD. Different letters (a,b) indicate significant differences by the Tukey post hoc test (p < 0.01).
Marinedrugs 14 00068 g001
Figure 2. The total ion chromatograms of the standard FAMEs mixture and Sargassum algal sample. (A) Standard FAMEs mixture; (B) Sample of S. fusiforme 1.
Marinedrugs 14 00068 g002
Figure 3. Bi-plot of Sargassum samples obtained by the PCA of FA variables.
Marinedrugs 14 00068 g003
Figure 4. OPLS-DA of the two official species HAI ZAO (S. fusiforme and S. pallidum). (A) Score scatter plot; (B) S-plot; (C) Potential key FA contents.
Marinedrugs 14 00068 g004
Figure 5. OPLS-DA of the two folk medicine species HAI QIAN (S. horneri and S. thunbergii). (A) Score scatter plot; (B) S-plot; (C) Potential key FA contents.
Marinedrugs 14 00068 g005
Table 1. Fatty acid profiles (given in % of total FAME) and nutritional indices related to CVH in different Sargassum species (expressed as means ± SD).
Fatty Acid (%)S. fusiformeS. pallidumS. horneriS. thunbergii
C14:05.33 ± 1.22 b6.70 ± 1.73 a5.90 ± 0.55 a,b5.23 ± 0.53 a,b
C15:00.51 ± 0.14 a,b0.58 ± 0.11 a0.42 ± 0.11 b0.41 ± 0.08 b
C16:031.44 ± 5.07 c48.66 ± 3.69 a35.02 ± 1.17 b38.86 ± 1.99 b
C17:00.28 ± 0.10 a0.25 ± 0.05 b0.20 ± 0.05 b0.16 ± 0.07 b
C18:01.95 ± 0.68 b2.79 ± 0.69 a1.65 ± 0.32 b2.02 ± 0.33 b
C20:00.86 ± 0.17 a0.80 ± 0.10 b0.71 ± 0.08 b0.68 ± 0.18 b
C22:01.15 ± 0.30 a1.07 ± 0.21 b0.64 ± 0.07 c0.84 ± 0.05 b,c
C24:00.18 ± 0.09 b0.28 ± 0.05 a0.17 ± 0.05 b,c0.11 ± 0.01 c
∑SFA41.70 ± 6.88 c61.12 ± 4.80 a44.71 ± 1.41 b,c48.30 ± 1.83 b
C16:1 n-74.34 ± 0.98 c5.19 ± 0.70 b7.15 ± 0.88 a6.41 ± 0.37 a
C18:1 n-918.91 ± 1.49 a19.57 ± 1.38 a16.71 ± 0.88 b19.36 ± 0.47 a
C20:1 n-94.57 ± 0.82 a,b1.19 ± 0.31 c5.06 ± 1.04 a4.21 ± 0.20 b
C22:1 n-94.39 ± 1.13 a1.15 ± 0.26 c1.35 ± 0.19 c2.92 ± 0.75 b
∑MUFA32.21 ± 1.91 a27.09 ± 1.18 c30.27 ± 1.44 b32.89 ± 1.07 a
C18:2 n-64.89 ± 0.63 b5.03 ± 1.66 b6.59 ± 0.99 a7.01 ± 0.97 a
C18:3 n-60.26 ± 0.08 b0.26 ± 0.14 b0.57 ± 0.31 a0.29 ± 0.09 b
C18:4 n-33.33 ± 2.11 a0.52 ± 0.33 b1.52 ± 0.64 b1.50 ± 0.53 b
C20:2 n-62.19 ± 0.49 b0.91 ± 0.23 c1.07 ± 0.30 c2.75 ± 0.20 a
C20:3 n-60.81 ± 0.31 a0.55 ± 0.31 b0.98 ± 0.21 a0.38 ± 0.15 b
C20:4 n-69.37 ± 3.38 a3.33 ± 1.53 b10.70 ± 1.19 a4.37 ± 0.77 b
C20:4 n-30.96 ± 0.28 a0.49 ± 0.22 b0.93 ± 0.07 a0.55 ± 0.24 b
C20:5 n-34.29 ± 2.10 a0.71 ± 0.43 c2.66 ± 0.53 b1.94 ± 0.46 b
∑PUFA26.09 ± 7.97 a11.79 ± 4.62 c25.03 ± 2.10 a18.81 ± 1.88 b
PUFA/SFA0.67 ± 0.31 a0.20 ± 0.09 c0.56 ± 0.06 a,b0.39 ± 0.05 b,c
n-6 FA17.51 ± 3.72 a,b10.07 ± 3.70 c19.91 ± 1.78 a14.81 ± 0.88 b
n-3 FA8.58 ± 4.37 a1.71 ± 0.95 c5.11 ± 0.99 b4.00 ± 1.20 b,c
n-6/n-32.43 ± 0.83 c7.17 ± 2.75 a4.03 ± 0.80 b3.98 ± 1.11 b,c
UI A125.65 ± 32.25 a62.27 ± 15.05 c116.16 ± 5.77 a89.87 ± 7.44 b
AI B0.94 ± 0.28 b1.99 ± 0.45 a1.06 ± 0.06 b1.16 ± 0.10 b
TI C0.46 ± 0.21 b1.60 ± 0.56 a0.65 ± 0.07 b0.76 ± 0.14 b
a–c Values in a row without a common superscript were significantly different at the 0.05 probability level; A UI (unsaturation index) was calculated by multiplying the percentage of each fatty acid by the number of double bonds, followed by summing up these contributions; B AI (atherogenic index): AI = [C12:0 + (4 × C14:0) + C16:0]/(∑MUFAs + n-3 PUFAs + n-6 PUFAs); C TI (thrombogenic index): TI = (C14:0 + C16:0 + C18:0)/[(0.5 ×∑MUFAs) + (0.5 × n-6 PUFAs) + (3 × n-3 PUFAs) + (n-3 PUFAs/n-6 PUFAs)].

