
Ciona intestinalis as a Marine Model System to Study Some Key Developmental Genes Targeted by the Diatom-Derived Aldehyde Decadienal


Abstract
:1. Introduction
2. Results

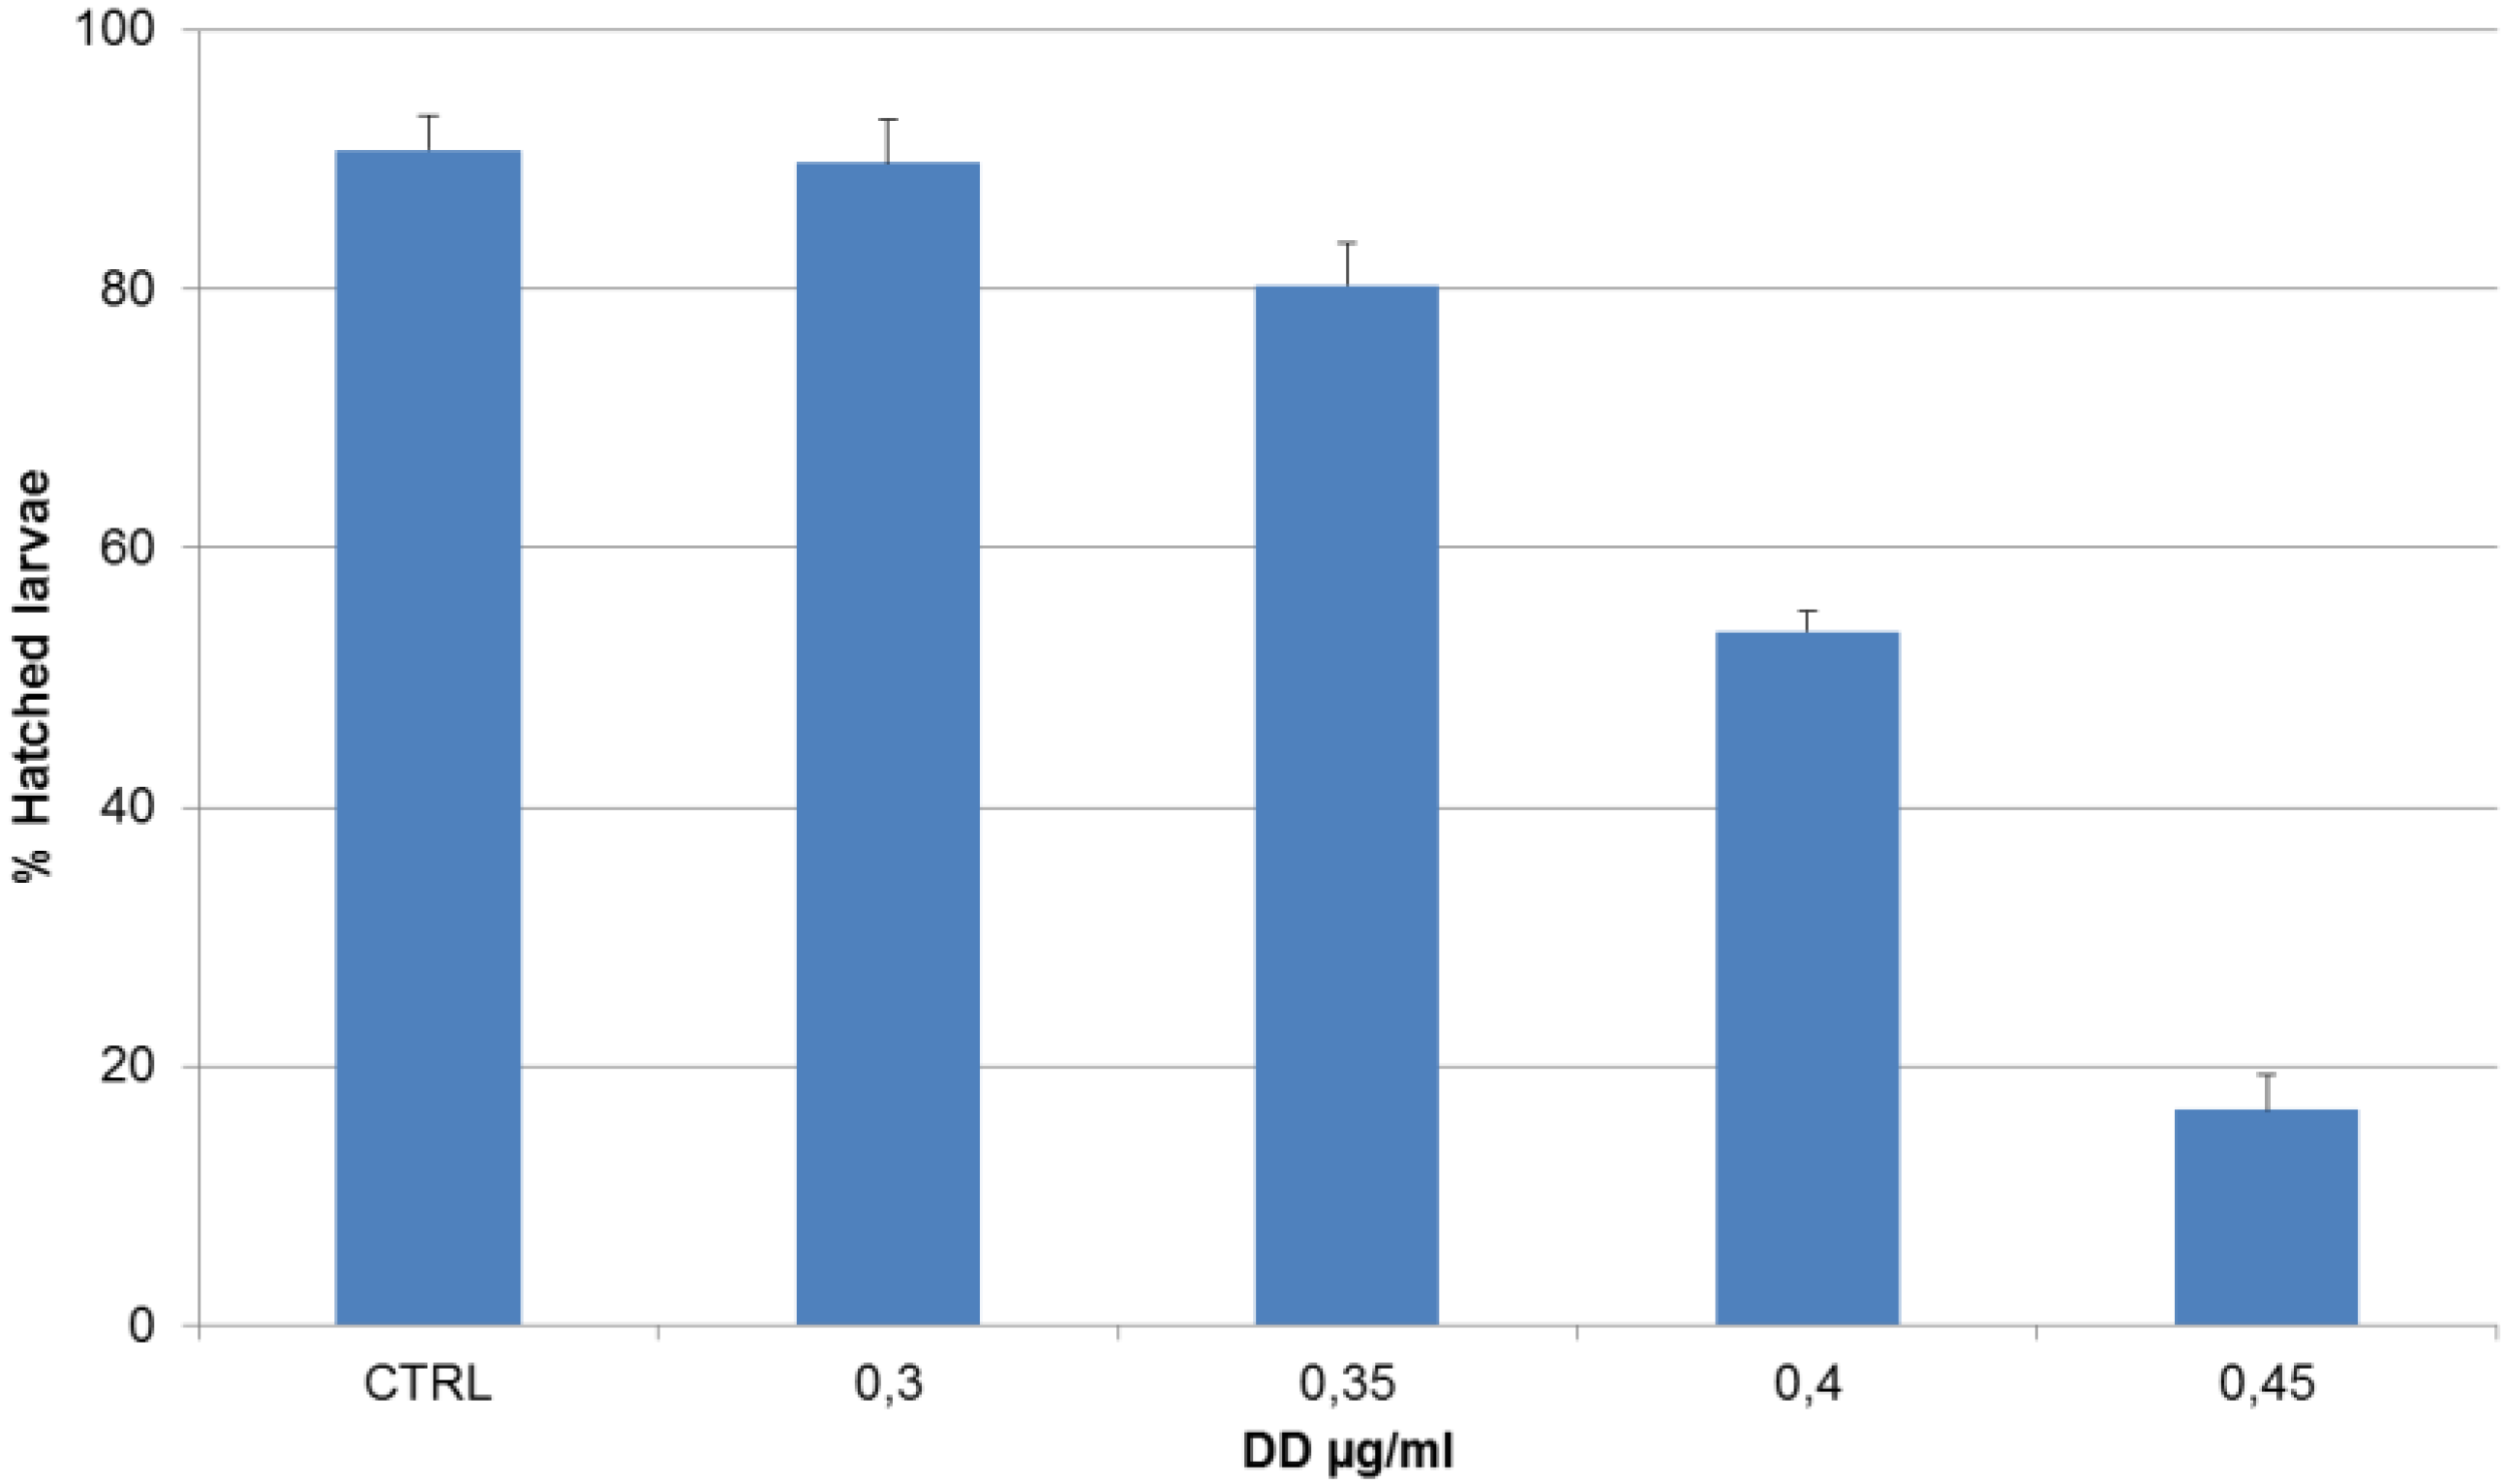
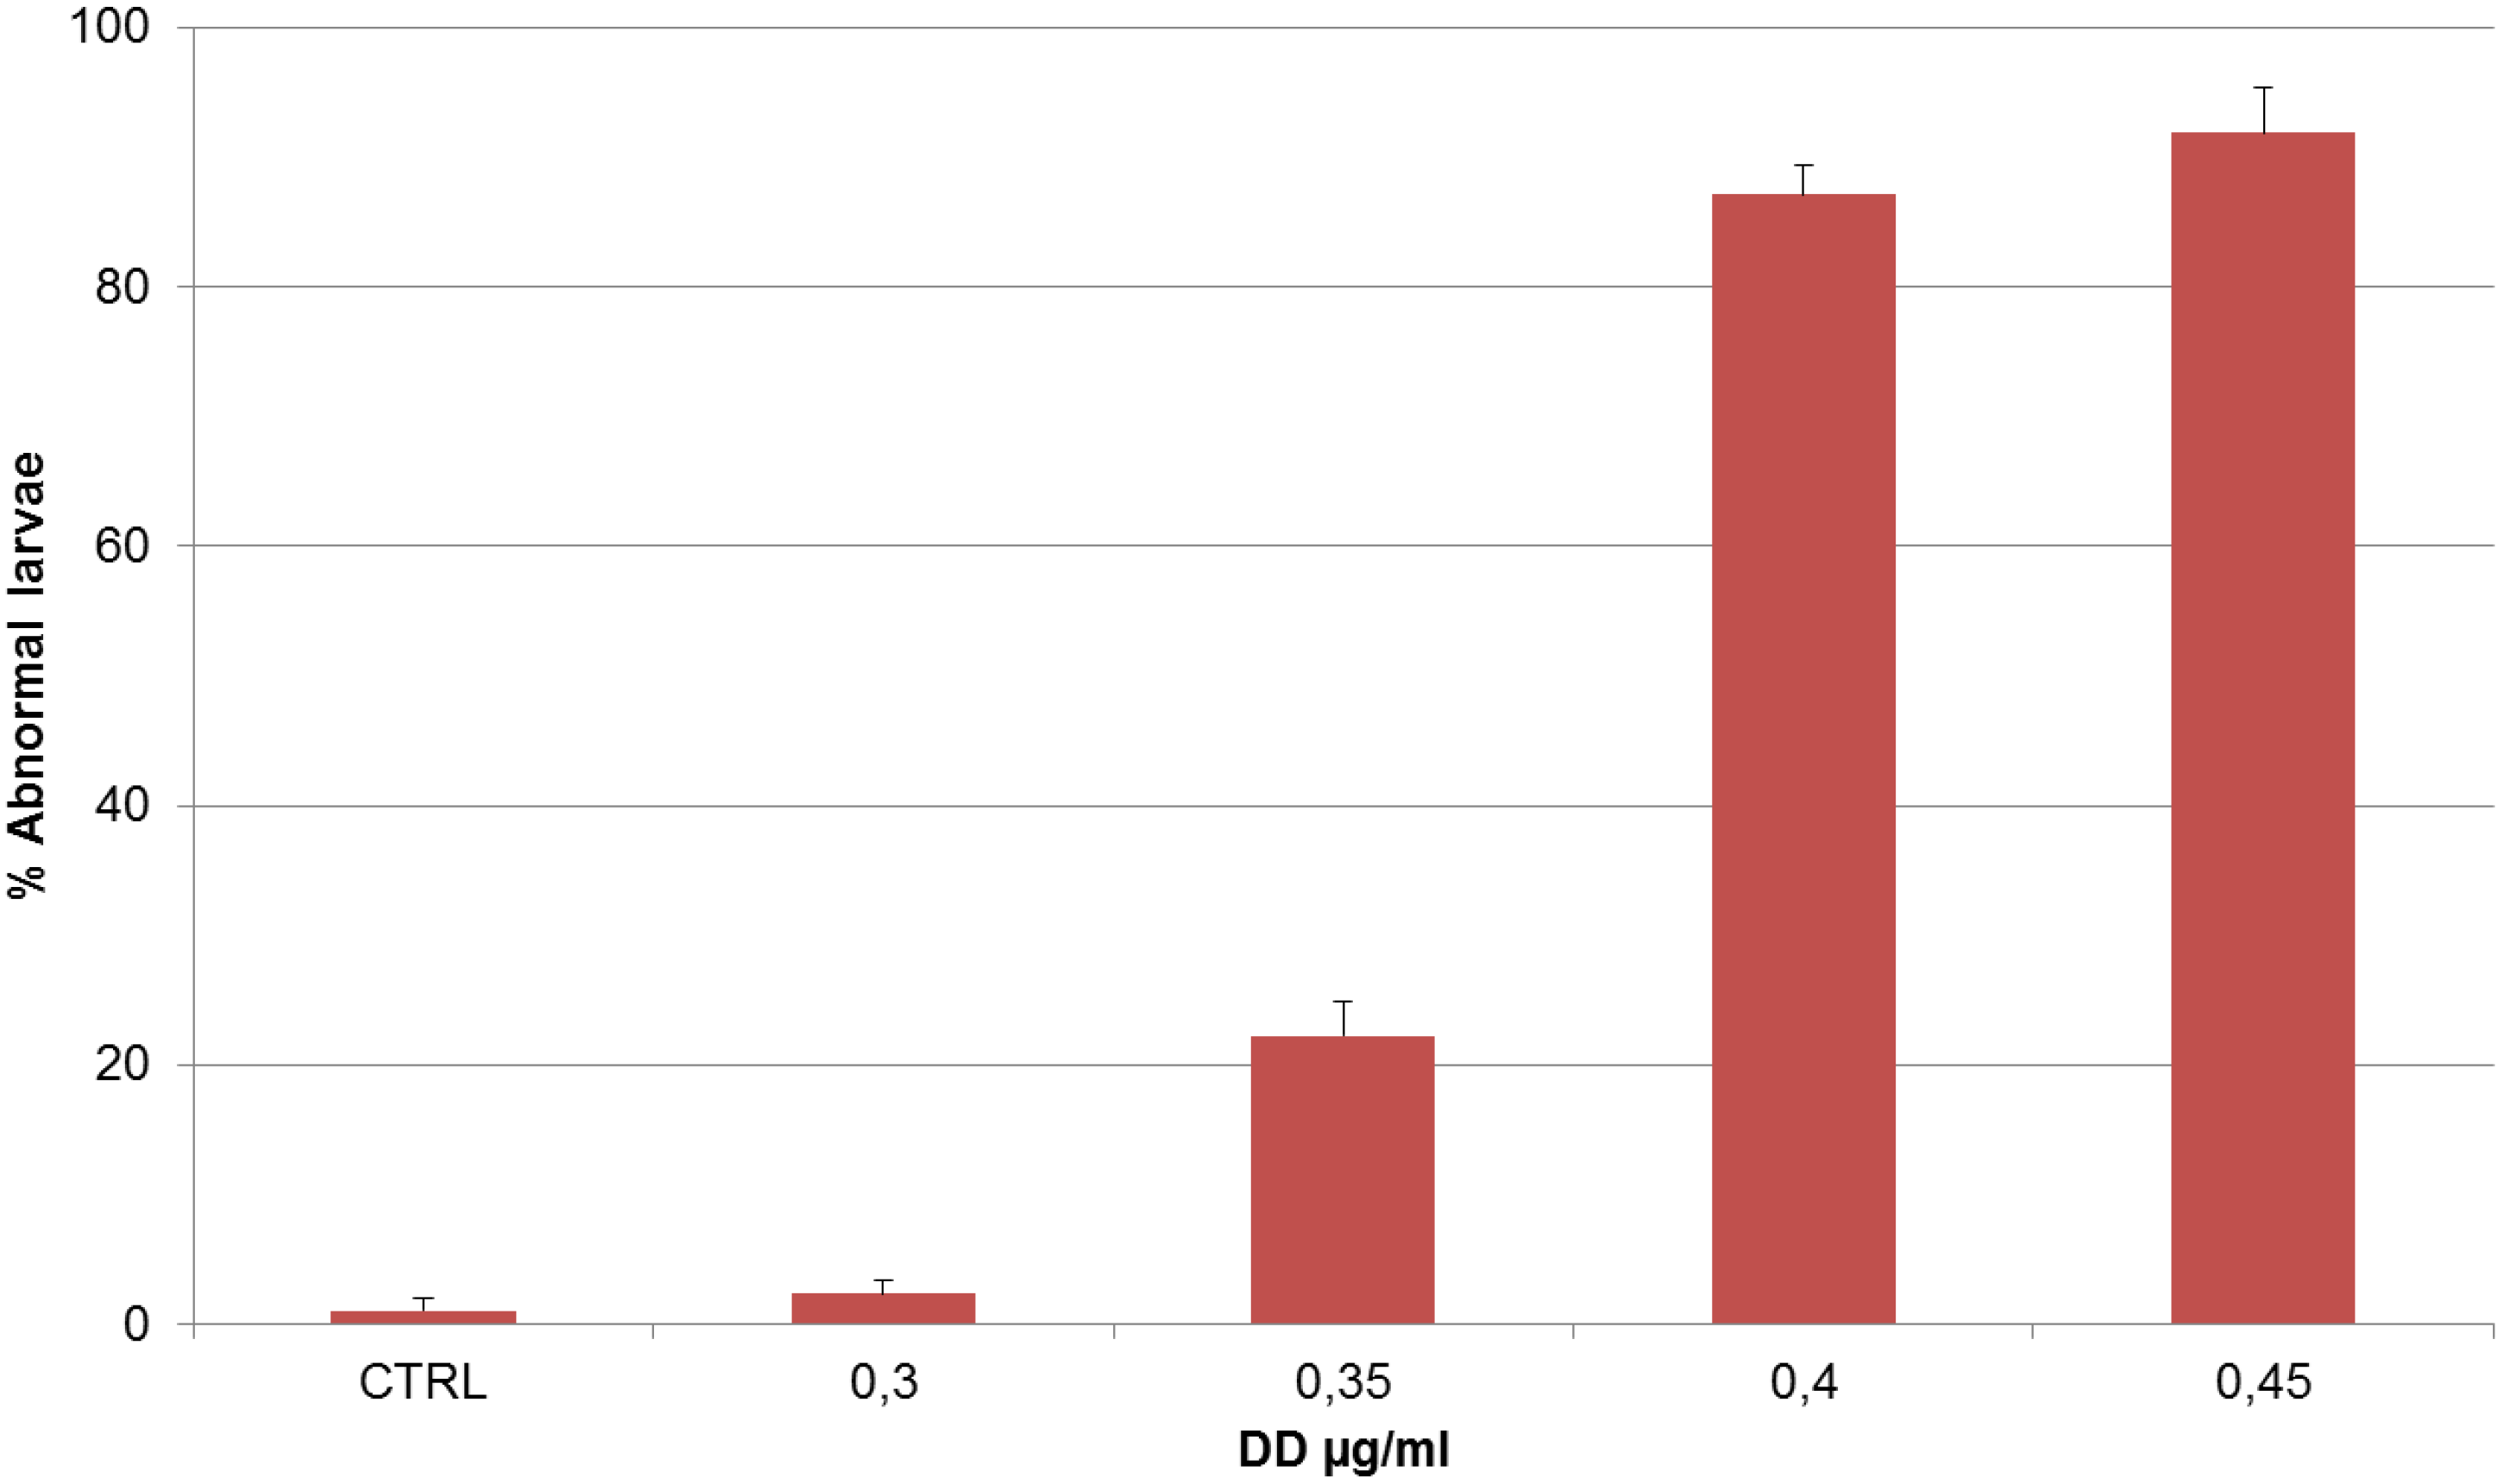
| DD (µg/mL) | Treatment on Fertilized Eggs |
|---|---|
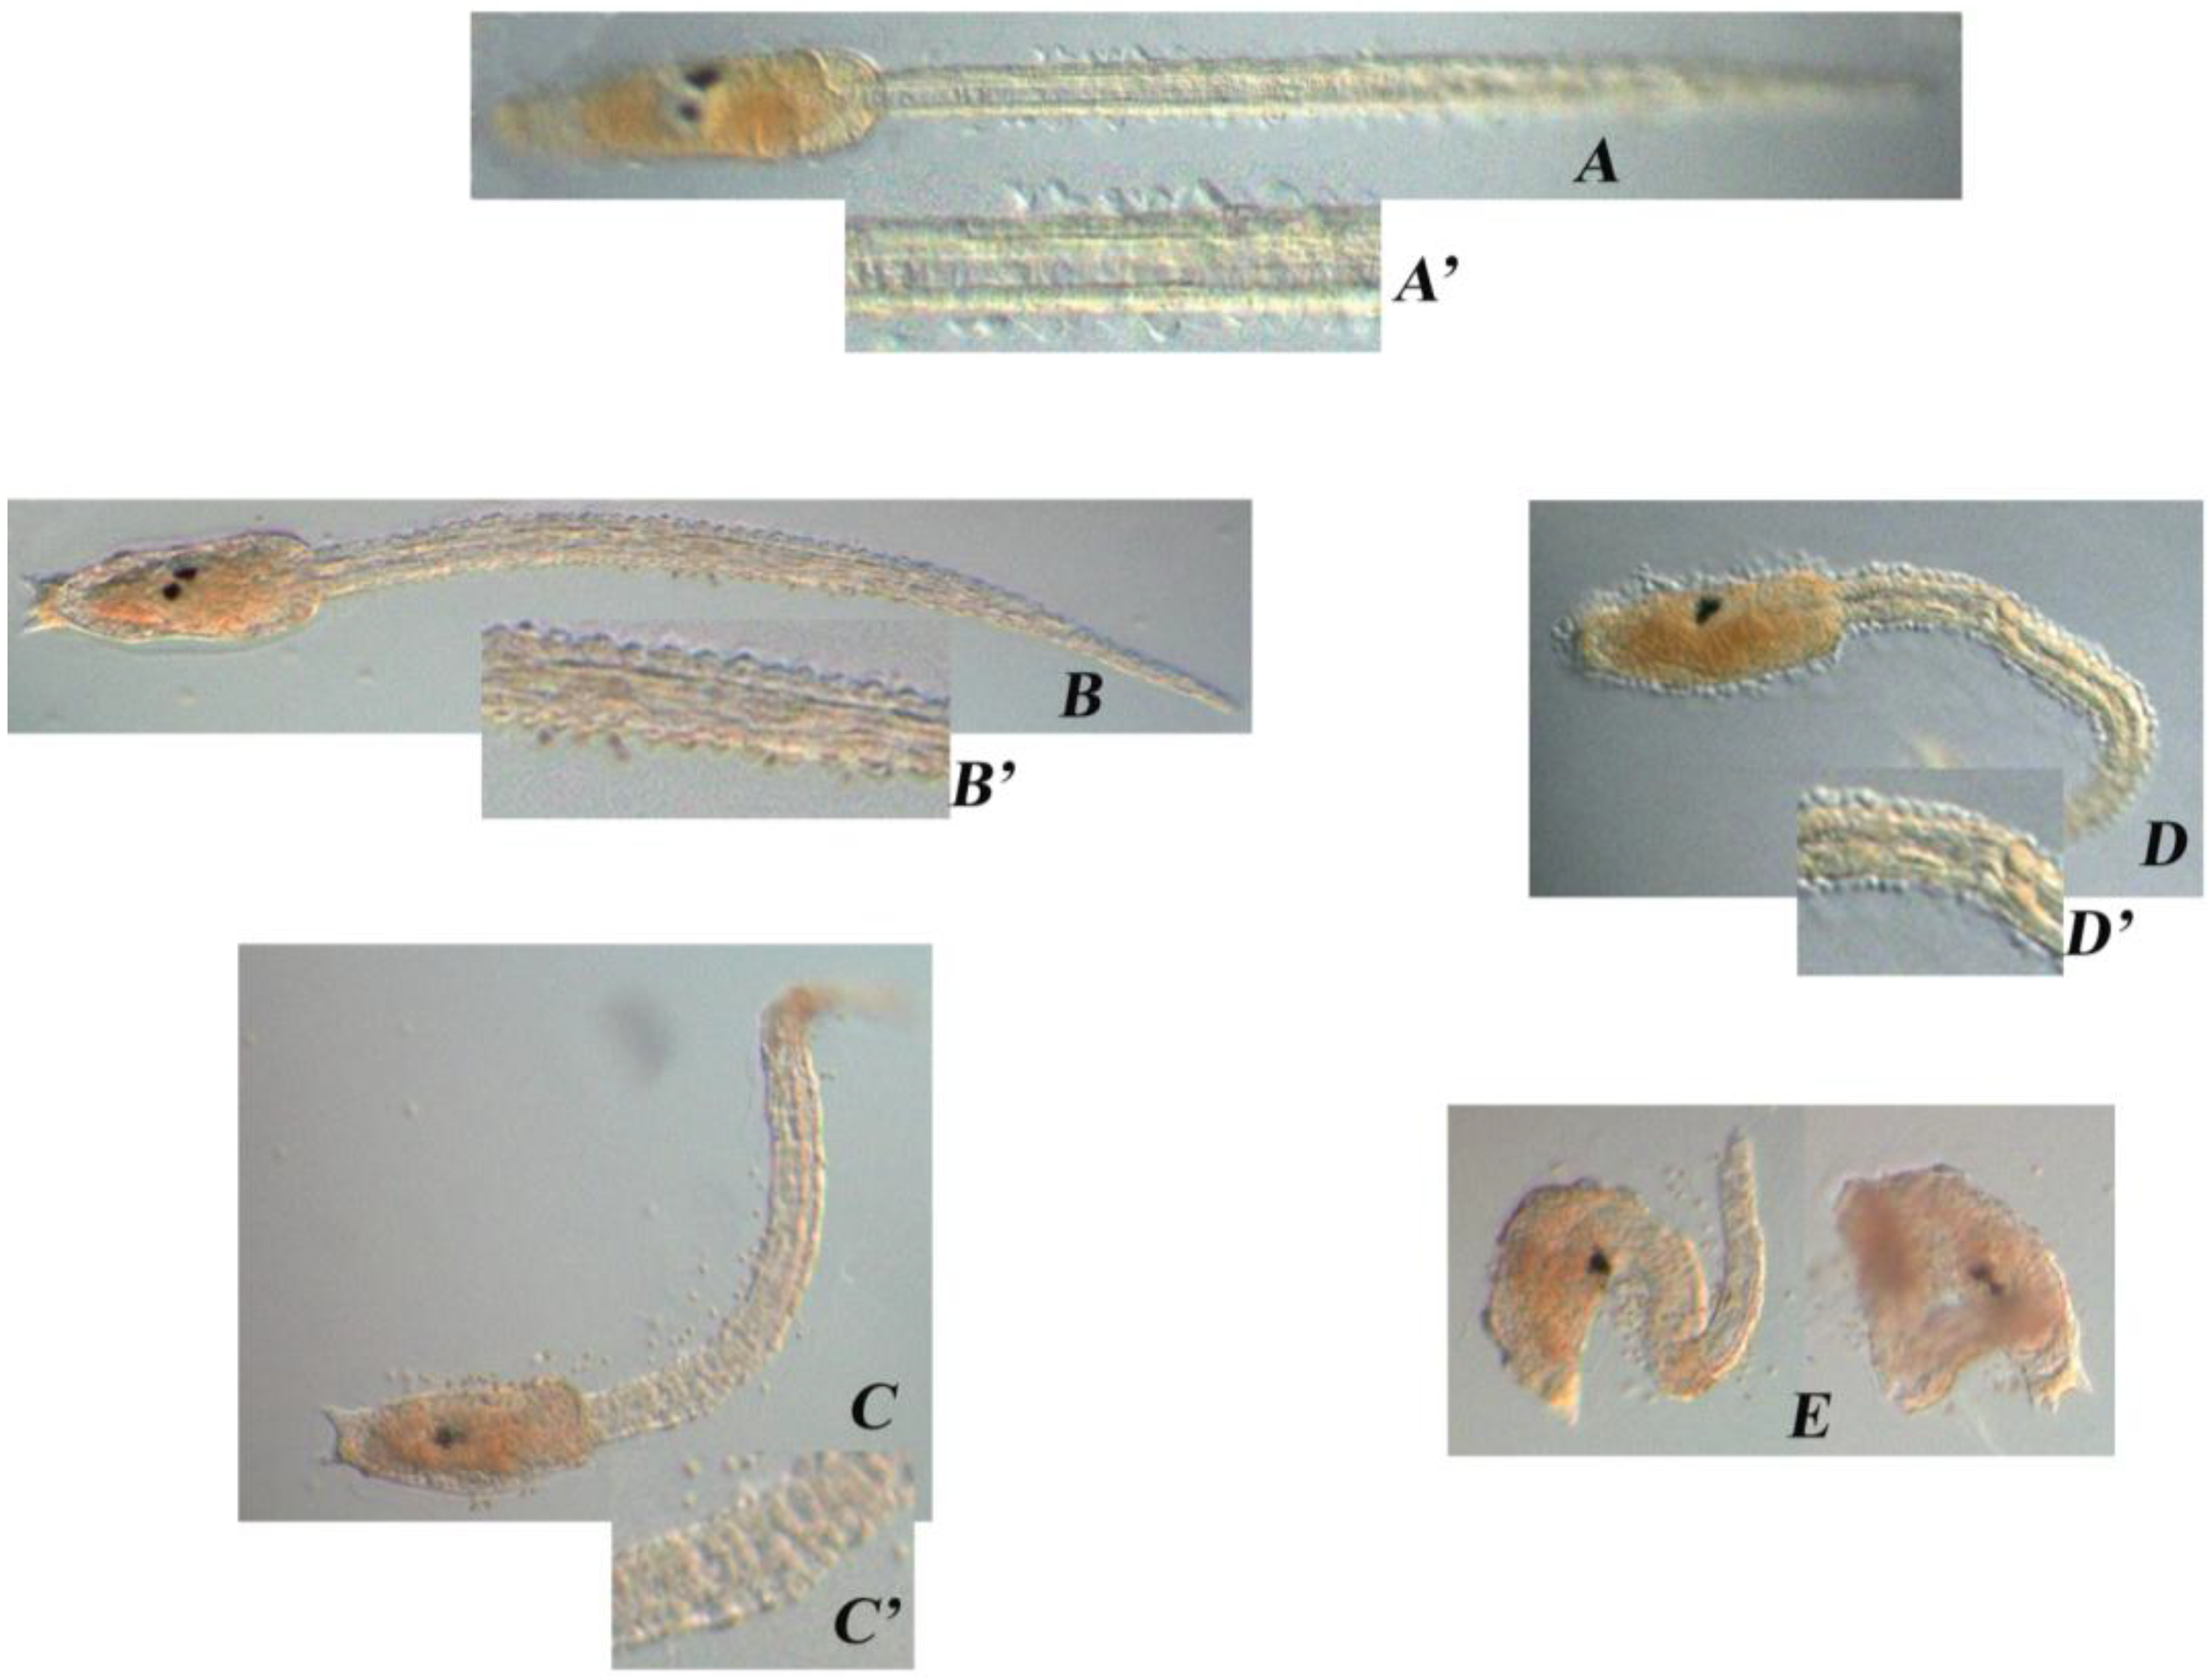
| – | Normal phenotype (A) |
| 0.30 | Normal phenotype (B) |
| 0.35 | Tail was shorter than the control, kinked and disorganized (C) |
| 0.40 | Tail was even shorter, kinked and disorganized; the trunk seemed quite normal (D) |
| 0.45 | Larvae were completely disorganized and failed to hatch (E) |
| 0.50 | No development |
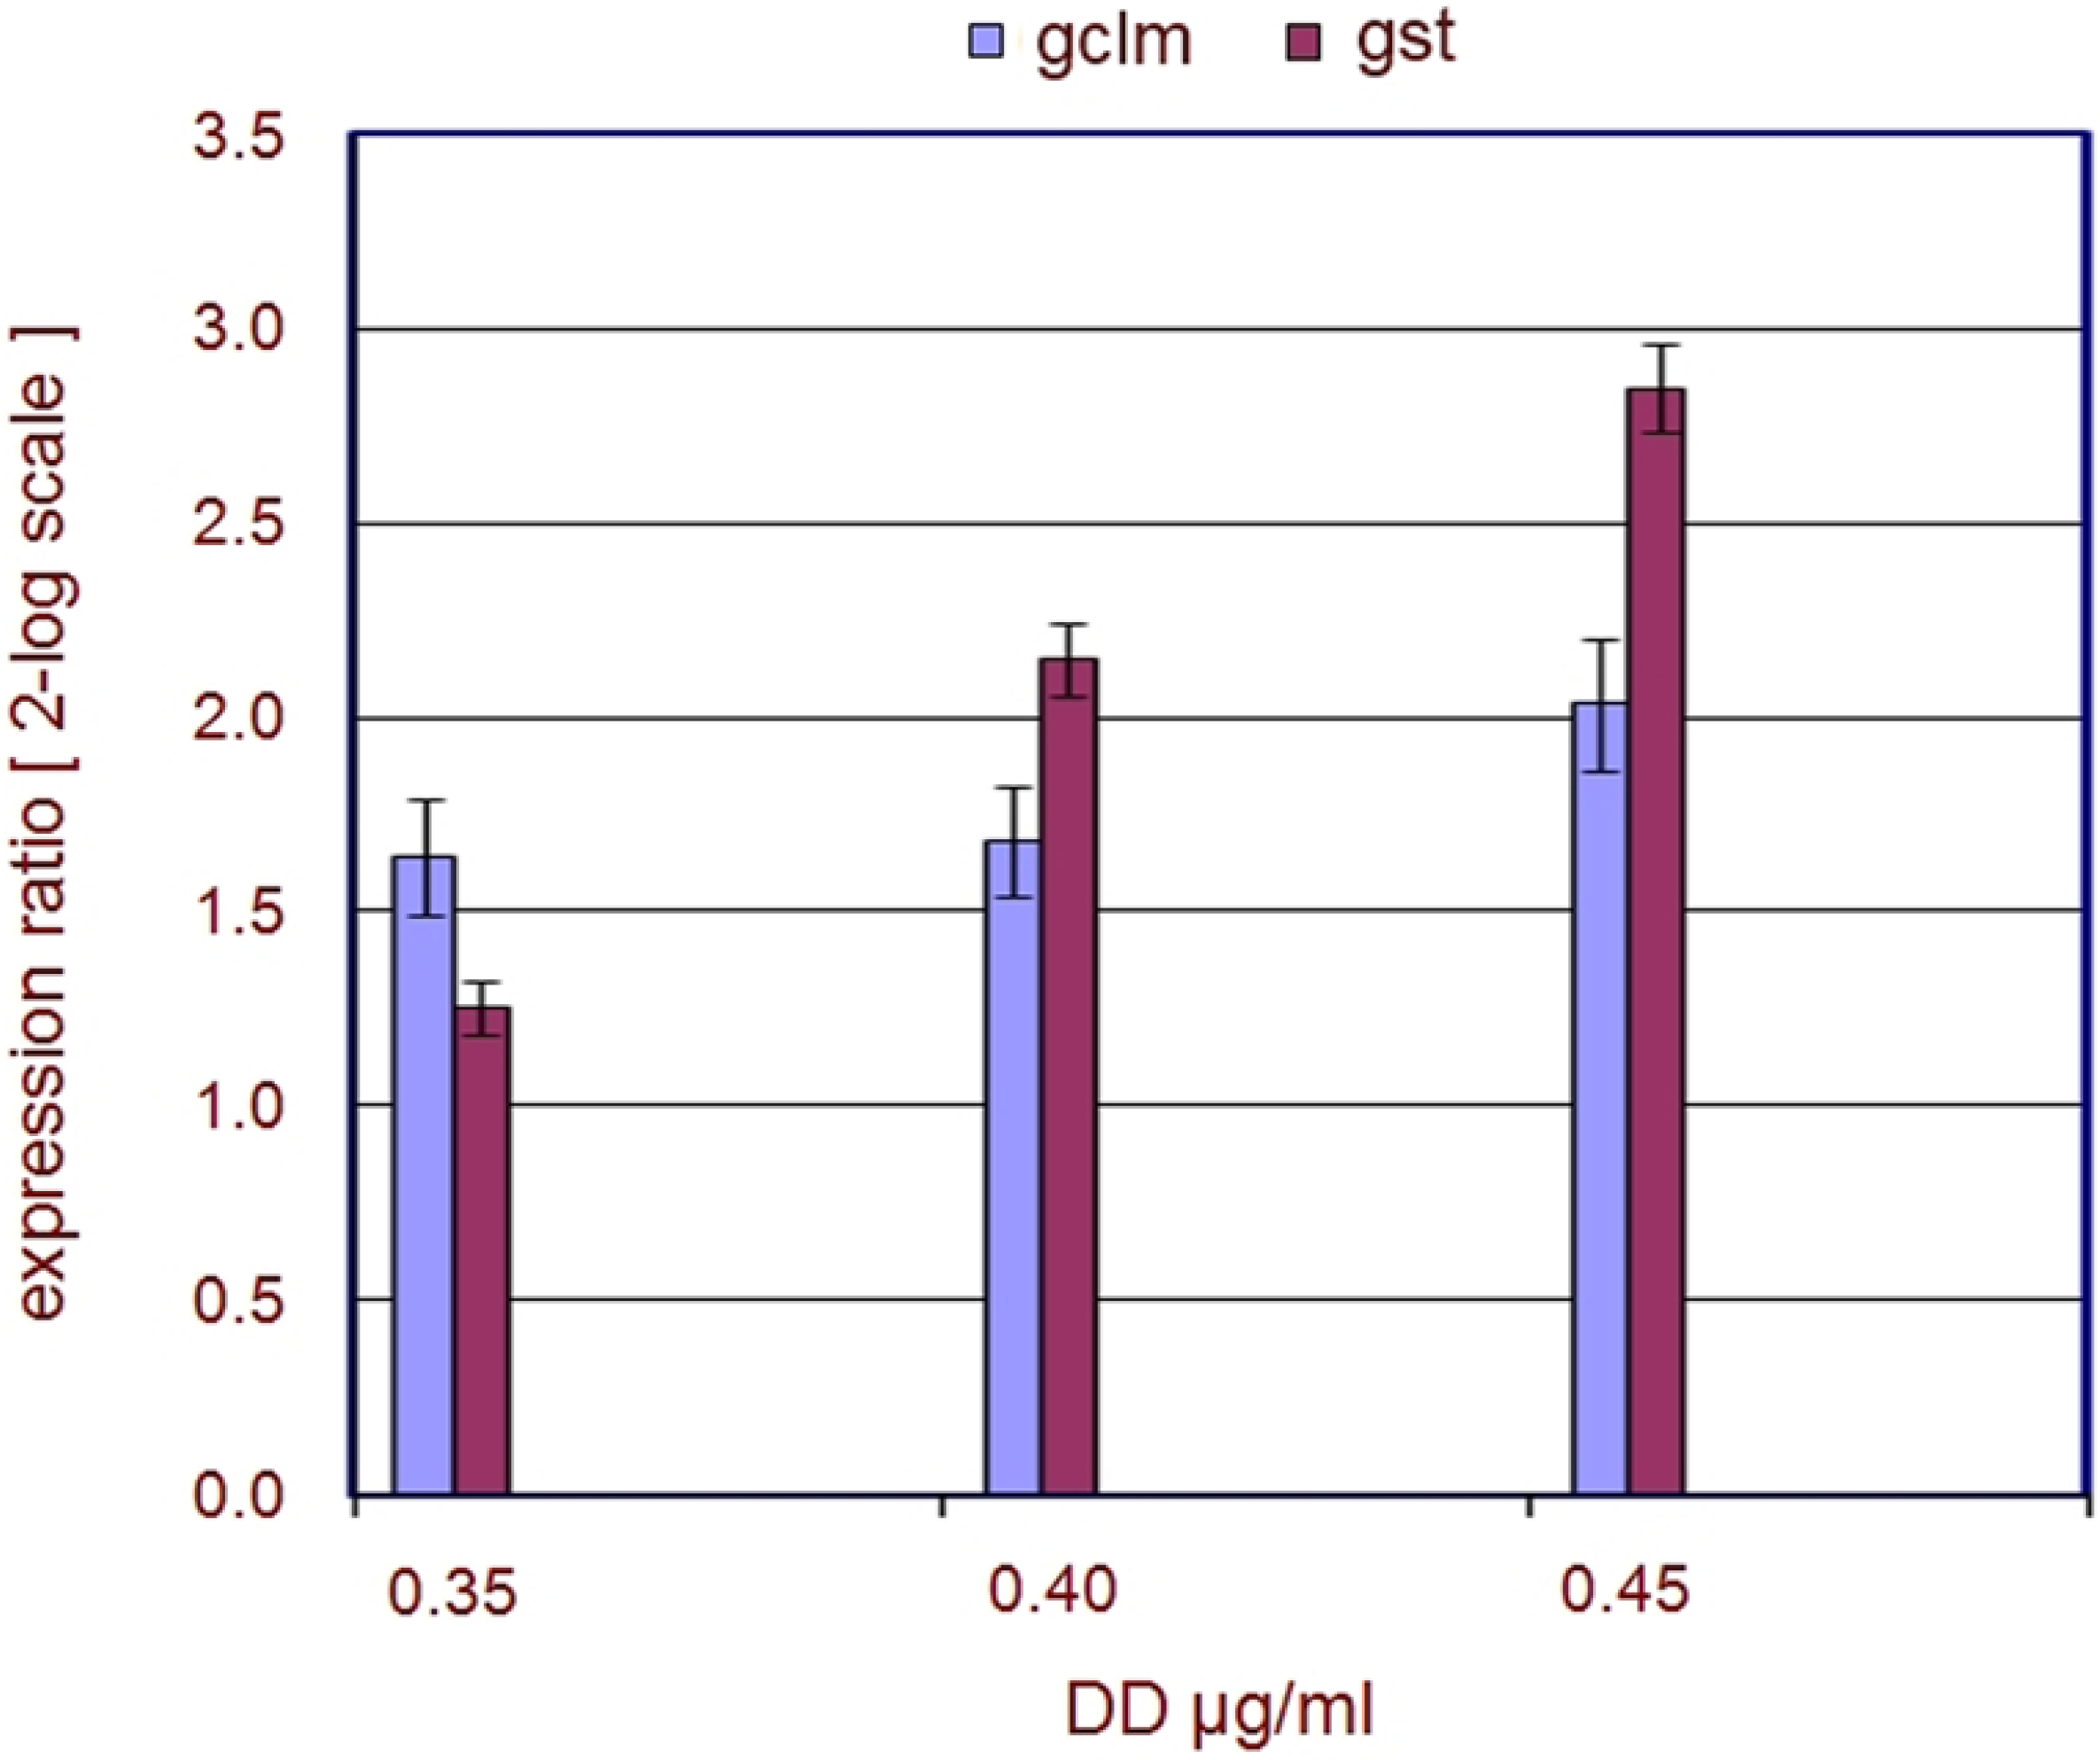
2.1. Stress Genes
| Genes | FC 0.40 | FC 0.45 | p 0.40 | p 0.45 |
|---|---|---|---|---|
| gclm | 4.6 | 5.1 | 0.003308 | 0.049152 |
| gst | 5.2 | 8.4 | 0.040746 | 0.038839 |
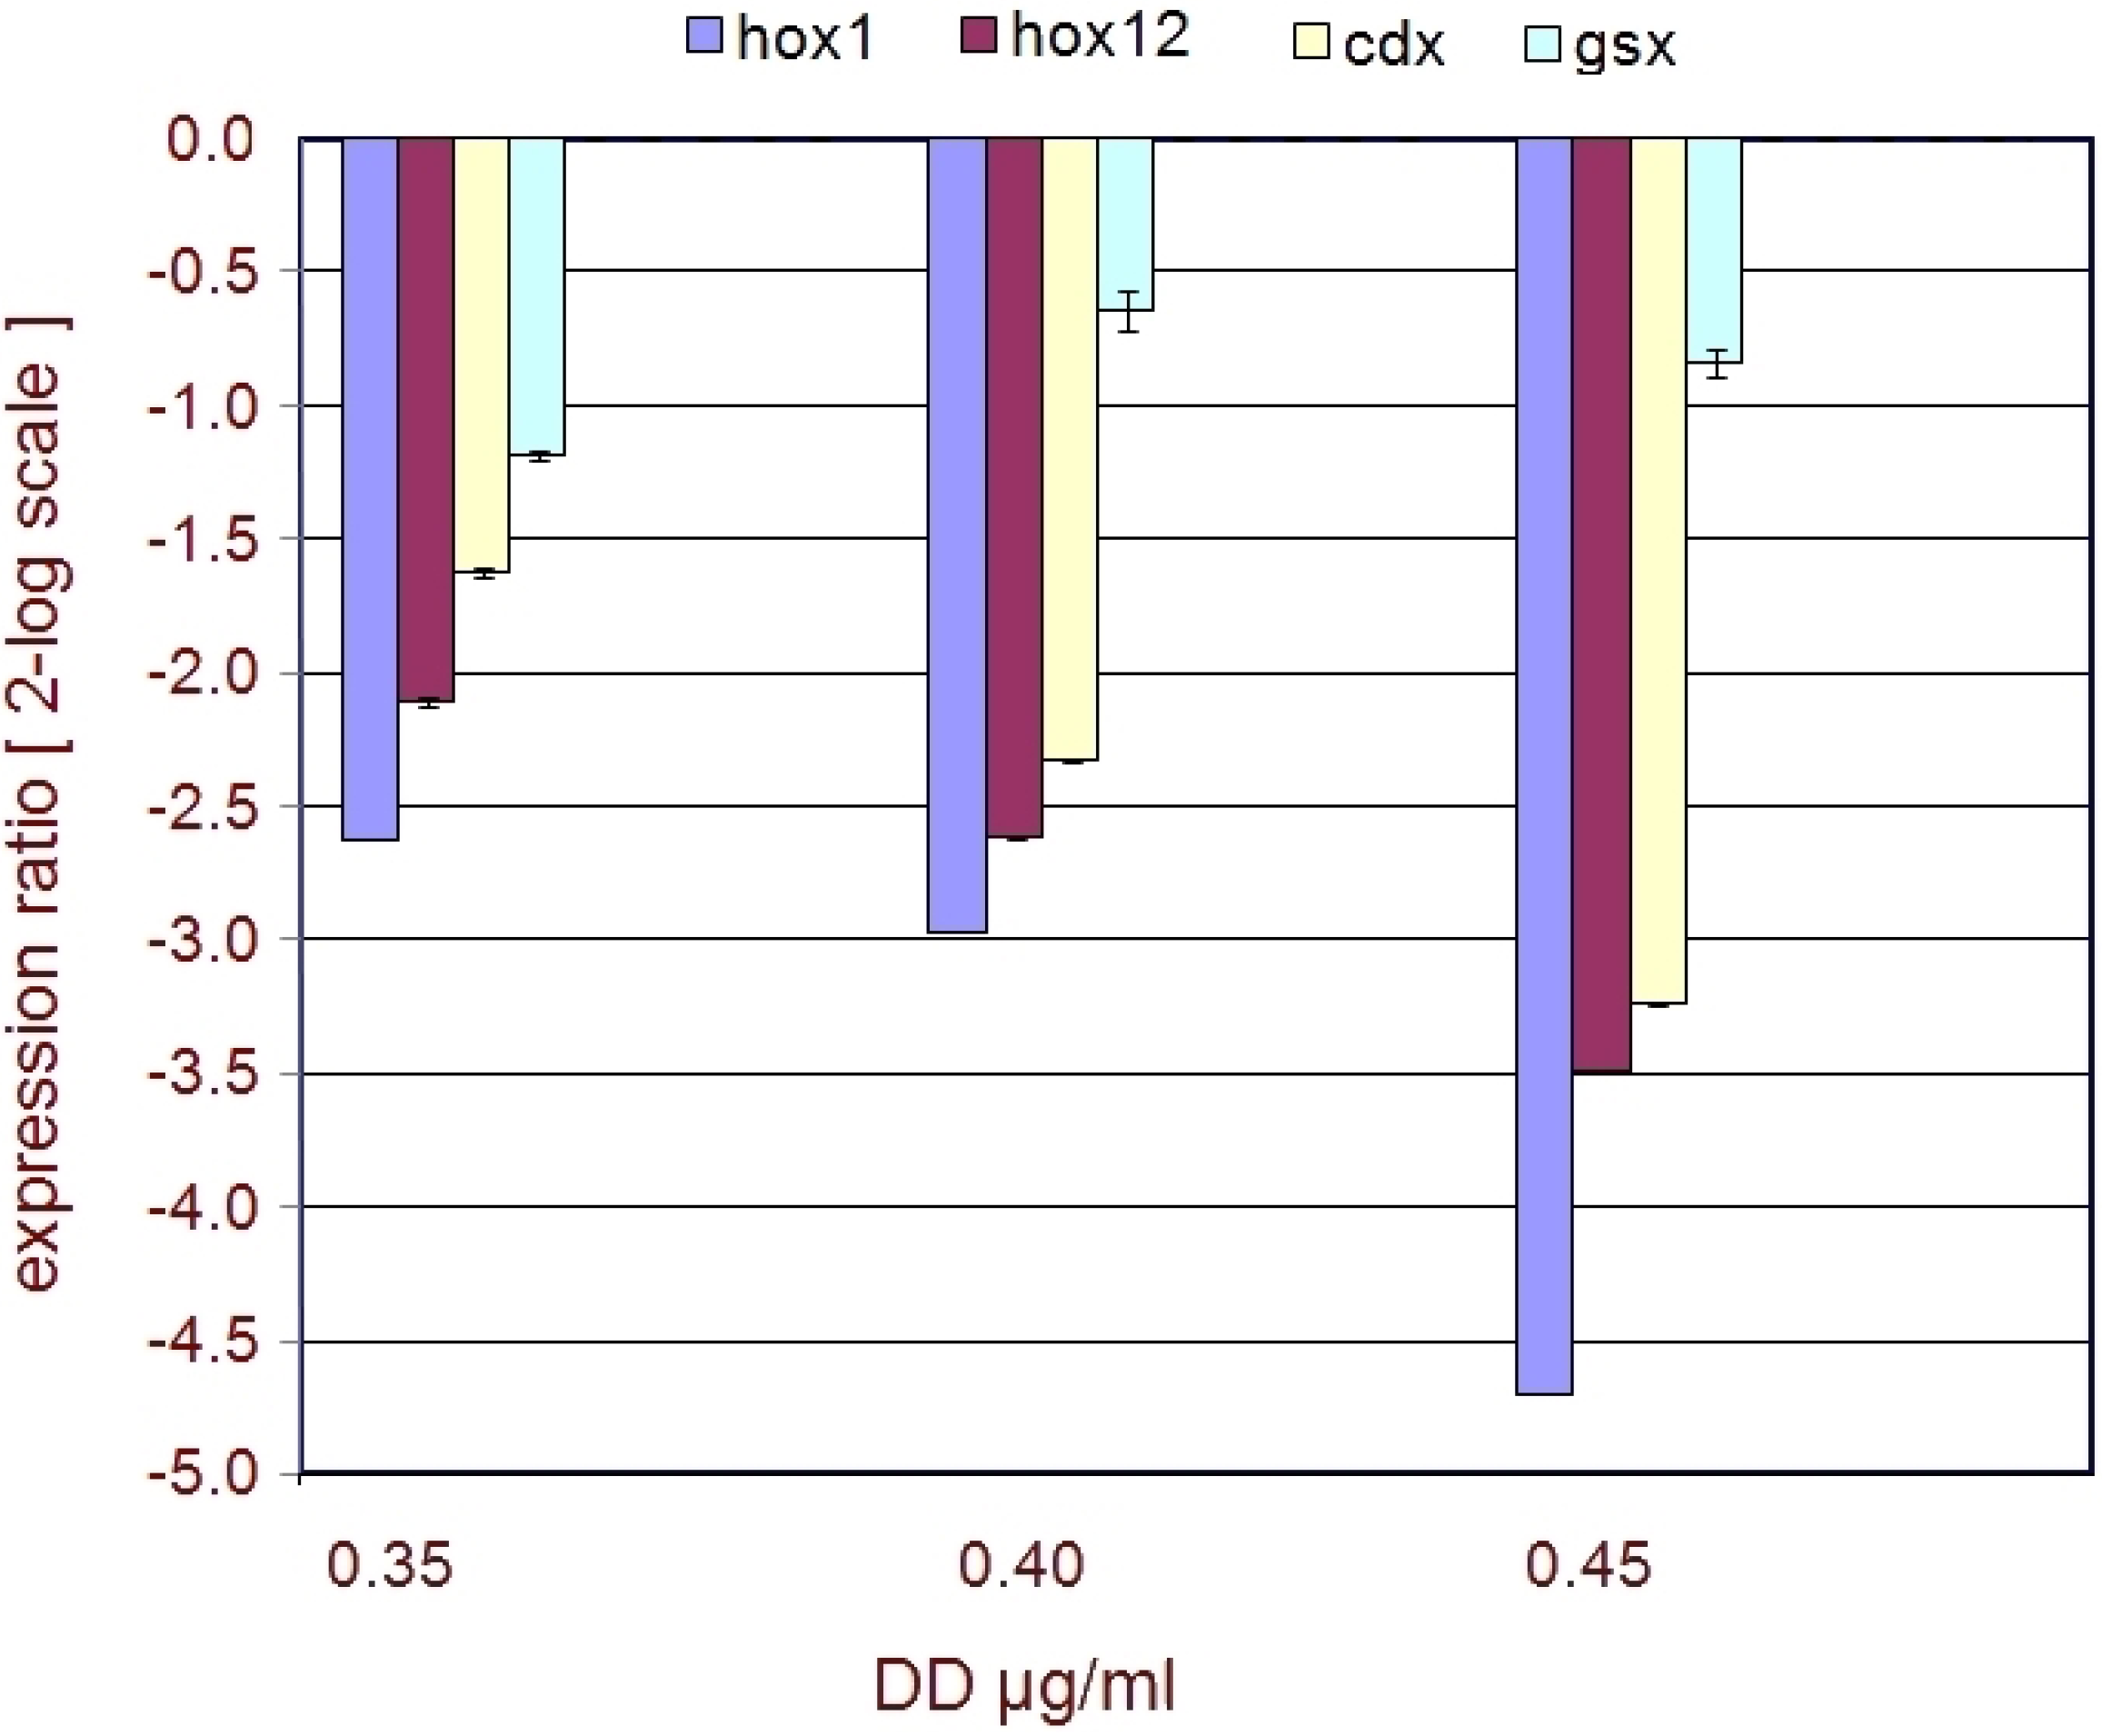
2.2. Developmental Genes
| Genes | FC 0.40 | FC 0.45 | p 0.40 | p 0.45 |
|---|---|---|---|---|
| hox1 | −2.7 | −5.3 | 0.025202 | 0.001851 |
| hox12 | −1.7 | −2.6 | 0.03697 | 0.007098 |
| cdx | −1.6 | −2.4 | 0.039887 | 0.00173 |
| gsx | - | −1.1 | - | 0.20408 |

3. Discussion
3.1. Embryonic Toxicity
3.2. Stress Related Genes
3.3. Developmental Genes
4. Experimental Section
4.1. Collection of Animals and Harvesting of Gametes
4.2. Decadienal Solutions
4.3. Exposure to DD Prior to Fertilization
4.4. Exposure to DD Post-Fertilization
4.5. Recovery Experiments
4.6. RNA Extraction and cDNA Synthesis
4.7. Quantitative Real-Time PCR (qPCR)
| Oligo Name | Oligo Sequence |
|---|---|
| gclm F | 5'-ATCGTCTCCCTCCCCATATC-3' |
| gclm R | 5'-ATCCTTGCCCAATCATTCAA-3' |
| gst F | 5'-CAGCGAGAACAGGCTTTACC-3' |
| gst R | 5'-AAAAGGTTTCAGCCAGACGA-3' |
| hox1F | 5'-CATTGCGCCTTAATGAAACC-3' |
| hox1R | 5'-GATGATGACGATGCGAGGTA-3' |
| hox12F | 5'-TGGATCATTACGGCTCACAG-3' |
| hox12R | 5'-TGGATGATGGTGGTGTGGTA-3' |
| cdx F | 5'-AAGGCCGTATGAGTGGATAAG-3' |
| cdx R | 5'-TGTCCTTAGTTCGCGTTTTG-3' |
| gsx F | 5'-CAAACAGTCATCTCGCCAAG-3' |
| gsx R | 5'-GGACGAGCTGTGGAGACTTC-3' |
4.8. Statistical Analysis
5. Conclusions
Acknowledgments
Author Contributions
Conflicts of Interest
References
- Miralto, A.; Barone, G.; Romano, G.; Poulet, S.; Ianora, A.; Russo, G.L.; Buttino, I.; Mazzarella, G.; Laabir, M. The insidious effect of diatoms on copepod reproduction. Lett. Nat. 1999, 402, 173–176. [Google Scholar]
- Ianora, A.; Miralto, A.; Poulet, S.A.; Carotenuto, Y.; Buttino, I.; Romano, G.; Casotti, R.; Pohnert, G.; Wichard, T. Aldehyde suppression of copepod recruitment in blooms of a ubiquitous planktonic diatom. Nature 2004, 429, 403–407. [Google Scholar] [CrossRef] [PubMed]
- Romano, G.; Miralto, A.; Ianora, A. Teratogenic effects of diatom metabolites on sea urchin Paracentrotus lividus embryos. Mar. Drugs 2010, 30, 950–967. [Google Scholar] [CrossRef]
- Caldwell, G.S. The influence of bioactive oxylipins from marine diatoms on invertebrate reproduction and development. Mar. Drugs 2009, 7, 367–400. [Google Scholar] [CrossRef] [PubMed]
- Tosti, E.; Romano, G.; Buttino, I.; Cuomo, A.; Ianora, A.; Miralto, A. Bioactive aldehydes from diatoms block fertilization currents in ascidian oocytes. Mol. Reprod. Dev. 2003, 66, 72–80. [Google Scholar] [CrossRef] [PubMed]
- Ianora, A.; Miralto, A. Toxigenic effects of diatoms on grazers, phytoplankton and other microbes: A review. Ecotoxicology 2010, 19, 493–511. [Google Scholar] [CrossRef] [PubMed]
- Lu, S.C. Regulation of glutathione synthesis. Mol. Asp. Med. 2009, 30, 42–59. [Google Scholar] [CrossRef]
- Nava, G.M.; Lee, D.Y.; Ospina, J.H.; Cai, S.Y.; Gaskins, H.R. Genomic analyses reveal a conserved glutathione homeostasis pathway in the invertebrate chordate Ciona intestinalis. Physiol. Genomics 2009, 39, 83–194. [Google Scholar] [CrossRef]
- Garcia-Fernàndez, J. The genesis and evolution of Homeobox gene clusters. Nat. Rev. Genet. 2005, 6, 881–892. [Google Scholar] [CrossRef]
- Meister, A. Glutathione metabolism. Methods Enzymol. 1995, 251, 3–7. [Google Scholar] [PubMed]
- Meister, A.; Tate, S.S. Glutathione and related γ-glutamyl compounds: Biosynthesis and utilization. Annu. Rev. Biochem. 1976, 45, 559–604. [Google Scholar] [CrossRef]
- Kaplowitz, N.; Aw, T.Y.; Ookhtens, M. The regulation of hepatic glutathione. Annu. Rev. Pharmacol. Toxicol. 1985, 25, 715–744. [Google Scholar] [CrossRef] [PubMed]
- Pfaffl, M.W. A new mathematical model for relative quantification in real-time RT-PCR. Nucleic Acid Res. 2001, 29, 2002–2007. [Google Scholar] [CrossRef]
- Spagnuolo, A.; Ristoratore, F.; di Gregorio, A.; Aniello, F.; Branno, M.; di Lauro, R. Unusual number and genomic organization of Hox genes in the tunicate Ciona intestinalis. Gene 2003, 309, 71–79. [Google Scholar] [CrossRef] [PubMed]
- Ferrier, D.E.K.; Holland, P.W.H. Ciona intestinalis ParaHox genes: Evolution of Hox/ParaHox cluster integrity, developmental mode, and temporal colinearity. Mol. Phylogenet. Evol. 2002, 24, 412–417. [Google Scholar] [CrossRef] [PubMed]
- Vidoudez, C.; Casotti, R.; Bastianini, M.; Pohnert, G. Quantification of dissolved and particulate polyunsaturated aldehydes in the Adriatic Sea. Mar. Drugs 2011, 9, 500–513. [Google Scholar] [CrossRef] [PubMed]
- Leflaive, J.; Ten-Hage, L. Chemical interactions in diatoms: Role of polyunsaturated aldehydes and precursors. New Phytol. 2009, 184, 794–805. [Google Scholar] [CrossRef] [PubMed]
- Hamdoun, A.; Epel, D. Embryo stability and vulnerability in an always changing world. PNAS 2007, 104, 1745–1750. [Google Scholar] [CrossRef] [PubMed]
- Poulet, S.A.; Laabir, M.; Ianora, A.; Miralto, A. Reproducive response of Calanus helgolandicus. 1. Abnormal embryonic and naupliar development. Mar. Ecol. Prog. Ser. 1995, 129, 85–95. [Google Scholar] [CrossRef]
- Uye, S.I. Induction of reproductive failure in the planktonic copepod Calanus pacificus by diatoms. Mar. Ecol. Prog. Ser. 1996, 133, 89–97. [Google Scholar] [CrossRef]
- Miralto, A.; Ianora, A.; Guglielmo, L.; Zagami, G.; Buttino, I. Egg production and hatching success in the peri-Antarctic copepod Calanus simillimus. J. Plankton Res. 1998, 20, 2369–2378. [Google Scholar] [CrossRef]
- Titelman, J.; Kiørboe, T. Motility of copepod naulpii and implications for food encounter. Mar. Ecol. Prog. Ser. 2003, 247, 123–135. [Google Scholar] [CrossRef]
- Ikuta, T.; Yoshida, N.; Satoh, N.; Saiga, H. Ciona intestinalis Hox gene cluster: Its dispersed structure and residual colinear expression. PNAS 2004, 101, 15118–15123. [Google Scholar] [CrossRef]
- Ikuta, T.; Satoh, N.; Saiga, H. Limited functions of Hox genes in the larval development of the ascidian Ciona intestinalis. Development 2010, 137, 1505–1513. [Google Scholar] [CrossRef]
- Mita, K.; Fujiwara, S. Nodal regulates neural tube formation in the Ciona intestinalis embryo. Dev. Genes Evol. 2007, 217, 593–601. [Google Scholar] [CrossRef] [PubMed]
- Hudson, C.; Darras, S.; Caillol, D.; Yasuo, H.; Lemaire, P. A conserved role for the MEK signalling pathway in neural tissue specification and posteriorisation in the invertebrate chordate, the ascidian Ciona intestinalis. Development 2003, 130, 147–159. [Google Scholar] [CrossRef]
- Untergrasser, A.; Cutcutache, I.; Koressaar, T.; Ye, J.; Faircloth, B.C.; Remm, M.; Rozen, S.G. Primer3—New capabilities and interfaces. Nucleic Acids Res. 2012, 40, e115. [Google Scholar] [CrossRef] [PubMed]
- Koressaar, T.; Remm, M. Enhancements and modifications of primer design program Primer3. Bioinformatics 2007, 23, 1289–1291. [Google Scholar] [CrossRef] [PubMed]
- Hamada, M.; Shimozono, N.; Ohta, N.; Satou, Y.; Horie, T.; Kawada, T.; Satake, H.; Sasakura, Y.; Satoh, N. Expression of neuropeptide- and hormone-encoding genes in the Ciona intestinalis larval brain. Dev. Biol. 2011, 352, 202–214. [Google Scholar] [CrossRef] [PubMed]
© 2015 by the authors; licensee MDPI, Basel, Switzerland. This article is an open access article distributed under the terms and conditions of the Creative Commons Attribution license (http://creativecommons.org/licenses/by/4.0/).
Share and Cite
Lettieri, A.; Esposito, R.; Ianora, A.; Spagnuolo, A. Ciona intestinalis as a Marine Model System to Study Some Key Developmental Genes Targeted by the Diatom-Derived Aldehyde Decadienal. Mar. Drugs 2015, 13, 1451-1465. https://doi.org/10.3390/md13031451
Lettieri A, Esposito R, Ianora A, Spagnuolo A. Ciona intestinalis as a Marine Model System to Study Some Key Developmental Genes Targeted by the Diatom-Derived Aldehyde Decadienal. Marine Drugs. 2015; 13(3):1451-1465. https://doi.org/10.3390/md13031451
Chicago/Turabian StyleLettieri, Anna, Rosaria Esposito, Adrianna Ianora, and Antonietta Spagnuolo. 2015. "Ciona intestinalis as a Marine Model System to Study Some Key Developmental Genes Targeted by the Diatom-Derived Aldehyde Decadienal" Marine Drugs 13, no. 3: 1451-1465. https://doi.org/10.3390/md13031451
APA StyleLettieri, A., Esposito, R., Ianora, A., & Spagnuolo, A. (2015). Ciona intestinalis as a Marine Model System to Study Some Key Developmental Genes Targeted by the Diatom-Derived Aldehyde Decadienal. Marine Drugs, 13(3), 1451-1465. https://doi.org/10.3390/md13031451