1. Introduction
Hepatocellular carcinoma (HCC) is the most common form of primary liver cancer and remains among the leading causes of cancer-related death worldwide, with an estimated 843,000 new cases and 732,000 deaths in 2024 [
1]. Current clinical practice guidelines, based on the Barcelona Clinic Liver Cancer (BCLC) staging system, guide systemic treatment selection for patients with advanced HCC or those no longer eligible for locoregional therapy [
2,
3]. Atezolizumab plus bevacizumab is now the preferred first-line systemic option in many guidelines, based on the phase III IMbrave150 trial [
4], while the STRIDE regimen (a single priming dose of tremelimumab plus regular-interval durvalumab) from the phase III HIMALAYA trial is another approved first-line systemic option [
5]. Nevertheless, lenvatinib remains an important option for patients unsuitable for immunotherapy or in settings with limited access to immune checkpoint inhibitors (ICIs). Lenvatinib demonstrated non-inferiority to sorafenib for overall survival and achieved a higher objective response rate in the phase III REFLECT trial, establishing it as a standard systemic treatment for unresectable HCC [
6]. In clinical practice, response to lenvatinib is currently assessed mainly by imaging according to the modified Response Evaluation Criteria in Solid Tumors (mRECIST), with the first assessment typically performed approximately 8 weeks after treatment initiation. This interval can create a lag between the onset of the biological response and its confirmation by imaging. By contrast, alpha-fetoprotein (AFP) is a routine, low-cost biomarker that can be measured repeatedly and early during treatment. Changes in AFP concentration after treatment initiation may therefore provide an early signal of tumor responsiveness before response is confirmed by imaging. Determining whether early AFP change after starting lenvatinib is associated with mRECIST response could provide useful additional information for treatment assessment and monitoring in clinical practice.
Prior studies on lenvatinib have shown that AFP change can emerge as early as weeks 2–4 and is associated with imaging response [
7,
8]. Saeki et al. defined AFP response as a ≥40% decrease after one month in patients with pretreatment AFP ≥ 10 ng/mL and reported a strong association with mRECIST response [
8]. Liu et al. used a pretreatment AFP threshold of ≥20 ng/mL and a >20% decrease after four weeks, showing that the AFP-response group had better ORR, DCR, and PFS [
9]. A meta-analysis of 26 studies comprising 3056 patients also showed that AFP decline was associated with more favorable OS and PFS, while noting substantial heterogeneity in cutoffs and assessment timing [
10]. Recently, a multicenter study of 553 patients treated with lenvatinib showed that AFP trajectories over time could stratify OS and PFS [
11], while a post hoc analysis of the REFLECT trial using a ≥20% AFP decline threshold at week 8 reported higher ORR, PFS, and OS in the response group [
12]. Nevertheless, existing studies remain inconsistent regarding the optimal assessment time point and decline threshold, and they have not established AFP as a surrogate for imaging response or survival outcomes.
In this context, we used the first available post-treatment AFP result after lenvatinib initiation to evaluate the association between AFP change and imaging response according to mRECIST under real-world clinical practice conditions. The primary analysis was performed in patients with pretreatment AFP ≥ 20 ng/mL, with AFP response defined as a ≥40% decrease from the pretreatment value. Alternative AFP decline thresholds were used in sensitivity analyses to assess the robustness of the findings.
2. Materials and Methods
2.1. Study Design and Population
This retrospective study included 191 patients with HCC treated with lenvatinib in routine clinical practice at Vietnam National Cancer Hospital and Hanoi Oncology Hospital between March 2021 and December 2025 (data lock date: 1 June 2026). HCC diagnosis was established based on standard imaging and/or histopathological criteria. All 191 patients (the overall population) were included to describe the general characteristics of the study. No formal sample size calculation was performed; the study included all consecutive eligible patients treated during the study period, consistent with the retrospective design.
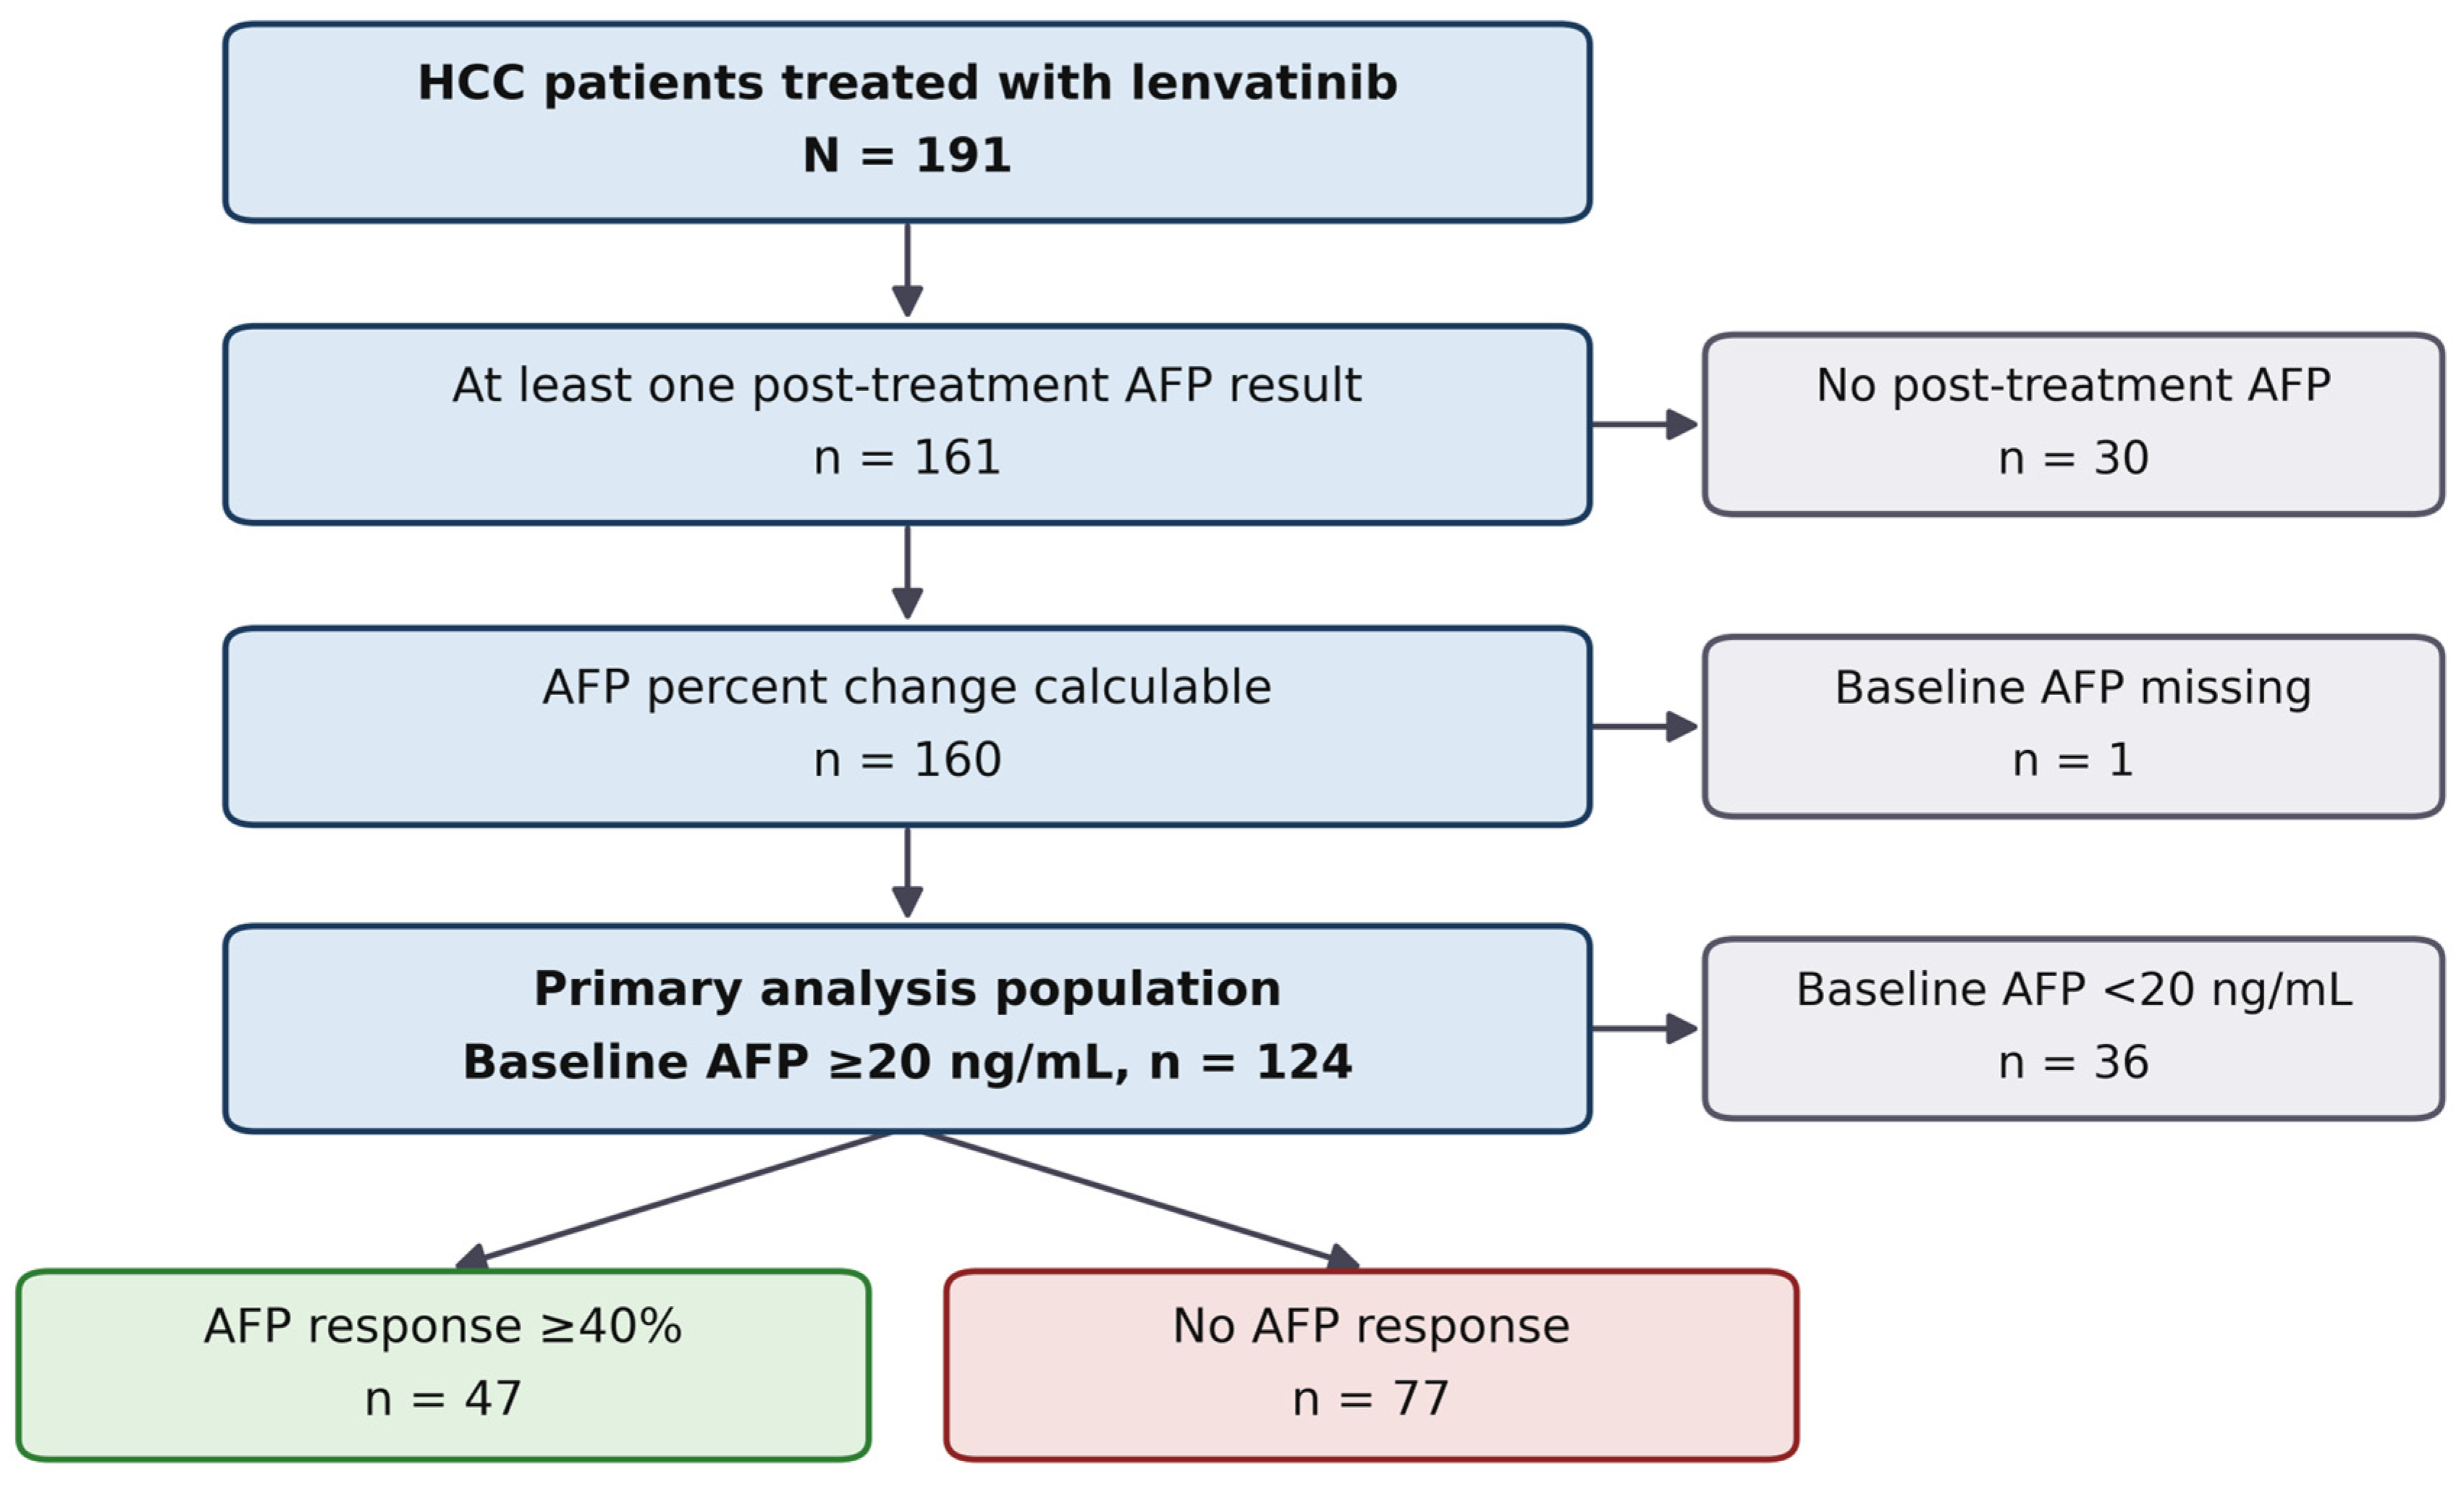
The study population was stratified according to two independent criteria to serve different analyses, illustrated in detail in the patient selection flow diagram (
Figure 1). The first criterion was pretreatment AFP availability: one patient without a pretreatment AFP value was considered to have missing data and was excluded from all AFP-related analyses; the remaining 190 patients had a valid pretreatment AFP value, comprising 47 patients with AFP < 20 ng/mL and 143 patients with AFP ≥ 20 ng/mL. This population of 190 patients with valid pretreatment AFP was used for the supplementary analysis comparing ORR, DCR, PFS, and OS according to the pretreatment AFP threshold (
Section 2.4), regardless of post-treatment AFP availability. The second criterion was the availability of post-treatment AFP: 161 patients (84.3%) had at least one AFP measurement after treatment initiation, allowing calculation of the AFP change rate; the remaining 30 patients without post-treatment AFP are shown in the selection flow diagram and were descriptively compared with the 161 patients who had post-treatment AFP to assess the potential for selection bias. This comparison was made both in the whole cohort and, in a second panel, among patients with pretreatment AFP ≥ 20 ng/mL who would otherwise have been eligible for the primary analysis (
Table S1).
The primary analysis population—used for the primary endpoints regarding AFP response (
Section 2.4)—is the intersection of the two criteria above: patients with both pretreatment AFP ≥ 20 ng/mL and at least one post-treatment AFP measurement, comprising 124 patients. The supplementary analysis by pretreatment AFP (comparing the <20 ng/mL and ≥20 ng/mL groups) was performed in all 190 patients with a valid pretreatment AFP value, as described above, regardless of post-treatment AFP testing.
2.2. Treatment and Assessment
The starting dose of lenvatinib (Lenvima, Eisai Co., Ltd., Tokyo, Japan) was weight-based: 12 mg orally once daily in patients ≥ 60 kg and 8 mg orally once daily in patients < 60 kg. Lenvatinib was administered continuously without a scheduled rest period; for the purpose of laboratory follow-up, one treatment cycle was defined as 30 days (one month). The actual dose could be adjusted by the treating physician; dose reduction or temporary interruption was implemented based on toxicity and the patient’s clinical status. Pretreatment characteristics included age, sex, Eastern Cooperative Oncology Group (ECOG) performance status, Child–Pugh score, albumin–bilirubin (ALBI) grade [
13], BCLC stage, macrovascular invasion (including main portal trunk thrombus, VP4), extrahepatic metastasis, tumor size, tumor number, hepatitis B virus (HBV) and hepatitis C virus (HCV) status, diabetes mellitus, alcohol use, prior local treatment (surgery, transarterial chemoembolization [TACE], or radiofrequency ablation [RFA]), and pretreatment AFP. Lenvatinib treatment duration and the reason for treatment discontinuation, when applicable, were also recorded.
The first imaging assessment was typically performed approximately 8 weeks after treatment initiation—that is, after approximately two treatment cycles—and thereafter according to routine practice at each center, approximately every 8 weeks. Among patients who achieved an objective response, the median time to documented response was 2.0 months. Tumor response was assessed according to mRECIST [
14] and classified as complete response (CR), partial response (PR), stable disease (SD), or progressive disease (PD). The objective response rate (ORR) was defined as CR + PR, and the disease control rate (DCR) was defined as CR + PR + SD.
Serum AFP was measured by electrochemiluminescence immunoassay (ECLIA) using the Elecsys AFP assay on cobas e 402/e 801 analyzers (Roche Diagnostics, Mannheim, Germany), according to the manufacturer’s instructions. The assay was standardized against the 1st WHO International Reference Preparation 72/225 and had a measuring range of 0.908–1210 ng/mL; samples exceeding the upper limit were reanalyzed after 1:50 dilution. The limit of quantitation was 2.72 ng/mL, and intermediate precision (coefficient of variation) ranged from 2.3% to 4.2% across serum concentrations of 2.18–554 ng/mL. In each patient, pretreatment and post-treatment samples were assayed by the same method on the same platform, in the clinical laboratory of the treating hospital under routine internal quality control.
For AFP analyses, the first post-treatment AFP result was used to calculate the percentage change from the pretreatment value.
2.3. Definition of First Post-Treatment AFP and AFP Response
The first post-treatment AFP was defined as the first valid AFP result recorded after lenvatinib initiation. No fixed assessment time point was imposed; the treatment cycle at which the first AFP was recorded was captured and entered into the adjusted analyses. Because one cycle corresponded to 30 days, a first AFP recorded at cycle 1, 2, 3, or 4 would correspond to approximately 1, 2, 3, or 4 months after lenvatinib initiation, respectively.
The percentage change in AFP was calculated as
The primary AFP response was defined as a decrease of ≥40%, equivalent to a post-treatment/pretreatment AFP ratio ≤ 0.60. The 40% threshold was pre-specified based on existing literature (not derived from this study’s own dataset). Alternative AFP decline thresholds of ≥20%, ≥30%, and ≥50% were used to assess the robustness of the primary findings.
2.4. Endpoints
The primary endpoints were the associations between AFP response (≥40%) and both ORR and DCR according to mRECIST. Secondary survival endpoints included PFS and OS. The discriminative ability of continuous AFP change for imaging response, as well as sensitivity, specificity, positive predictive value, negative predictive value, alternative AFP decline thresholds, and concordance between AFP and mRECIST, was explored in supplementary analyses. A separate supplementary analysis evaluated ORR, DCR, PFS, and OS according to two pretreatment AFP groups (<20 and ≥20 ng/mL).
PFS was calculated from the date of lenvatinib initiation to progression or death; OS was calculated to death from any cause. Although PFS and OS are secondary survival endpoints, AFP response is a post-treatment variable measured at non-uniform time points; therefore, the survival analyses were considered exploratory and subject to the risk of immortal-time (guarantee-time bias [
15]; a landmark analysis was therefore performed to address this risk (
Section 2.5).
2.5. Statistical Analysis
Continuous variables were described using medians and interquartile ranges; categorical variables were described using frequencies and percentages. Fisher’s exact test was used for the crude association between AFP response and ORR/DCR. For the primary endpoints, binary logistic regression models for ORR and DCR included AFP response (≥40% decline) as the exposure of interest, with four covariates specified a priori on clinical grounds (not through stepwise or other data-driven selection): timing of the first AFP measurement (after cycle 1 vs. cycle 1, binary), pretreatment ALBI score (continuous), macrovascular invasion (binary), and tumor number ≥ 5 (binary). Models were fitted using complete-case analysis; patients with a missing value for any covariate were excluded from the corresponding model. The number of covariates was limited to be commensurate with the number of response events. Median follow-up was estimated using the reverse Kaplan–Meier method.
Receiver operating characteristic (ROC) curves, summarized by the area under the curve (AUC), were used to assess the discriminative ability of continuous AFP change. The optimal cutoff determined by the Youden index is presented only as an exploratory analysis and does not replace the pre-specified ≥40% AFP decline threshold. For the secondary endpoints PFS and OS, multivariable Cox models used the same set of adjustment covariates; because the exposure variable was defined after treatment initiation, these results were considered exploratory and interpreted cautiously owing to the risk of immortal-time bias. With 5 adjustment covariates and a complete-case population of 113 patients, the events-per-variable (EPV) ratio was approximately 19.4 for PFS (97 events) and 16.4 for OS (82 events), above the commonly recommended minimum of 10 events per variable, limiting the risk of overfitting. In the supplementary analysis by pretreatment AFP, ORR and DCR were compared using Fisher’s exact test, while PFS and OS were estimated using the Kaplan–Meier method and compared using the log-rank test. Adjusted models included pretreatment ALBI score, macrovascular invasion, and tumor number ≥ 5. Because these are supplementary analyses without adjustment for multiple testing,
p-values were interpreted cautiously. All tests were two-sided, and
p < 0.05 was considered statistically significant. Analyses were performed using R (v4.6.0; R Foundation for Statistical Computing, Vienna, Austria). The sensitivity and landmark analyses were performed in Python (v3.10.12) using the lifelines (v0.30.0) and statsmodels (v0.14.6) packages. The study was reported according to the Strengthening the Reporting of Observational Studies in Epidemiology (STROBE) guideline [
16] for observational studies (the STROBE checklist is provided in the
Supplementary Materials, Table S2).
Two additional analyses were performed to address the non-uniform timing of AFP assessment and the risk of immortal-time bias. First, a sensitivity analysis repeated the ORR, DCR, and survival analyses restricted to patients whose first post-treatment AFP was obtained at cycle 1, thereby fixing the assessment time point at approximately one month. Second, a landmark analysis was performed with the landmark set at 2 months after lenvatinib initiation, corresponding to the end of cycle 2, by which time AFP response status had been determined in 118 of 124 patients (95.2%). Patients who died or progressed before the landmark were excluded from the respective analysis, and survival time was recomputed from the landmark; a landmark at 3 months was examined as a further check. Both analyses used the same adjustment covariates as the primary models.
2.6. Research Ethics
This study used retrospective medical record data, maintained patient confidentiality, and did not interfere with the treatment process. The study was approved by the Institutional Review Board for Biomedical Research, Hanoi Medical University (approval no. 935/GCN-HĐĐĐNCYSH-ĐHYHN, date of approval 16 June 2023; reference code IRB-VN01.001/IRB00003121/FWA00004148). The study was conducted in accordance with the principles of the Declaration of Helsinki.
4. Discussion
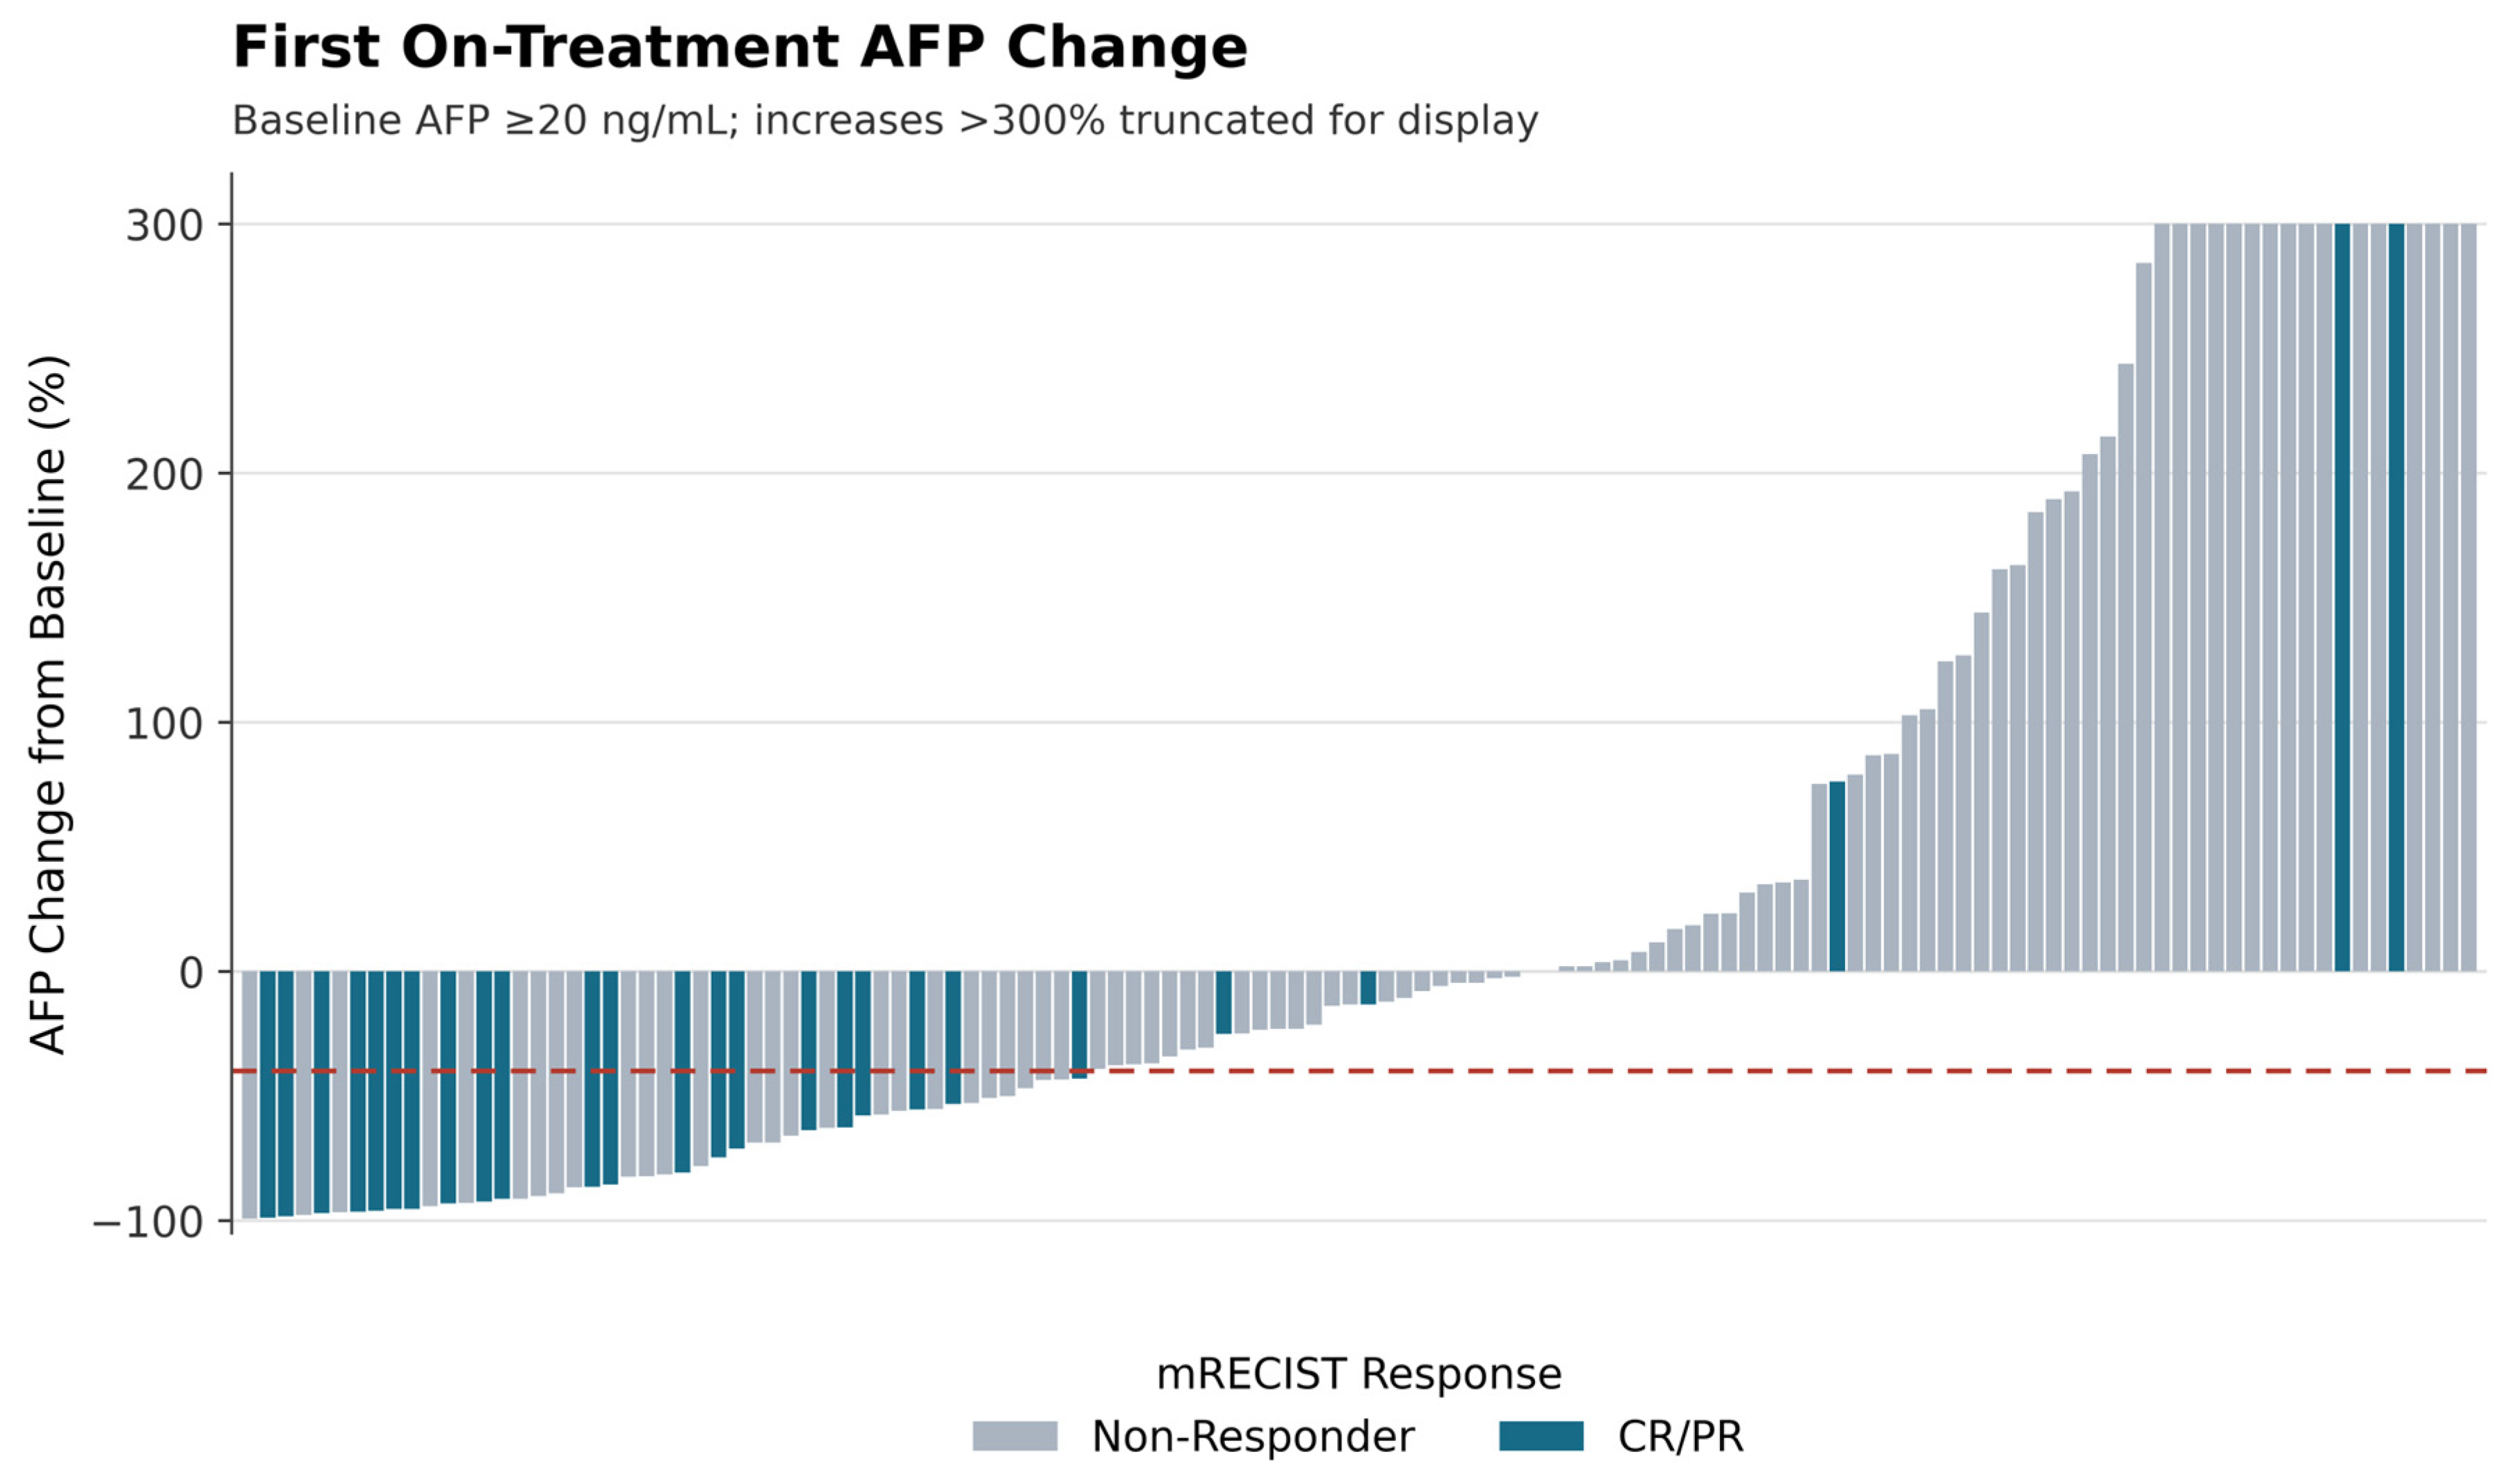
This study showed that a ≥40% AFP decline at the first post-treatment measurement was strongly associated with imaging response according to mRECIST in patients with HCC treated with lenvatinib who had pretreatment AFP ≥ 20 ng/mL. The ORR of the AFP-response group was nearly seven-fold higher than that of the non-response group (44.7% versus 6.5%), and this association remained clear after adjustment for liver function, tumor burden, and assessment timing.
Our results are consistent with previous studies, while also extending the evidence to a real-world clinical practice setting. Kodama et al. reported that patients with a sustained AFP decline from week 2 to week 4 achieved an ORR of 67%, whereas no patients without a sustained AFP decline achieved an imaging response (0%;
p = 0.02) [
7]. Saeki et al. defined AFP response as a ≥40% decrease after 1 month in patients with pretreatment AFP ≥ 10 ng/mL and showed that the AFP-response group had markedly higher ORR (68.4% versus 7.1%) and DCR (84.2% versus 36.0%); AFP response was also an independent predictor of objective response (OR 51.39; 95% CI 4.89–540.28;
p = 0.001) [
8]. Similarly, Liu et al. used a >20% AFP decline threshold at 4 weeks in patients with HBV-related HCC and pretreatment AFP ≥ 20 ng/mL, reporting an ORR of 34.5% versus 6.3%, DCR of 82.8% versus 50.0%, and median PFS of 13 versus 7 months in the AFP-response and non-response groups [
9]. In our study, ORR was 44.7% versus 6.5%, and DCR was 83.0% versus 57.1%, indicating a degree of clinical discrimination comparable to previous studies, despite a more flexible AFP assessment timing that reflects routine treatment practice.
Our survival findings are also consistent with existing evidence. A meta-analysis by Tian et al. of 3056 patients treated with targeted therapy or immunotherapy showed that AFP response was associated with a lower risk of death (pooled HR 0.48, 95% CI 0.40–0.56) and a lower risk of progression or death (pooled HR 0.39, 95% CI 0.33–0.46) [
10]. A more recent meta-analysis by an overlapping author group, restricted to 131 studies of immune checkpoint inhibitor-treated patients, similarly found that AFP response was associated with more favorable OS (pooled HR 0.41, 95% CI 0.33–0.52), PFS (pooled HR 0.38, 95% CI 0.30–0.47), ORR (pooled OR 5.39, 95% CI 3.96–7.32), and DCR (pooled OR 5.48, 95% CI 3.71–8.11), and identified an AFP decline >20% as the most commonly used and efficient response threshold, while emphasizing that accurately defining early AFP response remains an area requiring further study [
18]. In lenvatinib-treated patients, a 2025 multicenter study identified four AFP trajectory patterns and reported that the rapid-decline group had a lower risk of death (adjusted HR 0.28, 95% CI 0.18–0.42,
p < 0.001) and a lower risk of progression or death (adjusted HR 0.34, 95% CI 0.24–0.47,
p < 0.001) compared with the persistently high AFP group [
11]. A 2026 post hoc analysis of the REFLECT trial also showed that patients with a ≥20% AFP decline at week 8 achieved a higher ORR by mRECIST (48.0% versus 13.7%), longer median PFS (7.4 versus 3.5 months), and longer median OS (13.4 versus 8.3 months) [
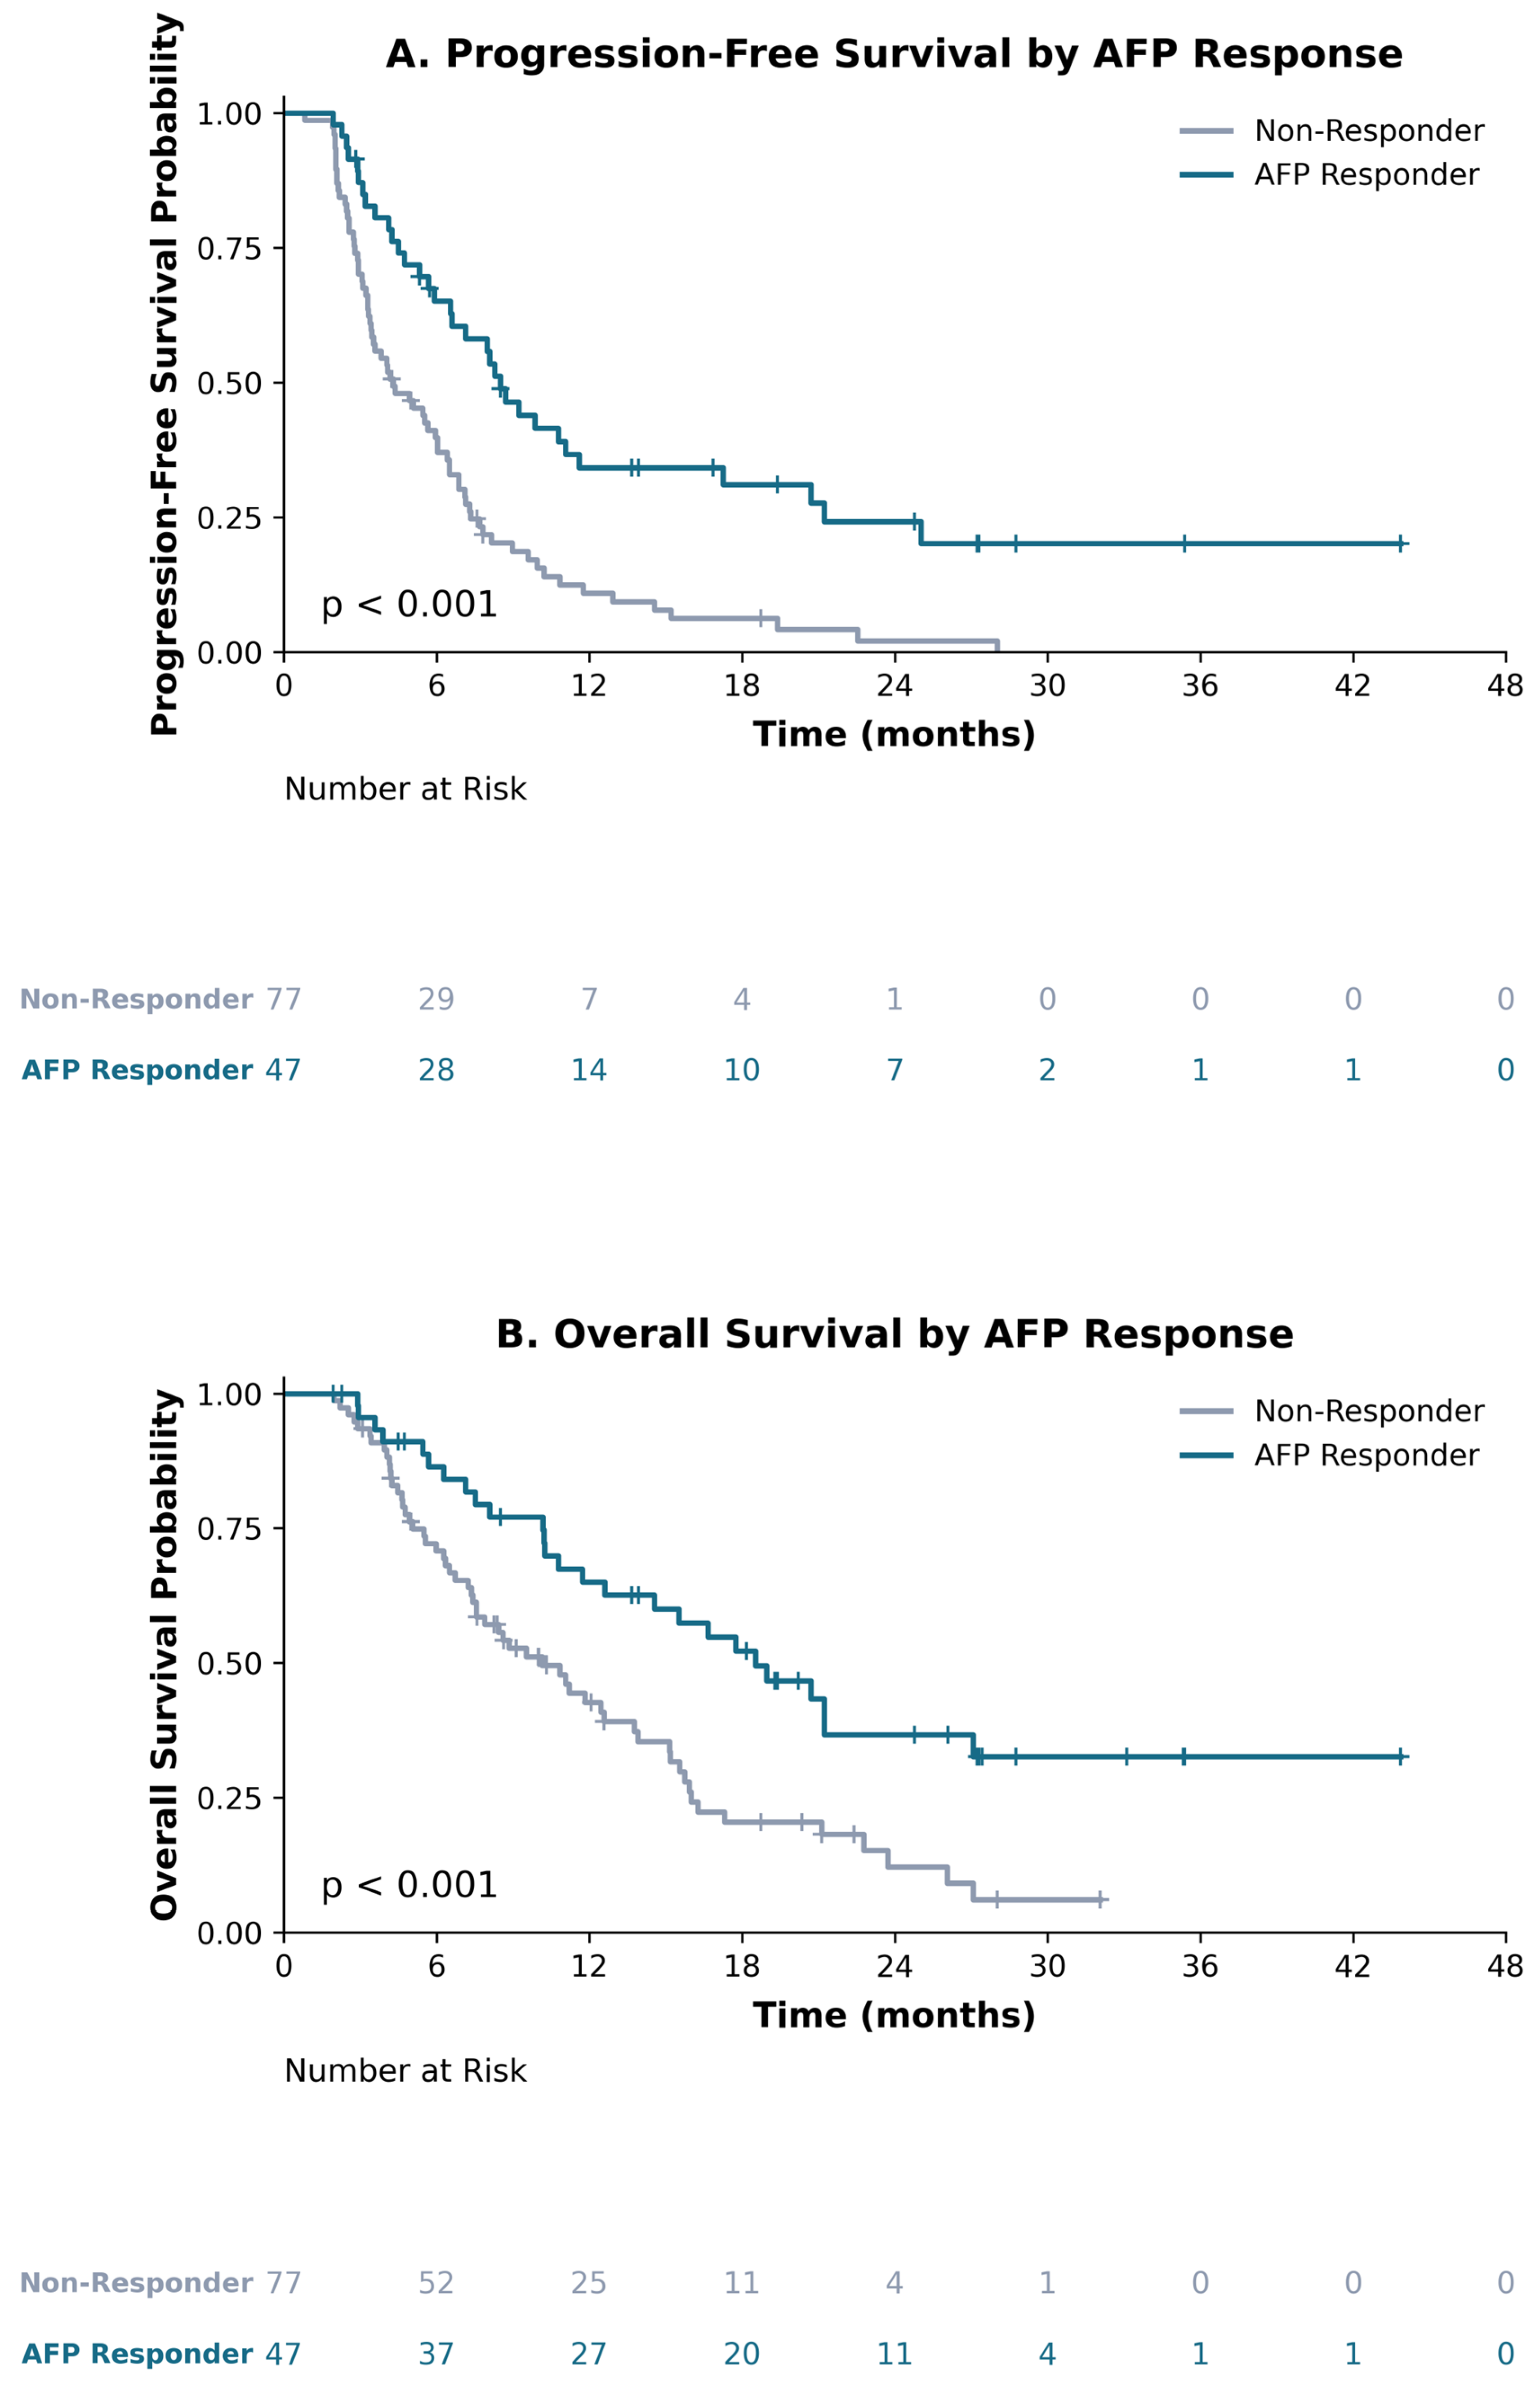
12]. Similarly, in our study, AFP response was associated with longer PFS and OS (adjusted HR 0.38 and 0.49, respectively). A summary comparison with prior studies is presented in
Table 11. However, cross-study comparisons should be interpreted cautiously given differences in study populations, AFP response criteria, assessment timing, treatment regimens, and analytical methods.
The novel aspects of this study, relative to previously published AFP–lenvatinib/AFP–ICI studies and meta-analyses (
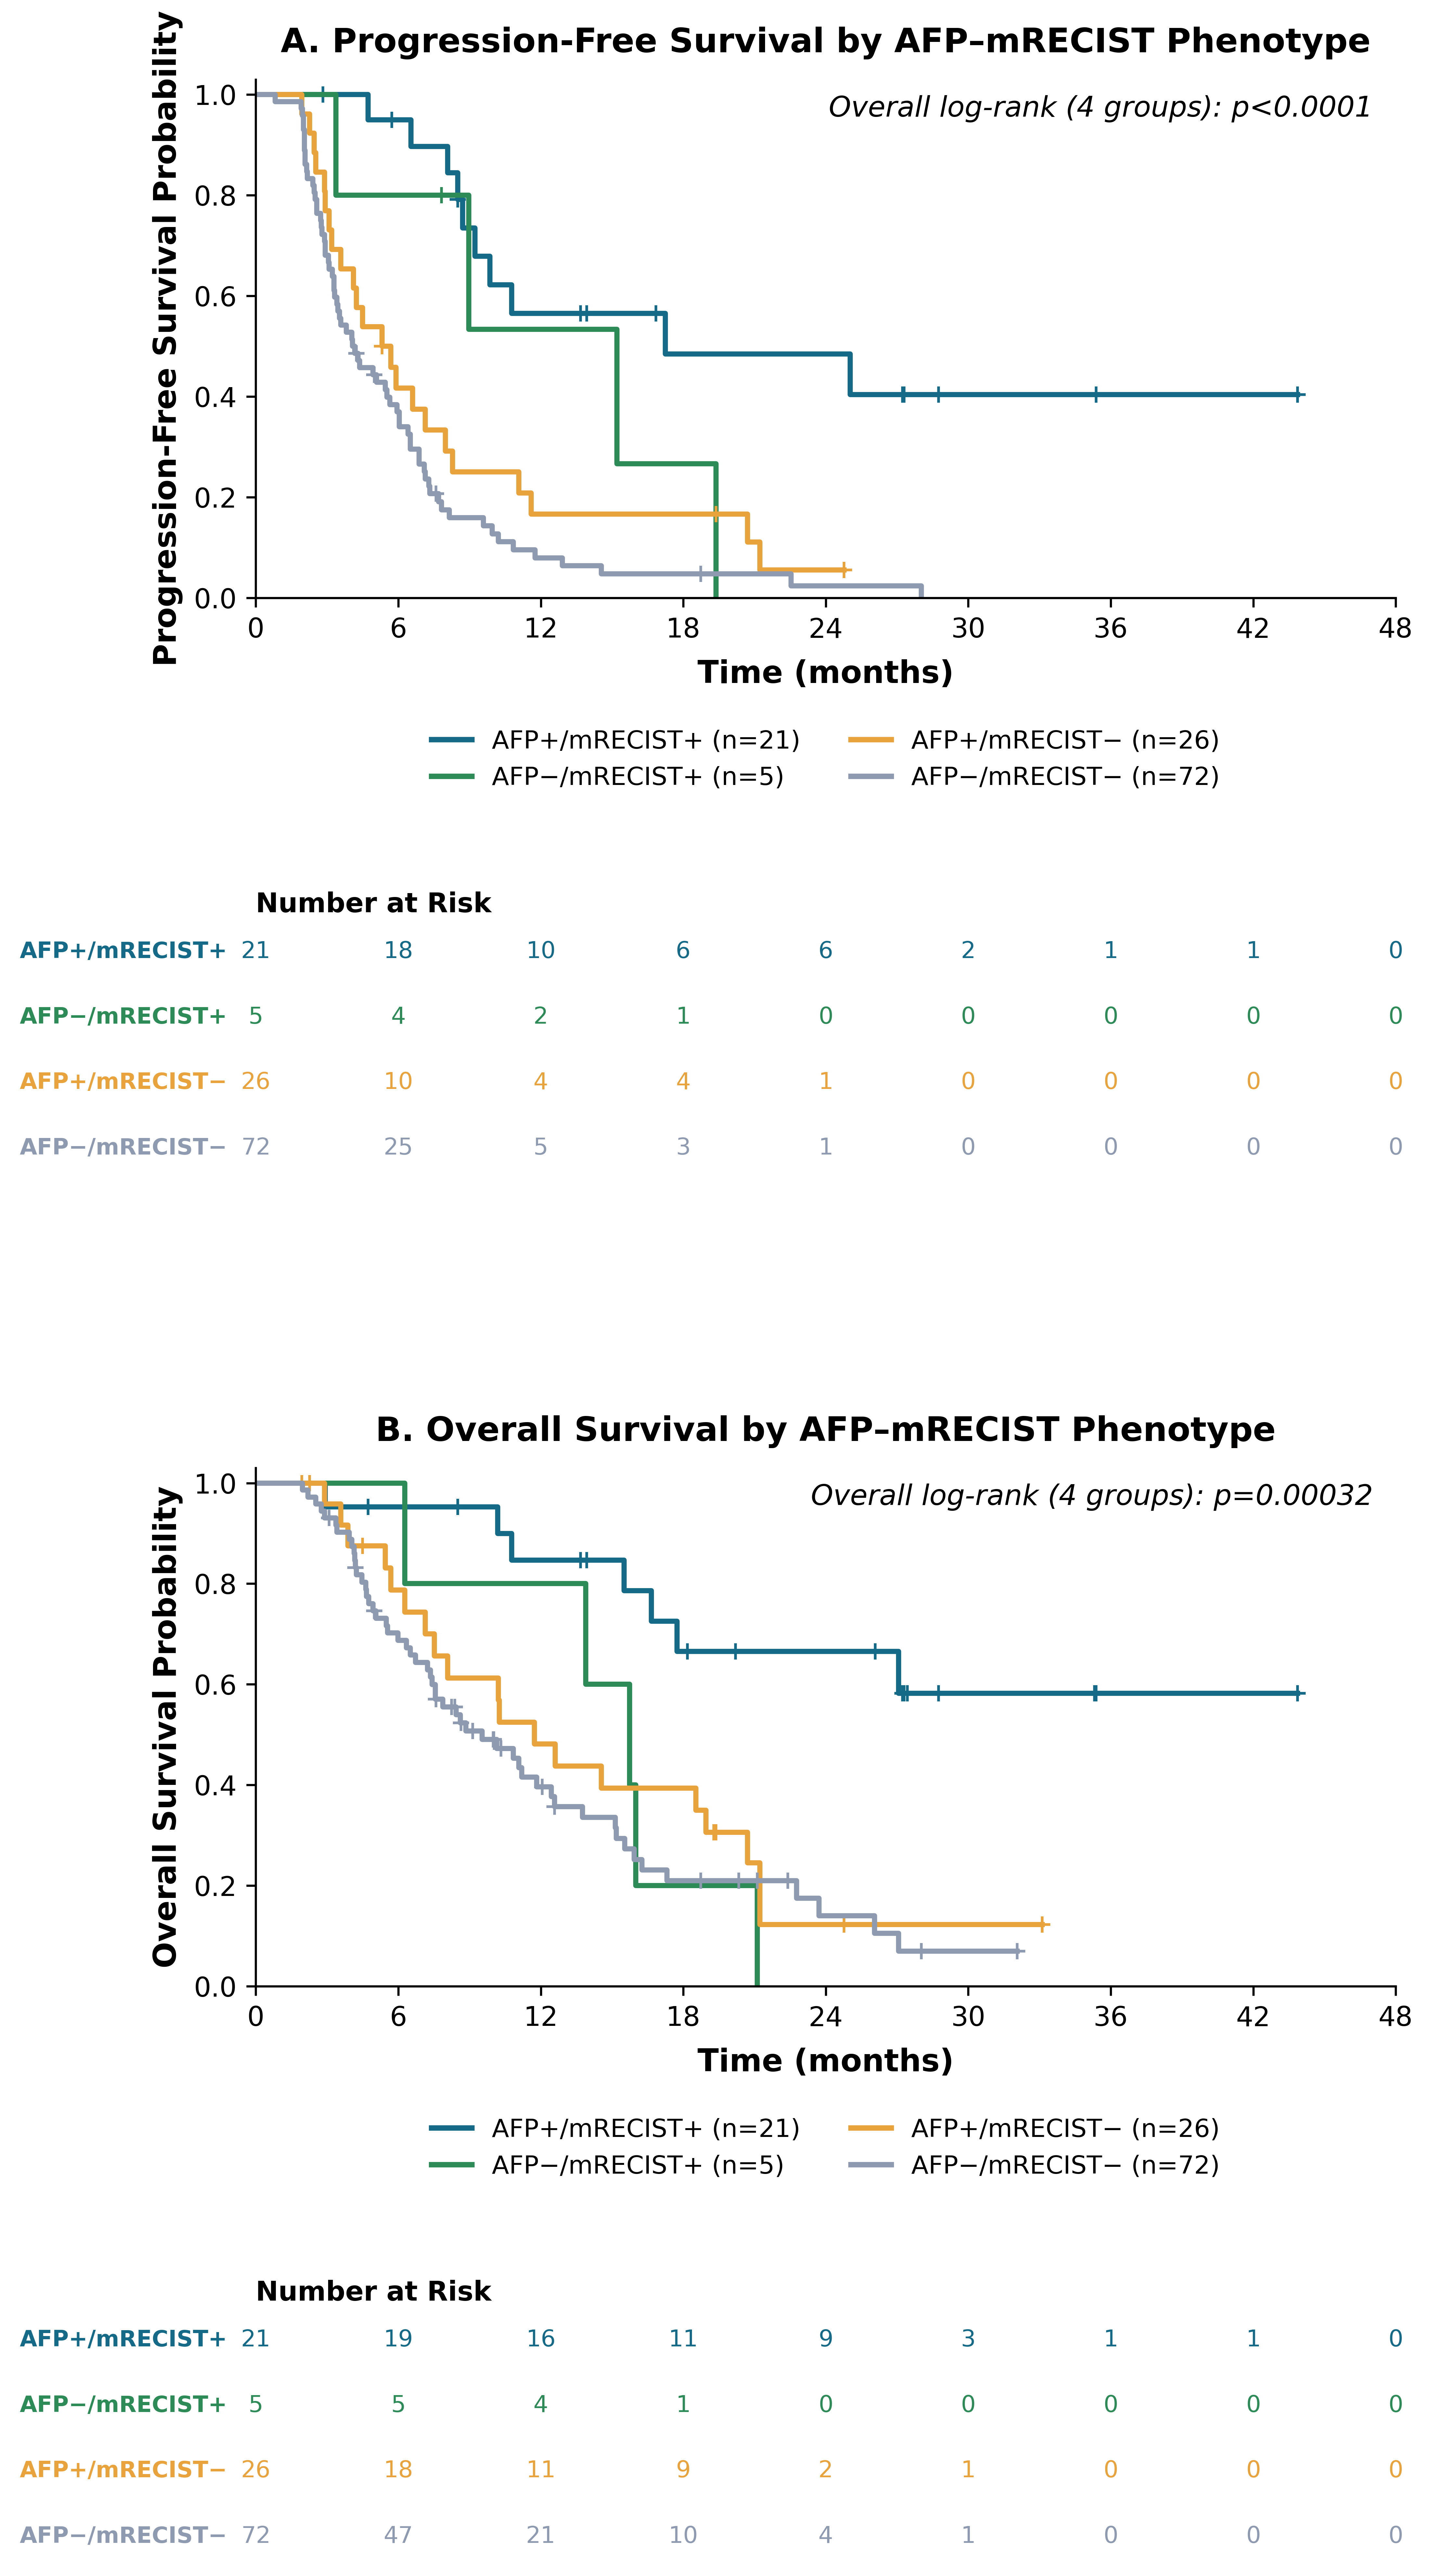
Table 11), are (1) the use of the first available post-treatment AFP result in clinical practice, rather than a fixed testing time point, which more closely reflects routine monitoring and limits patient exclusion; (2) the concordance analysis between AFP response and imaging response across four AFP–mRECIST phenotypes (
Table 6), clarifying the complementary—not substitutive—role of AFP in treatment monitoring; and (3) the assessment of the consistency of the AFP response–outcome association according to HBV status (
Table 8), an aspect not previously reported in AFP–lenvatinib studies.
The use of the first post-treatment AFP result reflects routine clinical practice but introduces heterogeneity in assessment timing. To mitigate this factor, we recorded the timing of the first AFP measurement, included this variable in the multivariable model, and repeated the primary analysis in the 99 patients who were measured at cycle 1. Timing was not independently associated with objective response (aOR 1.75;
p = 0.394), and the cycle-1 analysis reproduced the primary estimate almost exactly (aOR 12.27 versus 12.96;
Section 3.9). However, these measures cannot fully substitute for standardizing assessment timing in prospective studies. Accordingly, our findings should be interpreted as evidence supporting the utility of a flexible AFP monitoring strategy in clinical practice, rather than as an evaluation of AFP testing performance at one fixed post-treatment time point.
There is no universally accepted AFP threshold. A 20% threshold has been used in the Liu study, the meta-analysis, and the REFLECT analysis [
9,
10,
12], while a 40% threshold was used at week 4 in the Saeki study and within 8 weeks in the Hsu study [
8,
17]. In this dataset, the association with ORR was consistent across all four thresholds of 20%, 30%, 40%, and 50% (
Figure S1). The internally derived optimal cutoff of approximately 53% is exploratory only, as it was generated from this dataset and carries the risk of overfitting. Therefore, selecting 40% as the primary analysis threshold was a pre-specified decision grounded in the literature rather than an empirically optimized choice; results at the other thresholds should be viewed as sensitivity analyses rather than a search for a universal cutoff.
Analysis of discordant cases between AFP response and mRECIST response also yielded clinically meaningful information. Some patients had a marked AFP decline but had not yet achieved CR or PR by mRECIST, possibly because imaging assessment was performed early, the disease had been stable for a prolonged period, or there was a discrepancy between changes in tumor biological activity and imaging response. Conversely, some patients achieved an imaging response without a ≥40% AFP decline. These findings suggest that AFP should not be used alone to decide whether to continue or discontinue lenvatinib, but should be interpreted together with imaging response, clinical course, and liver function.
How an early AFP result might influence management before the first scheduled imaging assessment deserves explicit comment. In our view, an early AFP response should not by itself trigger continuation, modification, or discontinuation of therapy, and it does not substitute for imaging. Its role is to add biological information during the interval before the first scan, which in this cohort was approximately 8 weeks. In a patient with a marked AFP decline who is clinically stable and tolerating treatment, this result provides supportive evidence of biological activity while awaiting imaging. Conversely, the absence of an early AFP decline should not be read as treatment failure: AFP kinetics vary between patients, and five patients in this cohort achieved an imaging response without an early AFP decline. In such patients, the appropriate response is closer clinical monitoring and consideration of earlier imaging, rather than a change in therapy based on AFP alone. AFP kinetics should therefore be regarded as a supportive biomarker, and prospective studies are required to determine whether AFP-informed decisions improve clinical outcomes.
Analysis by pretreatment AFP adds a perspective distinct from post-treatment AFP kinetics. Patients with pretreatment AFP < 20 ng/mL had more favorable DCR, PFS, and OS in the unadjusted analysis. After adjustment, the association remained statistically significant for OS and DCR, was of borderline significance for ORR, and was no longer statistically significant for PFS. This finding suggests that a low pretreatment AFP may reflect a lower disease burden or more favorable biological characteristics, but is insufficient to establish pretreatment AFP as an independent prognostic factor for all outcomes. Conversely, assessment of AFP kinetics is only meaningful in patients with a sufficiently high pretreatment AFP, because in the pretreatment AFP < 20 ng/mL group, the relative AFP change is less stable and less likely to reflect the tumor’s biological response. Therefore, pretreatment AFP and post-treatment AFP response should be regarded as complementary rather than interchangeable pieces of information: pretreatment AFP reflects baseline disease characteristics, whereas AFP kinetics reflect the early biological response to treatment.
This study has several limitations. First, the timing of the first AFP measurement was not standardized, and AFP response is a variable determined after treatment initiation; the PFS and OS analyses are therefore susceptible to immortal-time bias. A sensitivity analysis restricted to cycle-1 measurements and a 2-month landmark analysis both yielded estimates closely matching the primary analysis, which argues against a substantial contribution from this bias. Nevertheless, because the exposure remains a post-baseline variable, the survival results are presented as exploratory and require confirmation in prospective studies with standardized assessment timing. Second, the best response by mRECIST may have been determined before or after the timing of the first AFP measurement, depending on the imaging assessment schedule. Third, post-treatment AFP was not available in 30 patients (15.7%). This missingness reflected institutional monitoring practice rather than early attrition, and the affected patients had less advanced disease and better outcomes; the resulting selection is therefore conservative with respect to the primary association, but reliance on complete-case analysis remains a limitation. Fourth, neither des-gamma-carboxy prothrombin (DCP/PIVKA-II) nor AFP-L3 was measured, because DCP is not reimbursed in Vietnam and AFP-L3 is not available at either participating center; whether combining AFP kinetics with these markers would improve early prediction of response remains an important question for future studies. Fifth, the study has not been validated in an independent population; therefore, the findings, particularly the survival analyses, should be interpreted with caution. Finally, these findings were derived from two oncology centers in Vietnam and may not be directly generalizable to other populations, ethnic groups, or clinical settings; validation in independent, multi-regional cohorts is warranted.
Despite these limitations, the study has several strengths, including a real-world population consecutively enrolled at two centers, mRECIST-based response assessment, the flexible AFP-timing strategy discussed above (which retains more patients than a single fixed time point design), multiple pre-specified AFP response thresholds, adjustment for assessment timing, and analysis of discordant AFP–imaging cases, all of which together clarify the complementary role of AFP in the early assessment of treatment efficacy.
Overall, these findings are consistent with a role for AFP as a complementary biomarker in the early monitoring of lenvatinib response in patients with HCC and pretreatment AFP ≥ 20 ng/mL. A ≥40% AFP decline after treatment initiation was associated with a higher likelihood of imaging response and, in exploratory analyses, with more favorable survival. AFP does not replace mRECIST-based assessment, and any clinical application would need to be established prospectively; for now, AFP results should be interpreted alongside imaging, clinical course, and liver function.




 ,
,