Malnutrition and Frailty as Independent Predictors of Adverse Outcomes in Hospitalized Older Adults: A Prospective Single Center Study

 , ,
, ,
Abstract
1. Introduction
2. Methods
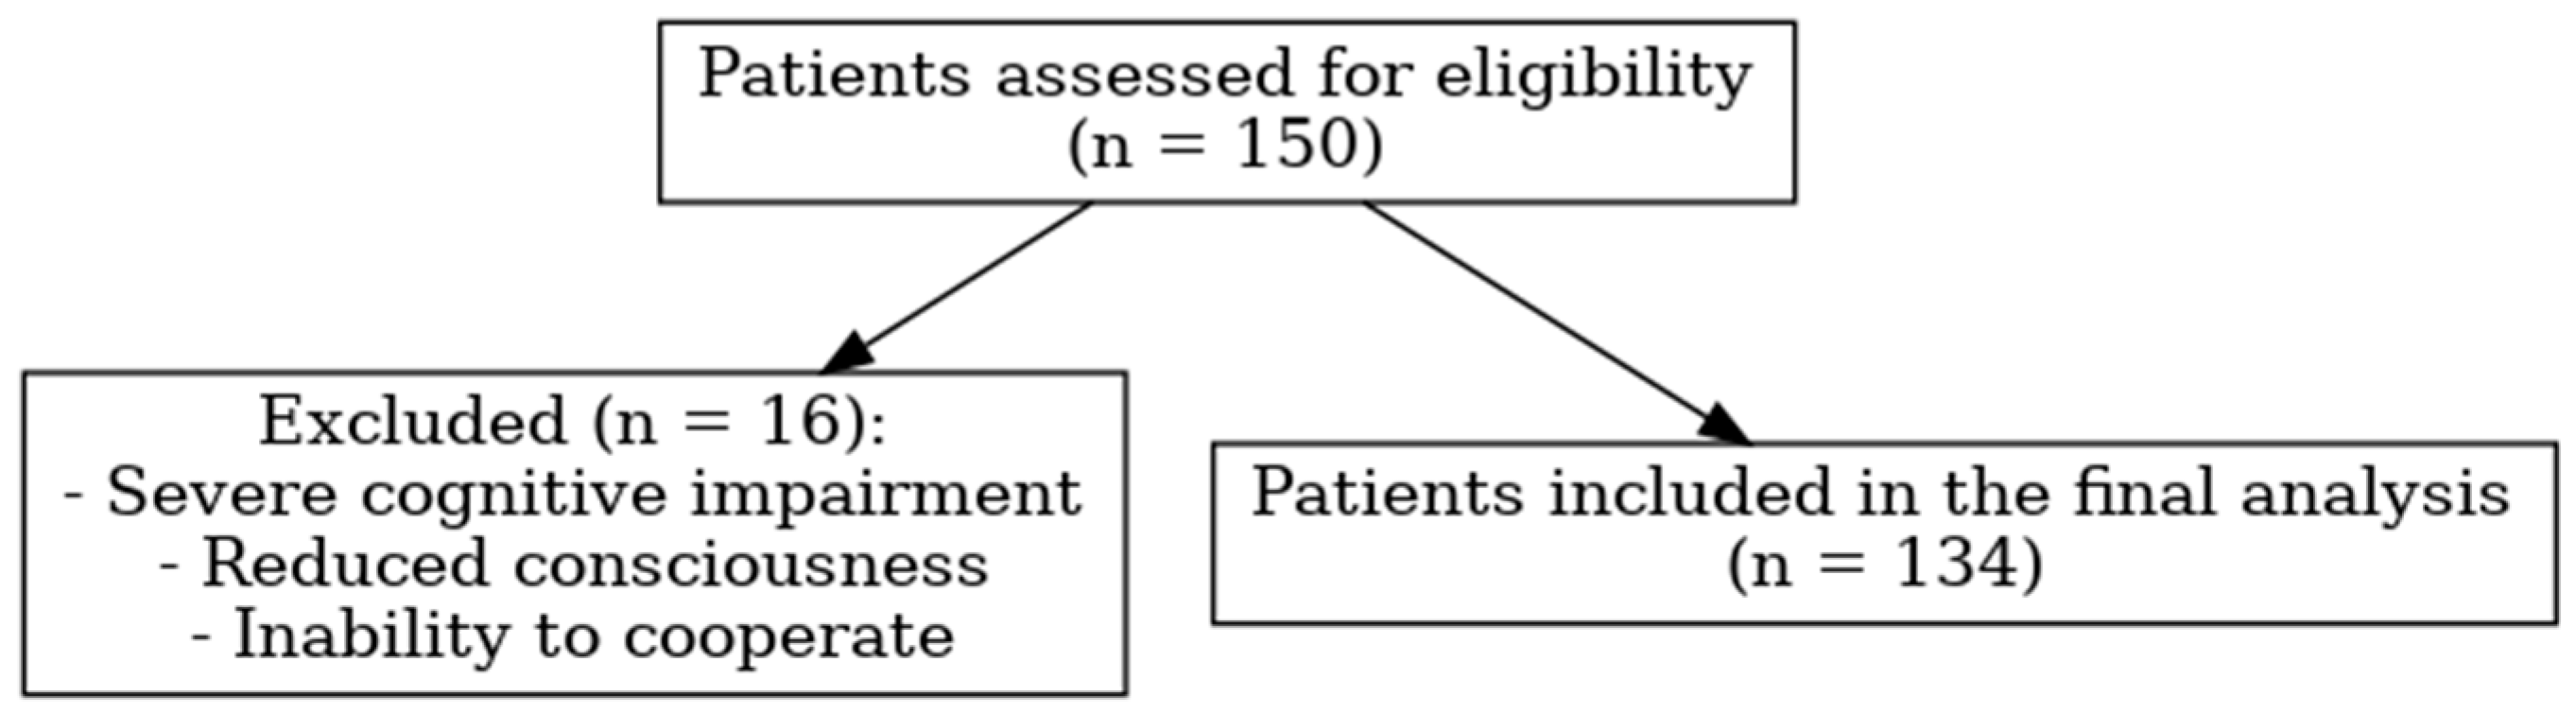
2.1. Study Population
2.2. Data Collection and Assessments
2.3. Nutritional Assessment
2.4. Evaluation of Frailty
2.5. Functional and Anthropometric Measurements
2.6. Outcome Measures and Monitoring
2.7. Statistical Analysis
2.8. Ethical Statement
3. Results
4. Discussion
4.1. Limitations
4.2. Strengths
5. Conclusions
Author Contributions
Funding
Institutional Review Board Statement
Informed Consent Statement
Data Availability Statement
Conflicts of Interest
References
- Sobotka, L.; Forbes, A. Basics in Clinical Nutrition; Galen: Los Angeles, LA, USA, 2019. [Google Scholar]
- Clegg, A.; Young, J.; Iliffe, S.; Rikkert, M.O.; Rockwood, K. Frailty in elderly people. Lancet 2013, 381, 752–762. [Google Scholar] [CrossRef]
- Ligthart-Melis, G.C.; Luiking, Y.C.; Kakourou, A.; Cederholm, T.; Maier, A.B.; de van der Schueren, M.A.E. Frailty, sarcopenia, and malnutrition frequently (co-)occur in hospitalized older adults: A systematic review and meta-analysis. J. Am. Med. Dir. Assoc. 2020, 21, 1216–1228. [Google Scholar] [CrossRef]
- Cass, A.R.; Charlton, K.E. Prevalence of hospital-acquired malnutrition and modifiable determinants of nutritional deterioration during inpatient admissions: A systematic review of the evidence. J. Hum. Nutr. Diet. 2022, 35, 1043–1058. [Google Scholar] [CrossRef]
- Lee, D.R.; Kawas, C.H.; Gibbs, L.; Corrada, M.M. Prevalence of frailty and factors associated with frailty in individuals aged 90 and older: The 90+ Study. J. Am. Geriatr. Soc. 2016, 64, 2257–2262. [Google Scholar] [CrossRef]
- Wischmeyer, P.E. Tailoring nutrition therapy to illness and recovery. Crit Care 2017, 21 (Suppl. 3), 316. [Google Scholar] [CrossRef]
- Laur, C.V.; McNicholl, T.; Valaitis, R.; Keller, H.H. Malnutrition or frailty? Overlap and evidence gaps in the diagnosis and treatment of frailty and malnutrition. Appl. Physiol. Nutr. Metab. 2017, 42, 449–458. [Google Scholar] [CrossRef]
- Dent, E.; Lien, C.; Lim, W.S.; Wong, W.C.; Wong, C.H.; Ng, T.P.; Woo, J.; Dong, B.; De la Vega, S.; Poi, P.J.H.; et al. The Asia-Pacific clinical practice guidelines for the management of frailty. J. Am. Med. Dir. Assoc. 2017, 18, 564–575. [Google Scholar] [CrossRef]
- Lopes, C.A.I.; Veronese, N.; De Melo Borges, S.; Ricci, N.A. Frailty as a predictor of adverse outcomes in hospitalized older adults: A systematic review and meta-analysis. Ageing Res. Rev. 2019, 56, 100960. [Google Scholar] [CrossRef]
- Sarikaya, D.; Halil, M.; Kuyumcu, M.E.; Kilic, M.K.; Yesil, Y.; Kara, O.; Ozturk, S.; Gungor, E.; Karabulut, E.; Yavuz, B.B.; et al. Mini nutritional assessment test long and short form are valid screening tools in Turkish older adults. Arch. Gerontol. Geriatr. 2015, 61, 56–60. [Google Scholar] [CrossRef]
- Bolayir, B.; Arik, G.; Yeşil, Y.; Kuyumcu, M.E.; Varan, H.D.; Kara, Ö.; Güngör, A.E.; Yavuz, B.B.; Cankurtaran, M.; Halil, M.G. Validation of nutritional risk screening-2002 in a hospitalized adult population. Nutr. Clin. Pract. 2019, 34, 297–303. [Google Scholar] [CrossRef]
- Cederholm, T.; Jensen, G.; Correia, M.; Gonzalez, M.C.; Fukushima, R.; Higashiguchi, T.; Baptista, G.; Barazzoni, R.; Blaauw, R.; Coats, A.; et al. GLIM criteria for the diagnosis of malnutrition—A consensus report from the global clinical nutrition community. J. Cachexia Sarcopenia Muscle 2019, 10, 207–217. [Google Scholar] [CrossRef]
- Hymabaccus, B.A.; Dogrul, R.T.; Balcı, C.; Ozsurekci, C.; Caliskan, H.; Karabulut, E.; Halil, M.; Cankurtaran, M.; Dogu, B.B. An effective and practical tool to assess physical frailty in older adults: Turkish validation of the FRAIL Scale. Marmara Med. J. 2023, 36, 149–156. [Google Scholar] [CrossRef]
- Özsürekci, C.; Balcı, C.; Kızılarslanoğlu, M.C.; Çalışkan, H.; Doğrul, R.T.; Ayçiçek, G.Ş.; Sümer, F.; Karabulut, E.; Yavuz, B.B.; Cankurtaran, M.; et al. An important problem in an aging country: Identifying the frailty via 9 Point Clinical Frailty Scale. Acta Clin. Belg. 2020, 75, 200–204. [Google Scholar] [CrossRef]
- Balci, C.; Bolayir, B.; Eşme, M.; Arik, G.; Kuyumcu, M.E.; Yeşil, Y.; Varan, H.D.; Kara, Ö.; Güngör, A.E.; Doğu, B.B.; et al. Comparison of the efficacy of the global leadership initiative on malnutrition criteria, subjective global assessment, and nutrition risk screening 2002 in diagnosing malnutrition and predicting 5-year mortality in patients hospitalized for acute illnesses. JPEN J. Parenter. Enteral. Nutr. 2021, 45, 1172–1180. [Google Scholar] [CrossRef]
- Kaçmaz, H.Y.; Döner, A.; Kahraman, H.; Akin, S. Prevalence and factors associated with frailty in older hospitalized patients. Rev. Clin. Esp. 2023, 223, 67–76. [Google Scholar]
- Öztürk, Y.; Baş, A.O.; Güner, M.; Ceylan, S.; Koca, M.; Esme, M.; Balcı, C.; Doğu, B.B.; Cankurtaran, M.; Cankurtaran, M. Clinical Frailty Scale and body mass index as an independent predictor of 2-year mortality at hospitalized patients. Eur. J. Geriatr. Gerontol. 2024, 6, 26–30. [Google Scholar] [CrossRef]
- D’Almeida, C.A.; Peres, W.; De Pinho, N.; Martucci, R.B.; Rodrigues, V.D.; Ramalho, A. Prevalence of malnutrition in older hospitalized cancer patients: A multicenter and multiregional study. J. Nutr. Health Aging 2020, 24, 166–171. [Google Scholar] [CrossRef]
- Ouaijan, K.; Hwalla, N.; Kandala, N.B.; Mpinga, E.K. Prevalence of malnutrition in hospitalized patients in Lebanon using Nutrition Risk Screening (NRS-2002) and Global Leadership Initiative on Malnutrition (GLIM) criteria and its association with length of stay. Healthcare 2023, 11, 730. [Google Scholar] [CrossRef]
- Lima, J.; Brizola Dias, A.J.; Burgel, C.F.; Bernardes, S.; Gonzalez, M.C.; Silva, F.M. Complementarity of nutritional screening tools to GLIM criteria on malnutrition diagnosis in hospitalised patients: A secondary analysis of a longitudinal study. Clin. Nutr. 2022, 41, 2325–2332. [Google Scholar] [CrossRef]
- Balcı, C.; Tufan, G.; Özdemir, N.; Aksoy, S.; Öksüzoğlu, Ö.B.; Zengin, N.; Kars, A.; Halil, M. GLIM criteria as a valid tool for nutrition assessment and mortality prediction in treatment-naive patients with cancer. Nutr. Clin. Pract. 2023, 38, 798–806. [Google Scholar] [CrossRef]
- Zhang, X.Y.; Zhang, X.L.; Zhu, X.Y.; Tao, J.; Zhang, Z.; Zhang, Y.; Wang, Y.Y.; Ke, Y.Y.; Ren, C.X.; Xu, J.; et al. Low calf circumference predicts nutritional risks in hospitalized patients aged more than 80 years. Biomed. Environ. Sci. 2019, 32, 571–577. [Google Scholar]
- Teixeira, B.H.; Siqueira, J.M.; Soares, J.D.P.; Faria, I.A.; Pimentel, G.D. Low agreement between GLIM criteria using the handgrip strength and NRS2002 in cancer in patients. Nutrire 2023, 48, 15. [Google Scholar] [CrossRef]
- Contreras-Bolívar, V.; Sánchez-Torralvo, F.J.; Ruiz-Vico, M.; González-Almendros, I.; Barrios, M.; Padín, S.; Alba, E.; Olveira, G. GLIM criteria using hand grip strength adequately predict six-month mortality in cancer inpatients. Nutrients 2019, 11, 2043. [Google Scholar] [CrossRef]
- Han, S.J.; Jung, H.-W.; Lee, J.H.; Lim, J.; Moon, S.D.; Yoon, S.-W.; Moon, H.; Lee, S.-Y.; Kim, H.; Lee, S.-R.; et al. Clinical Frailty Scale, K-FRAIL questionnaire, and clinical outcomes in an acute hospitalist unit in Korea. Korean J. Intern. Med. 2021, 36, 1233–1241. [Google Scholar] [CrossRef]
- Yin, L.; Lin, X.; Li, N.; Zhang, M.; He, X.; Liu, J.; Kang, J.; Chen, X.; Wang, C.; Wang, X.; et al. Evaluation of the global leadership initiative on malnutrition criteria using different muscle mass indices for diagnosing malnutrition and predicting survival in lung cancer patients. JPEN J. Parenter. Enter. Nutr. 2021, 45, 607–617. [Google Scholar] [CrossRef]
- Rosato, E.; Gigante, A.; Gasperini, M.L.; Proietti, L.; Muscaritoli, M. Assessing malnutrition in systemic sclerosis with global leadership initiative on malnutrition and European society of clinical nutrition and metabolism criteria. JPEN J. Parenter. Enter. Nutr. 2021, 45, 618–624. [Google Scholar] [CrossRef]

| Parameters | Frequency (%), n = 134 |
|---|---|
| Age, mean ± SD (range), years | 67.2 ± 10,4 |
| ≥65 years | 74 (55.2) |
| Sex, Male | 75 (56) |
| Comorbidity (any) | 123 (91.8) |
| Hypertension | 82 (61.2) |
| Diabetes Mellitus | 47 (35.1) |
| Malignancy | 43 (32.1) |
| Coronary artery disease | 43 (32.1) |
| Modified Charlson Index, median (min–max) | 5 (2–10) |
| Low (≤3) | 26 (19.4) |
| Middle (4–5) | 47 (35.1) |
| High (≥6) | 61 (45.5) |
| Parameters | Frequency (%), n = 134 |
|---|---|
| Body Mass Index (BMI) mean ± SD, kg/m2 | 26.6 ± 5.1 |
| Low BMI | 13 (9.7) |
| Normal BMI | 121 (90.3) |
| Calf circumference, mean ± SD, cm | 32.6 ± 3.9 |
| Nutrional Support, n (%) | 8 (6) |
| Oral Nutrional Supplement (ONS) | 6 (4.5) |
| Percutan Endoscopic Gastrostomia (PEG) | 2 (1.5) |
| MNA-SF, median (min–max) | 10 (3–14) |
| Normal | 21 (15.7) |
| Risk | 68 (50.7) |
| Malnutrition | 45 (33.6) |
| NRS-2002, n (%) | |
| <3 score | 75 (56) |
| ≥3 score | 59 (44) |
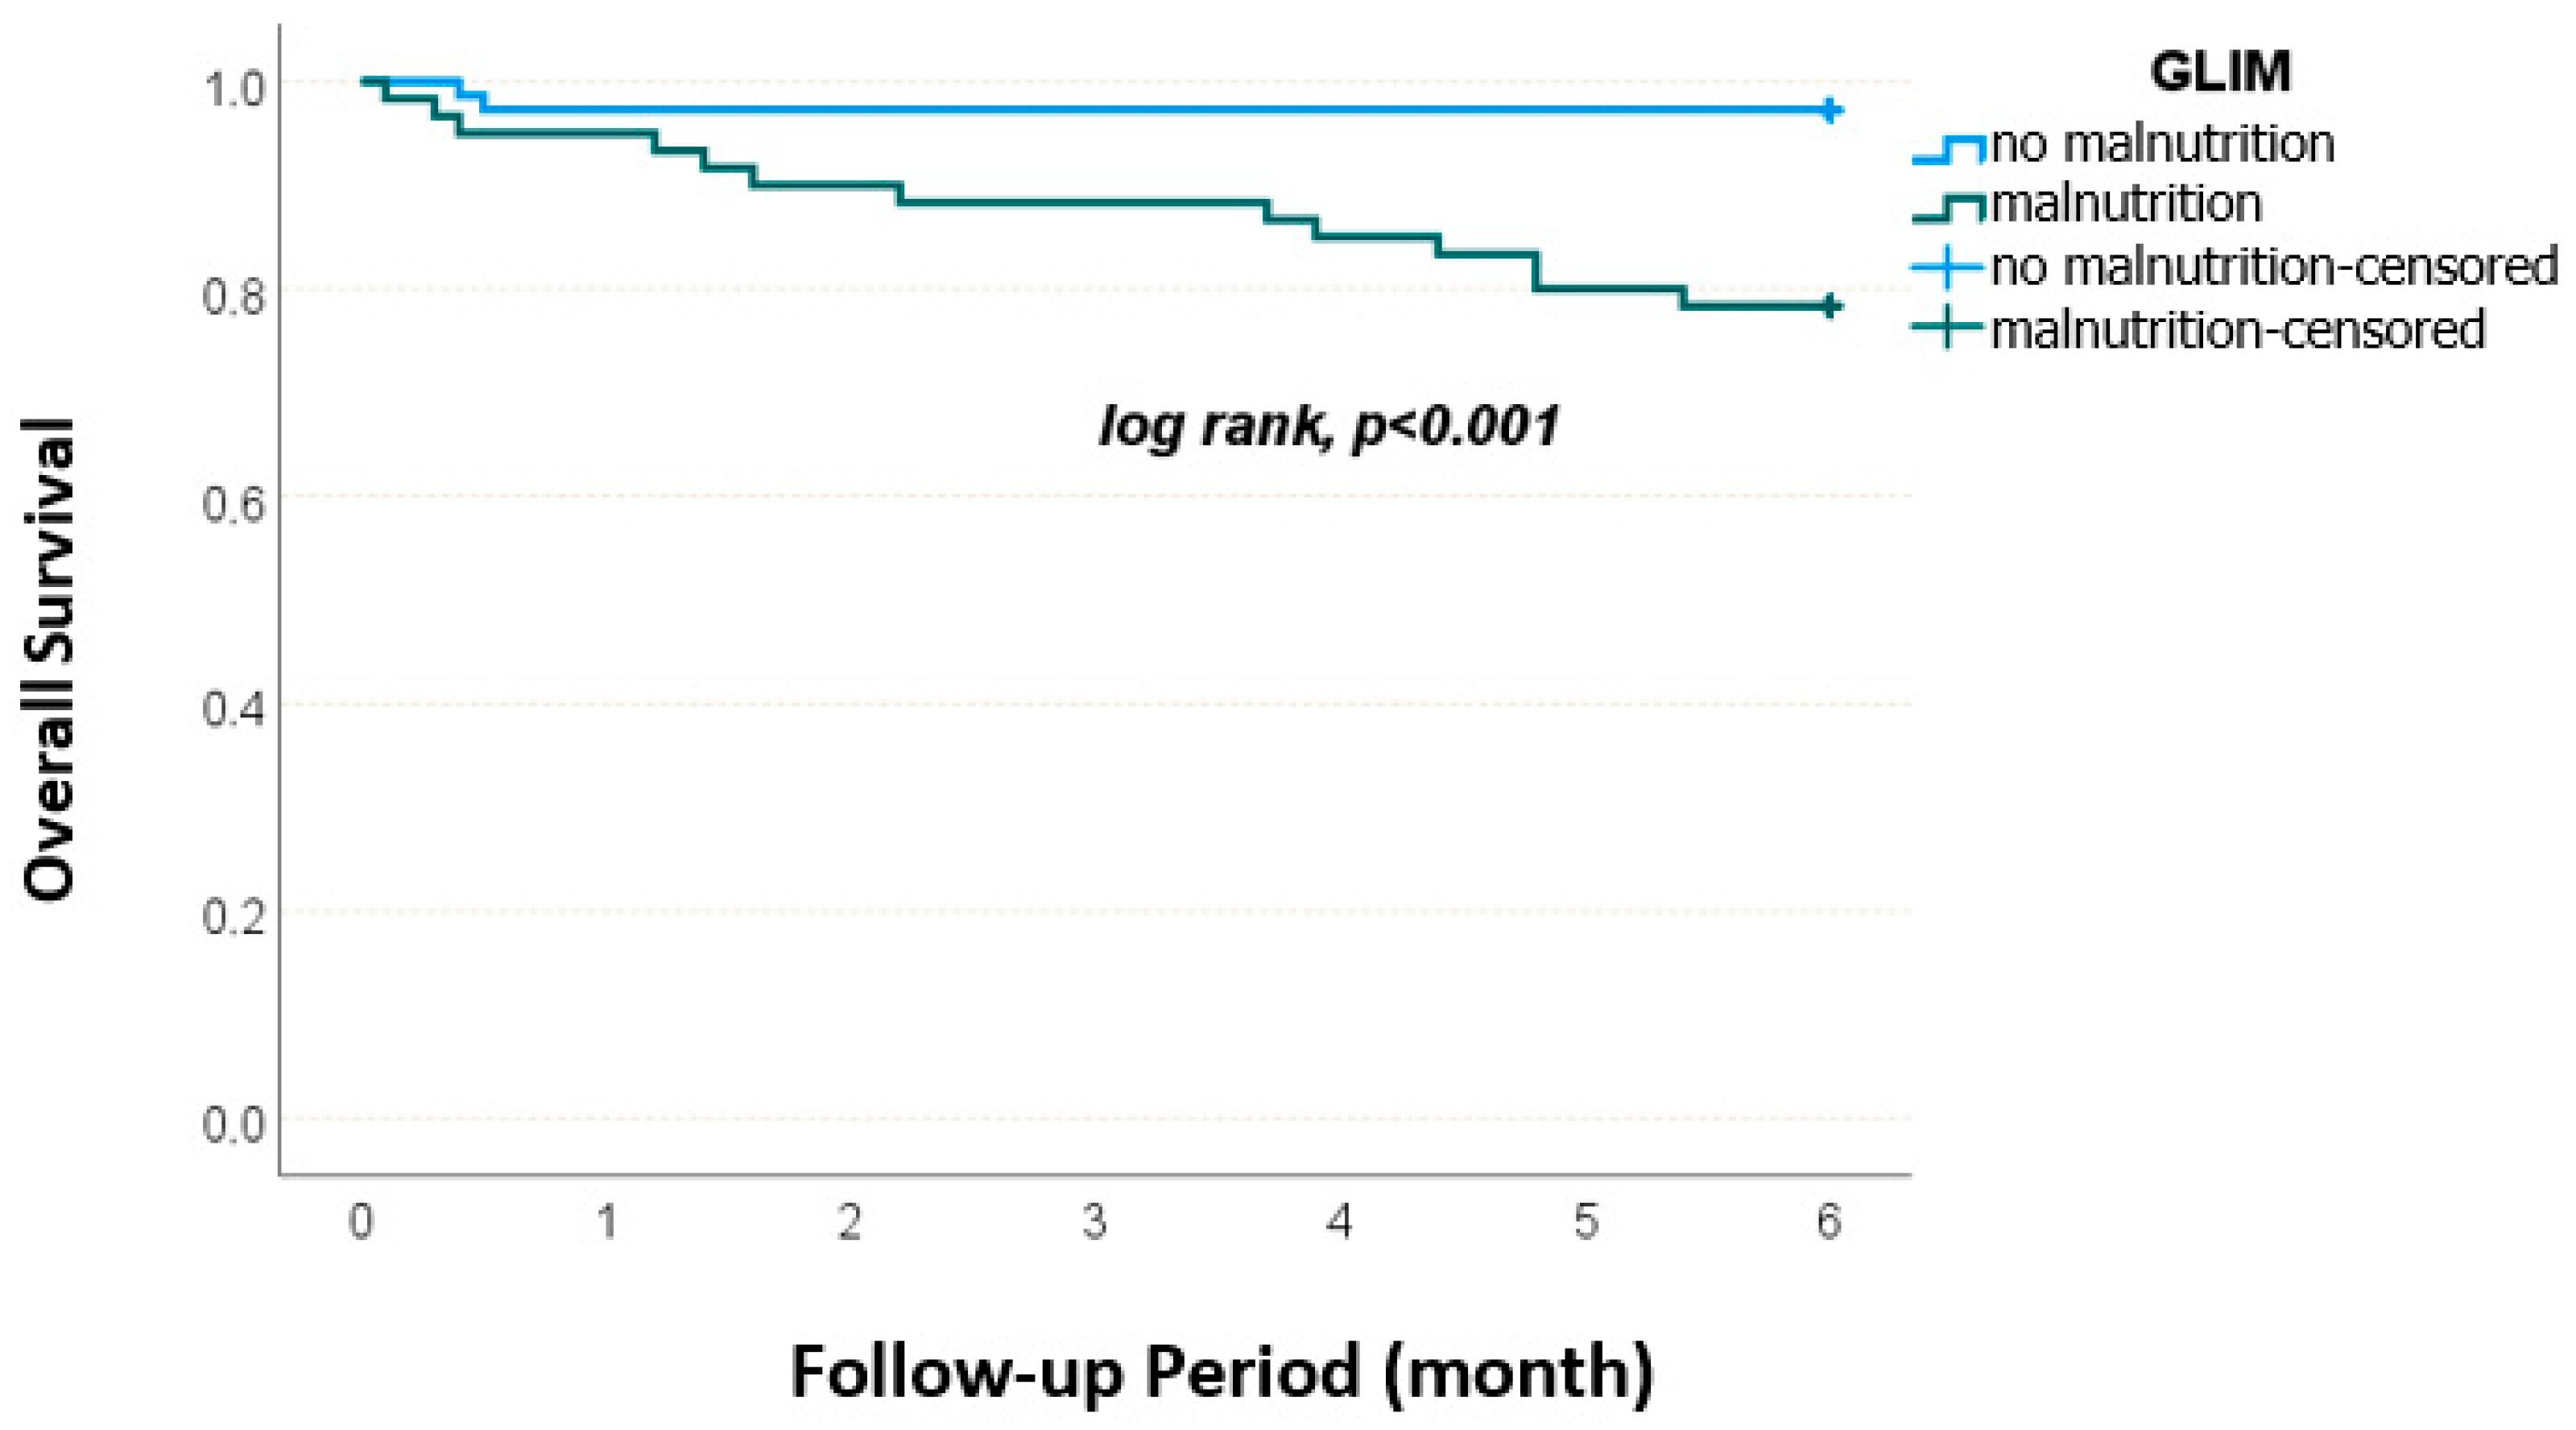
| GLIM, n (%) | |
| No Malnutrition | 74 (55.2) |
| Malnutrition | 60 (44.8) |
| Stage 1 | 40 (29.9) |
| Stage 2 | 20 (14.9) |
| FRAIL Scale, median (min–max) | 3 (0–5) |
| 0–2 score | 62 (46.3) |
| 3–5 score | 72 (53.7) |
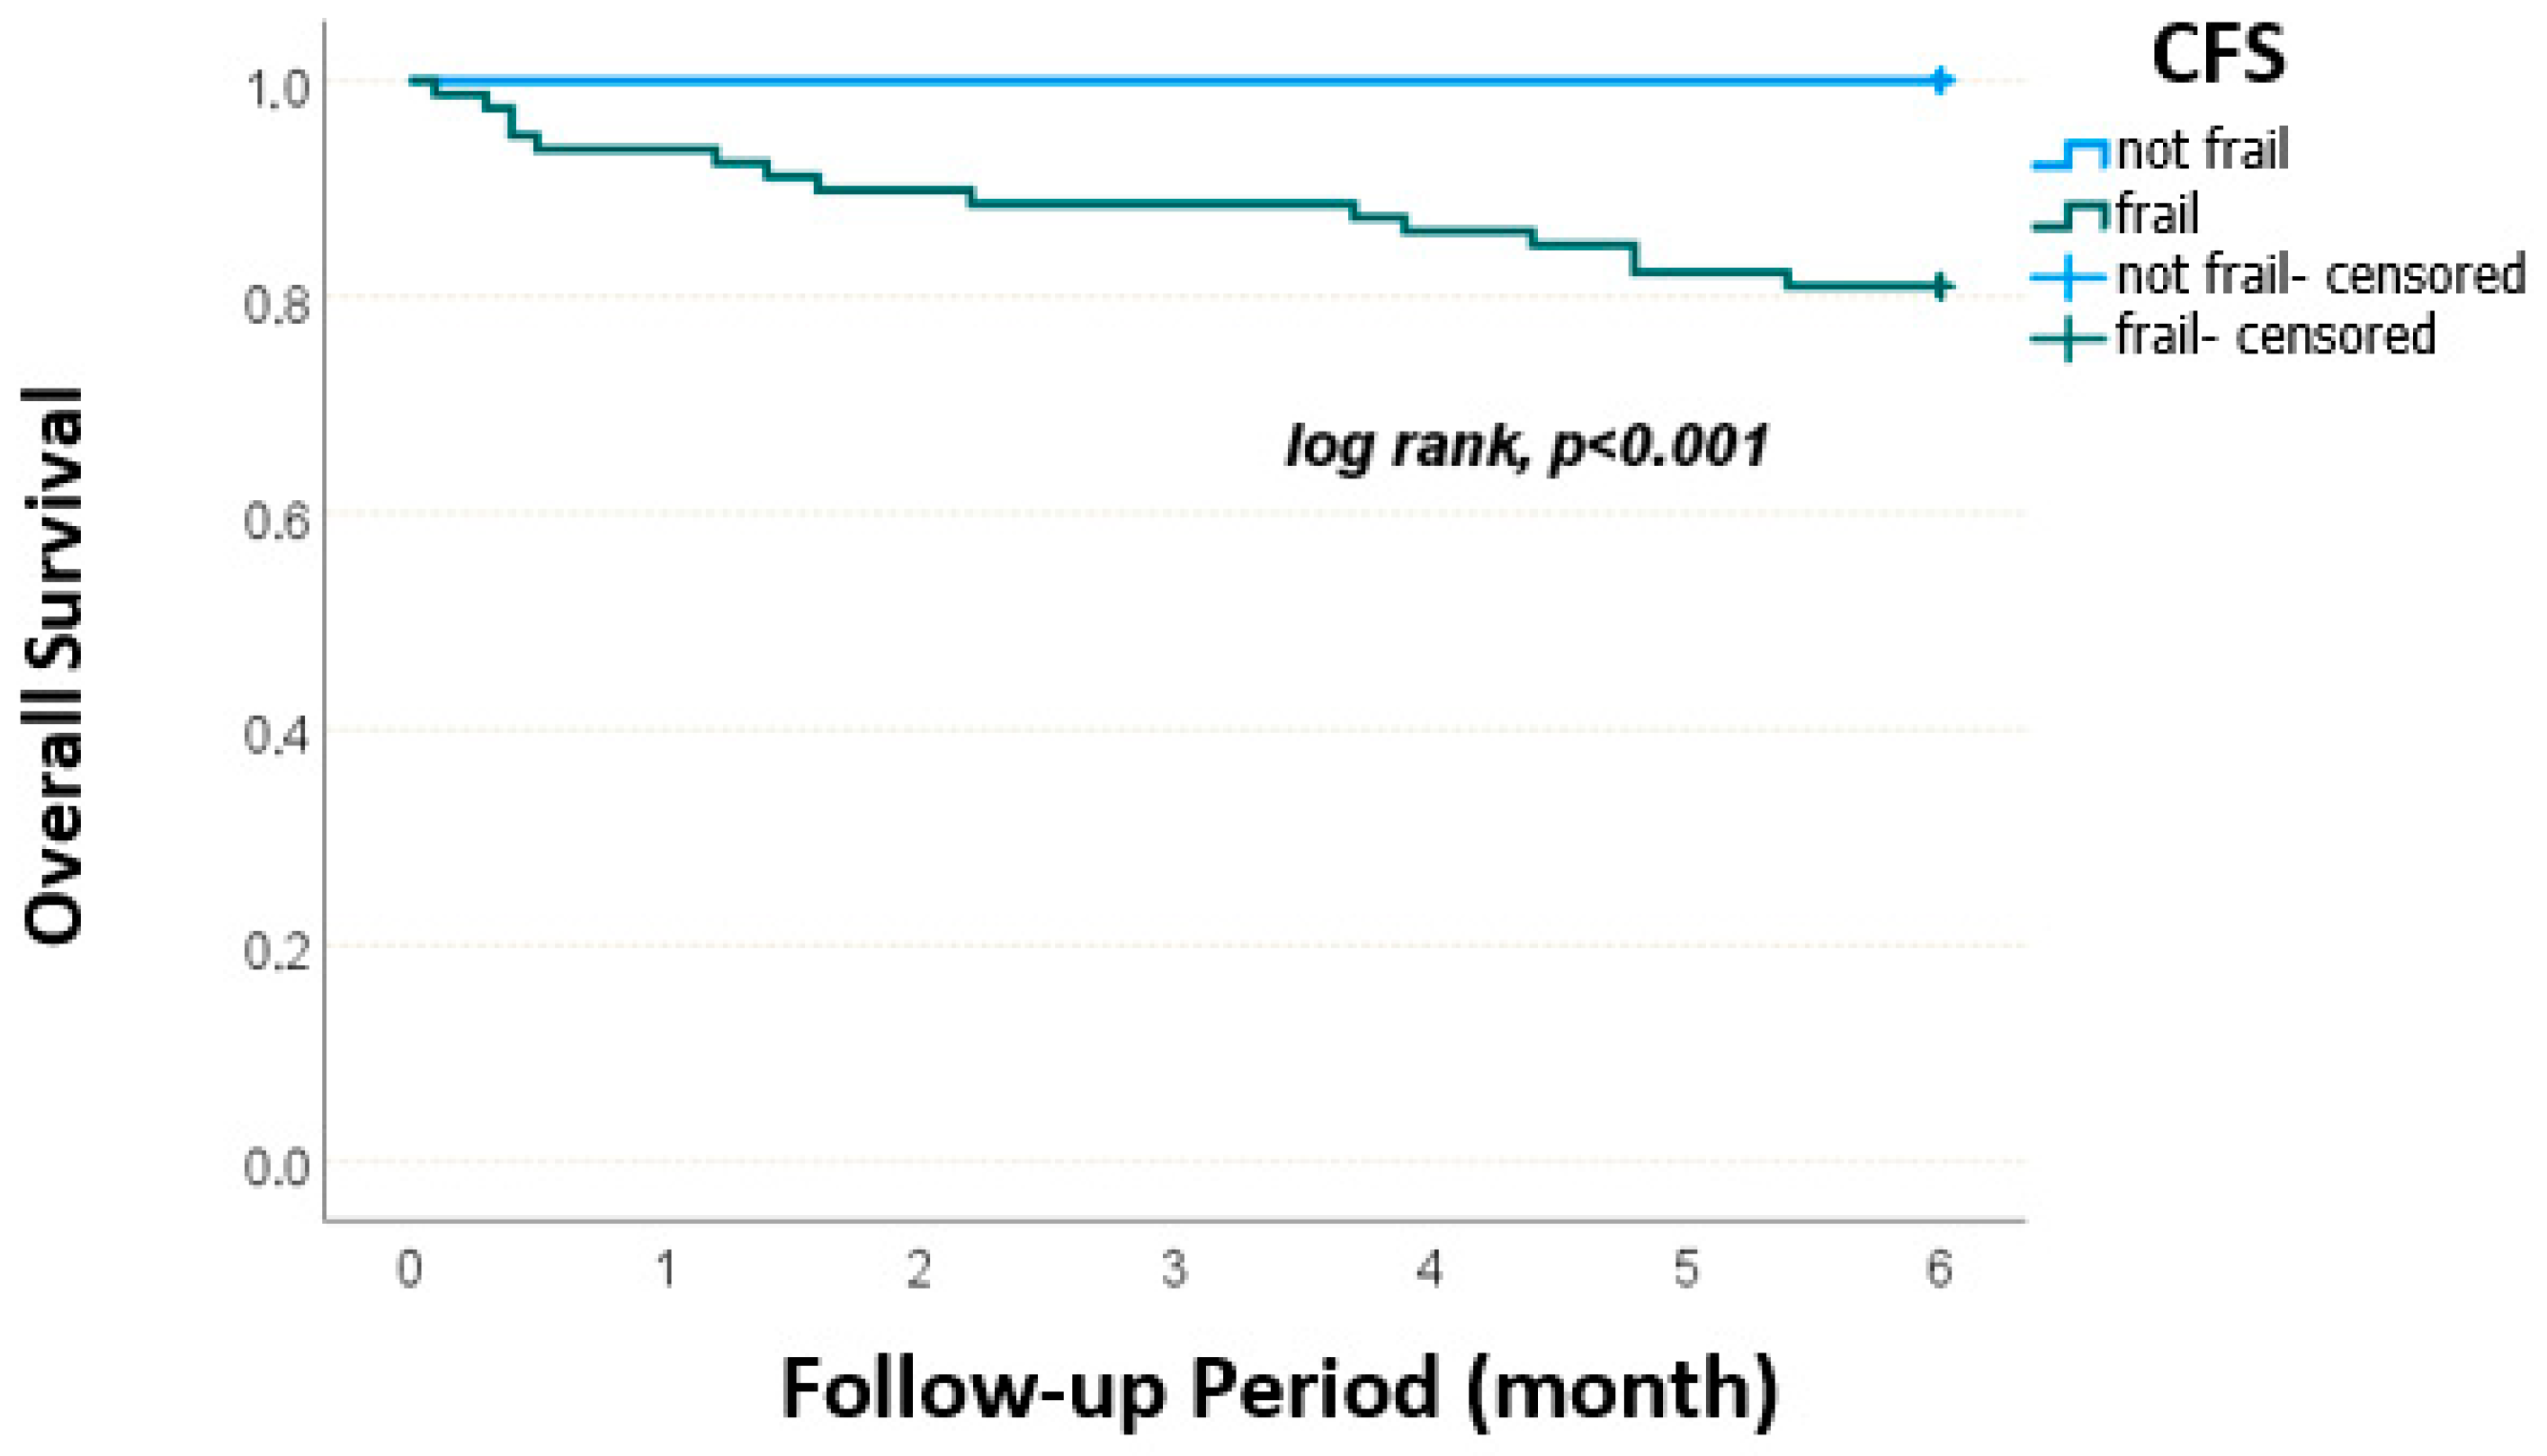
| Clinical Frality Scale (CFS), median (min–max) | 4 (2–7) |
| Robust | 55 (41) |
| Frail | 79 (59) |
| History of Falls | 33 (24.6) |
| Number of Falls in Last Year, median (min–max) | 0 (0–6) |
| History of Fracture | 13 (9.7) |
| Number of Fractures in Last Year, median (min–max) | 0 (0–1) |
| Hand-Grip Strength, mean ± SD | 25.8 ± 10.6 |
| Low Hand-Grip Strength | 88 (65.7) |
| Parameters | Length of Stay, n (%) | p Value & | ||
|---|---|---|---|---|
| ≤10 Days, n = 66 | >10 Days, n = 68 | |||
| C-reactive protein (CRP), mg/L | 0.9 (0.1–28) | 1.25 (0.1–42) | 0.044 | |
| BMI, mean ± SD, kg/m2 | 26.8 ± 4.7 | 26.5 ± 5.4 | 0.786 | |
| Calf Circumference, mean ± SD, cm | 32.9 ± 4 | 32.2 ± 3.9 | 0.319 | |
| Nutritional Support, n (%) | No | 65 (98.5) | 61 (89.7) | 0.062 |
| Yes (ONS/PEG) | 1 (1.5) | 7 (10.3) | ||
| MNA-SF, median (min–max) | 50–94 age | 10 (4–14) | 9 (3–13) | 0.004 |
| <65 age | 11 (4–12) | 9 (3–12) | 0.062 | |
| ≥65 age | 10 (5–14) | 7.5 (3–13) | 0.023 | |
| MNA-SF, n (%) | Normal | 14 (21.2) | 7 (10.3) | 0.043 |
| Risk | 36 (54.6) | 32 (47.1) | ||
| Malnutrition | 16 (24.2) | 29 (42.6) | ||
| NRS-2002, n (%) | <3 score | 44 (66.7) | 31 (45.6) | 0.014 |
| ≥3 score | 22 (33.3) | 37 (54.4) | ||
| GLIM, n (%) | No malnutrition | 43 (65.2) | 31 (45.6) | 0.023 |
| Malnutrition | 23 (34.8) | 37 (54.4) | ||
| Stage 1 | 17 (73.9) | 23 (62.2) | 0.348 | |
| Stage 2 | 6 (26.1) | 14 (37.8) | ||
| FRAIL Scale, n (%) | 0–2 score | 34 (51.5) | 28 (41.2) | 0.230 |
| 3–5 score | 32 (48.5) | 40 (58.8) | ||
| CFS, median (min–max) | 50–94 age | 4 (2–7) | 5 (3–7) | 0.007 |
| <65 age | 3 (2–6) | 3.5 (3–7) | 0.168 | |
| ≥65 age | 4 (3–7) | 5.5 (3–7) | 0.005 | |
| CFS, n (%) | Robust | 32 (48.5) | 23 (33.8) | 0.085 |
| Frail | 34 (51.5) | 45 (66.2) | ||
| History of Fall, n (%) | 15 (22.7) | 18 (26.5) | 0.615 | |
| History of Fracture, n (%) | 8 (12.1) | 5 (7.4) | 0.351 | |
| Low Hand-Grip Strength, n (%) | 39 (59.1) | 49 (72.1) | 0.114 | |
| Parameters | Rehospitalization in 3 Months | Rehospitalization in 6 Months | |||||
|---|---|---|---|---|---|---|---|
| Yes, n = 70 | No, n = 64 | p Value & | Yes, n = 80 | No, n = 54 | p Value & | ||
| Male | 43 (61.4) | 32 (50) | 0.183 | 51 (63.7) | 24 (44.4) | 0.027 | |
| ≥65 age | 45 (64.3) | 29 (45.3) | 0.027 | 50 (62.5) | 24 (44.4) | 0.039 | |
| Lymphocyte count, x103/mcl | 1.2 | 1.6 | <0.001 | 1.2 | 1.6 | <0.001 | |
| (0.1–34) | (0.1–25) | (0.1–34) | (0.1–4.5) | ||||
| Total protein, mean ± SS, g/dL | 6.23 ± 0.78 | 6.54 ± 0.9 | 0.033 | 6.3 ± 0.9 | 6.5 ± 0.8 | 0.129 | |
| Albumin, mean ± SS, g/dL | 3.3 ± 0.64 | 3.47 ± 0.55 | 0.115 | 3.2 ± 0.6 | 3.5 ± 0.5 | 0.007 | |
| Calf Circumference, mean ± SD, cm | 31.3 ± 3.7 | 33.9 ± 3.8 | <0.001 | 31.5 ± 3.7 | 34.1 ± 3.9 | <0.001 | |
| MNA-SF, median (min–max) | 50–94 age | 7.5 (3–13) | 10.5 (4–14) | <0.001 | 8 (3–13) | 11 (4–14) | <0.001 |
| <65 age | 8 (3–12) | 11 (4–12) | 0.008 | 9 (3–12) | 11 (4–12) | 0.014 | |
| ≥65 age | 7 (3–13) | 10 (6–14) | 0.010 | 7.5 (3–13) | 10 (6–14) | 0.003 | |
| MNA-SF, n (%) | Normal | 10 (14.3) | 11 (17.2) | <0.001 | 11 (13.8) | 10 (18.5) | <0.001 |
| Risk | 25 (35.7) | 43 (67.2) | 31 (38.8) | 37 (68.5) | |||
| Malnutrition | 35 (50) | 10 (15.6) | 38 (47.5) | 7 (13) | |||
| NRS-2002, n (%) | <3 score | 26 (37.1) | 49 (76.6) | <0.001 | 33 (41.3) | 47 (58.8) | <0.001 |
| ≥3 score | 44 (62.9) | 15 (23.4) | 42 (77.8) | 12 (22.2) | |||
| GLIM, n (%) | No malnutrition | 25 (35.7) | 49 (76.6) | <0.001 | 31 (38.8) | 43 (79.6) | <0.001 |
| Malnutrition | 45 (64.3) | 15 (23.4) | 49 (61.3) | 11 (20.4) | |||
| Stage 1 | 27 (60) | 13 (86.7) | 0.058 | 31 (63.3) | 9 (81.8) | 0.307 | |
| Stage 2 | 18 (40) | 2 (13.3) | 18 (36.7) | 2 (18.2) | |||
| FRAIL scale n (%) | 0–2 score | 26 (37.1) | 36 (56.3) | 0.027 | 32 (40) | 30 (55.6) | 0.076 |
| 3–5 score | 44 (62.9) | 28 (43.8) | 48 (60) | 24 (44.4) | |||
| CFS, median (min–max) | 50–94 age | 5 (3–7) | 3 (2–7) | 0.005 | 5 (3–7) | 3 (2–7) | 0.038 |
| <65 age | 5 (3–7) | 3 (2–6) | 0.042 | 4.5 (3–7) | 3 (2–6) | 0.067 | |
| ≥65 age | 5 (3–7) | 4 (3–7) | 0.169 | 5 (3–7) | 4.5 (3–7) | 0.549 | |
| CFS, n (%) | Robust | 21 (30) | 34 (53.1) | 0.007 | 27 (33.8) | 28 (51.9) | 0.037 |
| Frail | 49 (70) | 30 (46.9) | 53 (66.3) | 26 (48.1) | |||
| Low Hand-Grip Strength, n (%) | 54 (77.1) | 34 (53.1) | 0.003 | 60 (75) | 28 (51.9) | 0.006 | |
| Modified Charlson Index, n (%) | Low (≤3) | 10 (14.3) | 16 (25) | 0.082 | 10 (12.5) | 16 (29.6) | 0.010 |
| Middle (4–5) | 22 (31.4) | 25 (39.1) | 26 (32.5) | 21 (38.9) | |||
| High (≥6) | 38 (54.3) | 23 (35.9) | 44 (55) | 17 (31.5) | |||
| Parameters | Rehospitalization in 3 Months | Rehospitalization in 6 Months | ||
|---|---|---|---|---|
| OR (95% CI) | p | OR (95% CI) | p | |
| Age | 1.032 (0.992–1.075) | 0.120 | 1.022 (0.980–1.065) | 0.320 |
| Male | 2.418 (1.076–5.434) | 0.033 | 3.527 (1.481–8.399) | 0.004 |
| Modified Charlson Index | 1.061 (0.862–1.308) | 0.575 | 1.199 (0.958–1.501) | 0.113 |
| MNA-SF score | 0.717 (0.604–0.850) | <0.001 | 0.692 (0.573–0.835) | <0.001 |
| Age | 1.027 (0.989–1.067) | 0.164 | 1.015 (0.975–1.056) | 0.465 |
| Male | 1.776 (0.835–3.778) | 0.136 | 2.500 (1.131–5.528) | 0.024 |
| Modified Charlson Index | 1.143 (0.940–1.389) | 0.180 | 1.294 (1.039–1.611) | 0.021 |
| MNA-SF ≤11 | 1.489 (0.552–4.017) | 0.432 | 2.017 (0.713–5.707) | 0.186 |
| Age | 1.033 (0.993–1.075) | 0.104 | 1.021 (0.980–1.064) | 0.316 |
| Male | 2.103 (0.966–4.581) | 0.061 | 2.936 (1.290–6.685) | 0.010 |
| Modified Charlson Index | 1.052 (0.854–1.295) | 0.634 | 1.193 (0.951–1.497) | 0.127 |
| MNA-SF ≤9 | 3.645 (1.686–7.882) | 0.001 | 4.025 (1.767–9.169) | <0.001 |
| Age | 1.007 (0.967–1.049) | 0.723 | 0.997 (0.955–1.040) | 0.878 |
| Male | 2.073 (0.931–4.615) | 0.074 | 2.805 (1.225–6.425) | 0.015 |
| Modified Charlson Index | 1.089 (0.884–1.341) | 0.424 | 1.253 (0.994–1.578) | 0.056 |
| NRS-2002 ≥3 | 5.550 (2.432–12.66) | <0.001 | 5.362 (2.233–12.87) | <0.001 |
| Age | 1.027 (0.987–1.070) | 0.192 | 1.016 (0.975–1.060) | 0.448 |
| Male | 1.955 (0.882–4.335) | 0.099 | 2.742 (1.187–6.332) | 0.018 |
| Modified Charlson Index | 1.054 (0.853–1.304) | 0.626 | 1.206 (0.959–1.515) | 0.109 |
| GLIM malnutrition | 5.667 (2.565–12.52) | <0.001 | 6.071 (2.572–14.33) | <0.001 |
| Age | 1.023 (0.985–1.063) | 0.237 | 1.011 (0.972–1.053) | 0.580 |
| Male | 1.834 (0.868–3.877) | 0.112 | 2.300 (1.068–4.955) | 0.033 |
| Modified Charlson Index | 1.096 (0.898–1.339) | 0.368 | 1.255 (1.001–1.573) | 0.049 |
| FRAIL scale 3–5 score | 1.938 (0.910–4.128) | 0.086 | 1.563 (0.707–3.454) | 0.270 |
| Age | 1.018 (0.979–1.058) | 0.367 | 1.008 (0.968–1.049) | 0.702 |
| Male | 2.098 (0.965–4.562) | 0.061 | 2.510 (1.140–5.524) | 0.022 |
| Modified Charlson Index | 1.069 (0.873–1.310) | 0.520 | 1.232 (0.983–1.545) | 0.071 |
| CFS | 1.444 (1.063–1.962) | 0.019 | 1.284 (0.935–1.763) | 0.122 |
Disclaimer/Publisher’s Note: The statements, opinions and data contained in all publications are solely those of the individual author(s) and contributor(s) and not of MDPI and/or the editor(s). MDPI and/or the editor(s) disclaim responsibility for any injury to people or property resulting from any ideas, methods, instructions or products referred to in the content. |
© 2025 by the authors. Published by MDPI on behalf of the Lithuanian University of Health Sciences. Licensee MDPI, Basel, Switzerland. This article is an open access article distributed under the terms and conditions of the Creative Commons Attribution (CC BY) license (https://creativecommons.org/licenses/by/4.0/).
Share and Cite
Sadıç, A.; Şahiner, Z.; Eşme, M.; Balcı, C.; Doğu, B.B.; Cankurtaran, M.; Gülhan Halil, M. Malnutrition and Frailty as Independent Predictors of Adverse Outcomes in Hospitalized Older Adults: A Prospective Single Center Study. Medicina 2025, 61, 1354. https://doi.org/10.3390/medicina61081354
Sadıç A, Şahiner Z, Eşme M, Balcı C, Doğu BB, Cankurtaran M, Gülhan Halil M. Malnutrition and Frailty as Independent Predictors of Adverse Outcomes in Hospitalized Older Adults: A Prospective Single Center Study. Medicina. 2025; 61(8):1354. https://doi.org/10.3390/medicina61081354
Chicago/Turabian StyleSadıç, Abdurrahman, Zeynep Şahiner, Mert Eşme, Cafer Balcı, Burcu Balam Doğu, Mustafa Cankurtaran, and Meltem Gülhan Halil. 2025. "Malnutrition and Frailty as Independent Predictors of Adverse Outcomes in Hospitalized Older Adults: A Prospective Single Center Study" Medicina 61, no. 8: 1354. https://doi.org/10.3390/medicina61081354
APA StyleSadıç, A., Şahiner, Z., Eşme, M., Balcı, C., Doğu, B. B., Cankurtaran, M., & Gülhan Halil, M. (2025). Malnutrition and Frailty as Independent Predictors of Adverse Outcomes in Hospitalized Older Adults: A Prospective Single Center Study. Medicina, 61(8), 1354. https://doi.org/10.3390/medicina61081354